DEVELOPING ANTHOCYANIN-BASED PRODUCTS · Tünde VATAI, vpisna številka • rezultat lastnega...
151
University of Maribor Faculty of Chemistry and Chemical Engineering DOCTORAL DISSERTATION DEVELOPING ANTHOCYANIN-BASED PRODUCTS by TÜNDE VATAI M. Sc. in Chemical Engineering Menthor: Prof. Dr. Mojca Škerget (University of Maribor) Co-menthor: Prof. Dr. Paolo Alessi (University of Trieste) SUBCLEAN PROBIOMAT Maribor, February 2009
Transcript of DEVELOPING ANTHOCYANIN-BASED PRODUCTS · Tünde VATAI, vpisna številka • rezultat lastnega...

University of Maribor
Faculty of Chemistry and Chemical Engineering
DOCTORAL DISSERTATION
DEVELOPING ANTHOCYANIN-BASED PRODUCTS
by
TÜNDE VATAI
M. Sc. in Chemical Engineering
Menthor: Prof. Dr. Mojca Škerget (University of Maribor)
Co-menthor: Prof. Dr. Paolo Alessi (University of Trieste)
SUBCLEAN PROBIOMAT
Maribor, February 2009

UNIVERZA V MARIBORU
FAKULTETA ZA KEMIJO IN KEMIJSKO TEHNOLOGIJO
IZJAVA DOKTORSKEGA KANDIDATA
Podpisana Tünde VATAI, vpisna številka
• rezultat lastnega raziskovalnega dela,
95020485
izjavljam,
da je doktorska disertacija z naslovom
DEVELOPING ANTHOCYANIN-BASED PRODUCTS
• da so rezultati korektno navedeni in • da nisem kršil-a avtorskih pravic in intelektualne lastnine drugih.
Podpis doktorskege kandidatke:
Tünde VATAI


ACKNOWLEDGEMENTS
My thesis would not be complete without a word of thanks to those who made it
possible. A special thanks to Prof. Dr. Mojca Škerget, my supervisor and mentor, for
providing me invaluable scientific support, guidance and stimulations for my research. She
guided me patiently, supportively and helped me to carry through this work until the end. I
would like to thank not only the scientific support but as well for the private-life support.
Thank you for the attention, concerns and above all for the friendship!
A special word also to my co-supervisor: Prof. Dr. Paolo Alessi, who helped me
through the last year of the Ph. D., the most difficult year of the project. Thank you for the
guidance through the burocratic labyrinth and for not giving up, and for the scientific support
as well. I would like to express gratitude to Prof. Dr. Željko Knez, the „head” of the project for
the opportunity to do this project, for the support and guidance.
This research was financially supported through a European Community Marie Curie
Fellowship (Project MEST-CT-2004-007767). The European Commission DG Research–
Improving The Human Research Potential is gratefully acknowledged. I would like to thank
also to all the professors and students of the project „Suclean Probiomat” for the last 3 years.
Special thank to Prof. Maja Habulin for the coordination.
Special thank goes to Prof. Béla Simándi, who “introduced” me to the supercritical
fluids, guided me through the first steps of scientific research world and put his trust in me,
without who I would have never had the opportunity to participate in this project. Köszönöm
a tanácsokat és a támogatást!
There are so many people who contributed directly or indirectly to this thesis, until it
was successfully rounded up and I hope I am able to express here my dept gratitude to these
people as good as possible. During my work I had the opportunity to work at different
universities in different laboratories. It was a pleasure to participate in this project and get in
contact with so many precious people. Thank you all!
In the Laboratory for Separation Processes and Product Design (University of
Maribor) I have spent the most of the time. Thank you colleagues for the help, support,
advices and for the nice time we spent together. Najlepše hvala za vse!
The Bochum Ruhr University hosted me for 3 months. Thank you for all the support,
scientific discussions, and even more, friendship! The School of Chemistry in Nottingham
gave me an experience and opportunity to learn and explore new areas of my theme. Thank
you for the support in the lab and for the nice time in Nottingham!
The last year of the research I have spent in Trieste. The ups-and-downs of this year I would
not have resolved without the supportive atmosphere of DICAMP. Grazie!

5
A special thank for the Marie-Curie Fellows with whom I spent the project in Maribor
and Trieste. Thank you: Christian, Paul and Lucian; for not only being there as colleagues,
but as friends as well. I have learned many things from you, your support and advices helped
me to go through the difficulties of my research and your friendship helped me to survive the
most difficult days... Good luck for the future!
To all my friends: thank you for your support, even though the distance and different
circumstances sometimes made it difficult to keep in touch. You were always there for me
when I needed a good word or help. I am grateful for this project, because during these 3
years I have learnt a lot of other cultures (languages as well) and made many new friendships.
Without you all it would not have been the same! Köszönöm, Hvala, Danke, Grazie, Thank
you ….
Without my family I would not have been able to complete this thesis. Words cannot
express how grateful I am for all the support. You were always ready to help, supported me
through the difficulties, gave me the best advices, brought me up when I was down, not
letting me to give up. You were happy for my big and little successes as well, supported all my
decisions, honestly and unselfishly. Köszönöm.
Tünde VATAI

SUMMARY
Anthocyanins are group of polyphenols, responsible for the colours of yellow, orange,
red, pink and blue of most of the flowers and fruits. The major drawback of their use and
competitiveness compared to synthetic colorants is their colour instability, which may result
in degradation of colour during processing and storage. The overall goal of the Ph. D. work
was to develop a product, a natural colorant on anthocyanin base with adequate colour
stability, which can be an alternative replacement for synthetic colorants in food and drug
industry. Extraction of anthocyanins from grape marc, a by-product of the winery industry,
was investigated considering their potential use as natural colorants. The optimal
conventional extraction conditions were investigated with three different varieties of grape
marc native to Slovenia. For comparison, experiments with a fresh (non-by-product) material
–elder berry– were performed. The investigated operating parameters were: extraction
solvent, solvent concentration and temperature. Influence of the pH value of the extraction
media was investigated regarding the yield and degradation of anthocyanins. The stabilities
of the obtained extracts during storage were compared. Supercritical fluid extraction (SFE)
using carbon dioxide (CO2), was investigated for the pre-treatment of natural materials. Co-
pigments influence the stability and colour of the anthocyanins. Therefore, the obtained
extracts were analyzed on the content of some flavonoids.
The second major part of the Ph.D. work focused on product formulation and
stabilization of the anthocyanin extracts by using several high pressure techniques. Product
formulation with SCF techniques, namely Concentrated Powder Form (CPF™), Particles
from Gas Saturated Solution (PGSS™) and Supercritical Antisolvent Precipitation (SAS) were
carried out. Different anthocyanin-concentrates and carrier materials were tested. The
products were analyzed for their colour properties (Lightness, Hue angle and Chroma
values). The stability of the colour was monitored during prolonged storage.
Keywords: anthocyanins, natural colorants, extraction, SFE, carbon dioxide, product
formulation, PGSS™, CPF™, SAS, stability
UDK: 66.061-987:547.973 (043.3)

POVZETEK-RAZVOJ PRODUKTOV NA OSNOVI ANTOCIJANINOV
Antocianini so skupina polifenolov, ki so odgovorni za barvno raznolikost cvetov in
sadežev, od rumene, oranžne, rdeče, roza, do modre. V primerjavi s sintetičnimi barvili so
nestabilni, kar predstavlja glavni problem pri njihovi uporabi in se lahko pokaže kot
sprememba barve med procesiranjem in skladiščenjem. Glavni cilj doktorske disertacije je bil
razviti produkt, naravno barvilo na osnovi antocianinov, ki bo ustrezno stabilen in bo
predstavljal alternativo sintetičnim barvilom za uporabo v prehrambeni in farmacevtski
industriji.
Raziskovalno delo zajema študij ekstrakcije antocianinov iz grozdnih tropin, ki so
stranski produkt v proizvodnji vina in predstavljajo potencialni vir naravnih barvil. V
raziskavah smo uporabili tropine treh tradicionalnih sort rdečega grozdja, ki se pridelujejo v
Sloveniji. Za primerjavo so bili eksperimenti narejeni tudi z uporabo svežega materiala –
bezgovih jagod. Namen raziskav je bil določiti optimalne ekstrakcijske pogoje. Izvedla se je
študija vpliva naslednjih parametrov: vrste in koncentracije topila za ekstrakcijo ter
temperature. Študirali smo vpliv pH topila za ekstrakcijo na izkoristek in degradacijo
antocianinov. Opazovali smo stabilnost dobljenih ekstraktov med skladiščenjem. Raziskali
smo vpliv predobdelave naravnega materiala s superkritično ekstrakcijo s CO2. Poznano je,
da ko-pigmenti vplivajo na stabilnost in barvo antocianinov, zato smo v dobljenih ekstraktih
analizirali tudi vsebnost nekaterih flavonoidov.
Drugi sklop raziskav v okviru doktorske disertacije zajema študij stabilizacije in
formulacije antocianinov z uporabo visokotlačnih tehnologij s superkritičnimi fluidi (SCF).
Raziskali smo naslednje SCF tehnike za formulacijo produkta: CPF™ (Concentrated Powder
Form; Koncentrirana praškasta oblika), PGSS™ (Particles from Gas Saturated Solution; Delci
iz raztopin nasičenih s plinom), SAS (Supercritical Antisolvent Precipitation; Prekristalizacija
z antitopilom). V raziskavah smo uporabili različne materiale na osnovi antocianinov
(ekstrakte, sokove in koncentrate) ter različne nosilce, ki so uporabni v prehrambeni
industriji. Izvedli smo analize barvnih lastnosti in stabilnosti barve med skladiščenjem
dobljenih praškastih produktov.
Ključne besede: ekstrakcija, superkritični ogljikov dioksid, formulacija produktov, PGSS™,
CPF™, SAS, naravna barvila, antocianini, stabilnost
UDK: 66.061-987:547.973 (043.3)

CONTENTS
Acknowledgements .................................................................................................................... 4
Summary .................................................................................................................................... 6
Povzetek ..................................................................................................................................... 7
Contents ..................................................................................................................................... 8
Index of Figures ......................................................................................................................... 11
Index of Tables .......................................................................................................................... 13
Symbols and Abbreviations ....................................................................................................... 15
Introduction .............................................................................................................................. 17
The Aims of the Thesis ............................................................................................................. 20
State of Art .................................................................................................................................21
1. Extraction Techniques ..................................................................................................21 1.1. Conventional Solid-Liquid Extraction ........................................................................ 22 1.2. Supercritical Fluid Extraction ..................................................................................... 22
2. Anthocyanins ................................................................................................................ 27 2.1. Stability of Anthocyanins ............................................................................................. 28 2.2. Extraction of Anthocyanins from Different Plant Materials ..................................... 33 2.3. Purification of Anthocyanin Extracts .......................................................................... 34 2.4. Analysis of Anthocyanins ............................................................................................. 34
2.4.1. Qualitative and Quantitative Analysis ........................................................................ 34 2.4.2. Colour Evaluation......................................................................................................... 37
3. Stabilization of the Anthocyanins ................................................................................ 39
4. Product Formulation with Supercritical Fluids ........................................................... 42 4.1. Concentrated Powder Form (CPF™) .......................................................................... 44 4.2. Particles from Gas Saturated Solutions (PGSS™) ...................................................... 46 4.3. Supercritical Antisolvent Precipitation (SAS) ............................................................ 48
Experimental Work .................................................................................................................. 52
5. Extraction ..................................................................................................................... 52

9
5.1. Materials ....................................................................................................................... 52 5.1.1. Plant materials ............................................................................................................. 52 5.1.2. Chemicals ...................................................................................................................... 52
5.2. Conventional Single-step Extractions ......................................................................... 53 5.3. Supercritical Fluid Extraction (SFE) with Carbon dioxide ........................................ 54
5.3.1. SFE without Co-solvent ............................................................................................... 54 5.3.2. SFE with Ethanol Co-solvent ....................................................................................... 55
5.4. Analytical Methods ...................................................................................................... 56 5.4.1. Determination of the Total Phenolic Compounds ...................................................... 56 5.4.2. Determination of Total Monomeric Anthocyanins .................................................... 56 5.4.3. Determination of Quercetin ......................................................................................... 57 5.4.4. Determination of Flavanols and trans-Resveratrol ................................................... 57
5.5. Results and Discussion ................................................................................................ 59 5.5.1. Conventional Extraction of Total Phenols and Anthocyanins ................................... 59 5.5.2. Supercritical Fluid Extraction of Total Phenols and Anthocyanins .......................... 64 5.5.3. Extraction of Co-Pigments ........................................................................................... 66
6. Separation and Purification of Individual Compounds ............................................... 68 6.1. Materials and Reagents................................................................................................ 68 6.2. Extraction ..................................................................................................................... 68 6.3. Column Chromatography ............................................................................................ 68 6.4. Analytical Methods ...................................................................................................... 69
6.4.1. Thin Layer Chromatography (TLC) ............................................................................ 69 6.4.2. UV/Visible Spectrophotometry ................................................................................... 69 6.4.3. High Performance Liquid Chromatography (HPLC) ................................................. 69 6.4.4. Mass Spectrometry (MS) ............................................................................................. 69
6.5. Results and Discussion ................................................................................................ 70 6.5.1. Analysis of the Un-purified Extracts ........................................................................... 70 6.5.2. Purification by Column Chromatography ................................................................... 70 6.5.3. Analysis of “Fresh Sample”: Grape Skin Extract (GS) ............................................... 71
6.6. Conclusions................................................................................................................... 71
7. Formulation with CPF™ .............................................................................................. 72 7.1. Materials and Methods ................................................................................................ 72 7.2. Experimental Apparatus and Procedure..................................................................... 72 7.3. Results and Discussion ................................................................................................ 73
8. Formulations with PGSS™ ........................................................................................... 77 8.1. Materials and Methods ................................................................................................ 77 8.2. Experimental Procedure and Apparatus..................................................................... 77
8.2.1. Laboratory Scale Experiments .................................................................................... 77 8.2.2. Pilot Scale Experiments ............................................................................................... 78
8.3. Results and Discussion ............................................................................................... 80

10
8.3.1. Elder Berry (EB) with Palm Fat .................................................................................. 80 8.3.2. Grape (NG) and Grape Marc (GM) extracts with Palm Fat ....................................... 83
9. Formulation with SAS .................................................................................................. 88 9.1. View cell experiments ................................................................................................. 88
9.1.1. Apparatus and Experimental Procedure.................................................................... 88 9.1.2. Results and Discussion ................................................................................................ 89
9.2. Supercritical Antisolvent Precipitation (SAS) ............................................................ 91 9.2.1. Materials and Apparatus.............................................................................................. 91 9.2.2. Scanning Electron Microscopy (SEM) ........................................................................ 92 9.2.3. Differential Scanning Calorimetry (DSC) ................................................................... 93
9.3. Experimental Procedure .............................................................................................. 93 9.4. Results and Discussion ................................................................................................ 93
9.4.1. PVP Precipitation from Ethanolic Solution ................................................................ 93 9.4.2. PVP Precipitation from Ethanol-Blackcurrant Mixture ............................................ 96
10. Stability Testing ...................................................................................................... 100 10.1. Degradation Indices of the Anthocyanins................................................................. 100 10.2. Changes in Lightness (L), Hue (H) and Chroma (C) ................................................ 101 10.3. Results and Discussion .............................................................................................. 102
10.3.1. Degradation Indices of the Obtained Extracts ......................................................... 102 10.3.2. Changes in the L, H and C values of Non-formulated Products .............................. 104 10.3.3. Changes in the L, H and C values of the Formulated Products ............................... 106
Conclusions and Future Prospects .......................................................................................... 114
Appendix ................................................................................................................................. 115
References .............................................................................................................................. 138
Biography ................................................................................................................................ 147
Bibliography ........................................................................................................................... 149

INDEX OF FIGURES
Figure 1: Carbon dioxide pressure vs. temperature phase diagram (left) and Carbon dioxide density vs.
pressure phase diagram (right). .................................................................................................................. 23
Figure 2: Schematic flow diagram of a basic SFE apparatus. .................................................................... 25
Figure 3: Structure of anthocyanidins. For substituens R1 and R2 see Table 4. ....................................... 28
Figure 4: Structural transformation of anthocyanins: flavylium cation (AH+), carbinol (B), chalcone (C)
and quinonoidal base (A) [Wrolstad, 2004]. ............................................................................................. 30
Figure 5: Equilibrium distribution of flavylium cation (AH+), quinoidal base (A), carbinol (B) and
chalcone (C) for malvidin-3-glycoside as a function of pH value [Mazza and Brouillard, 1987]. ........... 31
Figure 6: UV-Visible spectra of anthocyanins in pH 1.0 and 4.5 buffers and the structures of the
flavylium cation (A) and hemiketal/carbinol form (B); R=H or glycosidic substituents [Wrolstad et al.,
2005]. ........................................................................................................................................................... 36
Figure 7: Reaction of anthocyanin pigments with bisulphite to form colourless anthocyanin-sulfonic
acid adducts. ................................................................................................................................................. 37
Figure 8: The CIE L*a*b and L C H interpretations of visual colour. ....................................................... 38
Figure 9: Basic structure of the pigments derived from the acetaldehyde-mediated condensation
between anthocyanins and catechins. C* is an asymmetric carbon, which makes possible the existence
of diastereomer pigments. ........................................................................................................................... 39
Figure 10: Extraction plant material: elder berry and grape marc. .......................................................... 52
Figure 11: Supercritical extraction apparatus. ............................................................................................ 55
Figure 12: Extraction of Total phenols from different varieties of grape marc at 60°C with water and
acetone-, ethyl-acetate and ethanol-water mixtures. Grape marc varieties: RF refošk, CB cabernet, ME
merlot............................................................................................................................................................60
Figure 13: Extraction of Total anthocyanins from different varieties of grape marc at 60°C with water
and acetone-, ethyl-acetate and ethanol-water mixtures. Grape marc varieties: RF refošk, CB cabernet,
ME merlot. ....................................................................................................................................................60
Figure 14: Extraction of Total phenols from elder berry with acetone- and ethanol-water mixtures at
60 °C. Comparison of frozen and lyophilised extraction materials. ......................................................... 61
Figure 15: Extraction of Total anthocyanins from elder berry with acetone- and ethanol-water mixtures
at 60 °C. Comparison of frozen and lyophilised extraction materials. ..................................................... 62

12
Figure 16: Effect of the change in the pH value of extraction solvent (100% water) by extraction of
Total phenols (left) and Total anthocyanins (right) from Refošk (RF) grape marc ( at 60 °C). The pH 2
adjusted with phosphoric acid (phos) and pH 6 with sodium-hydroxide (NaOH). ................................. 63
Figure 17: Comparison of the single-step (conventional extraction, CE) and two-step (1st step:
supercritical fluid extraction, SFE; 2nd step: CE) extraction of Refošk (RF) grape marc: total phenols
(mg GA/g dry material) and total anthocyanins (mg/g dry material). ..................................................... 64
Figure 19: Comparison of the single-step (conventional extraction, CE) and two-step (1st step:
supercritical fluid extraction, SFE; 2nd step: CE) extraction of Elder berry (ELD): total phenols
(mg GA/g dry material) and total anthocyanins (mg/g dry material). ..................................................... 65
Figure 20: Extraction of t-resveratrol from Refošk (RF) grape marc with different solvents (ethanol,
ethyl-acetate and acetone) with different concentrations (in mixture with water) at temperatures of
20 °C and 60 °C. ........................................................................................................................................... 67
Figure 21: HPLC spectra of the of malvidin chloride standard solution................................................... 71
Figure 22: Flow scheme of the CPF™ apparatus. ...................................................................................... 73
Figure 23: SEM images of the obtained CPF™ products. Left: porous particle, right: agglomeration of
some particles. .............................................................................................................................................. 75
Figure 24: SEM spectra of CPF™ product. Four spectrum taken at different points of a samples. ....... 75
Figure 25: Laboratory scale apparatus for PGSS™ - batch mode. ............................................................ 78
Figure 26: Pilot plant for PGSS™ - continuous mode. .............................................................................. 79
Figure 27: Palm fat micronized by PGSS™ technology ............................................................................ 80
Figure 28: PGSS™ powders: grape marc extract with palm fat. Anthocyanin concentration increasing
from left to right. .......................................................................................................................................... 84
Figure 29: High pressure “view cell” apparatus. ....................................................................................... 88
Figure 30: SAS apparatus ............................................................................................................................ 92
Figure 31: The DSC curves of the original PVP, the PVP which was dried in oven prior the analyses and
PVP precipitated from ethanol (EtOH) solution by SAS. .......................................................................... 96
Figure 32: Process capacity diagram of CO2-EtOH-water system, resulting from SAS precipitation of
PVP from ethanol-BC solution, plotted as the water uptake capacity vs. fraction of the modifier in the
extractant. Equilibrium data plotted with blue diamonds [Durling et al., 2007] and experimental data
as red squares. .............................................................................................................................................. 97

13
Figure 33: Ternary phase diagram at 35 °C and 10 MPa. Black circles: literature data [Gilbert and
Paulaitis, 1986]. Red circles: experimental results. ................................................................................... 98
Figure 34: SEM pictures of a SAS precipitate of PVP from ethanol-BC mixture (5/95 ratio wt).
Magnifications of 250X and 900X, left and right pictures, respectively. ................................................. 98
Figure 35: The DSC curves of the PVP precipitated from BC/EtOH solution mixtures of 5/95 and
10/90 (wt) ratios. ......................................................................................................................................... 99
Figure 36: Monitoring the stability of obtained extracts. Total anthocyanins (mg/g dry material) vs
time (days). ................................................................................................................................................. 102
Figure 37: Lightness, Hue angle and Chroma values of the Refošk (RF) extracts obtained with acidified
and non-acidified solvents stored at dark and at light for 15 weeks. ...................................................... 105
Figure 38: Lightness, Hue angle and Chroma values of the CPF™ products stored at dark and at light
for 21 weeks. Concentration of Refošk (RF) extract in liquid: 10 wt % and 30 wt %. Comparison of
acidified (with citric acid to pH 1) and non-acidified extracts formulated with silica carrier. .............. 107
Figure 39: Colorimetric values of the PGSS™ - elder berry with palm fat - products stored for 56 weeks
at light-ambient temperature and dark-refrigerator. See sample codes in Appendix (XXII). .............. 109
Figure 40: Colorimetric values of the PGSS™ - grape marc/grape extracts with palm fat - products
stored for 65 weeks at light-ambient temperature and dark-refrigerator. See sample codes in Appendix
(XXII)........................................................................................................................................................... 111
Figure 41: Colorimetric values of the PGSS™ - grape marc extracts with palm fat - products stored for
65 weeks at light-ambient temperature and dark-refrigerator. See sample codes in Appendix (XXII).
...................................................................................................................................................................... 113
INDEX OF TABLES
Table 1: Comparison of some physical properties of a gas, fluid and liquid. ............................................ 23
Table 2: Critical properties of various solvents [Reid et al., 1987]. ........................................................... 24
Table 3: Anthocyanin content of some common fruits and vegetables [Giusti and Wrolstad, 2000]. ... 27
Table 4: Some of the most common anthocyanidins in the nature, their maximum absorption
wavelength (λmax) and visible colour. Substituents R1 and R2 refer to Fig. 3. ........................................... 28
Table 5: Comparison of the CPF™ and conventional techniques [Petermann et al., 2001]. .................. 45

14
Table 6: Summary of the performed single-step extractions. ................................................................... 53
Table 7: Summary of the performed two-step extractions. ....................................................................... 55
Table 8: CPF™ experiments with silica (Sipernat 22LS): pure carrier and the powderous products.
Extract concentrations in the liquid and solvent conditions. .................................................................... 74
Table 9: Comparison of the initial colorimetric values of three CPF™ products (formulated with silica
carrier), and two commercial colorants. ..................................................................................................... 76
Table 10: Powderous products of PGSS™ micronization: Elder berry concentrate with palm fat. ........ 81
Table 11: Morphology and particle size of three different PGSS™ products: anthocyanin concentrates
with palm fat by 5, 20 and 42 wt % liquid/carrier ratios. .......................................................................... 82
Table 12: The CIE colour properties of some PGSS™ samples: Elder berry. ........................................... 83
Table 13: Morphology and particle size of four different PGSS™ products: concentrated wine with
palm fat of 5 and 29 wt % liquid/carrier ratios and grape marc extract with palm fat of 5 and 37 wt %
liquid/carrier ratios. GPR: Gas-to-product ratio (w/w). ........................................................................... 85
Table 14: Colorimetric values (L, H and C) of some PGSS™ formulated products. Liquid: grape marc
(GM) and commercial grape (NG) extract in 50 wt % ethanol-water or in water. ................................... 86
Table 15: Comparison of the visual colour of four PGSS™ samples: acidified solution samples of 39 and
49 wt% liquid/carrier ratios and non-acidified samples of 40 and 48 wt% liquid/carrier ratios. .......... 87
Table 16: Morphology and particle size observed by SEM of the original PVP and PVP precipitated by
SAS from ethanol solution with different conditions. ............................................................................... 94
Table 17: Tg of PVP K-25 measured by inverse gas chromatography (IGC) technique [Kikic et al., 2003]
....................................................................................................................................................................... 95
Table 18: Comparison of degradation indices (colour density, % polymeric colour, browning and
degradation index) in different grape marc extracts obtained with 50 % ethanol at 60 °C - with non-
acidified solvent (NA), with solvent pH value adjusted to 1 (A) and addition of natural antioxidant (X)
to the solvent -: initial values and values after 55 days storage (stored at -16 °C). ................................ 103

SYMBOLS AND ABBREVIATIONS
A Absorbance
A Acidified solvent
A Quinoidal form
A420nm Absorbance at 420 nm
A520nm Absorbance at 520 nm
A700nm Absorbance at 700 nm
AH+ Flavylium cation
aH+ Hydroxonium ion activity
Aλvis-max Absorbance at maximum
visible wavelength
B Carbinol (pseudo)base
BAW n-butanol/acetic acid/water
BC black currant
BI Browning Index
C Carbon atom
C Chalcone
C Chroma or saturation
CB Cabernet
CE Conventional extraction
CH3COONa Sodium acetate
CIE International Commission on
Illumination
CO2 Carbon dioxide
CPF™ Concentrated Powder Form
Cy-3-gly Cyanidin-3-glycoside
DF Dilution factor
DI Degradation Index
DSC Differential Scanning Calorimetry
ELD Elder berry
EtOH Ethanol
FD&C Food, Drug & Cosmetics
GA Gallic acid
GAS Gas Anti Solvent process
GM Grape marc
GPR Gas-to-product ratio
GS Grape skin extract
H Hue angle
H2PO4 Phosphoric acid
HCl Hydrochloric acid
HPLC High Performance Liquid
Chromatography
IGC Inverse Gas Chromatography
IR Infra-red
K2S2O5 Potassium metabisulphite
KA Proton transfer equilibrium constant
KCl Potassium chloride
KH Hydration constant
KT Ring-chain tautomeric constant
L Lightness
l path length
ME Merlot
mextract extract weight
MS Mass Spectrometry
MW Molecular weight
NA Non-acidified solvent
Na2CO3 Sodium carbonate
NaOH Sodium hydroxide
NG Nor-grape extract
NMR Nuclear Magnetic Resonance
O Oxigen atom
PEG Polyethyleneglycol
PGSS™ Particles From Gas Saturated Solutions
phos Phosphoric acid
PPO Polyphenoloxidases
PVP Polyvynilpirrolidone
RESS Rapid Expansion of Supercritical
Solutions
RF Refošk
SAS Supercritical Anti Solvent process
SC Supercritical
scCO2 Supercritical carbon dioxide
SCF(s) Supercritical Fluid(s)
SEM Scanning Electron Microscope
SFE Supercritical Fluid Extraction
Si Silicon atom
SO2 Sulphur dioxide

16
TA Total anthocyanins
Tg Glass transition temperature
TLC Thin Layer Chromatography
UV/VIS UV/Visible
V06 Pilot scale extract from 2006
V07 Pilot scale extract from 2007
X Solvent with natural antioxidant
ε Molar absorptivity
λEM Emission wavelength
λEX Excitation wavelength
λmax Maximum absorption wavelength
λvis-max Maximum visible absorption
wavelength

INTRODUCTION
Anthocyanins are natural pigments, which are responsible for the orange, red, blue,
violet colours of some fruits and flowers. Beside the attractive colour their positive health
effects are also significant [Kong et al., 2003]. The use of anthocyanin extracts as natural
colorants has been reviewed by several authors [Bridle and Timberlake, 1997; Francis, 1989;
Markakis, 1982; Mazza and Miniati, 1993]. The limitation in the use of anthocyanins as
natural food colorants is their colour instability. The major degradation factors of the
anthocyanins are the temperature, the presence of oxygen and light, co-pigmentation, metal
ions, enzymes, the pH value, etc. [Jackman et al., 1987]. Acylation, glycosylation and
condensation with different flavonoids improves the stability of the anthocyanins [Mazza and
Brouillard, 1987].
Recent researches have been focused on finding new plant sources of anthocyanins,
where they can be found in more stable form [Cevallos-Casals and Cisneros-Zevallos, 2004;
Giusti and Wrolstad, 2003; Malien-Aubert et al., 2001; Pazmińo-Durán et al., 2001].
Economically, the best potential sources of anthocyanins are those, which are by-
products in the manufacture or plant materials with high availability. The winery by-product,
grape marc (also known as grape pomace) provides a raw material, which is rich in
polyphenols identified also in grapes and wine. These phenols are mainly anthocyanins,
flavonols and phenolic acids [Amico et al., 2004; Monagas et al., 2006; Ruberto et al., 2007].
Several authors reported antiradical and antioxidant activity of the grape marc extracts,
suggesting the winery by-product for production of natural antioxidants. Regarding the
extraction of antioxidants, the influence of process and extraction parameters were
investigated [Lapornik et al., 2005; Spigno and De Faveri, 2007]; different grape cultivars
[Ruberto et al., 2007], components of grape marc [Pinelo et al., 2005] and vinification
methods [Gomez-Plaza et al., 2006] were also compared. Spigno & De Faveri (2007) gave a
short review on the extraction of grape marc, remarking the lack of systematic approaches to
optimise the extractions.
It was found that most of the above mentioned literature is focused mainly on the
extraction of polyphenols and antioxidants, while the anthocyanins are mentioned as
additional compounds [Gomez-Plaza et al., 2006; Lapornik et al., 2005; Malien-Aubert et al.,
2001; Negro et al., 2003; Ruberto et al., 2007]. The aim of the present work was to
investigate the extraction of anthocyanins from grape marc considering their potential use as
natural colorants. The optimal conventional extraction conditions were investigated with
three different varieties of grape marc native to Slovenia. For comparison, experiments were
performed with a fresh (non-by-product) material. Elder berry was chosen since it is rich in
anthocyanins and has a long history of use as food colorant and as traditional medicine, as

18
well. The investigated operating parameters were: extraction solvent, solvent concentration
and temperature. Further, according to literature [Mazza and Brouillard, 1987] at the pH
values below 2 the anthocyanins exist in the flavylium cation form, i.e. in most coloured form,
therefore different solvent pH values were also compared. The stabilities of the obtained
extracts during storage were compared. Furthermore, the stabilization of extracts, obtained
by the addition of a commercial natural antioxidant, was investigated.
It was observed before, that pre-treatment with non-polar solvents (e.g. hexane)
improves the extraction of polyphenols from grape [Gonzalez-Paramas et al., 2006; Pomar et
al., 2005; Ruberto et al., 2007; Spigno and De Faveri, 2007]. In the present work
supercritical fluid extraction (SFE) using carbon dioxide (CO2), was applied for the pre-
treatment of natural materials. SFE with CO2 is a particularly suitable isolation method for
natural materials [Reverchon and De Marco, 2006] and gives an alternative to replace the
non-polar organic solvents. Extractions with supercritical CO2 (scCO2) result in solvent-free
products and avoid deteriorating reactions, due to low process temperatures. The CO2 is
readily available, relatively cheap and accepted as a solvent in the food industry. Two-step
extraction, combining SFE and conventional extraction, was investigated in the present work.
During first extraction step scCO2 (with or without ethanol co-solvent) was applied to remove
the non-polar components from the extracting material. During the subsequent second-step,
conventional extraction of the residual material was performed at optimal operating
parameters, which were investigated in single-step extraction experiments.
Co-pigments influence the stability and colour of the anthocyanins. Weak complexes
are formed with tannins, flavonoids, proteins and polysaccharides [Gonzalez-Paramas et al.,
2006; Jackman and Smith, 1996]. Some of these compounds enhance the colour of
anthocyanins. The complexes also tend to be more stable during process and storage
[Escribano-Bailon et al., 2001]. Therefore, the obtained extracts were analyzed on the content
of some flavonoids. Flavonoids exhibit numerous biological and pharmacological effects,
including anti-oxidant, anti-carcinogenic, anti-inflammatory, cardio protective, bacteriostatic
effects etc. [Havsteen, 2002]. Among them catechins and quercetin, which is considered as
one of the key compounds, are known to posses high anti-oxidative and free radical
scavenging capacity. In addition, extraction of t-resveratrol, which is an interesting
compound due to its pharmacological activity [Gurbuz et al., 2007; Monagas et al., 2006; Sun
and Temelli, 2006] was investigated.
Formulation of product in powderous form (using carrier) is one of ways of
stabilization of anthocyanins [Jackman et al., 1987], which also facilitates their easier
incorporation into foods. However, the conventional technologies often use high
temperatures, high amount of organic solvents and long processing time, helping the
degradation of the anthocyanins. Hence, novel technologies, which also have lower

19
environmental impact, will have important role in the future food industry. Particle
formation using supercritical fluids (SCFs) is one of the new technologies, which has been
intensively researched and improved in the recent years [Jung and Perrut, 2001].
Applications for many fields have been developed and it is likely that these technologies will
gain their position in the industry [Weidner et al., 2003]. The interest in SCF (supercritical
fluid) product formulation for food industry has increased as well, due to its advantages
compared to conventional technologies [Brunner, 2005]. The overall goal of this work was to
develop an anthocyanin based natural colorant suitable for applications in food industry.
Product formulation with SCF techniques, namely Concentrated Powder Form (CPF™),
Particles from Gas Saturated Solutions (PGSS™) and Supercritical Antisolvent Precipitation
(SAS) were carried out. Different anthocyanin-concentrates and carrier materials were
tested. The products were analyzed for their colour properties (Lightness, Hue angle and
Chroma values). The stability of the colour was monitored during prolonged storage
(light/dark and ambient temperature/refrigerator).
The 3-years Ph. D. research work – in the frame of the Marie-Curie programme
(project “Suclean Probiomat”) – was carried out at different universities in different
laboratories. The extraction of the anthocyanins from different plant materials was
investigated in the first 1.5 years at the University of Maribor. The formulation with high
pressure technique Concentrated Powder Form using dense carbon dioxide for formulation
and stabilization of anthocyanin extracts was investigated at the Ruhr University of
Bochum. Extract of grape marc was sprayed on different carrier materials in order to
investigate the possible stabilization with CPF™. Another high-pressure technology –
Particles from Gas Saturated Solution – was applied for the formulation of the anthocyanin-
concentrates. The experiments were performed in laboratory (University of Maribor) and
pilot scale (Ruhr University of Bochum) as well. At the University of Trieste
supercritical antisolvent precipitation of anthocyanins was investigated. The precipitation
was achieved from water concentrate with PVP co-precipitate. The phase equilibrium of the
systems: anthocyanin-concentrate (BC) with carbon dioxide, BC-modifier-CO2, PVP-
modifier-CO2 and PVP-BC-modifier-CO2 were investigated in high pressure view cell prior to
the SAS experiments. The stability of the anthocyanin extracts and formulated products were
measured at the University of Maribor. Degradation indices (browning index,
degradation index, polymeric colour and colour density) were measured for different extract
samples. The formulated products were measured for their colour properties Lightness, Hue
Angle and Saturation and the results were compared to the non-formulated products. The
colour was measured using the method of CIEL (International Commission on Illumination,
Vienna), based on uniform colour spaces (CIELAB) which enables objective measurement
and characterization of colour properties. One part of the obtained formulated product was

20
stored in dark in refrigerator and the other part at light at room temperature. The stability of
the CPF™ powder was monitored during storage. The results were compared with the pure
extract (not CPF™ formulated) stored at same conditions. The experiments of separation and
purification of individual compounds of anthocyanins were performed at the University of
Nottingham. Different separation and purification methods were applied in order to obtain
the principal individual anthocyanins.
THE AIMS OF THE THESIS
The aim of the Ph. D. work was to optimize the extraction of the anthocyanin
pigments from the by-product grape marc. Beside the conventional technologies, novel
technologies, which have less environmental impact, were aimed to use. Since the
anthocyanin pigments are prone to degradation, methods which avoid the degradation were
selected. The formulation with supercritical fluids has never been studied for anthocyanins in
such form. The possible formulation was therefore aimed to investigate using diverse SCF
technologies, such as CPF™, PGSS™ and SAS. The overall goal of was to develop a product, a
natural colorant on anthocyanin base, with adequate colour stability, which can be an
alternative replacement for synthetic colorants in food and drug industry.

21
STATE OF ART
1. EXTRACTION TECHNIQUES
Extraction by definition is a method for separating the constituents of a mixture
utilizing preferential solubility of one or more components in a second phase [Fonyó and
Fábry, 1998]. The goal is to withdraw an active agent or a waste substance from a solid or
liquid mixture with a liquid solvent. The added solvent must be immiscible or only partially
miscible with the solid or the liquid. By intensive contact the active agent transfers from the
solid or liquid mixture (raffinate) into the solvent (extract) [Gamse, 2002]. The two phases
are then separated either by gravity or centrifugal forces. To obtain the active agent in pure
form and to recover the solvent, further separation processes are necessary (evaporation,
crystallization, liquid-liquid extraction, rectification or re-extraction) [Hunek, 1992].
Depending on the phases the extraction is classified into two types:
Solid – liquid extraction
Liquid – liquid extraction
The extraction is a widely used process; the main areas are metallurgical,
pharmaceutical, petroleum, vegetable oil and sugar industries. It is used for extracting active
compounds from plant materials, as well as for cleaning of waste water to separate solved
compounds.
The main requirements for the extraction solvents are the followings:
high selectivity (only the active agent has to be extracted),
high capacity (in order too minimize the amount of necessary solvent),
high difference in density (easier separation),
optimal surface tension,
low vapour pressure at operating temperature (to prevent loss of solvent during
extraction),
low viscosity (low pressure drop and good heat and mass transfer),
low miscibility (important for further regeneration of the solvent),
chemical and thermal stability,
adequate flame temperature (25 °C higher than operating temperature),
non corrosive, no/low toxicity,
low price and
easy recovery.

22
After obtaining the targeted compounds in pure form regeneration of the solvent is
necessary. In many cases the regeneration step is the most cost intensive part of the whole
process. The most common methods are rectification, evaporation, crystallisation and further
extraction.
1.1. CONVENTIONAL SOLID-LIQUID EXTRACTION
The principle of the solid-liquid extraction is that the soluble compounds of a solid
matter (active agent in an inert matrix) are extracted by a solvent. The extract is present in
the extraction material either as in solid or liquid form. It can be included in cells, as well as
fine dispersion in the solid matter like caffeine in coffee [Gamse, 2002]. For a successful and
economic process the followings should be considerated:
The extraction materials should be grinded, milled or similar, before the extraction,
in this way the extraction time (and cost) is reduced.
An extraction solvent with high selectivity is preferable.
The extraction temperature: higher temperatures ease the extraction; however with
heat-sensitive compounds careful optimization is necessary.
Counter current extraction plants are preferred, because of higher concentration of
the extract.
The separation of the solvent from solution extract as well as from extraction residual
has to be achieved economically.
A total solid-liquid extraction process includes: (1) the preparation of the extraction
material, (2) separation and recovery of the solvent from extract and (3) separation and
recovery of solvent from extraction residual.
1.2. SUPERCRITICAL FLUID EXTRACTION
By definition, a supercritical fluid is a substance above both its critical temperature
and pressure (Fig. 1-left). At the critical point, the densities of the equilibrium liquid phase
and the saturated vapour phases become equal, resulting in the formation of a single
supercritical phase. This can be observed in the density-pressure phase diagram for carbon
dioxide, as shown in Fig. 1 (right), where the critical point is located at 31.1 °C (304.1 K) and
7.38 MPa (73.8 bar). With increasing temperature, the liquid-vapour density gap decreases,
up to the critical temperature, at which the discontinuity disappears [Simándi and Sawinsky,
1996].

23
. Figure 1: Carbon dioxide pressure vs. temperature phase diagram (left) and Carbon dioxide
density vs. pressure phase diagram (right).
Supercritical fluids can be regarded as “hybrid solvents” with properties between
those of gases and liquids, i.e. a solvents with a low viscosity, high diffusion rates and no
surface tension. The density of a supercritical fluid is comparable to the density of liquids but
the viscosity of the fluid is like those of a gas and the diffusion coefficient is one to two orders
higher than of a liquid [Gamse, 2002]. Table 1 gives a comparison of some physically
properties of a liquid, gas and fluid.
Table 1: Comparison of some physical properties of a gas, fluid and liquid.
Density Diffusion coefficient Viscosity (kg/l) (cm2/s) (g/cm∙s)
Gas 10-3 10-1 10-4 Fluid 0.3-0.9 10-3-10-4 10-4-10-3 Liquid 1 10-5 10-2
A further advantage of supercritical fluids is that the solubility of the compounds can
be influenced by variation of pressure and temperature, which both have different influences
on the solubility. An increase in the pressure results in higher solubility, due to the increase
in density. An increase in the temperature has two influences: (1) the density of the fluid
decreases and (2) the vapour pressure of the substance to be solved increases. Depending on
which effect is more dominant, the increase in temperature can result in an increase, as well

24
as in a decrease of solubility. Normally, for pressures twice higher as the critical pressure, an
increase in temperature results also in an increase in solubility. The critical properties for
some components, which are commonly used as supercritical fluids, are shown in Table 2.
Table 2: Critical properties of various solvents [Reid et al., 1987].
Solvent Molecular weight Crit. temperature Crit. pressure Crit. density (g/mol) (K) (MPa) (g/cm³) Carbon dioxide (CO2) 44.01 304.1 7.38 0.469 Water (H2O) 18.02 647.3 22.12 0.348 Methane (CH4) 16.04 190.4 4.60 0.162 Ethane (C2H6) 30.07 305.3 4.87 0.203 Propane (C3H8) 44.09 369.8 4.25 0.217 Ethylene (C2H4) 28.05 282.4 5.04 0.215 Propylene (C3H6) 42.08 364.9 4.60 0.232 Methanol (CH3OH) 32.04 512.6 8.09 0.272 Ethanol (C2H5OH) 46.07 513.9 6.14 0.276
In food processing, supercritical carbon dioxide has been the most successful, due to
its relatively simple handling and favourable solvent properties. It has low critical
parameters; critical pressure of 7.38 MPa and critical temperature of 31.1 °C, which enables
operating at mild temperature. In addition, the CO2 is environment safe, accepted as a
solvent in the food industry, readily available and relatively cheap. One of the most important
properties of supercritical fluids is that their solvating properties are a complex function of
their pressure and temperature. Raw materials containing CO2-soluble products can be
selectively extracted or selectively precipitated to obtain ultra-pure products. In the
beginning, the SFE was performed at higher pressures (>30 MPa), this way substances with
high affinity to scCO2 were extracted. The higher pressure was applied to increase the solvent
power of the SCF. Later on, it was found out, that extractions at lower pressure show greater
selectivity. Therefore, the optimization of the solvent power and selectivity is one of the
things which should be always considered prior SFE [Reverchon and De Marco, 2006].
The basic SFE plant (Fig. 2) consists of an extraction vessel, where the raw material is
charged. The liquefied CO2 is heated and enters the extraction vessel from the bottom. SCF at
the exit of the extractor flows through a depressurization valve to a separator in which, due to
the lower pressure, the extracts are released from the gaseous medium and collected. In order
to fractionate the obtained extract more separators can be added. The fractions of different
composition are separated by setting different temperatures and pressures in the separators
[Simandi et al., 1998].

25
Figure 2: Schematic flow diagram of a basic SFE apparatus.
The further variations on SFE are:
Multistage extraction, where the pressure and/or temperature are varied in each
process step. This is used in the case that compounds with similar properties have to
be extracted or separated. It is achieved by changing the solvent power with pressure
and temperature [Reverchon, 1997].
Addition of a liquid co-solvent to increase the extraction of polar compounds. ScCO2
extracts non-polar compounds, thus to increase the affinity towards more polar
compounds co-solvent, usually ethanol, is added. However, the disadvantages of this
modification are that, by increasing the solvent power, the selectivity decreases and
the extract will be collected together with the liquid solvent.
The advantages of supercritical fluid extraction compared to conventional extraction
techniques are:
By varying the process parameters (pressure, temperature), the power/selectivity of
the SCF can be influenced.
Provides an alternative to replace toxic organic solvents.
Enables extraction of compounds more similar to their natural form, since there is no
thermal stress.
Compounds which are not possible to extract by conventional methods can be
obtained by SFE.
The extraction/fractionation solvent can be easily and completely removed.

26
The main disadvantages of SFE are the higher investments costs compared to
conventional extraction techniques. However, to invest in the simplest SFE (extractor and
separator) plant is relatively cheap and allows simple scaling up to larger scale [Reverchon
and De Marco, 2006]. The decaffeination of tea and coffee or hop extraction, already gained
their place in the industry. The tendency shows that the interest in SFE products increases,
due to their high added value. Legal limitations of solvent residues and solvents which can be
used for food-, drug-, and cosmetic industry support this process to become more economical
[Marr and Gamse, 2000]. Different papers deal with design of high pressure plants and cost
calculations [Lack et al., 2001; Luetge and Schuetz, 2007]. Thus, the SFE technology is
becoming a potential for future applications in food industries and attracts higher interest
from the side of investors. SFE reviews have been done by many authors, in general and from
selected aspects, as well: [Brunner, 2005; Kerrola, 1995; Lang and Wai, 2001; Meireles,
2003; Moyler, 1993; Reverchon, 1997; Reverchon and De Marco, 2006; Rosa and Meireles,
2005; Turner et al., 2002].

27
2. ANTHOCYANINS
Anthocyanins comprise a diverse group of water soluble pigments responsible for
orange, red, purple and blue colours of many fruits, vegetables, flowers, leaves, roots and
other plant storage organs. Some of the sources with their pigment content are listed in
Table 3. Besides the colour attributes, their several pharmacological properties are reported.
Health benefits associated with anthocyanin extracts include enhancement of sight
acuteness, antioxidant capacity, treatment of various blood circulation disorders resulting
from capillary fragility, vaso-protective and anti-inflammatory properties, inhibition of
platelet aggregation, maintenance of normal vascular permeability, controlling diabetes, anti-
neoplastic and chemo-protective agents, radiation-protective agents, and possibly others due
to their diverse action on various enzymes and metabolic processes [Giusti and Wrolstad,
2003; Kong et al., 2003].
Table 3: Anthocyanin content of some common fruits and vegetables [Giusti and Wrolstad,
2000].
Source Pigment content
mg/100 g fresh weight Reference
Apples 10 [Mazza and Miniati, 1993] Bilberries 300-320 [Mazza and Miniati, 1993] Blackberries 83-326 [Mazza and Miniati, 1993] Black currants 130-400 [Timberlake, 1988] Blueberries 25-495 [Mazza and Miniati, 1993] Red cabbage 25 [Timberlake, 1988] Black chokeberries 560 [Kraemer-Schafhalter et al., 1996] Cherries 4-450 [Kraemer-Schafhalter et al., 1996] Cranberries 60-200 [Timberlake, 1988] Elder berries 450 [Kraemer-Schafhalter et al., 1996] Grapes 6-600 [Mazza and Miniati, 1993] Kiwi 100 [Kraemer-Schafhalter et al., 1996] Red onions 7-21 [Mazza and Miniati, 1993] Plums 2-25 [Timberlake, 1988] Red radishes 11-60 [Giusti et al., 1998] Black raspberries 300-400 [Timberlake, 1988] Red raspberries 20-60 [Mazza and Miniati, 1993] Strawberries 15-35 [Timberlake, 1988]
The anthocyanins are part of the flavonoid group and they are glycosides of
anthocyanidins [Timberlake, 1980]. The major anthocyanidins and their structure are shown
in Fig. 3 and the Table 4 together with the most common substituents; the wavelength
maxima and visible colour of the individual anthocyanidin. As seen in the Table 4, the
increasing hydroxylation or methoxylation of the aglycone shifts the colour to more bluish.
The anthocyanins contain sugars and acylated sugars. The main monosides are glucose,

28
galactose, rhamnose and arabinose. The most frequent biosides are rutinose, sambubiose,
lathyrose and sophorose. The triosides which occur can be linear or branched chain. The
main acylating groups are the phenolic acids, p-coumaric, caffeic and ferulic acid. The
position 3 is always occupied by a sugar (acylated or not), and the further sugars may appear
in the positions 5, 7, 3´ and 4´. Most of the fruits contain 3-glycosides and the most common
is the 3,5-diglycosilation.
Figure 3: Structure of anthocyanidins. For substituens R1 and R2 see Table 4.
Table 4: Some of the most common anthocyanidins in the nature, their maximum absorption
wavelength (λmax) and visible colour. Substituents R1 and R2 refer to Fig. 3.
Aglycon R1 R2 λmax (nm) Colour Pelargonidin H H 494 orange Cyanidin OH H 506 orange-red Peonidin OMe H 506 orange-red Delphinidin OH OH 508 red Petunidin OMe OH 508 red Malvidin OMe OMe 510 bluish-red
2.1. STABILITY OF ANTHOCYANINS
Anthocyanins may degrade in different degradation mechanisms to results in soluble
colourless and/or brown coloured and insoluble products [Francis, 1989; Giusti and
Wrolstad, 2003; Malien-Aubert et al., 2001]. Degradation may occur during
extraction/purification and normal food processing and storage. The major factors

29
influencing anthocyanin stability are the pH value, temperature, presence of oxygen and
light, but enzymatic degradation and interactions with other components (e.g. ascorbic acid,
metal ions, sugars, co-pigments) are important as well [Bridle and Timberlake, 1997; Francis,
1989; Jackman et al., 1987; Mazza and Brouillard, 1987; Timberlake, 1980]. Storage
conditions may have an effect also [Morais et al., 2002].
The high reactivity of the aglycone (anthocyanidin) is mainly responsible for the
various structural modifications of anthocyanins in acidic media. Anthocyanidins are
generally unstable and less soluble in aqueous media than anthocyanins, thus glycosylation is
assumed to confer stability and solubility to the pigment molecule. Loss of the glycosyl
moiety is usually followed by rapid decomposition of the aglycone. The presence of hydroxyl
groups has different effects, for example C-3 position OH group destabilizes, while C-4 and
C-5 stabilizes the coloured form [Iacobucci and Sweeny, 1983]. Attempts to improve stability
by methylation of free phenolic hydroxyl groups have been found to reduce stability. The
presence of either a 4´-OH or a 7-OH in the molecule significantly stabilizes the pigment
while methylation of these hydroxyls decreases it [Mazza and Brouillard, 1987]. Stability of
anthocyanin colour and structure is influenced also by presence of acyl groups, which are
linked to the sugar moieties of the pigment molecule [Jackman and Smith, 1996; Malien-
Aubert et al., 2001]. Pigments containing two or more acyl groups display excellent colour
stability throughout the entire pH range [Cevallos-Casals and Cisneros-Zevallos, 2004; Giusti
and Wrolstad, 2003]. The main acylating groups are phenolic acids: p-coumaric, caffeic,
ferulic or sinapic acid; but may be also p-hydroxybenzoic, malonic or acetic acid [Giusti et al.,
1999a].
The structural transformations (Fig. 4) of anthocyanins are fundamental to their
colour stability. At pH values below 2, the anthocyanin exists primarily in the form of the red
flavylium cation (AH+) [Mazza and Brouillard, 1987]. As the pH is increased a rapid proton
loss occurs to afford the blue quinoidal form A. On standing, a further reaction occurs, that is
hydration of the flavylium cation to give the colourless carbinol (pseudo)base B. These in turn
can, at an even slower rate equilibrate to the open chalcone form C, which is also colourless.
The relative amounts of cation, quinoidal forms (A), carbinol (B) and chalcone (C) at
equilibrium vary with both pH and the structure of the anthocyanin [Iacobucci and Sweeny,
1983; Jackman and Smith, 1996; Jackman et al., 1987a].

30
Figure 4: Structural transformation of anthocyanins: flavylium cation (AH+), carbinol (B),
chalcone (C) and quinonoidal base (A) [Wrolstad, 2004].
The equilibrium distribution of the four structures of malvidin-3-glycoside with the
pH value is shown in Fig. 5. At very low pH values the AH+ is the dominant form. With
increasing pH its concentration and the colour of the anthocyanin is decreased and its
hydrates to the colourless carbinol. The equilibrium between these two forms is characterised
by the pKH value, which is 2.6 for malvidin-3-glycoside. At this pH there is only small
formation of the colourless chalcone and quinoidal base (A), but with increasing pH, the
amount of B, C and A forms increase at the expense of the red cationic form (AH+). The
equilibrium between the cation and quinoidal base is at pKA of 4.25 (for malvidin-3-
glycoside). Above pH of 5 only small amount of a colour is present in the form of quinoidal
base [Timberlake, 1980]. The colour of anthocyanin-containing solutions and the relative
concentration of each of the coloured (AH+, A) and colourless (B, C) species at the
equilibrium are dependent on the values of the equilibrium constants controlling the acid-
base or proton transfer (KA), hydration (KH) and ring-chain tautomeric (KT) reactions [Mazza
and Brouillard, 1987], where
Ka = ([A]/[AH+]) aH+

31
Kh = (([B] + [C])/[AH+]) aH+
KT = [C]/[B]
and aH+ is the hydroxonium ion or proton activity (pH = - log aH+).
Figure 5: Equilibrium distribution of flavylium cation (AH+), quinoidal base (A), carbinol (B)
and chalcone (C) for malvidin-3-glycoside as a function of pH value [Mazza and Brouillard,
1987].
The stability is also markedly influenced by temperature [Cevallos-Casals and
Cisneros-Zevallos, 2004; Giusti and Wrolstad, 2003; Gomez-Plaza et al., 2006; Morais et al.,
2002]. In general, structural features that lead to increased pH-stability (i.e. methoxylation,
glycosylation, acylation) also lead to increased thermal stability [Jackman and Smith, 1996].
The mechanism of anthocyanin degradation is temperature dependent and usually follows
first-order kinetics [Giusti and Wrolstad, 2003; Tseng et al., 2006]. The concentration of
polymeric pigments increases with temperature and storage time [Brouillard et al., 2003].
Such pigments contribute to the colouration of grapes and red wines and their presence
protect the anthocyanins in these products.
Oxygen may cause degradation of anthocyanins by direct oxidation mechanism
and/or by indirect oxidation where oxidized constituents of the medium react with the
anthocyanins [Jackman et al., 1987]. Ascorbic acid and oxygen act synergistically in

32
anthocyanin degradation [Francis, 1989]. Anthocyanins are generally unstable when exposed
to UV or visible light or other sources of ionizing radiation [Cevallos-Casals and Cisneros-
Zevallos, 2004; Gomez-Plaza et al., 2006]. Light causes an increase in the rates at which
anthocyanins undergo thermal degradation. The enzymes, endogenous in many plant tissues,
which cause anthocyanin degradation and subsequent loss of colour are generally named
anthocyanases, but based on their activity two distinct groups have been identified [Jackman
and Smith, 1996]. The glycosidases, which hydrolyse the glycosidic bonds of anthocyanins,
yield free sugar and aglycone, resulting in the spontaneous degradation via the colourless
chalcone. The polyphenoloxidases (PPO) act on anthocyanins in the presence of o-diphenols
via coupled oxidation mechanism.
In acidic media anthocyanins occur as the flavylium cation, which itself exists in six
resonance species, the positive charge being delocalized over the entire heterocyclic structure
[Jackman and Smith, 1996]. Non- or mono acylated anthocyanins are particularly prone to
nucleophilic attack at positions C-2 and C-4, which generally yields in colourless species.
Nucleophilic attack by water occurs at C-2 position yielding the colourless
carbinol/hemiacetal. The C-4 position is less favourable for attack by water. This position is
more likely to be attacked by amino acids and carbon nucleophiles such as catechin, phenol,
phloroglucinol, etc. Anthocyanins are rapidly decolourized by the addition of SO2, an
antiseptic agent used extensively in the wine industry to control microbial growth. The
bleaching reaction is reversible and pH dependent; a covalent adduct at the C-2 or C-4
positions of the flavylium ring is formed [Timberlake, 1980]. Acetaldehyde and other
aldehydes cause loss of colour of anthocyanins through electrophilic attack. Anthocyanidin
3,5-diglycosides are less prone to electrophilic attack than 3-glycosides [Jackman and Smith,
1996].
The high sugar concentrations have protective effect on anthocyanins, probably by
lowering water activity. Above threshold level (100 ppm), sugars and their degradation
products accelerate the degradation of anthocyanins [Cevallos-Casals and Cisneros-Zevallos,
2004; Jackman and Smith, 1996]. The sugar degradation compounds react with the
anthocyanins leading to formation of colourless or complex brown coloured products
[Malien-Aubert et al., 2001]. Oxygen enhances the degradative effects of all sugars and sugar
derivatives.
Anthocyanins form weak complexes with alkaloids, proteins, tannins, other
flavonoids, organic acids, nucleic acids, polysaccharides and metal ions through so called
intermolecular co-pigmentation [Dimitric Markovic et al., 2005; Gonzalez-Paramas et al.,
2006; Mazza and Brouillard, 1987]. Intramolecular co-pigmentation is called, when the
anthocyanin molecule is acylated. Co-pigmentation causes a bathochromic shift from red to
blue and increases the tinctorial power [Giusti et al., 1999a]. As the concentration of

33
anthocyanin is increased the pigment molecules associate with each other [Timberlake,
1980], thus reducing the potential to complex with a co-pigment. Polymeric flavonoids and
anthocyanins play important role in the colouration of grapes and red wines [Brouillard et al.,
2003]. During aging the monomeric anthocyanins are replaced by the more stable polymeric
pigments. Such components are less pH-sensitive and more resistant to discolouration.
Complexation may also occur with different metals: iron, tin, aluminium, copper and various
others [Jackman et al., 1987a]. These metal chelates and salts normally cause a bathochromic
displacement from red to stable blue and violet colours.
2.2. EXTRACTION OF ANTHOCYANINS FROM DIFFERENT PLANT MATERIALS
In most fruits and vegetables the anthocyanin pigments are located in cells near the
surface or exterior [Francis, 1982]. The most commonly used extraction solvent is methanol
or ethanol [Metivier et al., 1980; Ortega-Regules et al., 2006; Pinelo et al., 2005], many times
in mixture with water [Lapornik et al., 2005; Negro et al., 2003; Vidal et al., 2004; Wu and
Prior, 2005]. The solubility of anthocyanins, which have polar character, is the highest in
methanol, a little lower in ethanol and the lowest in water, but differences are not big, so for
food industry usage ethanol is more adequate solvent. Extraction procedures involve the use
of acidic solvents which denature the membranes of cell tissue and simultaneously dissolve
the pigments [Amico et al., 2004; Heredia et al., 1998; Monagas et al., 2006; Revilla et al.,
1998; Revilla et al., 1999; Ruberto et al., 2007]. Acidification serves to maintain a low pH
value, thus providing a favourable medium for the formation of flavylium form [Iacobucci
and Sweeny, 1983; Jackman et al., 1987b; Timberlake, 1980]. In some cases the obtained
concentrate is further extracted with hexane, ether, or ethyl acetate to remove lipid material
and unwanted polyphenols [Fuleki and Francis, 1968]. The acid tends to stabilize
anthocyanins, but it may also change the native form of the pigment in the tissue by breaking
associations with metals, co-pigments etc. Losses of labile acyl and sugar residues may occur
after acidified extraction during subsequent concentration and recrystallization [Adams,
1972; Jackman et al., 1987a]. To minimize the decomposition of acylated pigments lower acid
concentration was suggested [Revilla et al., 1998]. In some cases weaker organic acids have
been utilized in the extraction solvents [Cacace and Mazza, 2003; Wu and Prior, 2005].
Extraction with ethanolic, or aqueous SO2 or bisulphite solutions is also favourable because it
increases the pigment yield and concentrates of higher purity, colour intensity and pigment
stability are obtained than with pure solvent [Gomez-Plaza et al., 2006; Jackman et al.,
1987b].
The increase of the extraction temperature increases the rate of extraction and
reduces the extraction time by increasing the diffusivity [Cacace and Mazza, 2003; Turker

34
and Erdogdu, 2006]. However, anthocyanins are not heat stable, thus temperature of the
extracting medium cannot be increased indefinitely to maximize the process. The increased
extraction time increased the anthocyanin yield up to 12 h after which a decrease, probably
due to degradation, was observed [Lapornik et al., 2005].
2.3. PURIFICATION OF ANTHOCYANIN EXTRACTS
Purification and separation has been carried out primarily by chromatographic
techniques [Jackman et al., 1987b]. The selection of chromatographic solvents depends on
the nature of the crude anthocyanin sample. For purification of larger quantities column
chromatography with different loadings were reported [Amico et al., 2004; Giusti et al.,
1999a; Gomez-Miguez et al., 2006; Gomez-Plaza et al., 2006; Kammerer et al., 2005; Longo
and Vasapollo, 2006; Pomar et al., 2005]. Anthocyanins may also be purified and
concentrated by membrane filtration, which separates proteins and higher molecular weight
carbohydrates from smaller molecules (sugars, phenolics, anthocyanins etc.). However,
aggregation of some polymerized anthocyanins may cause them to be retained by the
membrane [Jackman and Smith, 1996]. Rapid and most efficient separation of complex
mixtures is achieved with reversed-phase high-performance liquid chromatography (HPLC).
The technique is non-destructive; the separated peaks are readily collected for subsequent
analysis. With appropriate selection of eluent, column type and length, flow rate and
temperature, HPLC can be used to separate the anthocyanins without the need for
preliminary purification of extracts [García-Beneytez et al., 2002; Kallithraka et al., 2005;
Kuskoski et al., 2003; Ortega-Regules et al., 2006; Ruberto et al., 2007].
2.4. ANALYSIS OF ANTHOCYANINS
2.4.1. QUALITATIVE AND QUANTITATIVE ANALYSIS
Well developed chromatographic and spectroscopic methods have been applied for
rapid and accurate identification of anthocyanins [Giusti et al., 1999b; Jackman et al., 1987b;
Kong et al., 2003; Kuskoski et al., 2003; Longo and Vasapollo, 2006; McCallum et al., 2007;
Monagas et al., 2006; Wu and Prior, 2005]. Structural identification involves identification of
the aglycone, sugar moieties and acyl groups (if present), and the position of attachment of
the sugar and acyl groups. Such is facilitated by combination of different spectroscopic
techniques, including infra-red (IR), Raman-resonance, ultraviolet/visible (UV/VIS), nuclear
magnetic resonance (NMR) and mass spectrometry (MS) [Jackman and Smith, 1996;

35
Kucharska and Oszmiaski, 2002; Wu and Prior, 2005]. The most preferred method is HPLC
for its several advantages:
complex mixtures can be separated with minimum sample preparation,
the methods are very sensitive,
can be used with very small quantities of sample and
equipment costs are lesser than NMR, MS.
The traditional anthocyanin characterization generally involves acid, alkali, enzyme and/or
peroxide hydrolysis prior to HPLC analysis [Giusti et al., 1999a; Longo and Vasapollo, 2006;
Nyman and Kumpulainen, 2001]. Acid hydrolysis yields aglycones and sugars. Alkaline
hydrolysis is used for determination of the acyl group.
There are several methods for determining the “total” anthocyanin content of an
anthocyanin extract or juice. Depending on if there are interfering compounds or not, single
pH method, subtractive and differential methods were applied [Francis, 1989; Jackman et al.,
1987b]. The absorbance measurements by the single pH method are carried out at a pH as
low as possible to ensure maximum colour development and low response to changes in pH
which may occur [Adams, 1972; Lapornik et al., 2005]. The single pH method cannot be used
in the presence of brown coloured degradation products, for example from sugar or pigment
breakdown [Sondheimer and Kertesz, 1948]. Un-purified extracts may also contain
compounds, that at low pH, absorb in the range of maximum absorption of the anthocyanins.
The subtractive method involves measurements of sample absorbance at the visible
maximum, followed by bleaching and a re-measurement to give a blank reading [Piga et al.,
2005]. Subtraction gives the absorbance due to anthocyanin, which can be converted to
anthocyanin concentration. The most common bleaching agents are sodium bisulphite and
hydrogen peroxide [Jackman and Smith, 1996]. However, bleaching agents can cause
decrease in absorbance of some interfering substances, resulting in erroneously high values
of total pigment concentration [Francis, 1982].
The most commonly used method is the differential method, which measures the
absorbance at two different pH values, and relies on the structural transformations of the
anthocyanin chromophore as a function of pH (Fig. 6) [Giusti and Wrolstad, 2000]. This
concept was first introduced by Sondheimer and Kertesz in 1948 [Sondheimer and Kertesz,
1948], who used pH values of 2.0 and 3.4 for analyses of strawberry jams [Francis, 1989].
Since then, the use of other pH values has been proposed. Fuleki and Francis [Fuleki and
Francis, 1968] used pH 1.0 and 4.5 buffers to measure anthocyanin content in cranberries,
and modifications of this technique have been applied to a wide range of commodities
[Wrolstad et al., 1982]. The pH differential method has been described as fast and easy

36
method for the quantitation of monomeric anthocyanins [Wrolstad et al., 2005]. This method
was chosen also in the present work for the analysis of the total anthocyanins.
Figure 6: UV-Visible spectra of anthocyanins in pH 1.0 and 4.5 buffers and the structures of
the flavylium cation (A) and hemiketal/carbinol form (B); R=H or glycosidic substituents
[Wrolstad et al., 2005].
Samples are diluted with aqueous pH 1.0 and pH 4.5 buffers and absorbance
measurements are taken at the wavelength of maximum absorbance of the pH 1.0 solution.
The difference in absorbance between the two buffer solutions is due to the monomeric
anthocyanin pigments. Polymerized anthocyanin pigments and non-enzymic browning
pigments do not exhibit reversible behaviour with pH, and are thus excluded from the
absorbance calculation. It is customary to calculate total anthocyanins using the molecular
weight and molar extinction coefficient of the major anthocyanin in the sample matrix
[Wrolstad et al., 2005]. The number of anthocyanins for which molecular extinction
coefficients have been determined is limited, however [Giusti et al., 1999a].
By using the subtractive and differential procedures, accurate measurement of the
total monomeric anthocyanin pigment content can be obtained, along with indices for

37
polymeric colour, colour density, browning and degradation. To determine total anthocyanin
content, the absorbance at pH 1.0 and 4.5 is measured at the λvis-max and at 700 nm, which
allows for haze correction. The bisulphite bleaching reaction is utilized to generate the
various degradation indices [Giusti and Wrolstad, 2000]. Anthocyanin pigments will
combine with bisulphite to form a colourless sulfonic acid adduct (Fig. 7). Polymerized,
coloured anthocyanin-tannin complexes are resistant to bleaching by bisulphite; while the
bleaching reaction of monomeric anthocyanins will rapidly go to completion. The absorbance
at 420 nm of the bisulphite-treated sample serves as an index for browning as the
accumulation of brownish degradation products increases the absorption in the 400 nm to
440 nm range.
Figure 7: Reaction of anthocyanin pigments with bisulphite to form colourless anthocyanin-
sulfonic acid adducts.
Colour density is defined as the sum of absorbances at the λvis-max and at 420 nm. The
ratio between polymerized colour and colour density is used to determine the percentage of
the colour that is contributed by polymerized material. The ratio between monomeric
(differential method) and total anthocyanin (single pH method) can be used to determine a
degradation index. If the identity of the pigments is unknown, it has been suggested that it
can be expressed as cyanidin-3-glycoside, since that is the most abundant anthocyanin in
nature [Giusti and Wrolstad, 2000].
2.4.2. COLOUR EVALUATION
To investigate colour quality in a systematic way it is necessary to objectively measure
colour, as well as pigment concentration. Colour denotes the visual appearance of the product
whereas pigments are the chemical compounds that impart the observed colour. A method

38
for measuring the colour was proposed by CIE (International Commission on Illumination,
Vienna), which is based on uniform colour spaces. Modern colour instrumentation has made
measurements of CIE L*a*b* indices practical and easy. The colorimeter will measure L*
which is a measure of ‘lightness’ and two coordinates a* and b*. Positive values of a* are in
the direction of redness and negative values in the direction of the complement green.
Positive values of b* are the vector for yellowness, and negative for blueness (Fig. 8).
Figure 8: The CIE L*a*b and L C H interpretations of visual colour.
Since colour is three dimensional, samples for example, with identical a* values may
exhibit colours ranging from purple to red to orange, it is suggested to convert the L* a* b*
parameters to the L∙C∙H system where L is for lightness with 100=absolute white and
0=absolute black. Hue angle (H) is derived from the two coordinates a* and b* and
determined as arctan b*/a*. Hue angle is expressed on a 360° grid where 0°=bluish–red,
90°=yellow, 180°=green, and 270°=blue. This system avoids the use of negative numbers and
differences in hue angle of 1° are readily discernible by the human eye. Chroma (C) is a
measure of intensity or saturation and calculated as (a*+b*)1/2. This means, that a red
coloured sample of different dilution strengths going from pink to red will have the same hue
angle but increasing chroma values. Another phenomena of chroma, is that it will increase
with pigment concentration to a maximum, and then decrease as the colour darkens. Thus a
pink and a dark red colour can have identical values for chroma. Indices of lightness, chroma,
and hue angle are particularly useful for tracking colour change [Wrolstad et al., 2005] in
food products. The CIE L∙C∙H system does not give an accurate definition of colour, but it is
very effective for measuring colour differences and tracking colour changes during processing
and storage.

39
3. STABILIZATION OF THE ANTHOCYANINS
Researches involving the development of anthocyanin food colorants has led to the
discovery of anthocyanin molecules with complex pattern of glycosylation and acylation that
exhibit remarkable stability to pH changes, heat treatment and light exposure [Cevallos-
Casals and Cisneros-Zevallos, 2004; Giusti and Wrolstad, 2003; Malien-Aubert et al., 2001].
Generally, the more complex is the glycosylation and/or acylation pattern, the more stable is
the anthocyanin. To produce stable natural pigments enzymatic method for acylation of
anthocyanins was proposed as well [Nakajima et al., 2000; Nakajima et al., 1999].
Intermolecular co-pigmentation significantly influences the stability of the anthocyanin
pigments [Mazza and Brouillard, 1987; Timberlake, 1980]. Adding cystein, quercetin, tartaric
acid, rutin, caffeic acid stabilized colour [Jackman et al., 1987a]. The co-pigments cause a
bathochromic effect and increase in the absorbance in the visible band. The effect of co-
pigments increases with the increasing anthocyanin concentration and the ratio of co-
pigment to anthocyanin [Asen et al., 1972]. In the nature, the wide variation of colours of
flowers and fruits is the result of co-pigmentation, i.e. stabilization of the colour of the
anthocyanins.
Figure 9: Basic structure of the pigments derived from the acetaldehyde-mediated
condensation between anthocyanins and catechins. C* is an asymmetric carbon, which makes
possible the existence of diastereomer pigments.

40
Anthocyanins have been shown to react with flavan-3-ols, such as catechin, in the
presence of acetaldehyde to yield covalently linked products of enhanced colours (Fig. 9). The
reaction is accelerated at reduced pH and occurs via position 6 and/or 8 of both, flavan-3-ols
and anthocyanins, forming a CH3-CH link [Escribano-Bailon et al., 2001]. Further ways of
improved stabilizations are self-association, metal complexing and presence of inorganic
salts [Francis, 1989; Mazza and Brouillard, 1987].
Product formulation also improves the stability of the anthocyanins. Spray- and
freeze-dried extracts showed better stability, probably due to low moisture environment
[Jackman et al., 1987a]. Wrolstad and Rodriguez-Saona produced a natural colorant from red
fleshed potatoes with good stability and red-hue colour and intensity equivalent to synthetic
colorant FD&C Red No. 40 (E 129). The extraction was done with water and the final step
was thin-film dehydration or spray drying [Wrolstad and Rodriguez-Saona, 2001].
Anthocyanins incorporated into zeolites showed remarkable stability [Kohno et al., 2008].
The aqueous dispersion of the flavylium/zeolite complex maintained its colour at 80 °C or at
pH 9, under which conditions the aqueous solution of the flavylium loses its colour
immediately. Same authors showed the stabilization effect when using mesoporous silicate
[Kohno et al.]. A formulation for antitussive preparation was stabile as well [Veigas et al.,
2007].
The stability of anthocyanin pigment extracts was enhanced by removal from the
anthocyanin pigment extracts the nutrients which support yeast growth, constituents which
react to produce off-flavour, and constituents which catalyze oxidation. These undesirable
materials were removed by subjecting the extracts to ultrafiltration or dialysis to remove low
molecular weight components from the extracts. The extracts were also subjected to ion
exchange to additionally remove these undesirable constituents. Such processed anthocyanin
extracts showed higher tinctorial powers, e.g. more brilliant red colours, and were less
hygroscopic [Hilton et al., 1982]. Cassis juice was purified and concentrated by using a
charged reverse osmotic membrane which resulted in high anthocyanin content product,
with adequate acidity and high stability, which can be added to foods and drinks [Matsumoto
et al., 2001].
To inhibit the anthocyanin destructive endogenous enzymes, a steam blanch prior
processing and/or storage was proved to be effect. Researchers from Japan patented a
method for producing stable anthocyanins [Kinpei, 2006]; they suggested high temperature
treatment for ultra-short time in order to inactive the polyphenol oxidase enzymes. The
enhancement of the stability was studied also by adding an adequate amount of an edible
antioxidant and by producing a food forming film, which disables the contact with air.
Ascorbic acid derivative added to anthocyanin-containing food improved colour stability as
reported earlier [Iacobucci and Sweeny, 1980].

41
Anthocyanin stabilization was investigated by adding surfactants chosen from the
group consisting of a glycerine fatty acid ester, a sucrose fatty acid ester, a sorbitan fatty acid
ester, a polyglycerine fatty acid ester, a propylene glycol fatty acid ester, calcium stearoyl
lactate, a sodium alkyl sulphate, a soybean phospholipid, lysolecithin and chondroitin
sulphate at concentrations equal to their critical micelle concentrations or higher [Hirotoshi
et al., 2001]. Adding polyphosphate to beverages improved colour stability over time. The
polyphosphates were sodium, potassium or calcium polyphosphate and sodium
hexametaphosphate [Beardmore, 2004].
Improved stability in the presence of light, heat and/or pH was achieved by adding
pigment-improving agents selected from the group consisting of flavonoid glycuronides,
flavonoid glucuronides and caffeic acid derivatives [Lenoble et al., 1999]. In a patent,
formulation of the macqui berry in a stabilized form which includes a glucuronide or
glycuronide, a photostabilizing agent; encapsulation, light- and/or air-blocking packaging
[Morariu, 2007] was shown.
To improve the heat stability of an anthocyanin colour addition of glycyrrhetin was
investigated, which is a sugar with a sweetness as high as 200 times that of sucrose [Tsukui
and Hayashi, 1997]. Other authors patented a stabilization method where 1,5-D-
anhydrofructose originating from starch, was added to anthocyanin-pigments [Yajima et al.,
2003]. A method of stabilizing anthocyanin-rich compositions which comprises adding
phytic acid together with sugars and/or sugar alcohols was patented as well [Tominaga et al.,
2001]. A berry extract was formulated for compositions for treating inflammation, oxidative
damage, or cancer in a mammal for oral and/or topical administration. The anthocyanins
were stabilized with mannitol [Mumper et al., 2007]. Blue anthocyanins incorporated into
granulated sugars showed stability, as well [Nguyen, 2004].

42
4. PRODUCT FORMULATION WITH SUPERCRITICAL FLUIDS
In the last one decade SCF technology has witnessed an enormous growth in its
application to process a variety of materials. SCF technology replaces organic solvents in a
number of chemical processes, such as extraction, reactions, food processing and
manufacturing, waste treatment, recycling, polymer and nanoparticle fabrication, particles
coating and particle formulations, etc. [Byrappa et al., 2008]. Particularly, particle design
using supercritical fluids have gained significant importance [Shariati and Peters, 2003]
since it gives various advantages and easier tailoring possibilities, in comparison to
conventional methods. In contrast to the conventional particle formation methods like
freeze-drying, spray-drying and precipitation, where a larger particle is originally formed and
then reduced to the desired size, SCF technology involves growing the particles in a
controlled mode to achieve the desired size and morphology. The sensitivity of supercritical
fluids to small changes in temperature and pressure in the highly compressible region offers
the potential to control both particle size and morphology over a wide range, with only small
adjustments to process conditions [Palmer and Ting, 1995]. The particles once formed do not
need to undergo further processing or treatment and this feature makes SCF technology
amenable to produce biomolecules and other sensitive compounds in their native pure state.
Particle design using SCFs have been extensively studied during the last years, for
applications which include pharmaceuticals, natural substances, pigments, polymers,
superconductor precursors and explosives [Jung and Perrut, 2001; Reverchon, 1999; Shariati
and Peters, 2003]. Using the supercritical fluids, new microencapsulation techniques have
been developed in order to overcome some of the disadvantages of the conventional
techniques. Especially for the advanced drug delivery and for drug formulation systems, SCF
technology emerges out as an alternate to most of the existing techniques.
Drugs which have low solubility and high permeability show irregular or delayed
absorption. To overcome the bioavailability problems of drugs different methods were
proposed, such as micronization, surface modification; formation of complexes, eutectic
mixture, solvates, solid solutions and solid dispersions [Sethia and Squillante, 2004]. In solid
solutions and dispersions, the drug molecules/crystals are dispersed in a biocompatible
matrix. Although, the bioavailability is enhanced there are some drawbacks of conventionally
producing such. Solid dispersions conventionally were prepared by rapid cooling of the melt,
spray drying and solvent evaporation. Disadvantages of these techniques are the extreme
heat by rapid cooling method, which might affect the stability of the material; large amounts
of solvents, which causes the problem of removal from the product and further collection and
disposal of the solvent. Additionally, the solvent residues in the final product are more likely
with these techniques [K. Gong, 2005]. Alternative/novel processes, like SCFs may give an

43
alternative [Majerik et al., 2007a]. Among the advantages of using scCO2, these technologies
provide a product with reduced particle size and residual solvent content; in many cases the
crystal habit, morphology and polymorphic form is controllable as well. Parallel problems
and similar opportunities exist in the development of improved food ingredient formulations,
such as controlled release flavours and preservatives and improved stability and shelf-life by
providing a protective matrix for the sensitive food compounds.
SCF precipitation processes can be classified according to the role of the supercritical
fluid in the process: it can act as a solvent, as in the Rapid Expansion of Supercritical
Solutions (RESS) process; as an anti-solvent, as in the Supercritical Anti Solvent processes
(SAS); and as a solute, as in the Precipitation from Gas Saturated Solution process (PGSS™)
[Martín and Cocero, 2008]. Jung and Perrut performed an extensive review of all the
available methods and techniques for particle design using SCFs [Jung and Perrut, 2001].
Carbon dioxide is the most commonly used SCF in food applications. It is not only cheap and
readily available at high purity, but also safe to handle and it is easily removed by simple
expansion to common environmental pressure values. Consequently, it is approved for food
and drug processing without declaration. Furthermore, when being recycled, it does not
contribute to the environmental CO2-problem [Brunner, 2005].
Many recent and excellent reviews have been published on particle formation,
formulation and control with supercritical fluids and dense gases [Mishima, 2008].
Reverchon described the application of supercritical antisolvent processes explored in a
variety of different fields including explosives, polymers, pharmaceutical compounds,
colouring matter, superconductors, catalysts and inorganic compounds [Reverchon, 1999].
Marr and Gamse broadly mentioned the applications of supercritical fluid technology with
respect to extraction, dyeing of fibres, synthesis and particle formation [Marr and Gamse,
2000]. Yeo and Kiran reviewed the recent developments in particle formation from polymers
using supercritical fluids with an emphasis on articles published during 2000–2003 [Yeo and
Kiran, 2005]. Knez et al. gave an overview about of the fundamentals of the processes, their
applications and the technological advantages and disadvantages of various processes for
particle formation and design [Knez and Weidner, 2003]. Further, Weidner et al. gave an
overview of the main published applications on multifunctional composites by high-pressure
spray processes [Weidner et al., 2003]. Pharmaceutical formulations were also presented
[Fages et al., 2004; Kerc et al., 1999]. Shariati and Peters summarized the recent
developments in particle design using supercritical fluids [Shariati and Peters, 2003]. Perrut
et al. discussed enhancement of the dissolution rate of poorly-soluble active ingredients by
supercritical fluid processes [Perrut et al., 2005a; Perrut et al., 2005b]. Further, they also
commented on the preparation of composite particles using supercritical fluid processes. The
SCF technique of materials processing is playing an important role in nanotechnology as well

44
[Byrappa et al., 2008]. The review of Byrappa et al. presents the nanomaterial preparation
using different SCF technology (RESS, GAS/SAS, PGSS™, etc.) with reference to the
processing of biomedical materials. The actual experimental data and results are discussed
corresponding to the selected nanomaterials for biomedical applications. The SCF syntheses
of nanoparticles, such as phosphors, metal oxids and carbon nanotubes have been discussed.
4.1. CONCENTRATED POWDER FORM (CPF™)
In many food and pharmaceutical applications, mixtures of liquids and powderous
substances are used, where the powderous substance acts like a carrier. The purpose of this
formulation – turning powder to liquid – is because powderous products are easier to handle
during transport, storage and further processes. In addition, the carrier might act as a
protective material to sensitive substances. The conventional methods for producing powders
from liquid include grinding, agglomeration, spray drying and granulation in fluidized bed
(in the case of a stabilization with a powderous carrier). With conventional processes many
times different problems occur, such as when the liquid is too viscous or the liquid consist of
heat labile compounds. In addition, with these methods the liquid loadings on the carrier are
quite low [Weinreich et al., 2002].
A novel method for turning a liquid into powder is the CPF™, where the liquid is
sprayed onto a carrier in a high pressure process. In this technology a compressible gas,
mostly carbon-dioxide is dissolved under pressure into the liquid which has to be pulverized.
The solution of the liquid and compressed gas is then released via a nozzle into a spray tower.
The dissolved CO2 decreases the surface tension and the viscosity of the liquid, which
ease/enable the process in case of highly viscous liquids. The nozzle generates fine droplets,
which contain dissolved CO2. Due to the rapid expansion to atmospheric pressure the liquid
is disintegrated into very fine droplets. The expanding gas also causes the decrease in the
temperature in the spray tower, thus preventing the degradation of heat labile substances.
The CO2 creates an inert gas atmosphere; therefore oxygen-sensitive compounds can be
processed as well. The powderous carrier is co-currently added to the liquid spray and due to
the turbulence in the spray tower, caused by the expanding gas, the carrier and the liquid
droplets are intensively and homogenously mixed [Petermann et al., 2001]. The comparison
of the CPF™ technology with classical techniques, such as spray drying and granulation in
fluidized bed, is shown in Table 5. Some of the process properties and parameters are
compared regarding the economic point of view, like gas consumption and process capacity;
the possible negative effects on the final product (thermal/oxidative stress) and properties of
the final product (maximum liquid loading, possible carriers and liquids). Further advantage
of CPF™ technology is, that particles with tailor-made properties may be produced,

45
influencing the particle size and morphology by varying the process parameters [Weinreich et
al., 2002].
Table 5: Comparison of the CPF™ and conventional techniques [Petermann et al., 2001].
CPF™ technique Spray drying Granulation in fluidised bed
pnozzle: 7-20 MPa pnozzle: 5-30 MPa pnozzle: 0.5 MPa
T: -10 °-0 °C T: 65 °C T: 30 °-40 °C
Auxiliary media: CO2
Auxiliary media: air
(T: 180 °-200 °C) Auxiliary media: air
(T: 60 °-80 °C)
0.5 m3 CO2
per kg powder 30-40 m3 air
per kg powder 10-20 m3 air
per kg powder
capacity: 200-300 kg/h capacity: 400-700 kg/h capacity: 100-200 kg/h
single fluid nozzle single and double
fluid nozzle single and double
fluid nozzle
inert atmosphere oxygen atmosphere oxygen atmosphere
no product stress thermal stress thermal stress
max. loading: 90 wt% max. loading: 20 wt% max. loading: 10 wt%
usable for many liquids and carriers
usable for water soluble or water dispersible systems
usable for carriers with bulk densities > 500 kg/m3
With CPF™ technology various liquids can be turned to powder using different types
of carriers. The liquids can be lipophilic and viscous liquids, such as natural extracts,
flavourings, colourings, oils as well as hydrophilic substances. The choice for carrier material
is wide and includes: salts, starch, sugars, cellulose, sililic acid and many more [RAPS].
Loadings up to 80-90 wt % of the liquid on the carrier may be achieved with this process,
whereas the powder remains a free-flowing, homogenous powder. According to Lankes et al.
the maximum loading capacity is in strong correlation with the density of the carrier and the
liquid has only small influence (in the case if the liquid is wetting, a conventional morphology
is produced and the liquid dissipates into small droplets) [Lankes et al., 2003]. The same
authors compared different carriers with different type of loadings, such as edible oil and
water. The bulk densities were in the range of 51 and 616 kg/m3 and the maximum loading
capacities were from 25% to 80%. The higher the density, the lower was the liquid
adsorption.
In the present work CPF™ technology was applied, where anthocyanin concentrates
were sprayed onto different carrier materials, such as silica and starch.

46
4.2. PARTICLES FROM GAS SATURATED SOLUTIONS (PGSS™)
The PGSS™ process allows forming particles from substances that are non-soluble in
supercritical fluid, but absorb a large amount of gas that either swell the substance or
decrease the melting point [Knez and Weidner, 2003; Weidner et al., 1995]. This process can
also be used for micronization of suspensions and emulsions. In the PGSS™ process the
compressible medium is solubilized in the substance which has to be micronized. Then the
gas-containing solution is rapidly expanded in an expansion unit and the gas is evaporated.
Owing to the Joule–Thomson effect and/or the evaporation and the volume-expansion of the
gas, the solution cools down below the solidification temperature of the solute and fine
particles are formed. The solute is separated and fractionated from the gas stream by a
cyclone and electro-filter. The PGSS™ process was tested in pilot-, and technical size on
various classes of substances (polymers, resins, waxes, surface-active components and
pharmaceuticals) [Jung and Perrut, 2001; Weidner et al., 2006; Wendt, 2006; Yeo and
Kiran, 2005]. The produced powders show narrow particle-size distributions and have
improved properties compared to the conventionally produced powders. Tailor-made
products with different morphologies, particle sizes and bulk densities can be obtained. The
operating parameters are: temperature, pressure, nozzle diameter, composition of the
starting mixture, etc.
This process can only be applied to substances for which the anti-solvent effect of CO2
is small; otherwise the solute precipitates in the saturator and not in the expansion vessel.
The main advantage of this process is the reduced consumption of CO2 with respect to the
other SCF formulation processes, and its simplicity, as it operates at lower pressures, which
can be atmospheric in the precipitator. For these reasons, PGSS™ processes are already in
operation at large scales [Martín and Cocero, 2008; Yeo and Kiran, 2005].
It was demonstrated that the PGSS™ process is suitable also for the generation of
multiphase systems (encapsulation), where at least one phase is in liquid state [Weidner et
al., 2006; Wendt et al., 2006]. The two substances, “shell” and “core” are intensively admixed
in presence of a supercritical fluid (usually CO2), thus generating micro droplets of the liquid
that are dispersed in the melted shell material. Subsequently the mixture is expanded to
ambient pressure through a nozzle into a spray tower. During the expansion fine droplets are
formed. Simultaneously, the droplets are directly cooled by the expanding gas. The shell
material solidifies and forms a cover around the liquid droplets. The properties of the
composite materials can be adjusted by the process parameters of the PGSS™ process
[Weidner et al., 2003; Wendt et al., 2006].
Among the SCF formulation methods the PGSS™ is often the best choice , since there
are many materials, which are polar or high-molecular-weight substances. It is difficult to

47
dissolve these compounds in CO2, thus the low solubility necessitates the use of enormous
amounts of CO2. However, the ability of CO2 to diffuse into the compounds enables the
formation of composite particles in the PGSS™ process. In pharmaceutical areas, the organic
compounds mainly constitute biodegradable polymers and CO2 lowers the melting point and
decreases the viscosity of a polymer by disolving in the compound [Mishima, 2008]. There
are many successful trials in drug formulations, resulting in improved drug-carrier
composition properties. Sencar-Bozic et al. produced the composite micro particles of
nifedipine (antihypertensive) and polyethyleneglycol (PEG 4000) by the PGSS™ process
[Sencar-Bozic et al., 1997]. They showed that the solid dispersions resulted in enhanced
dissolution rates of nifedipine. The similar results were reported for the anti-angina drug
felodipine [Kerc et al., 1999]. Rodrigues et al. prepared the micro particles of theophylline
(bronchodilators) with hydrogenated palm oil (HPO) by the PGSS™ process [Rodrigues et
al., 2004]. Particle size about 3.0 μm of diameter was obtained. Spherical morphology with a
regular surface was obtained at higher expansion pressures. Tandya et al. precipitated
cyclosporine, an immunosuppressant drug that has been commonly used for the treatment of
respiratory tract infections. In such cases, when the drug has low dissolution rate, one
method of enhancing the dissolution rate of a drug into the biological environment is to
reduce the particle size. In comparison to the original particle size of cylonesporine a 97%
decrease in particle size was achieved with PGSS™ micronization. It was reported also, that
the melting point of cyclosporine decreased from 150 °C (0.1 MPa) to 25 °C at 5.5 MPa when
exposed to CO2 at high pressure [Tandya et al., 2006]. Using PGSS™ system a wide range of
other pharmaceuticals like tobramycin, tlutathione, glucose, DL-alanine, calcium antagonist
drugs, glutathione, horseradish peroxidase, albuterol sulfate, cromolyn sodium, etc. and also
many inorganic and organic compounds like phosphors, spinels, glycerides, metal oxides,
plastic additives, pigments, etc. have been developed [Byrappa et al., 2008].
A technique based on PGSS™ was developed for drying sensitive substances, like
green tea. PGSS™ drying enables processing at low temperatures and oxygen-free
atmosphere, thus avoiding the degradation of the polyphenols of the green tea [Meterc et al.,
2008].
With the PGSS™ process micro particles with narrow size distribution and different
morphologies can be obtained. The morphology and the size of a food component may play
an important role in the mouth feel and taste of the final product. Additionally, these
powders are free of solvent and other additives, which is very important in sectors as the food
industry. Münüklü et al. investigated the micronization of edible fats, namely rapeseed oil,
with PGSS™ process. They studied the effect of variables (CO2 concentration, the melt
temperature and the atomization pressure) in order to investigate particle morphology,
density and the particle size distribution. The experiments were performed at CO2

48
concentrations between 0 and 50 wt%, atomization pressure between 7 and 18 MPa and melt
temperature between 60 and 100 °C. Particles obtained as a function of the CO2
concentration, showed completely solid, spherical-hollow and aggregated particles with a
decrease in particle mean size as the concentration of CO2 was increased. The results
obtained as a function of atomization pressure showed no significant influence on particle
morphology and size distribution. Experiments carried out as a function of the melt
temperature showed distorted, spherical-hollow and aggregated particles [Münüklü and
Jansens, 2007].
In the present work non-hydrogenated palm fat was micronized with anthocyanin-
concentrates. The high pressure spraying of pure palm fat has been already introduced by
Wendt [Wendt, 2006]. He investigated the influence of the process parameters (pressure,
temperature, concentration etc.) on the particle morphology, density and the particle size
distribution. His aim was to produce fluid-filled micro particles, i.e. encapsulation of a liquid
into a fat, which can be used for different food applications. The model liquid was water. The
micronization experiments were performed at temperatures from 62 to 92 °C and pressures
from 7.2 to 12.9 MPa. The gas-to-product ratio (GPR) was between 0.04 and 2.59. Powders
with liquid concentration up to 78 wt % were obtained. The density of the obtained products
varied between 50 and 300 kg/m3 (pure palm fat was 930 and water 1000 kg/m3). The main
influencing parameters were the pre-expansion pressure, the GPR and the feeding ratio of
the composite materials. The mean particle sizes varied between 4 and 15 μm. In this case the
pressure did not have any significant effect. Connection between particle size and re-
expansion temperature was observed, where the increasing temperature resulted in increased
particle sizes. The morphology was mainly influenced by the GPR. Wide variety of particles,
from needles to spherical shapes, was obtained.
4.3. SUPERCRITICAL ANTISOLVENT PRECIPITATION (SAS)
In this technique, a supercritical fluid acts as an antisolvent for liquid solutions. The
substance to be precipitated is dissolved in an organic liquid solvent and the solution is
sprayed into a chamber through a nozzle, where a supercritical fluid is already present [Jung
and Perrut, 2001; Yeo and Kiran, 2005]. The rapid contact between the two media generates
higher super-saturation ratio of the solution, resulting in precipitation of the solute as fine
particles in the chamber. The solvent and anti-solvent are continuously fed and discharged
from the precipitation chamber. When enough solution was fed into the precipitator, the
liquid flow stream is stopped, while the flow of the anti-solvent is continued until dry
particles are obtained. In the SAS processes, the particle shape and size distribution is
strongly dependent on the liquid solution injection device that influences the droplet size and

49
mass transfer between the two fluid phases [Martin and Cocero, 2004; Reverchon, 1999;
Reverchon et al., 2006; Reverchon and Pallado, 1996]. It is also dependent on temperature,
pressure, and the flow rates at which the solution and the anti-solvent are added to the
precipitation chamber [Martin et al., 2007; Miguel et al., 2006; Reverchon et al., 2003;
Shariati and Peters, 2003]. A special advantage of this technique is its adaptability for
continuous operations, which is important for large-scale mass production of particles
[Reverchon et al., 2006; Yeo and Kiran, 2005]. The commonly used supercritical agent is
carbon dioxide due to its many advantages, already described before.
The SAS method has been one of the most popular methods among the SCF
formulations, since most of the substances have low or no solubility in scCO2. The other
advantage is that the method is not under patent protection; therefore the investigations are
not limited. Many organic and inorganic compounds were processed by SAS method [Jung
and Perrut, 2001; Marr and Gamse, 2000; Miguel et al., 2006; Reverchon, 1999; Reverchon
et al., 2005], but the main interest in the last years was directed towards precipitation of
polymers, especially biopolymers [Carretier et al., 2003; Elvassore et al., 2001; Reverchon et
al., 2000; Song et al., 2002]. The main reason of this is the interest of the pharmaceutical
industry, because beside precipitation of a single substance, producing polymer particles that
contain an active ingredient is possible as well. Particles of various biodegradable polymers
were produced for drug delivery and for agricultural and biological applications [Kompella
and Koushik, 2001]. The aim of these formulations is to encapsulate a biologically active
ingredient in a polymer matrix to be used for controlled release; and/or to provide a
protection to the active substance by incorporating it in a polymer matrix [Caliceti et al.,
2004; Majerik et al., 2007b; Martin et al., 2007; Moneghini et al., 2001; Moneghini et al.,
2006; Elvassore et al., 2001; Taki et al., 2001].
In this work the co-precipitation of anthocyanins (water soluble pigments) and
polyvynilpirrolidone (PVP), type K-25 was investigated. The precipitation of different types of
pure PVP and co-precipitation with different drugs was investigated before by several
authors. Among the first, the feasibility of producing drug-PVP solid dispersions was
investigated including different methods, such as supercritical antisolvent gas
recrystallization (GAS) and the characteristics of this system were compared to
conventionally prepared dispersions, by spray drying and conventional co-precipitation
[Corrigan and Crean, 2002]. In high pressure/supercritical processes the polymer changes its
characteristics, thus it is very important to investigate the mechanical and physical changes
of the polymers, prior to the SCF formulation experiments [Kikic et al., 2003]. The most
important effect of sorption of compressed gases and supercritical fluids into polymers is the
reduction of glass transition temperature (Tg). It was reported that high pressure reduced the
Tg of PVP-K25. The same research group performed several precipitation experiments with

50
different types of PVP. Alessi et al. successfully precipitated PVP K-30 from chloroform and
co-precipitated β-carotene with it [Alessi et al., 2007].
Carbamazepine was formulated with PVP K-30 in SAS process resulting in an
amorphous form of the drug incorporated into PVP. In comparison with the physical
mixture, where the drug retained its crystallinity, the SC (supercritical) formulated drug
showed higher dissolution rate and stability [Sethia and Squillante, 2004]. Dissolution rate of
a poorly water-soluble drug, indomethacin was improved by combining with a hydrophilic
polymer PVP (MW=44000) [K. Gong, 2005]. The drug was co-precipitated with PVP with
only scCO2 (PGSS™), without addition of solvents. Above a certain concentration of PVP in
the co-precipitate, the drug was present in amorphous from, and lower ratios of PVP resulted
in higher dissolution rate of the drug. Yasuji et al. investigated PVP (C-15) precipitation from
ethanol solution, which was not successful, however they produced particles by desolvation of
PVP coacervate (from a mixture of ethanol-hexane) with scCO2 [Takehiko Yasuji, 2006]. A
composite PVP-phenytoin was produced as well, by the same coacervate method. The
composite particles contained amorphous phenytoin; the drug loadings approached
theoretical values and showed high dissolution rate.
Majerik et al. prepared solid dispersion of PVP K-17 and oxeglitazar, a diabetes drug
with low solubility and dissolution rate. With the aim to improve the bioavailability of the
drug, two methods were compared: supercritical antisolvent technique and classical
coevaporation [Majerik et al., 2007a]. In the SAS formulations the drug was co-precipitated
with different polymers and from various solvents and their mixtures, including ethanol,
tetrahydrofuran, dichloromethane, chloroform, N-methyl-2-pyrrolidone and
dimethylsulfoxide [Majerik et al., 2007b]. The formulations were compared for their particle
morphology, crystallinity, polymorphic purity, residual solvent content, precipitation yield
and dissolution kinetics. The oxeglitazar-PVP experiments resulted in amorphous solid
dispersions with high density, greater dissolution rate and good flowability.
In recent years, some changes have been introduced to the SAS process to improve its
performance for producing nanoparticles or to adopt the process to water-soluble materials
[Shariati and Peters, 2003]. For many molecules it is essential to have water in the system
(e.g. proteins) and also some pharmaceutical applications involve water in the system. The
low productivity of SAS processes from aqueous solutions is mainly contributed to the
difficulty of the water removal. The process is time and energy consuming, because high
SCF/aqueous solution ratio should be set in the feed, which makes the procedure very
expensive as well [Li et al., 2005]. The use of a co-solvent, such as ethanol, was shown to
improve the miscibility of scCO2 in water, thus resulting in higher process efficiency. To carry
out processes like this it is basic to observe first the ternary phase behaviour of the

51
compounds at high pressures. Several authors reported the vapour-liquid equilibrium of
CO2-EtOH-water [Gilbert and Paulaitis, 1986; Li et al., 2005; Yao et al., 1994].
Bouchard et al. compared four different modifiers, namely methanol, ethanol, 2-
propanol and acetone. They studied the effect on particle formation and precipitation
mechanism [Bouchard et al., 2008]. Based on the observation of the tie-line diagrams, in the
case of ethanol and methanol the precipitation should occur due to antisolvent effect, while in
the case of acetone and 2-propanol, the precipitation should be dominated to water removal.
They modelled the evolution of the radius of the droplet in presence of modifiers, which show
that by methanol and ethanol the precipitation might occur during the swelling of the droplet
by anti-solvent mechanism; while by acetone and 2-propanol precipitation results from
evaporation of the droplet. In the experimental part, they studied the effect of the modifiers
on SAS of glycine, phenylalanine, lysozyme and trehalose, from aqueous solution. It was
found that the selection of the modifier affects the capacity of the process and type of
obtained particles as well. The experimental results showed decreasing antisolvent effect of
the modifier in SCF-drying, as follows: methanol>ethanol>2-propanol>acetone.
In the present work the phase behaviour of anthocyanin concentration (water
solution) with carbon dioxide at high pressure was investigated. Modifiers, such as acetone,
methanol and ethanol were compared. In addition, PVP-water-modifier-CO2 phase behaviour
was observed at high pressures, as well.

52
EXPERIMENTAL WORK
5. EXTRACTION
5.1. MATERIALS
5.1.1. PLANT MATERIALS
The elder berries (ELD) were collected in Maribor (Slovenia) in 2005. The berries
were frozen and stored at -16 °C. The red grape marc used in the present study was kindly
donated by Vinakoper (Slovenia). Three varieties of red grape marc were investigated: Refošk
(RF), Merlot (ME) and Cabernet (CB). The grapes were harvested and processed for wine in
2005. For comparison, RF grape marc from harvest year 2006 was additionally supplied and
investigated. The marc was received in dried form, milled and stored in a cool and dry place
(Fig. 10).
Figure 10: Extraction plant material: elder berry and grape marc.
5.1.2. CHEMICALS
All solvents and chemicals (analytical grade) used for extraction and for analytical
purposes were purchased from Merck (Darmstadt, Germany) and from Fluka (Seelze,
Germany). Standards of (-)-epicatechin (Cat. No. E1753) and resveratrol (Cat. No. R5010)
were supplied by Sigma-Aldrich (Seelze, Germany). Quercetin (Cat. No. 174070250) was
purchased from Acros Organics (Geel, Belgium). The natural antioxidant AquaRox 15 was
supplied by Vitiva (Markovci, Slovenia). The CO2 of purity 2.5 (99.5 % (v/v)) was obtained
from Messer (Ruše, Slovenia).

53
5.2. CONVENTIONAL SINGLE-STEP EXTRACTIONS
The extraction conditions (time, solvent-to-solid ratio, temperature) were chosen
upon literature data [Cacace and Mazza, 2003; Lapornik et al., 2005; Spigno and De Faveri,
2007; Turker and Erdogdu, 2006] and previous extraction experiences of the research group.
Conditions during all conventional extraction experiments were: solvent-to-solid ratio of
20 mL solvent per g material and extraction time of 2 h. The solvent was removed by vacuum
evaporation at 30 °C and extracts were stored at -16 °C prior analysis.
Extractions of frozen elder berry were performed with acetone (20, 40, 60, 80 and
100 % (v/v)) and ethanol (50, 70 and 100 % (v/v)) mixtures with water at temperatures 20,
40 and 60 °C. Extractions at 60 °C were compared for frozen and lyophilised elder berries.
Grape marc was extracted with acetone-, ethyl-acetate- and ethanol-water mixtures (50, 70
and 100 % (v/v)) at temperatures 20 and 60 °C. The conditions for the single-step extractions
are summarized in Table 6.
Table 6: Summary of the performed single-step extractions.
Material Solvent Conc. % (v/v) T (°C) pH Notes RF marc acetone 50, 70, 100 20, 60 5*
ethyl-acetate
ethanol water 100 60 2 adj. phosphoric acid
4 6 adj. NaOH
RF-06 marc ethanol 50 60 5* with AquaRox
1 adj. HCl CB marc acetone 50, 70, 100 20, 60 5*
ethyl-acetate
ethanol ME marc acetone 50, 70, 100 20, 60 5*
ethyl-acetate
ethanol ELD fresh acetone 20, 40, 60, 80,
100 20, 40,
60 5*
ethanol 50, 70, 100 acetone 40 40 2 adj. HCl or acetic
acid ethanol 96 ELD lyophilised
acetone 20, 40, 60, 80, 100
60 5*
ethanol 50, 70, 100 Notes: adj.=adjusted with; *=ethanol, acetone and ethyl acetate do not influence significantly the pH value of the
water.

54
The influence of pH value on the extraction was investigated. In the case of elder berry
the pH value of the extraction solvent at 40 °C (40 % acetone or 96 % ethanol, (v/v)) was
adjusted to 2 with HCl or acetic acid, regarding authors [Metivier et al., 1980]. In the case of
RF grape marc water was used as a solvent. The pH values were set to 2 with phosphoric acid
and pH 6 with sodium-hydroxide (NaOH) (at 60 °C). The results were compared with results
of extractions with water of pH value 4. For the same variety of grape marc, but from one
year later harvest (RF-06), extraction with 50 % (v/v) ethanol at 60 °C was performed. The
solvent pH value was adjusted with HCl to 1, at which anthocyanins appear in the most
coloured form [Wrolstad et al., 2005]. For comparison, RF-06 was extracted also with non-
acidified solvent at 60 °C. Addition of a commercial natural antioxidant to the extraction
solvent was investigated using RF-06 with 50 % (v/v) ethanol at 60 °C.
5.3. SUPERCRITICAL FLUID EXTRACTION (SFE) WITH CARBON DIOXIDE
5.3.1. SFE WITHOUT CO-SOLVENT
SFE with CO2 was performed at 15 and 30 MPa at 40 °C using a home built apparatus
for SFE [Hadolin et al., 2001] (Fig. 11). The material was charged into the extractor
(V=60 mL), which was placed in a water bath. Liquefied CO2 was pumped with a high-
pressure pump (ISCO syringe pump, model 260D, Lincoln, Nebrasca), through a preheating
coil, over the bed of sample in the extractor. The flow rate was regulated using a thermostated
micrometric valve. The extract was collected in a separator at 0.1 MPa and ambient
temperature. The flow rate of the released CO2 was measured by a flow meter. The average
flow rates of CO2 at ambient temperature and pressure were following: 0.9 L/min for RF,
0.6 L/min for CB, 0.7 and 1.1 L/min for ELD. The total mass of extract was weighed, and
extracts were stored at -16 °C prior analysis. The residual material from supercritical
extractions was re-extracted with ethanol-water mixtures (50 % or 100 % (v/v)) at
temperature 60 °C. The procedure for the second step extraction was the same as described
for the single-step extraction above. The conditions for the two-step extractions are
summarized in Table 7.

55
Figure 11: Supercritical extraction apparatus.
Table 7: Summary of the performed two-step extractions.
Material 1st Step: SFE 2nd Step: conventional
Solvent P (MPa) T (°C) Solvent T (°C)
RF marc CO2 30
40 50 % EtOH 60 CO2+EtOH
15 30
CB marc CO2 15 40 50 % EtOH
60 100 %EtOH
ELD CO2
15 40 50 % EtOH 60
30 40 50 % EtOH
60 70 % EtOH 100 % EtOH
5.3.2. SFE WITH ETHANOL CO-SOLVENT
The supercritical fluid extraction with CO2 and ethanol co-solvent was performed at 15
and 30 MPa at 40 °C. The apparatus was equipped with an additional High Performance
Liquid Chromatography pump (LDC Analytical, ConstaMetric 3000 solvent delivery system,

56
Riviera Beach, Florida) for the ethanol (Fig. 11). The material was charged into the extractor,
which was placed in water bath. The CO2 and ethanol were pumped simultaneously: flow rate
of ethanol was 0.2 mL/min and of released CO2 at ambient temperature and pressure were
0.1 and 0.5 L/min (for the extractions at 15 MPa and at 30 MPa, respectively). The extract,
containing ethanol, was collected in a separator at 0.1 MPa and ambient temperature. The
ethanol was evaporated and the final mass of extract weighed. The extracts were stored at -
16 °C prior analysis.
5.4. ANALYTICAL METHODS
5.4.1. DETERMINATION OF THE TOTAL PHENOLIC COMPOUNDS
The total phenols were measured spectrophotometrically by the Folin-Ciocalteu
method, based on a colorimetric oxidation/reduction reaction of phenols [Skerget et al.,
2005]. To 0.5 mL of diluted extract (20 mg in 10 mL distilled water) 2.5 mL of Folin-
Ciocalteu reagent (diluted 1:10 with water) and 2 mL of Na2CO3 (75 g/L) were added. The
sample was incubated for 5 min at 50 °C and then cooled. For control sample 0.5 mL of
distilled water was taken. The absorbance was measured at 760 nm by an UV/Vis
spectrophotometer (Varian Cary 50). The results were calculated on the basis of the
calibration curve of gallic acid (GA) (for the calibration curve see Appendix I) and expressed
as mg GA/g dry material. The analyses were performed in triplicate and average value was
calculated.
5.4.2. DETERMINATION OF TOTAL MONOMERIC ANTHOCYANINS
Monomeric anthocyanins were measured by the pH-differential method, which relies
on the structural transformation of the anthocyanin chromophore as a function of pH, which
can be measured using optical spectroscopy [Giusti and Wrolstad, 2000]. 20 mg of extract
was dissolved in 10 mL of distilled water. Two dilutions of the sample were prepared: one
with potassium chloride buffer pH=1.0 (1.86 g of KCl in 1 L of distilled water) and the other
with sodium acetate buffer pH=4.5 (32.8 g of CH3COONa in 1 L of distilled water). The
dilution factor (DF) was determined (final volume per original sample volume). The pH
values of the buffers were adjusted with cc. HCl. The dilutions were left to equilibrate for
15 min. The absorbance of each dilution was measured at 520 and 700 nm by an UV/Vis
spectrophotometer (Varian Cary 50). The anthocyanin content was calculated as cyanidin-3-

57
glycoside (MW = 449.2 and ε = 26900) and the results were expressed as mg cy-3-gly/g dry
material. The analyses were performed in triplicate and average value was calculated.
The absorbance of the diluted sample (A):
A = (A520– A700)pH 1.0 – (A520– A700)pH 4.5 (1)
The total anthocyanin pigment concentration in the original sample (TA):
TA (mg/L) = (A x MW x DF x 1000)/(ε x l), (2)
TA (mg/g extract) = [TA (mg/L)/100]/ mextract (g) (3)
TA (mg/g material) = TA (mg/g extract) x [yield of extraction (%)/100] (4)
where MW is the molecular weight (g mol-1), DF is the dilution factor (for example, if a 2 mL
sample is diluted to 10 mL, DF = 5), l is the path length (usually 1 cm) and ε the molar
absorptivity (mol-1 L cm-1).
5.4.3. DETERMINATION OF QUERCETIN
The content of quercetin in the raw material was determined using a HPLC method.
To 1 g of elder berry sample 40 mL of 60 % ethanol (v/v) and 5 mL of 6 M HCl were added.
The hydrolysis was performed at 90°C for 2 h with constant mixing. The mixture was cooled,
filtered and adjusted to 50 mL with 60 % ethanol. Prior to HPLC analysis the samples were
filtered using a microfilter [Wang and Helliwell, 2001]. The HPLC system consisted of a
Varian 9012 pump and Varian diode array detector 9065. As a stationary phase a Waters
symmetry column C-18, 250 × 4.6 with 5 μm particles size was used. The mobile phase
consisted of two solvents A: 20 mM H2KPO4 buffer pH=3 with 6 M HCl, and B: methanol.
The method was isocratic for 5 min 5 % B, then changed with linear gradient from 5 % to
100 % B over 30 min and for the last 5 min 100 % B. The flow rate was 0.8 mL/min and the
detection wavelength 367 nm. The quantification was made with external standard of
quercetin (for chromatogram see Appendix III).
5.4.4. DETERMINATION OF FLAVANOLS AND TRANS-RESVERATROL
Catechin, epicatechin and trans-resveratrol levels in the samples were measured by
HPLC after small modifications of a previously reported method [Gurbuz et al., 2007]. The
system consisted of an Agilent 1100 pump and Agilent 1100 diode array detector. Catechin,
epicatechin and trans-resveratrol were separated on C-18 Eclipse XDB column 150 × 4.6 mm

58
with particles size 5 μm. The mobile phases consisted of A: 9 % acetonitrile, 91 % acidified
water (5 % acetic acid) (v/v); and B: acetonitrile. The flow rate was 1 ml/min. The method
was as follows: linear gradient from 0 to 14 % B for 20 min, from 14 to 40 % B for 8 min, from
40 to 50 % B for 2 min and the last 5 min from 50 % to zero B. The detection was set at the
wavelength (λEx/λEm) 280/315 nm (for catechin and epicatechin), and at the wavelength
(λEx/λEm) 324/370 nm (for trans-resveratrol). The calibration curve of t-resveratrol is shown
in Appendix II.

59
5.5. RESULTS AND DISCUSSION
5.5.1. CONVENTIONAL EXTRACTION OF TOTAL PHENOLS AND ANTHOCYANINS
TEMPERATURE
For all solvents investigated it was generally observed that by increasing the
extraction temperature to 60 °C, the amount of total extracted phenols increased, which is in
agreement with previous findings (Pinelo et al., 2005; Spigno & De Faveri, 2007; Türker &
Erdoğdu, 2006). In the case of anthocyanins, the increase of the extraction temperature from
20 to 60 °C had different effect on the extracted amounts depending on plant materials and
solvents, as well. The higher temperature increased the amount of extracted anthocyanins
from elder berry and RF grape marc, except for RF using acetone-water mixtures as solvent.
For CB and ME the lower extraction temperatures were generally more suitable, except for
CB extracted with pure ethanol (for the graphs see Appendix IV-XI).
SOLVENT TYPE AND CONCENTRATION
In case when the aim is isolation of compounds from grapes and derivates the most
common extraction solvent is methanol acidified with HCl (Revilla et al., 1998; Amico et al.,
2004; Monagas et al., 2006; Ruberto et al., 2007). The extraction is then followed by a multi-
step purification procedure. Some researchers used organic solvent-water mixtures for the
extraction of the grape marc (Bonilla et al., 1999; Negro et al., 2003; Vidal et al., 2004), but
only few of them compared the usage of different solvents (Ju & Howard, 2003; Lapornik et
al., 2005; Pinelo et al., 2005). However, in these cases a single concentration of the mixtures
(ethanol, methanol and/or water) was used for comparison. To our knowledge, the extraction
of anthocyanins from grape marc was not investigated in such details, regarding usage of
different solvents, concentrations and temperatures. In present work, only solvents which are
allowed in the food industry were used, considering the future scaling-up.

60
0
5
10
15
20
25
100% 50% 70% 100% 50% 70% 100% 50% 70% 100%
water acetone ethyl-acetate ethanol
mg
GA
/ g
dry
mat
eria
l
RF CB ME
Figure 12: Extraction of Total phenols from different varieties of grape marc at 60°C with
water and acetone-, ethyl-acetate and ethanol-water mixtures. Grape marc varieties: RF
refošk, CB cabernet, ME merlot.
0.0
0.2
0.4
0.6
0.8
1.0
1.2
100% 50% 70% 100% 50% 70% 100% 50% 70% 100%
water acetone ethyl-acetate ethanol
mg
/ g
dry
mat
eria
l
RF CB ME
Figure 13: Extraction of Total anthocyanins from different varieties of grape marc at 60°C
with water and acetone-, ethyl-acetate and ethanol-water mixtures. Grape marc varieties: RF
refošk, CB cabernet, ME merlot.

61
VARIETY OF GRAPE AND HARVEST YEAR
The extraction of different varieties of grape marc from Sicily using methanol was
compared by Ruberto et al. (2007). The comparison of the Slovenian RF, CB and ME grape
marc varieties in the amount of phenolic compounds (extracted with different solvents at
60 °C) is shown in Fig. 12. For total phenols, acetone-water mixtures were more effective
solvents for ME and CB varieties, while for RF ethanol-water solvent mixture (1:1) resulted in
higher amounts of extracted total phenols per g dry material. In the case of extraction of
anthocyanins from RF and CB grape marc higher amounts of anthocyanins (Fig. 13) were
extracted than from ME (all from grape harvest year 2005). For RF variety the organic
solvent/water mixtures (1:1) were found to be the most suitable solvents. On the other hand,
for CB grape marc, 100 % ethanol and 50 % acetone, and for ME marc, 70 % ethyl-acetate,
were found to be the most suitable solvents. The varietals difference, maceration time and the
harvest year of the grapes have important influence on the phenolic content of the wine and
therefore of the marc (Gómez-Plaza et al., 2006; Ruberto et al., 2007). From the RF grape
marc, harvest year 2006, almost three times more total phenols were extracted (50 % ethanol
at 60 °C) than from the marc, year 2005 (49.7 and 17.3 mg GA/g dry material, respectively).
Similarly, the extracted total anthocyanins were also higher from the RF marc harvest 2006
compared to harvest 2005 (1.14 and 0.92 mg/g dry material).
0
10
20
30
40
50
60
70
20% 40% 60% 80% 100% 50% 70% 96%
acetone ethanol
mg
GA
/ g
dry
mat
eria
l
Frozen Liophilized
Figure 14: Extraction of Total phenols from elder berry with acetone- and ethanol-water
mixtures at 60 °C. Comparison of frozen and lyophilised extraction materials.

62
FREEZE-DRYING
A significant difference in the amount of extracted phenolic compounds was observed
using frozen and lyophilised elder berry (Figs. 14 and 15). The freeze-drying leads to very
porous structure resulting from ice sublimation, therefore the penetration of the extraction
solvent and consequently the mass transfer are enhanced (Barbosa-Cánovas et al. 2005).
Additionally, the lyophilisation is carried out at low temperature, thus the degradation of
heat sensitive phenolics is less probable. From the lyophilised elder berry, four times more
total phenols (60.6 mg GA/g dry material) and three times more total anthocyanins
(10.5 mg/g dry material) were extracted with 50 % ethanol at 60 °C than from the frozen
material.
0
2
4
6
8
10
12
20% 40% 60% 80% 100% 50% 70% 96%
acetone ethanol
mg
/ g d
ry m
ater
ial
Frozen Liophilized
Figure 15: Extraction of Total anthocyanins from elder berry with acetone- and ethanol-water
mixtures at 60 °C. Comparison of frozen and lyophilised extraction materials.
THE PH VALUE CHANGE
The extraction of elder berry with acidified ethanol (acetic acid) resulted in 30-40 %
higher amounts of extracted total phenols and total anthocyanins (for graphs see
Appendix XII). Using acetone-water as solvent, the addition of acetic acid lowered the
amount of extracted anthocyanins, and only a slight increase in total phenols was observed.

63
In the case of grape marc, pure water and temperature of 60 °C were chosen in screening
experiments for simple comparison of the pH value effect (Fig. 16). The addition of
phosphoric acid and NaOH decreased the amount of extracted total phenols, but increased
the anthocyanin yield. Although the extraction at pH 6 increased the anthocyanin yield, it is
not preferable, because of the possible residues of the NaOH in the extracts. However, the
water is not the best extraction solvent for the anthocyanins (0.15-0.20 mg anthocyanins/g
dry material), thus extraction with 50 % ethanol at 60 °C was investigated. For this
extraction, RF grape marc from the harvest year 2006 was used (RF-06), which initially had
higher phenolic content than the RF marc from 2005. Addition of HCl to the solvent resulted
in three times more total phenols in the extract (139 mg GA/g dry material), however there
was no significant effect on total anthocyanins (5 % increase in extraction of total
anthocyanins).
0
5
10
15
20
25
pH2phos
neutral pH6NaOH
water
mg
GA
/g d
ry m
ater
ial
RF - Total phenols
0.0
0.2
0.4
0.6
0.8
1.0
1.2
pH2phos
neutral pH6NaOH
water
mg/
g dr
y m
ater
ial
RF - Total anthocyanins
Figure 16: Effect of the change in the pH value of extraction solvent (100% water) by
extraction of Total phenols (left) and Total anthocyanins (right) from Refošk (RF) grape marc
( at 60 °C). The pH 2 adjusted with phosphoric acid (phos) and pH 6 with sodium-hydroxide
(NaOH).

64
5.5.2. SUPERCRITICAL FLUID EXTRACTION OF TOTAL PHENOLS AND ANTHOCYANINS
Extraction with scCO2 resulted in low yields of total phenols and anthocyanins in the
obtained extracts (Figs. 17, 18 and 19). Grape marc and elder berries contain more polar
polyphenols, thus the non-polar scCO2 is not an effective extractant (Mantell et al., 2003;
Hasbay Adil et al., 2007). By using scCO2 with ethanol co-solvent for extraction of RF grape
marc, two times more phenols and three times more anthocyanins were extracted, as when
pure scCO2 was used. Furthermore, by using scCO2 with ethanol as co-solvent, the amount of
extracted total phenols at 30 MPa was the same as by conventional extraction, while at
15 MPa somewhat higher amount of total phenols was extracted compared to conventional
extraction. The negative effect of pressure was also observed by Mantell et al. (2003) who
used CO2 with methanol/water co-solvent for the extraction of grape marc. Using different
by-products, Hasbay Adil et al. (2007) reported positive effect of pressure (up to 50 MPa) on
total phenolic content of apple and peach pomace. Both groups agree that higher percent of
co-solvent (up to 20 wt % methanol/ethanol) and extraction at subcritical conditions is more
efficient for the extraction of polyphenols from these pomaces. However, the yield of
polyphenols in such extraction is still lower compared to conventional solvent extraction.
Figure 17: Comparison of the single-step (conventional extraction, CE) and two-step (1st step:
supercritical fluid extraction, SFE; 2nd step: CE) extraction of Refošk (RF) grape marc: total
phenols (mg GA/g dry material) and total anthocyanins (mg/g dry material).

65
Figure 18: Comparison of the single-step (conventional extraction, CE) and two-step (1st step:
supercritical fluid extraction, SFE; 2nd step: CE) extraction of Cabernet (CB) grape marc: total
phenols (mg GA/g dry material) and total anthocyanins (mg/g dry material).
Figure 19: Comparison of the single-step (conventional extraction, CE) and two-step (1st step:
supercritical fluid extraction, SFE; 2nd step: CE) extraction of Elder berry (ELD): total
phenols (mg GA/g dry material) and total anthocyanins (mg/g dry material).
In present work two-step extraction, using SFE as a pre-treatment for removal of the
non-polar compounds was investigated. The residual material of the scCO2 extraction was re-
extracted with 50 % ethanol-water mixture at 60 °C. The results show, that generally scCO2

66
pre-treatment of the elder berry and grape marc improved the extraction of total phenols
(Figs. 17, 18 and 19). The total phenols obtained in the two-step extraction were significantly
higher compared to the single-step extraction procedure. The amount of total phenols
extracted from the elder berry, in single-step extraction, was 60.6 mg GA/g dry material.
Applying a two-step extraction procedure the amount of total phenols extracted was
74.6 mg GA/g dry material. The influence of pre-treatment with SFE on extraction of total
phenols was even more significant for grape marc. The non-polar components were removed
by CO2, thus in the second extraction step, 2-3 times more total phenols were obtained than
in the single-step conventional extraction. Possibly, the extraction efficiency was improved
also due to the “cell-opening” of the plant, caused by high pressure. However, the pre-
treatment with scCO2 did not have a significant effect on the extraction of the anthocyanins,
probably due to their low concentration in the raw material.
5.5.3. EXTRACTION OF CO-PIGMENTS
Quercetin (up to 0.22 mg/g dry material) and a high amount of epicatechin (up to
2.58 mg/g dry material) were extracted from elder berries (for data see Appendix XIII). Pre-
extraction of the raw material with scCO2 improved the isolation of quercetin. The non-polar
components were removed, thus quercetin became more concentrated in the material. The
raw material contained 67 mg quercetin per 100 g of dry material of elder berry, as
determined by HPLC, prior the supercritical extraction. After extraction at 15 MPa and
30 MPa the residual material then contained 152 mg quercetin/100 g dry material and 95 mg
quercetin/100 g dry material, respectively.
The amounts of t-resveratrol extracted from elder berry ranged between 1.9 and
21.0 mg/100 g dry material; the highest amount was obtained with 40 % acetone at 60 °C. In
the case of grape marc 1.2-14.9 mg t-resveratrol per 100 g dry material were extracted from
RF variety (Fig. 20). The highest amounts were obtained with 70 % ethanol and 50 %
acetone. ME marc contained less of this compound, with a maximum of 1.7 mg t-resveratrol
per 100 g dry material extracted with 50 % acetone at 60 °C. The results show, that grape
marc is a potential source for t-resveratrol; however the extraction, concentration and
purification should be investigated in more details.

67
0
5
10
15
20
50% 70% 100% 50% 70% 100% 50% 70% 100%
ethanol ethyl-acetate acetone
mg/
100
g dr
y m
ater
ial
RF 20°C RF 60°C
Figure 20: Extraction of t-resveratrol from Refošk (RF) grape marc with different solvents
(ethanol, ethyl-acetate and acetone) with different concentrations (in mixture with water) at
temperatures of 20 °C and 60 °C.

68
6. SEPARATION AND PURIFICATION OF INDIVIDUAL COMPOUNDS
6.1. MATERIALS AND REAGENTS
Extracts of red grape marc (variety of Refošk) were produced in pilot scale extraction.
V06 was an extract from December 2006 and V07 from January 2007. Commercial grape
extract Nor-grape (NG) was obtained from Vitiva Co. (Markovci, Slovenia). Extract of grape
skin (GS) was prepared at the laboratory. The grapes were obtained from a local
supermarket. All the reagents were purchased from Merck (Darmstadt, Germany). Malvidin-
3-glycoside standard was obtained from Extrasynthese (Genay, France).
6.2. EXTRACTION
The pilot-scale extraction of grape marc was performed with 50 % ethanol/water
(m/m) at 60 °C for 2 h with a solvent-to-solid ratio of 20 L/kg. Afterwards, the mixture was
filtered, the solvent evaporated and the extract was dried in a vacuum dryer at 50°C. The
grape skin extract was prepared upon methods described in literature [Heredia et al., 1998;
Revilla et al., 1998; Revilla et al., 1999]. The skins of the grapes were peeled manually. 100 g
of grape skin was macerated with 250 mL of 0.01 % HCl/methanol (v/v) for 24 h. Before
filtration, the mixture was sonicated for 10 min. The mixture was filtered and the solvent
evaporated. The extract was stored at -30 °C. The skin residue was subjected to the same
extraction procedure two times. At the end the extracts were collected together and freeze-
dried.
6.3. COLUMN CHROMATOGRAPHY
The anthocyanin extracts were purified on reversed phase silica with a slight
modification of previously reported methods [Giusti et al., 1999a; Ju and Howard, 2003;
Longo and Vasapollo, 2006; Morais et al., 2002]. The column was pre-conditioned with 2
vol. of methanol, followed by 2 vol. of 0.1 % HCl in water (v/v). The extract was dissolved in
0.1 % HCl/water and loaded onto the column. Anthocyanins and polyphenolics were
adsorbed while sugars, acids, and other water-soluble compounds were removed by washing
the column with 2 vol. of 0.1 % HCl/water. Other polyphenolics were subsequently eluted
with ethyl acetate. Then anthocyanins were recovered with methanol containing 0.1 % HCl
(v/v). This acidified methanol fraction was evaporated using a rotary evaporator at 30 °C and
was stored at -20 °C prior to further analyses.

69
6.4. ANALYTICAL METHODS
6.4.1. THIN LAYER CHROMATOGRAPHY (TLC)
TLC was carried out on silica gel 60 F254 plates (Merck, Darmstadt, Germany) and
preparative TLC on silica gel GF plates (Analtech, Newark, USA). As eluent the upper phase
of the mixture n-butanol:acetic acid:water (BAW) was used, with ratio 4:1:5 [Kuskoski et al.,
2003; Pomar et al., 2005]. The sample spots on the chromatogram were detected by using an
UV lamp (254 nm) and the naked eye.
6.4.2. UV/VISIBLE SPECTROPHOTOMETRY
The measurements were performed on a Varian Cary 50 spectrophotometer, using
1 cm path length cells. Absorption spectra were taken in water, methanol or KCl buffer
(pH=1). The total anthocyanin content was measured by the pH-differential method (see
Chapter 5.4.2) [Giusti and Wrolstad, 2000].
6.4.3. HIGH PERFORMANCE LIQUID CHROMATOGRAPHY (HPLC)
HPLC was performed according to a method described in literature [Kuskoski et al.,
2003] with small modifications. The mobile phases consisted of A: acetonitrile and B: 5 %
glacial acetic acid, 10 % acetonitrile, 5 % methanol, 80 % water (v/v/v/v). The flow rate was
4 mL/min and the injection volume 50 μL. The method was as follows: linear gradient from 0
to 22 % A for 35 min, 22 % A for 15 min and the last 20 min from 22 % to zero A. The
detection was set at the wavelength 280 and 520 nm.
6.4.4. MASS SPECTROMETRY (MS)
The measurements were taken in positive ion mode. The sample was dissolved in
acetonitrile or methanol, 10-10 μL was taken out and diluted with 200 μL formic
acid/acetonitrile (50% v/v) and with 200 μL formic acid/water (50% v/v).

70
6.5. RESULTS AND DISCUSSION
6.5.1. ANALYSIS OF THE UN-PURIFIED EXTRACTS
The MS spectra of the malvidin-chloride standard, shows the dominant peak of
malvidin, with molecular weight (MW) of 331 (for chromatograms see Appendix XIV-XVII).
Malvidin is the main anthocyanidin of grapes mainly present in mono-glycosilated form. The
un-purified extracts were analyzed by the same mass spectrometer in order to investigate the
presence of the main anthocyanins of the grapes. By the V06 and V07 samples neither the
peak of malvidin, nor any other peaks of different anthocyanins or derivatives were observed
(table of MWs of anthocyanins: [Giusti et al., 1999b]). By the NG sample a small peak at
MW=579 indicated the presence of pelargonidin glycosilated with rutinose.
However, the absence of the fragments could be due to low resolution and/or small
concentration of the anthocyanins in the samples. The UV/Vis spectra showed some
absorption in the region 500-580 nm, which could indicate the presence of some
anthocyanins. The colour of the samples was brownish-red, which also suggested the
presence of the anthocyanins or derivatives. The UV/Vis spectra of the samples NG, V06 and
V07 after 6 months of storage are presented in Appendix XVIII. The TA contents of the
samples (mg/g sample), measured by the pH-differential method, were the following: 2.8 for
NG, 3.1 for V06 and 1.0 for V07. These results showed that during storage the TA content of
the extracts decreased. The same samples were measured 6 months before, when the TA
contents were the following: 6.9 for NG, 7.7 for V06 and 2.8 for V07 (mg/g sample). This
means 59 %, 60 % and 64 % decrease in the TA content in 6 months, respectively.
6.5.2. PURIFICATION BY COLUMN CHROMATOGRAPHY
The NG sample was purified by column chromatography. The mass spectrum of the
methanol fraction (see in Appendix XIX) showed a small peak which indicated the presence
of petunidin (MW=317). The UV/Vis spectrum suggested the presence of some anthocyanins,
as well (see in Appendix XIX). The methanol fraction was analysed by HPLC. The analysis
did not show any anthocyanin or derivative, even though injection of a malvidin standard
proved the method (Fig. 21).

71
0
200
400
600
800
1000
1200
1400
0 10 20 30 40 50 60
time (min)
mA
U a
t 520
nm
Figure 21: HPLC spectra of the of malvidin chloride standard solution.
6.5.3. ANALYSIS OF “FRESH SAMPLE”: GRAPE SKIN EXTRACT (GS)
In order to continue the research, other source of anthocyanins had to be searched.
For this purpose grape was purchased from the local market and the skin was extracted (see
6.2). The TA content of the grape skin extract (GS) was 0.9 mg/g sample, which was
considered to be very low. The mass spectra did not reveal any peaks of anthocyanins or
derivatives. However, the colour of the GS was bright reddish indicating the presence of the
pigments. The sample was subjected to column purification which resulted in interesting
results. At the mass spectra of the purified GS sample (methanol fraction) peaks of malvidin
with pentose (MW=463) and with hexose (MW=493) can be observed. The UV/Vis spectrum
of the sample shows a maximum at 520 nm (which is for malvidin). The graphs are shown in
Appendix XX.
6.6. CONCLUSIONS
The results show that for the extraction/isolation of the individual anthocyanins the
sources have to be well selected. Not appropriate storage conditions can also lead to
degradation of the compounds. In the case of the fresh skin, the low amount of the
anthocyanins might be due to the variety, early harvest or bad storage.

72
7. FORMULATION WITH CPF™
7.1. MATERIALS AND METHODS
The carrier materials were purchased from Degussa GmbH (Düsseldorf, Germany).
All the reagents and solvents were obtained from Merck (Darmstadt, Germany). The red
grape marc (variety of Refošk) used in the present study was kindly donated by Vinakoper
(Slovenia). The grape was harvested and processed for wine in 2005. The marc was dried in
vacuum dryer at 50°C, milled and stored in a cool and dry place. The moisture of the sample
determined by Karl-Fischer method was 2.6 %. The grape marc extract was prepared in a
pilot-scale extractor of 3 m3, extracted with 50 wt % acetone (in mixture with water) and a
solvent-to-solid ratio of 20 L/kg at 60 °C for 2 h. The total phenols and total monomeric
anthocyanins were measured as described in 5.4. The colour of the obtained CPF™ products
were evaluated as described in 2.4.2 using a colorimeter (Chromameter CR-400, Konica
Minolta Sensing, INC). The particle size was determined by Fritsch Particle Size analyser.
The shape and surface characteristics of the particles were observed by Scanning Electron
Microscopy (SEM).
7.2. EXPERIMENTAL APPARATUS AND PROCEDURE
For the CPF™ experiments the extract solution was prepared as follows: extract of
grape marc was dissolved in solvent (water or 50 wt % ethanol-water mixture). The
concentrations of RF extract were 1 wt %, 10 wt % and 30 wt % in solvent. In the case of
50 wt % ethanol solution, the effect of the change of the pH value on colour was investigated
by setting the pH value to 1 using citric acid. As carrier material modified silica and starch
were used. The details of the experiments are listed in Appendix XXI. Figure 22 shows the
flow scheme of the CPF™ plant. The solution was filled into the autoclave. CO2 was dissolved
in the extract solution at a pressure ranging from 10 to 18 MPa at ambient temperature. The
carrier was filled into a vessel. The carrier was dozed to the spraying zone by an additional
CO2 cylinder with a pressure of 0.1 to 0.2 MPa. An inert atmosphere was provided by leading
N2 to the system. The solution formed in the autoclave was depressurized over a nozzle into
the spray tower. Due to the rapid expansion of the gas the liquid was disintegrated into very
fine droplets. Concurrently the solid, powderous carrier was added to the spraying zone. The
turbulence in the tower, caused by the expanding gas led to an intensive mixing of the
droplets and the solid carrier. The coarse fraction was collected at the bottom of the spray
tower while the fine fraction was obtained in the cyclone.

73
Figure 22: Flow scheme of the CPF™ apparatus.
7.3. RESULTS AND DISCUSSION
The experiments were started with a low concentration of the anthocyanin pigments
in the solvent (for experimental details see Appendix XXII). The Refošk extract was 1 wt% in
the water. Powder with 42 wt% liquid content was obtained, using silica as a carrier (Sipernat
500LS). The bigger nozzle size resulted in a higher liquid/carrier ratio (66-68 wt% loadings
on the carrier), but also required higher pressure for the delivery of the carrier. When the
carrier was not sufficient, the obtained powder was wet and the product could not be
collected and measured. The spraying pressure did not have significant effect. Different type
of silica (Sipernat 22LS) did not change the behaviour. Due to the low concentration of the
extract the obtained products remained white as the original silica. The higher concentrations
of RF in solvent (10 wt %) resulted in a homogenously coloured powder (Table 8). The nozzle
size of 0.2 mm and pressures for carrier delivery of 0.11-0.18 MPa were sufficient. Important
was the proper cleaning of the plant after each experiment, because such as blockage of the
nozzle can cause an unsuccessful spraying. For example, when the liquid was spraying just
from one outlet of the nozzle (due to blockages of the other outlets), the mixing with the
carrier was not sufficient and resulted in a very wet, not measurable powder (Appendix XXI:
Sample CPF™-RF 8).

74
The nozzle size of 0.3 mm was also working well with carrier delivery pressures of
0.11-0.15 MPa, and powders with up to 65 wt% liquid loadings were obtained. When ethanol-
water mixture (50 wt %) was used as the solvent for the extract, more intensive colour was
observed than in the case of pure water. The sensory properties of the obtained products were
also better. Powders up to 60 wt% loadings were produced with pressures of 12-15 MPa and
carrier delivery pressures of 0.11-0.15 MPa (nozzle size 0.3 mm). During these experiments
an inert atmosphere was provided by leading N2 into the system while spraying. In the CPF™
experiments starch as a carrier was not successful, because the obtained powder was sticky
and wet (Appendix XXI: Samples CPF™-RF 21 and 22). Anthocyanins at an acidic pH value
are present in the most coloured form (flavylium cation), thus by adding acid to the extract
solution the colour was shifted towards ‘redness’. By increasing the concentration of the
extract in the liquid solution (to 30 wt %) the obtained powder was of more intense colour.
Table 8: CPF™ experiments with silica (Sipernat 22LS): pure carrier and the powderous
products. Extract concentrations in the liquid and solvent conditions.
Carrier: Silica
Extract conc. 10% Solvent: water
Extract conc. 10% Solvent: 50% ethanol
Extract conc. 10% Solvent: 50% ethanol
Acidified
Extract conc. 30% Solvent: 50% ethanol
Acidified
The obtained powders were dried and stored. Some of them were subjected to further
analysis. The particle size and distribution was measured and calculated and the morphology
was observed by Scanning Electron Microscope (SEM). The mean particle size was ~9 μm
(the Particle size distribution is shown in Appendix XXI). The SEM images reveal a very
porous structure (Fig. 23 - left). Due to the methodology of the CPF™ spraying, the silica

75
maintains its typical form and the liquid is adsorbed on the surface of the carrier. The liquid
also causes agglomeration of the smaller particles (Fig. 23 - right).
Figure 23: SEM images of the obtained CPF™ products. Left: porous particle, right:
agglomeration of some particles.
Figure 24: SEM spectra of CPF™ product. Four spectrum taken at different points of a
samples.

76
The electron microscope provides information also about the basic structure. It reveals the
spectrum of a particle with the relative amounts of carbon (C), oxygen (O) and silicon (Si)
atoms. The Figure 24 shows spectra of four different particles produced with CPF™. As seen,
the major part consists of silicon particles (the silica carrier), followed by oxygen and carbon,
which refers to the alcohol and RF extract.
The “visually” observed differences in the colour of the obtained CPF™ powders were
confirmed by the colorimetric measurements. The initial values of L, C and H of some of the
products are shown in Table 9. The 10 wt % extract solutions showed similar lightness values
(L≈60), while the 30 wt % solutions where darker (L≈50). Commonly used synthetic
colorants in FD&C (Food, Drug and Cosmetics) industry, such as Erytrosine and Allura red,
have L values around 70 [Wrolstad et al., 2005]. The hue angle of the non-acidified solution
was higher (35°) compared to the acidified samples (1-2°), which implies that by acidification
the colour was shifted to the red angle, towards 0°. Further, for the acidified samples, also the
chroma values showed higher saturation. The significant differences compared to the
synthetic colorants were observed by the values of chroma: for synthetic colorants around 70
and for the CPF™ product ranging from 10 to 22.
Table 9: Comparison of the initial colorimetric values of three CPF™ products (formulated
with silica carrier), and two commercial colorants.
Samples Liquid
/carrier (wt)
mg TA#/kg total
Lightness Hue
angle Saturation
Liquid: 10% RF in 50% ethanol
60/40 41 62 35 11
Liquid: 10% RF in 50% ethanol Acidified with citric acid
56/44 38 57 6 17
Liquid: 30% RF in 50% ethanol Acidified with citric acid
44/56 90 53 7 18
Synthetic colorant Erytrosine 72 39 70 Synthetic colorant Allura red 71 25 73 # Total anthocyanins (measured by pH-differential method) [Giusti and Wrolstad, 2000]
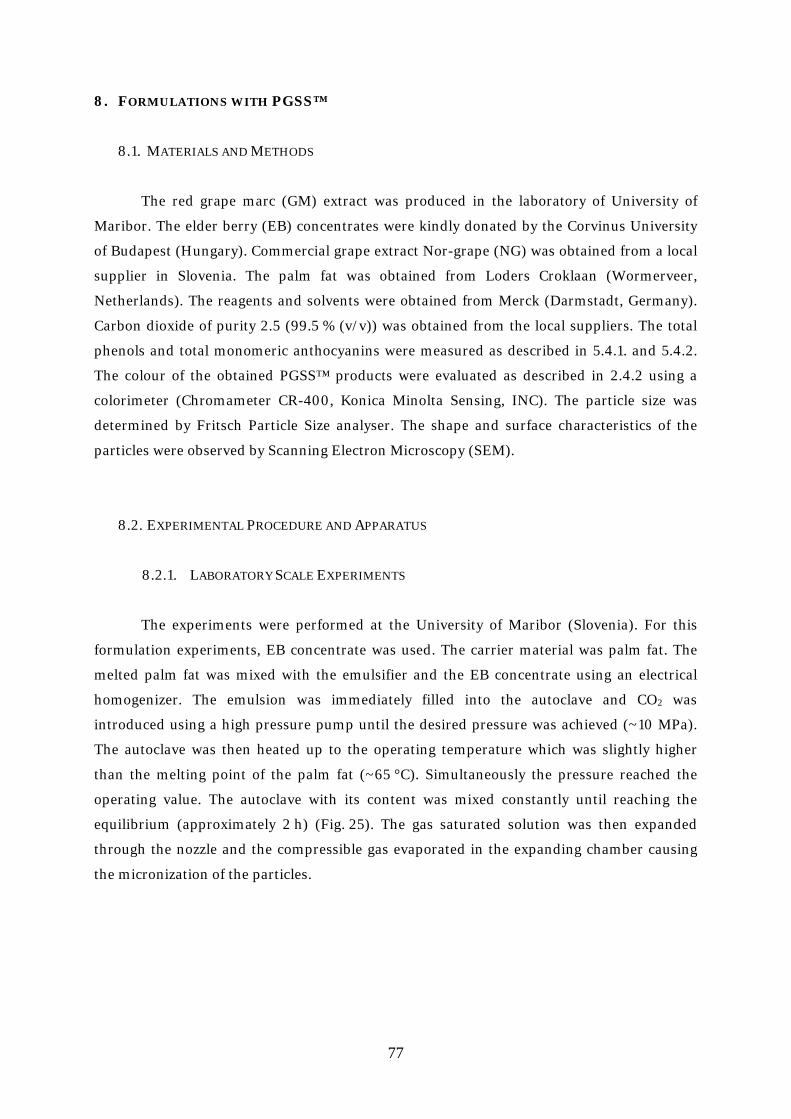
77
8. FORMULATIONS WITH PGSS™
8.1. MATERIALS AND METHODS
The red grape marc (GM) extract was produced in the laboratory of University of
Maribor. The elder berry (EB) concentrates were kindly donated by the Corvinus University
of Budapest (Hungary). Commercial grape extract Nor-grape (NG) was obtained from a local
supplier in Slovenia. The palm fat was obtained from Loders Croklaan (Wormerveer,
Netherlands). The reagents and solvents were obtained from Merck (Darmstadt, Germany).
Carbon dioxide of purity 2.5 (99.5 % (v/v)) was obtained from the local suppliers. The total
phenols and total monomeric anthocyanins were measured as described in 5.4.1. and 5.4.2.
The colour of the obtained PGSS™ products were evaluated as described in 2.4.2 using a
colorimeter (Chromameter CR-400, Konica Minolta Sensing, INC). The particle size was
determined by Fritsch Particle Size analyser. The shape and surface characteristics of the
particles were observed by Scanning Electron Microscopy (SEM).
8.2. EXPERIMENTAL PROCEDURE AND APPARATUS
8.2.1. LABORATORY SCALE EXPERIMENTS
The experiments were performed at the University of Maribor (Slovenia). For this
formulation experiments, EB concentrate was used. The carrier material was palm fat. The
melted palm fat was mixed with the emulsifier and the EB concentrate using an electrical
homogenizer. The emulsion was immediately filled into the autoclave and CO2 was
introduced using a high pressure pump until the desired pressure was achieved (~10 MPa).
The autoclave was then heated up to the operating temperature which was slightly higher
than the melting point of the palm fat (~65 °C). Simultaneously the pressure reached the
operating value. The autoclave with its content was mixed constantly until reaching the
equilibrium (approximately 2 h) (Fig. 25). The gas saturated solution was then expanded
through the nozzle and the compressible gas evaporated in the expanding chamber causing
the micronization of the particles.

78
Figure 25: Laboratory scale apparatus for PGSS™ - batch mode.
8.2.2. PILOT SCALE EXPERIMENTS
The experiments were done at the Ruhr-University of Bochum (Germany). For the
pilot scale formulation experiments GM, NG and EB concentrates were used. The carrier
material was palm fat. The melted palm fat was mixed with the emulsifier and filled to
vessel 1 where it was kept in molten state (~60-70 °C), while in vessel 2 the liquid
anthocyanin concentrate was thermostated to ~30 °C (for the flow scheme see Figure 26).
Both materials were compressed by pumps to the required pressure. In the mixing system
scCO2 was admixed under sufficient dissipation of energy to form micro droplets of the liquid
in the molten fat material. Subsequently the mixture was expanded through a nozzle into a
spray tower, forming fine droplets. The simultaneously expanded gas very rapidly removed
heat from the droplets (Joule-Thomson effect), so that the shell material solidified and
formed a firm shell around the micronized droplets of the liquid, thus generating a
powderous composite [Weidner et al., 2006]

79
Figure 26: Pilot plant for PGSS™ - continuous mode.

80
8.3. RESULTS AND DISCUSSION
The PGSS™ spraying of the palm fat was exhaustively investigated by Wendt in the
frame of his Ph. D. work at the Bochum Ruhr-University [Wendt, 2006]. The optimal
parameters of the high pressure micronization of the palm fat (Fig. 27) were determined and
the effect of different parameters was investigated. Successful encapsulation of water into the
palm fat using the PGSS™ process was demonstrated as well. The effect of the process
parameters on the density, particle size and morphology were shown. The varying process
parameters were the pre-expansion temperature, pre-expansion pressure, the mass flow-
rates of the palm fat, water and the carbon-dioxide.
Figure 27: Palm fat micronized by PGSS™ technology
Since the anthocyanins are water soluble pigments, their concentrates have high
water content and the extracts have good water solubility. Therefore to investigate the
PGSS™ encapsulation of different anthocyanin solutions with palm fat, the process
parameters like pre-expansion temperature and pre-expansion pressure were set as fix
parameters. The pressure and temperature, which were optimized by Wendt, that result in a
free flowing, good quality powder were chosen. The varying parameters were the types of the
anthocyanin concentrates, their concentrations, the mass flows of the carrier and the liquid
to be encapsulated. The summary of the performed experiments is shown in Appendix XXII.
8.3.1. ELDER BERRY (EB) WITH PALM FAT
The obtained products were homogeneous free flowing powders with colours from
light pink to violet, as observed by the naked eye. In Table 10 some samples are shown. By
increasing the liquid/carrier ratio (from left to right picture) the resulted product was more
coloured, according to the increased pigment content in the powder.

81
Table 10: Powderous products of PGSS™ micronization: Elder berry concentrate with palm
fat.
Liquid/carrier
5/95 (wt)
Liquid/carrier
10/90 (wt)
Liquid/carrier
20/80 (wt)
Liquid/carrier
30/70 (wt)
Liquid/carrier
41/59 (wt)
Liquid/carrier
50/50 (wt)
The bulk densities increased with increasing the liquid/carrier ratio and ranged from
61 to 101 g/L, while the tapped densities were from 95 to 155 g/L. At the original,
unprocessed palm fat, bulk density of 379 g/L and tapped density of 497 g/L were measured.
The bulk and the tapped density of the sprayed palm fat without anthocyanins were 99 and
137 g/L, respectively. The particle size varied from 7 to 18 µm. The higher was the liquid
content on the carrier, the smaller were the particle sizes. The unprocessed palm fat’s particle
size was 384 µm, while by the palm fat sample sprayed with the same operating conditions,
but without anthocyanin, 11.6 µm particle size was measured. The Appendix XXIII shows the
Probability density (1/μm) vs. particle size (µm) of some of the obtained powders (5, 20 and
42 wt % liquid on the carrier). Relatively narrow particle size distribution was observed.
Scanning Electron Microscope pictures show an amorphous structure, neither
spherical, nor needle-like particles were observed (Table 11). According to Wendt the highest
influence on the morphology of the palm fat-water-particles has the gas-to-product-ratio
(GPR (w/w)) and the expansion temperature [Wendt, 2006]. In each case the structure is
very porous. In this work the GPR varied from 0.8 to 1.3 and the expansion (spraying)
temperature from 17 °C to 20 °C. To obtain spherical particles GPR of 0.1 was set by Wendt.
Also higher temperatures in the spray tower are required, however in the case of a natural
extract the increased temperature may result in the degradation of the sensitive compounds.
According to Rodrigues et al. at pre-expansion pressures of 12-14 MPa it is more likely to
obtain particles with irregular shapes [Rodrigues et al., 2004]. Since the SEM pictures do not
show colour, upon the visually observed colour of the powders, it is assumed that the
anthocyanin concentrate adsorbed on the surface of the palm fat carrier.

82
Table 11: Morphology and particle size of three different PGSS™ products: anthocyanin
concentrates with palm fat by 5, 20 and 42 wt % liquid/carrier ratios.
Liquid/carrier ratio (wt): 5/95 Particle size: 15.6 µm
Liquid/carrier ratio (wt): 20/80 Particle size: 9.5 µm
Liquid/carrier ratio (wt): 42/58 Particle size: 7.7 µm
The objective colour indications are represented by the CIE parameters, which can be
seen in the Table 12. Six different samples are presented, where the amount of the liquid
anthocyanin-concentrate on the powderous carrier was varied. The liquid concentrations in
the powders were 5, 10, 20, 30, 40 and 50 wt %. Naturally, as the liquid concentration was
increased, the amount of total anthocyanins in the powder increased, resulting in a darker
coloured powder. Therefore, the lightness values of the samples decreased from 94 to 67.
Parallely, the colour saturation of the samples increased, showing values from 6 to 13. The
hue angle values do not follow that trend. By the samples of 5, 10, 20 and 30 wt % liquid
20 μm
20 μm
20 μm

83
concentrations, with the increasing amount of anthocyanins, the hue angle values decreased
(shift from yellow angle towards red). By the samples of 41 and 50 wt % liquid content, the
hue angle values slightly increased again, showing values of 41 and 52, respectively.
Table 12: The CIE colour properties of some PGSS™ samples: Elder berry.
Sample code
Liquid/carrier ratio
wt
mg TA# per
kg carrier Lightness Hue angle Chroma
M3 5/95 333 93.9 83.2 6.0 M4 10/90 666 90.2 64.2 6.7 M5 20/80 1332 83.2 52.1 8.2 M6 30/70 1998 74.8 40.7 11.2 M8 41/59 2378 72.6 40.9 11.1 M10 50/50 2737 66.9 51.8 13.4
# Total anthocyanins (measured by pH-differential method)
However, the colour parameters represent the samples with all three values; the
change in the lightness causes change in the saturation of the colour, which also modifies the
hue angle and vice versa. For example, synthetic colorants often used as food colorants for
achieving pink-red colour as erythrosine and allura red, have the lightness values of ~70 and
hue angle values of 39 and 25, respectively [Giusti and Wrolstad, 2003]. These values are
comparable with the values of our PGSS™ products; however the significant difference is by
the values of chroma, which are ~70 for the synthetic colorants (see Table 9). The arrears of
the natural colorants could be due to the carrier material as well, since the palm fat used for
the experiments originally has a white colour, which softens the bright colour of
anthocyanins.
8.3.2. GRAPE (NG) AND GRAPE MARC (GM) EXTRACTS WITH PALM FAT
In the PGSS™ process palm fat was successfully sprayed with grape marc extract as
well. For comparison, a commercially available grape extract (NG) was tested also. In each
case homogeneous, free flowing powders were obtained (Fig. 28). According to the different
types of extract and the different concentrations of the extract in the solution, the visually
observed colour of the products varied from light pink to darker red-brownish. As pre-
experiments commercial wine and its concentrate was sprayed with palm fat, in order to
evaluate the behaviour of the anthocyanins of grape in solution of water/ethanol.
The bulk and tapped densities of the - GM/NG with palm fat - powders were in the
range of 63-103 g/L and 99-161 g/L, respectively. The densities increased with the increasing
liquid/carrier ratio. At the original unprocessed palm fat bulk density of 379 g/L and tapped

84
density of 497 g/L were measured. The bulk and the tapped density of the sprayed palm fat
without anthocyanins were 99 and 137 g/L, respectively.
Figure 28: PGSS™ powders: grape marc extract with palm fat. Anthocyanin concentration
increasing from left to right.
With increasing the liquid content on the carrier, the particle size of the powders
decreased. The unprocessed palm fat’s particle size was 384 µm, while the particle size of the
palm fat sample sprayed at the same operating conditions, but without anthocyanin was
11.6 µm. The average particle size varied from 8 to 18 µm. The particle size distribution is
relatively narrow as seen on the graph in Appendix XXIV (Probability density (1/μm) vs.
particle size (µm) of some of the obtained powders (5, 35 and 40 wt % liquid on the carrier)).
Interestingly, the wine-palm fat composites had higher particle sizes, such as 23-26 µm
(5 wt% liquid content on the carrier).
The morphologies of the obtained - grape with palm fat - powders showed more
variety than those observed by palm fat with elder berry. Similarly, the particles were very
porous and mostly amorphous; however some of them were also spherical-like. In the
Table 8 some morphologies are shown where the spherical shapes are well seen. In this cases
the GPR (w/w) were from 0.8 to 1.4, while the spray tower temperature was in the range of
17-18 °C. In this case the obtained morphologies do not show correlation with these
parameters.

85
Table 13: Morphology and particle size of four different PGSS™ products: concentrated wine
with palm fat of 5 and 29 wt % liquid/carrier ratios and grape marc extract with palm fat of 5
and 37 wt % liquid/carrier ratios. GPR: Gas-to-product ratio (w/w).
Concentrated wine with palm fat
Liquid/carrier ratio (wt): 5/95
Particle size: 23.7 µm GPR: 1.18
Grape marc extract with palm fat
Liquid/carrier ratio (wt): 5/95
Particle size: 16.1 µm GPR: 1.34
Concentrated wine with palm fat
Liquid/carrier ratio (wt): 29/71
Particle size: 9.5 µm GPR: 0.77
Grape marc extract with palm fat
Liquid/carrier ratio (wt): 37/63
Particle size: 8.2 µm GPR: 1.2

86
Table 14: Colorimetric values (L, H and C) of some PGSS™ formulated products. Liquid:
grape marc (GM) and commercial grape (NG) extract in 50 wt % ethanol-water or in water.
Sample code
Extract conc. in solvent
wt%
Liquid/carrier ratio (wt)
mg TA# per
kg carrier Lightness
Hue angle
Saturation
GM1 10* 5/95 10 95.5 48.3 2.3 GM2 50* 5/95 48 89.9 31.1 4.4 GM3 20 35/65 133 83.5 55.3 9.2 GM4 20 37/63 141 85.9 62 9 GM5 50 40/60 378 67.4 42.2 12.4 GM6 50 48/52 460 66.8 57.6 14.7 GM7 50$ 39/61 373 65.5 20.9 13.5 GM8 50$ 49/41 468 51.9 17.5 18.1 NG1 10* 5/95 17 92.7 33.1 3.4 NG2 50* 5/95 85 92.5 30.6 4.6
* In water
# Total anthocyanins (measured by pH-differential method)
$ Liquid acidified with citric acid (1 wt %)
For the comparison of the colours of different products the CIE parameters can give
an objective measurement. In the Table 14 some samples - grape/grape marc extract with
palm fat - are listed which were subjected to colorimetric measurements. With the increase of
the pigment concentration in the powder the lightness values decreased, i.e. darker are the
products. The parallel observation can be made with the saturation of the colour; the higher
is the anthocyanin loading on the palm fat, the more intensive is the colour. The hue angle
values were measured in the range of 30-60° (0° red – 90° yellow). The acidification of the
anthocyanin solution resulted in the change of the hue angle values; as expected the colour
shifted towards redness (Hue angle of 17.5 and 20.9). The commercial grape extract showed
lower tinctorial strength than the grape marc extract. This can be seen by the L and C values,
where the NG samples with approximately similar TA content as GM samples, have lighter
colour and lower saturation. In comparison with the synthetic colorants - erythrosine and
allura red – the main difference is in the saturation of the colour, which could be due to the
carrier material as well. The white palm fat lighters and softens the bright reddish colour of
the grapes. The Table 15 shows the colour difference of the samples where the anthocyanin
solutions were acidified or not acidified. The non-acidified products are more brownish than
the acidified ones, where the reddish hue is more dominant (Table 15).
The PGSS™ samples were subjected to stability tests, which is discussed in
Chapter 11.
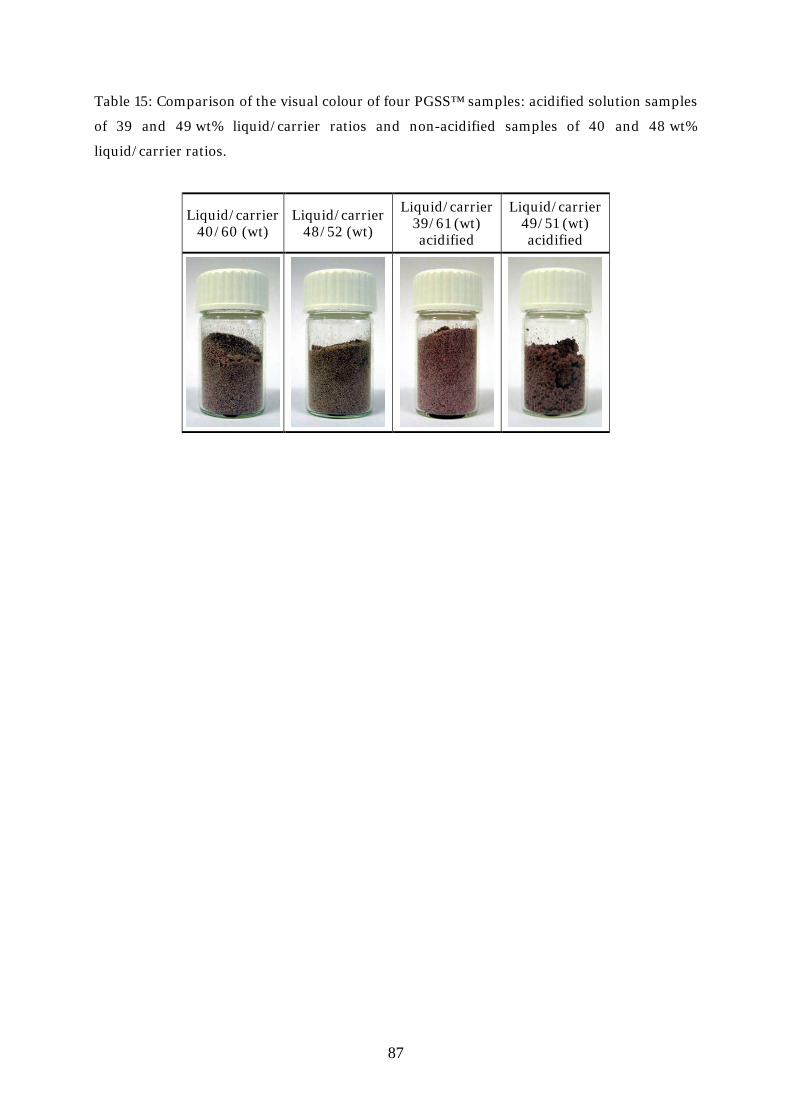
87
Table 15: Comparison of the visual colour of four PGSS™ samples: acidified solution samples
of 39 and 49 wt% liquid/carrier ratios and non-acidified samples of 40 and 48 wt%
liquid/carrier ratios.
Liquid/carrier 40/60 (wt)
Liquid/carrier 48/52 (wt)
Liquid/carrier 39/61 (wt) acidified
Liquid/carrier 49/51 (wt) acidified

88
9. FORMULATION WITH SAS
9.1. VIEW CELL EXPERIMENTS
Experiments in a high pressure view cell were performed in order to investigate the
phase behaviour of anthocyanins and supercritical carbon dioxide and a potential co-
precipitating material, prior the SAS experiments. Since the anthocyanin juice was a water
concentrate, different modifiers were considered to help the precipitation. For this purpose
acetone, methanol and ethanol were tested. According to Bouchard et al. the modifier has a
significant effect on the capacity of the process – precipitation from aqueous solution –, as
well on the type of the particles [Bouchard et al., 2008]. It was found out that methanol and
ethanol contributed to precipitation during the swelling stage by anti-solvent mechanism,
while acetone mainly affected the evaporation of the droplet, i.e. water removal. The two
mechanisms influenced the particle morphology as well.
Figure 29: High pressure “view cell” apparatus.
9.1.1. APPARATUS AND EXPERIMENTAL PROCEDURE
The black currant (BC) concentrate was kindly donated by the Corvinus University of
Budapest (Hungary). The PVP K-25 (MW=24000 g/mol) was purchased from Sigma-Aldrich.
The solvents and reagents were also from Sigma-Aldrich. The CO2 was obtained from SIAD
(Bergamo, Italy) with a purity of 99.98 %.

89
The apparatus (Figure 29) consisted of variable-volume equilibrium cell with a
sapphire window (total cell volume between 38.84 and 72.32 cm3). The cell was equipped
with a stirrer in order to achieve sufficient mixing of the phases. The CO2 was pumped using a
high pressure (NWA-Lorrach) pump. The view cell was heated by an electrical heating device
(Eurotherm 2216e), incorporated into the wall of the cell. The pressure was measured by
Druck DPI 280 pressure transducer (± 0.1 bar); and the temperature inside the cell by Delta
Ohm HD 9124 digital thermometer (± 0.1°C).
The view cell was thermostated to the working temperature 35 °C or 40 °C. A liquid
solution with known composition was filled into the view cell. The following compositions
were investigated:
Pure BC juice (35 °C),
5 wt % BC in mixture with acetone (40 °C),
5, 10, 20 and 30 wt % BC in mixture with methanol (40 °C),
5, 10, 20 and 30 wt % BC in mixture with ethanol (40 °C),
10 wt % PVP in ethanol (35 °C),
10 wt % PVP in ethanol (40 °C),
5 and 10 wt % PVP in ethanol (wt %) (40 °C),
2 and 5 wt % PVP in 5% water-95% ethanol (wt %) (40 °C).
The cell was pressurized with carbon dioxide using a high pressure pump. The pressure was
increased gradually until the desired pressure. At each observation point the solution was
mixed and 20-30 min was left for reaching the equilibrium. At the end of the experiments the
view cell was depressurized.
9.1.2. RESULTS AND DISCUSSION
BLACKCURRANT JUICE (BC) AND SCCO2
At the temperature of 35 °C by increasing the pressure to 10 MPa no change in the
phase behaviour was observed. Precipitation of particles did not occur under these conditions
(for pictures see Appendix XXV).
BC-ACETONE-SCCO2
The behaviour was observed at 40 °C with a mixture of BC and acetone of 5/95 (wt).
The limited miscibility of acetone and water was visible in the initial solution, i.e. the dark
red BC juice became pale pink. The increasing pressure promoted the phase separation of
acetone and water; at ~4.5 MPa 3 phases were observed: acetone-water-CO2. Further

90
increasing the pressure the acetone formed a fluid phase with the CO2 and water remained as
liquid, thus resulting in a 2-phase system (for pictures see Appendix XXV).
BC-METHANOL-SCCO2
Another modifier investigated was: methanol. Addition of methanol to the BC juice
(5/95 wt) resulted in an immediate precipitation of sugars. The addition of CO2 and increase
in the pressure led to an increase in the amount of the sugar precipitates. The higher
concentration of BC (10/90 and 20/80) resulted in higher amount of initial precipitated
sugars; which further increased by the increase of the pressure and addition of carbon
dioxide (for pictures see Appendix).
For further experiments the anthocyanin-methanol solutions were prepared in
advanced and the solution was left that the sugars precipitate. Only the red liquid phase was
taken for view cell experiments. The concentrations of 5/95, 10/90, 20/80 and 30/70 of
BC/methanol were investigated. At the concentration of 5/95 the pressure was increased to
19 MPa, while the temperature was kept constant at 40 °C. Increasing the pressure, at
~5 MPa some dark particles were observed at the bottom of the view cell. At pressure
~12 MPa the methanol formed a fluid phase with the CO2 and the anthocyanin-water phase
remained as liquid. Further increasing the pressure up to 18.8 MPa, no significant change in
the behaviour was observed. When applying the higher BC/methanol ratio mixtures, the
similar behaviour was noticed. Some sugar precipitates appeared. Probably due to the
increased pressure, the remained sugars precipitated. Dark coloured precipitates were
noticed in these cases as well.
BC-ETHANOL-SCCO2
Considering the further investigations of SAS, another modifier was tested and
compared. According to literature ethanol acts similar to methanol, however it is less toxic
and more favoured in food applications. The phase behaviour was investigated at 40 °C by
increasing the pressure to 15 MPa. Similar behaviour was observed as by methanol. At
~7 MPa the colour changed to brighter, probably due to the dissolved CO2 and the structural
change of anthocyanins at acidic pH value. At 8 MPa 3 different phases were present, as seen
in the picture (for pictures see Appendix XXV). By further increasing the pressure, the
ethanol formed a fluid phase with the CO2, while “water” droplets were dispersed forming a
liquid phase. Increasing pressure up to 15 MPa no significant changes were observed.
PVP-ETHANOL-SCCO2
The phase behaviour was investigated at 35 °C and at 40 °C increasing the pressure to
10 MPa. The PVP concentrations in the ethanol were 5 and 10 wt %. By increasing the

91
pressure, at ~7.8 MPa the system showed 3 phases. The “precipitate” however was not
powderous-solid, but gel-liquid type. Further increasing the pressure, the solvent formed a
single fluid phase with the CO2, resulting in a 2-phase system: PVP and EtOH-CO2. The same
behaviour was observed at both temperatures with both concentrations of PVP.
PVP-WATER-ETHANOL-SCCO2
In order to simulate the behaviour of PVP in BC/EtOH with scCO2, different
concentrations of PVP (2 and 5 wt %) were solubilized in water-ethanol mixtures of 5/95 (wt)
and subjected to the view cell. Carbon dioxide was led to the system and the pressure was
increased to 12-15 MPa, while the temperature was kept at 40 °C. The behaviour was similar
to those observed by the PVP-EtOH-CO2 system. By increasing the pressure, at ~7 MPa the
PVP-water separated, thus the system showed 3 phases. By further increasing the pressure,
the ethanol formed a single fluid phase with the CO2, resulting in a 2-phase system: PVP-
water, as liquid (or gel) and EtOH-CO2 as fluid. By further increasing the pressure no changes
were observed.
9.2. SUPERCRITICAL ANTISOLVENT PRECIPITATION (SAS)
9.2.1. MATERIALS AND APPARATUS
The black currant concentrate was kindly donated by the Corvinus University of
Budapest (Hungary). The PVP K-25 (MW=24000 g/mol) was purchased from Sigma-Aldrich.
The solvents and reagents were also from Sigma-Aldrich. The CO2 was obtained from SIAD
(Bergamo, Italy) with a purity of 99.98 %.
The apparatus (Fig. 30) consisted of a precipitator (AISI-316 steel, internal diameter
of 50 mm and a height of 200 mm, with internal volume of 400 cm3). The precipitator was
equipped with a heating jacket ensuring temperature to be kept within ±0.5°C. The liquid
was sprayed into the precipitator through a nozzle with a diameter of 100 μm (Lechler
212.004.17.AC).

92
Figure 30: SAS apparatus
The liquid was pumped with a ConstaMetric 3200 P/F high pressure pump and the CO2 with
a NWA pump. Before the inlet of the precipitator the CO2 and the liquid solution were led
through a thermostated water bath to obtain the temperature of the reactor. Both, the
solution and CO2 were added to the cell from the top, resulting in co-current flow. The outlet
flow was filtered with a 0.5 μm filter to prevent precipitate to leave the precipitator. The
regulation of flow rate was done with a valve (Whitey SS-21RS4), which was heated by an
electric resistance heater in order to prevent freezing. The precipitator was furthermore
equipped with a safety valve (Swagelok SS-4R3A-EP, 10.0-15.5 MPa) to prevent the pressure
inside the cell to exceed 12.5 MPa. The temperature inside the reactor was controlled by a
thermometer (Delta Ohm HD 9214) and the pressure was measured with a pressure
transducer (Druck DPI 280). A cold trap was installed between the heated expansion valve
and the flow meter to condense the solvents. Pressure and CO2 flow rate were manually
controlled by adjusting the displacement of CO2 metering pump and aperture of the
expansion valve.
9.2.2. SCANNING ELECTRON MICROSCOPY (SEM)
The shape and the surface characteristics of the samples were observed by SEM at
University of Trieste. Samples were sputter-coated with Au/Pd using a vacuum evaporator

93
(Edwards, Milano, Italy) and examined using a scanning electron microscope (Leica
Stereoscan 430i) at 10 KV accelerating voltage using the secondary electron technique.
9.2.3. DIFFERENTIAL SCANNING CALORIMETRY (DSC)
The measurements were carried out using a differential scanning calorimeter DSC 92
Setaram. The samples were placed in a pierced aluminium pans and heated at a scanning rate
of 5 °C/min from 40 °C to 200 °C under air atmosphere.
9.3. EXPERIMENTAL PROCEDURE
The precipitator was thermostated to the working temperature. Meanwhile the
sample solution was prepared as follows: 10 wt% PVP was dissolved in ethanol or ethanol-BC
mixture. Injection of feed (liquid) solution was only started when operating parameters, i.e.
pressure, temperature and CO2 flow rate reached the steady state. When the desired amount
of the liquid was fed, the liquid pump was stopped and only pure CO2 was led into the
precipitator. The flow of CO2 was maintained during a period long enough for the complete
removal of the residual solvent from the precipitator. After decompression, particles were
collected and stored in a cool and dark place. The operating parameters were temperature
(35-40 °C), pressure (8-10 MPa), solution feed flow rate (0.15-0.5 mL/min) and drying time
(30-60 min). These were optimized in order to achieve precipitations of the PVP particles.
The concentration of PVP in the solution was kept constant and was 10 wt %, since higher
concentrations were found to be too viscous and difficult to handle.
9.4. RESULTS AND DISCUSSION
9.4.1. PVP PRECIPITATION FROM ETHANOLIC SOLUTION
Fine powder of PVP from pure ethanol solution was obtained at 35 °C and at 10 MPa.
The solution feed of 0.2-0.3 g/min, ratio CO2/solution of ~3 (wt) and 30 min of drying was
proved to be sufficient for obtaining precipitates (for further data see Appendix XXVI). No
precipitation was observed at higher solution flow rate or lower pressure, since the scCO2 was
not enough to remove the total solvent. At higher temperatures the polymer plasticized,
which resulted in a gel cover on the bottom of the precipitator. The morphologies were
observed by SEM and the Table 16 shows the original un-processed PVP and PVP

94
precipitated from ethanol solution. Particles with irregular shapes were precipitated by SAS
in the case of high solution feed flow rate. Well-defined spherical form particles were
obtained at lower solution feed and additionally, particle size reduction was achieved.
The differential scanning calorimetry of the un-processed PVP is shown in Fig. 31. The
sample was dried in oven in order to evaluate if the moisture content has effect on the sample
behaviour. Both samples show a broad endothermic peak between 110 °C and 130 °C.
Table 16: Morphology and particle size observed by SEM of the original PVP and PVP
precipitated by SAS from ethanol solution with different conditions.
Original PVP-K25 d~60 μm
10 % PVP (EtOH) 10 MPa 35 °C
0.5 mL/min d~300 μm
10 % PVP (EtOH) 10 MPa 35 °C
0.25 mL/min d~60 μm

95
The SAS precipitated PVP from ethanolic solution (10 MPa, 35 °C) showed similar
DSC pattern, however a slight shift of the endothermic peak was observed (Fig. 31). The glass
transition temperature (Tg) of PVP does not effect the precipitation since it is much higher
than room temperature. According to Kikic et al. the PVP K-25 has Tg of 161 °C, which
decreases when processed under high pressure conditions. Additionally, at high pressure a
so-called retrograde vitrification occurs, i.e. two Tg points appear [Kikic et al., 2003]. The
transition temperatures measured by Kikic et al. are shown in Table 17.
Table 17: Tg of PVP K-25 measured by inverse gas chromatography (IGC) technique [Kikic et
al., 2003]
Pressure Tg1 Tg2 (MPa) (°C) (°C)
0.1 161 - 8 100 80
8.5 100 79

96
-25
-20
-15
-10
-5
0
5
30 50 70 90 110 130 150 170 190
Temperature (°C)
Hea
t Flo
w (m
W)
PVP K25PVP K25-dried in ovenPVP K25-precipitated from EtOH
Figure 31: The DSC curves of the original PVP, the PVP which was dried in oven prior the
analyses and PVP precipitated from ethanol (EtOH) solution by SAS.
9.4.2. PVP PRECIPITATION FROM ETHANOL-BLACKCURRANT MIXTURE
Particles of PVP precipitated from ethanol-blackcurrant juice mixture were obtained
at the following conditions: pressure of 10 MPa, temperature of 35 °C, solution feed flow rate
of 0.25 mL/min and BC/ethanol ratio of 5/95 (wt) (for more data see Appendix XXVI). The
CO2/liquid solution ratios were ~4 (wt), slightly higher compared to those precipitated from
pure ethanol. This is not surprising, since water has to be removed also. Drying time of
45 min was sufficient for the complete removal of the solvents. At higher BC/ethanol ratios
the water resulted in gelling the polymer. However, the higher concentration of the
anthocyanins was visually observed by the samples, indicating the presence of the pigments.
The water removal can be illustrated in process capacity diagrams [Bouchard et al.,
2008]. Here, the x axis shows the antisolvent capacity of the extraction medium and the y
axis represents the water fraction in the extraction medium (Fig. 32). The equilibrium data
are taken from literature, and were plotted and fitted with a solid line [Durling et al., 2007].
The experimental data resulting from SAS are plotted with red squares. The process capacity

97
diagrams of CO2-EtOH-water show that successful precipitation was achieved when working
in the 1-phase region (supercritical), and when there were 2 phases present (supercritical and
liquid) the PVP did not precipitate. The same can be observed when plotting the
experimental data on ternary phase diagrams of CO2-EtOH-water (Fig. 33).
0.000
0.010
0.020
0.030
0.040
0.000 0.030 0.060 0.090 0.120
mol EtOH/(mol CO2+mol EtOH)
mol
H2O
/(mol
CO
2+m
ol E
tOH
)
2-phase region
1-phase region
Figure 32: Process capacity diagram of CO2-EtOH-water system, resulting from SAS
precipitation of PVP from ethanol-BC solution, plotted as the water uptake capacity vs.
fraction of the modifier in the extractant. Equilibrium data plotted with blue diamonds
[Durling et al., 2007] and experimental data as red squares.

98
Figure 33: Ternary phase diagram at 35 °C and 10 MPa. Black circles: literature data [Gilbert
and Paulaitis, 1986]. Red circles: experimental results.
The SEM photos shown regular spherical particles, which tend to agglomerate
(Fig. 34). In comparison with the precipitation from pure ethanol solution or with the un-
processed PVP, a decrease in particle size to d~40 µm was observed. The structures show that
this method is potentially good for possible encapsulations.
Figure 34: SEM pictures of a SAS precipitate of PVP from ethanol-BC mixture (5/95 ratio wt).
Magnifications of 250X and 900X, left and right pictures, respectively.

99
The DCS curve of the PVP precipitated from BC/ethanol mixture of 5/95 ratio (wt) is
similar to the PVP precipitated from pure ethanol (Fig. 35). By the PVP precipitated from
BC/ethanol solution ratio of 10/90 (wt), an irregular sharp endothermic peak can be
observed at ~115 °C.
-25
-20
-15
-10
-5
0
5
30 50 70 90 110 130 150 170 190
Temperature (°C)
Hea
t Flo
w (m
W)
PVP-precipitation from BC/EtOH (5/95)
PVP-precipitation from BC/EtOH (10/90)
Figure 35: The DSC curves of the PVP precipitated from BC/EtOH solution mixtures of 5/95
and 10/90 (wt) ratios.

100
10. STABILITY TESTING
10.1. DEGRADATION INDICES OF THE ANTHOCYANINS
Indices for anthocyanin degradation can be derived from a few absorbance readings of
a sample, which has been treated with sodium bisulphite [Giusti and Wrolstad, 2000].
Anthocyanin pigments form a colourless sulphonic acid-adduct, while the polymerized
anthocyanins are resistant to bleaching by bisulphite. The absorbance at 420 nm of the
bisulphite-treated sample serves as an index for browning. Colour density is defined as the
sum of absorbances at the λvis-max and at 420 nm. The ratio between polymerized colour and
colour density is used to determine the percentage of the colour, which is contributed by
polymerized material. The ratio between A420nm and Aλvis-max can be used to determine the
degradation index.
The total anthocyanin content and the degradation indices of RF grape marc extracts
(stored in solid form) were tracked periodically during 55 days storage. Three types of
extraction were performed with 50 % (v/v) ethanol at 60 °C: using non-acidified solvent
(NA), solvent with pH=1.0 (A) and solvent with addition of natural antioxidant AquaRox 15
(X). 20 mg of extract was dissolved in 10 mL of distilled water. The sample was further
diluted with distilled water with the appropriate dilution factor. The same DF was used as for
the determination of total anthocyanins. 2.8 mL of the final diluted sample was transferred
into two cuvettes. 0.2 mL of bisulphite solution (1 g of potassium metabisulphite /K2S2O5/ in
5 mL of distilled water) was added to one of the cuvettes, and 0.2 mL of distilled water to the
other. The solutions were left to equilibrate for 15 min. The absorbances of both samples were
measured at 420 nm, 520 nm and 700 nm, against distilled water as a blank. Colour
densities, polymeric colours percentage, browning indices and degradation indices were
calculated from the measured absorbances.
From the absorbance of the samples treated with water, colour density and degradation index
(upon [Cevallos-Casals and Cisneros-Zevallos, 2004]) were calculated:
Colour density = [(A420 nm– A700nm) + (A520nm– A700 nm)] x DF (5)
where DF is the dilution factor (for example, if 2 mL sample is diluted to 10 mL, DF = 5)
Degradation index (DI) = [(A420 nm– A700nm) / (A520nm– A700 nm)] x DF (6)
From the absorbance of the bisulphite treated samples, polymeric colour and browning index
were calculated:

101
Polymeric colour = [(A420 nm – A700 nm) + (A520nm– A700 nm)] x DF (7)
Percent polymeric colour = (polymeric colour/colour density) x 100 (8)
Browning index (BI) = (A420 nm – A700 nm) x DF (9)
10.2. CHANGES IN LIGHTNESS (L), HUE (H) AND CHROMA (C)
The changes in the colour properties may give information about spoilage or change
in a food product, thus the measurements of the colour became very important not only in
the food sector, but also in the agro industrial and pharmaceutical sector. The colour
properties of a colorant are one of the most important characteristics, and to enable an
objective measurement of colour, different methods and technologies were developed. One of
the most common methods is the one proposed by CIE (already described in 2.4.2). A very
convenient, rapid method based on uniform colour spaces. The colorimeter measures the
parameters of L, a and b, which are then converted to L, H and C. In the last years this
method was introduced in many fields, also by tracking the colour in anthocyanin samples.
Anthocyanins, as they are natural pigment with bright, attractive colour, are very suitable for
these measurements. Anthocyanins’ degradation is one of the biggest drawbacks of their use
as natural colorants in foods and others, thus tracking the colour changes of anthocyanins
give information about their stability.
The obtained formulated products (CPF™ and PGSS™) were subjected to colorimetric
measurements. The initial values were compared in the related chapters. For information
about their colour stability the samples were monitored for prolonged time and colorimetric
measurements were taken periodically. The samples were stored at different conditions. They
were divided into two parts. One part was put to dark into refrigerator and the other part was
stored at ambient temperature and light. The colour stability was compared to non-
formulated extracts, which were stored at the same conditions as the formulated samples.
For colorimetric measurements the non-formulated extracts were prepared as solutions:
100 mg dissolved in 100 mL of 50 wt % ethanol. The formulated ones were measured as
powders.

102
10.3. RESULTS AND DISCUSSION
10.3.1. DEGRADATION INDICES OF THE OBTAINED EXTRACTS
During 2 months storage period of RF grape marc extracts, which were obtained with
50 % ethanol at 60 °C, and stored at -16 °C, the total anthocyanin content of the extracts was
measured periodically. In the case of non-acidified extraction medium the degradation of the
anthocyanins after 2 months was 6.5 %, while for the acidified it was 47 %. The kinetics of
total anthocyanin degradation is shown in Fig. 36. These results suggest that, even though
the anthocyanin yield is somewhat higher with acidified solvent, it should be avoided due to
higher degradation during storage. At same conditions, as using non-acidified solvent,
extraction with the addition of natural antioxidant (AquaRox 15) was investigated. The yields
were similar as for the non-acidified solvent (total phenols: 48.4 mg GA/g dry material and
total anthocyanins: 1.16 mg/g dry material), however, during the same storage time and
conditions, no degradation of anthocyanins was observed.
0.0
0.5
1.0
1.5
2.0
2.5
0 10 20 30 40 50 60
Days
mg/
g dr
y m
ater
ial
RF2: 50%EtOH, 60°C
RF3: 50%EtOH, 60°C, pH1 HCl
RF4: 50%EtOH, 60°C, Aquarox
Figure 36: Monitoring the stability of obtained extracts. Total anthocyanins (mg/g dry
material) vs time (days).

103
Comparison of the degradation indices of three different RF-06 extracts, obtained
with 50 % ethanol at 60 °C - non-acidified solvent (NA), solvent with pH adjusted to 1 (A),
and solvent with addition of natural antioxidant (X) – after 55 days storage are presented in
Table 18. The initial colour densities were in the following order: X > NA >> A, but the
decrease of colour density of X was faster and reached the same value as NA after 55 days.
Polymeric colour (expressed as percent of total colour density) is the indicator for
polymerized pigments. The highest initial % value was observed for A, followed by NA and X.
Table 18: Comparison of degradation indices (colour density, % polymeric colour, browning
and degradation index) in different grape marc extracts obtained with 50 % ethanol at 60 °C -
with non-acidified solvent (NA), with solvent pH value adjusted to 1 (A) and addition of
natural antioxidant (X) to the solvent -: initial values and values after 55 days storage (stored
at -16 °C).
INITIAL AFTER 55 DAYS OF STORAGE
Colour density
Pol. col. %
BI DI Colour density
Pol. col. %
BI DI
RF-06 extract (NA)
non-acidified solvent
3.34 ±0.02
77 ±10
1.77 ±0.15
1.57 ±0.10
2.86 ±0.26
69 ±2
1.26 ±0.17
1.25 ±0.04
RF-06 extract (A)
acidified solvent
2.01 ±0.12
92 ±3
1.33 ±0.12
2.00 ±0.13
1.72 ±0.11
90 ±1
0.98 ±0.01
1.40 ±0.18
RF-06 extract (X)
with natural antiox.
3.77 ±0.37
63 ±1
1.69 ±0.17
1.48 ±0.05
2.61 ±1.59
72 ±13
1.18 ±0.19
1.34 ±0.03
The higher polymeric colour is probably due to hydrolysis of the monomeric anthocyanins
during the acidified extraction and subsequent polymerization. During storage a slight
decrease in the polymeric colour was observed for NA and A, probably reaching the
equilibrium % polymeric colour during storage. In the case of the browning indices (BI), the
lowest values were observed for A, due to the fact that monomeric anthocyanins, which are
polymerized, do not degrade to brownish compounds. In wines, the colour change during
aging refers to different condensation reactions of the monomeric anthocyanins, giving the
wine its dominant colour, taste and astringency [Cliff et al., 2007]. Possibly, the similar
occurs with the pigments of the grape marc, which explains the decrease of degradation
index. However, the colour of the monomeric anthocyanins is replaced by the brownish-

104
yellowish colour of the condensed pigments, which limits their use as natural colorants for a
prolonged time.
10.3.2. CHANGES IN THE L, H AND C VALUES OF NON-FORMULATED PRODUCTS
The non-formulated extracts stored at the conditions as described above (10.2),
showed low stability in all colour parameters (L, H and C) during 15 weeks of monitoring. For
the extracts which were extracted with non-acidified solvent, the lightness increased from
around 40 to 50, while the increase was even higher for the extracts obtained with acidified
solvent (to 60 and above) (Fig. 37). For the samples which were stored in dark the increase
was slightly lower compared to the extracts which were stored at ambient light. The chroma
values –which represent the saturation of the colour– decreased for both extracts (Fig. 37).
The initial hue values for the extracts were 2 (non-acidified extraction solvent) and 15
(acidified extraction solvent). For both samples high increase in hue angle values was
observed, especially for the extracts which were stored at ambient temperature and light
(Fig. 37).
Lightness
0
10
20
30
40
50
60
70
80
90
100
0 2 4 6 8 10 12 14 16 18 20
time (weeks)
0=ab
solu
te b
lack
100=
abso
lute
whi
te
RF_lightRF_darkRF acid_lightRF acid_dark

105
Hue Angle
0
10
20
30
40
50
60
70
80
90
0 2 4 6 8 10 12 14 16 18 20time (weeks)
0° r
ed+9
0° y
ello
w
RF_lightRF_darkRF acid_lightRF acid_dark
Chroma
0
10
20
30
40
50
0 2 4 6 8 10 12 14 16 18 20
time (weeks)
RF_lightRF_darkRF acid_lightRF acid_dark
Figure 37: Lightness, Hue angle and Chroma values of the Refošk (RF) extracts obtained with
acidified and non-acidified solvents stored at dark and at light for 15 weeks.

106
10.3.3. CHANGES IN THE L, H AND C VALUES OF THE FORMULATED PRODUCTS
CONCENTRATED POWDER FORM (CPF™) PRODUCTS
During 21 weeks of storage no significant changes were observed in the colorimetric
values of all CPF™ samples stored at dark place and at ambient light. In general, the CPF™
formulated products showed better colour stability compared to the non-formulated extracts.
The values for the hue angle, chroma and lightness monitored for 21 weeks are shown in
Figure 38.
Lightness
0
10
20
30
40
50
60
70
80
90
100
0 5 10 15 20 25
time (weeks)
0=ab
solu
te b
lack
100=
abso
lute
whi
te
10% RF_light10% RF_dark10% RF acid_light10% RF acid_dark30% RF acid_light30% RF acid_dark

107
Hue Angle
-10
0
10
20
30
40
50
60
70
80
90
0 5 10 15 20 25
time (weeks)
0° r
ed+9
0° y
ello
w
10% RF_light10% RF_dark10% RF acid_light10% RF acid_dark30% RF acid_light30% RF acid_dark
Chroma
0
10
20
30
40
50
0 5 10 15 20 25
time (weeks)
10% RF_light10% RF_dark10% RF acid_light10% RF acid_dark30% RF acid_light30% RF acid_dark
Figure 38: Lightness, Hue angle and Chroma values of the CPF™ products stored at dark and
at light for 21 weeks. Concentration of Refošk (RF) extract in liquid: 10 wt % and 30 wt %.
Comparison of acidified (with citric acid to pH 1) and non-acidified extracts formulated with
silica carrier.

108
PARTICLES FROM GAS SATURATED SOLUTION (PGSS™) PRODUCTS
By the PGSS™ - elder berry concentrate with palm fat - no significant changes in the
colour values were observed during prolonged storage by the samples stored at dark
(Fig. 39). By the samples which were stored at light slight increase in the saturation of the
colour and some shift in the hue angle values were observed.
Lightness
0
10
20
30
40
50
60
70
80
90
100
0 10 20 30 40 50 60 70 80
time (weeks)
0=ab
solu
te b
lack
abso
lute
whi
te
M3_lightM3_darkM4_lightM4_darkM5_lightM5_darkM6_lightM6_darkM8_lightM8_darkM10_lightM10_dark

109
Hue Angle
0
10
20
30
40
50
60
70
80
90
0 10 20 30 40 50 60 70 80
time (weeks)
0° r
ed+9
0° y
ello
w-9
0° b
lue
M3_lightM3_darkM4_lightM4_darkM5_lightM5_darkM6_lightM6_darkM8_lightM8_darkM10_lightM10_dark
Chroma
0
5
10
15
20
25
0 10 20 30 40 50 60 70 80
time (weeks)
M3_lightM3_darkM4_lightM4_darkM5_lightM5_darkM6_lightM6_darkM8_lightM8_darkM10_lightM10_dark
Figure 39: Colorimetric values of the PGSS™ - elder berry with palm fat - products stored for
56 weeks at light-ambient temperature and dark-refrigerator. See sample codes in Appendix
(XXII).

110
The PGSS™ samples where grape marc extract or grape extract was formulated with
palm fat show similar pattern (Fig. 40). Stability in all colorimetric parameters was observed
for the samples which were stored at dark, but an increase in the saturation of the colour and
change in the hue angle values was observed for the sample stored at light. The possible
reason of this could be that as the colour shifts towards the yellow angle, the saturation of the
colour increase, i.e. the yellowish colour is more intensive, although it means also that the
reddish colour is disappearing. This change was more dominant for the acidified sample, as
seen in the Fig. 41.
Lightness
0
10
20
30
40
50
60
70
80
90
100
0 10 20 30 40 50 60 70 80
time (weeks)
0=ab
solu
te b
lack
100=
abso
lute
whi
te
GM2_lightGM2_darkNG2_lightNG2_darkGM3_lightGM3_dark

111
Hue Angle
0
10
20
30
40
50
60
70
80
90
0 10 20 30 40 50 60 70 80time (weeks)
0° r
ed+9
0° y
ello
w
GM2_lightGM2_darkNG2_lightNG2_darkGM3_lightGM3_dark
Chroma
0
10
20
30
40
50
0 10 20 30 40 50 60 70 80
time (weeks)
GM2_lightGM2_darkNG2_lightNG_darkGM3_lightGM3_dark
Figure 40: Colorimetric values of the PGSS™ - grape marc/grape extracts with palm fat -
products stored for 65 weeks at light-ambient temperature and dark-refrigerator. See sample
codes in Appendix (XXII).

112
Lightness
0
10
20
30
40
50
60
70
80
90
100
0 10 20 30 40 50 60 70 80
time (weeks)
0=ab
solu
te b
lack
abso
lute
whi
te
M12_lightM12_darkM14_lightM14_dark
Hue Angle
0
10
20
30
40
50
60
70
80
90
0 10 20 30 40 50 60 70 80
time (weeks)
0° r
ed+9
0° y
ello
w-9
0° b
lue
M12_lightM12_darkM14_lightM14_dark

113
Chroma
0
5
10
15
20
25
0 10 20 30 40 50 60 70 80
time (weeks)
M12_lightM12_darkM14_lightM14_dark
Figure 41: Colorimetric values of the PGSS™ - grape marc extracts with palm fat - products
stored for 65 weeks at light-ambient temperature and dark-refrigerator. See sample codes in
Appendix (XXII).

114
CONCLUSIONS AND FUTURE PROSPECTS
Agricultural processing yields many by-products having significant potential value.
By-products are often under utilized and therefore their value is lost. The problem that many
industries face is they are unable to obtain the value of by-products. Natural compounds can
be found in by-products of food processing. With some additional processing, these
compounds can move from the low value status of a by-product to the high revenue stream of
raw materials for nutraceuticals. Applications of supercritical fluid technology for treatment
of by-products were already developed [Herrero et al., 2006]. The possibilities lie in tomato
industry waste for production of β-carotene and lycopene, wine industry waste for phenolic
compounds and antioxidants [Bravi et al., 2007]. By-products are good source for
tocopherols (from olive oil and soybean oil production) and for pigments from different
marcs. The possibilities which lie in the SCF technology are boundless. The applications for
food industry are developing fast, due to the advantages given by these processes. The high
pressure technologies are still considered as economically not profitable, but due to demand
for high-added value products and concerns about safety of food, these “green” technologies
will gain their place in the food industry.
The tendency to reduce the use of artificial colorants in food applications is growing
not only due to the consumers’ demands but to strictening legislations, as well. There are
already many products of natural colorants on the market, mostly produced by conventional
technologies. In this work, optimization of the extraction of the anthocyanin pigments from a
by-product grape marc was achieved. Formulation of anthocyanin extracts in powderous
form was achieved with supercritical fluid technology, namely CPF™, PGSS™ and SAS
methods. According to our knowledge, the formulation of anthocyanins with supercritical
fluids has never been studied in such form before. Using CO2 as SCF for the process provides
mild processing conditions for natural products and is environmentally friendly. The
lightness and hue angle colorimetric parameters of the obtained products showed similar
values to artificial colorants, while the colour saturation of the synthetic colorants is still
somewhat higher. However, the most important result is, that the stability of anthocyanins
colour in the formulated product was generally improved, compared to non-formulated
products.

115
APPENDIX
I. Calibration curve of the gallic acid for the Total phenols measurements. Absorbance
was measured at 760 nm.
II. Calibration curve of the t-resveratrol for the HPLC measurements.
III. HPLC chromatogram of quercetin standard.
IV. Extraction of Total phenols from Refošk grape marc: comparison of temperatures.
V. Extraction of Total anthocyanins from Refošk grape marc: comparison of
temperatures.
VI. Extraction of Total phenols from Cabernet grape marc: comparison of temperatures.
VII. Extraction of Total anthocyanins from Cabernet grape marc: comparison of
temperatures.
VIII. Extraction of Total phenols from Merlot grape marc: comparison of temperatures.
IX. Extraction of Total anthocyanins from Merlot grape marc: comparison of
temperatures.
X. Extraction of Total phenols from Elder berry with acetone: comparison of
temperatures.
XI. Extraction of Total anthocyanins from Elder berry with acetone: comparison of
temperatures.
XII. Effect of the change in the pH value of extraction solvents by extraction of Total
phenols (left) and Total anthocyanins (right) from Elder berry (at 40 °C). Extraction
solvents: acetone (40%) and ethanol (96%) in mixture with water. Acidifying agents:
acetic acid (AcOH) and hydrogen-chloride (HCl).
XIII. Potential co-pigments of Elder berry: quercetin (mg/100 g dry material) and
epicatechin (mg/100 g dry material) extracted with different solvents and at different
temperatures.
XIV. MS spectra of malvidin-3-glycoside.
XV. MS spectra of nor-grape (NG) commercial grape extract.
XVI. MS spectra of grape marc extract V06.
XVII. MS spectra of grape marc extract V07.
XVIII. UV/Vis spectra of nor-grape (NG) commercial grape extract and grape marc extracts
V06 and V07 after 6 months of storage.
XIX. MS and UV/Vis spectrum of Nor-grape extract (NG) purified by column
chromatography. Methanol fraction.
XX. MS and UV/Vis spectrum of grape skin extract (GS) purified by column
chromatography. Methanolic fraction.
XXI. The performed CPF™ experiments: experimental details.

116
XXII. The performed PGSS™ experiments: experimental details.
XXIII. Particle size distribution. Probability density of three PGSS™ (elder berry with palm
fat) products: 5, 20 and 42 wt % liquid on the carrier.
XXIV. Particle size distribution. Probability density of three PGSS™ (grape marc with palm
fat) products: 5, 20 and 42 wt % liquid on the carrier.
XXV. View cell experiments: phase behaviour observations.
XXVI. The performed SAS experiments: experimental details.

117
I. Calibration curve of the gallic acid for the Total phenols measurements. Absorbance
was measured at 760 nm.
y = 6.351x - 0.0477R2 = 0.999
0.0
0.5
1.0
1.5
2.0
2.5
3.0
0 0.05 0.1 0.15 0.2 0.25 0.3 0.35 0.4 0.45
Concentration (mgGA/ml)
Abs
orba
nce
II. Calibration curve of the t-resveratrol for the HPLC measurements.
y = 168913x - 44.082R2 = 0.9999
0
5000
10000
15000
20000
0 0.02 0.04 0.06 0.08 0.1 0.12
Concentration (mg/ml)
Are
a (m
AU
*s)

118
III. HPLC chromatogram of quercetin standard.

119
IV. Extraction of Total phenols from Refošk grape marc: comparison of temperatures.
0
5
10
15
20
25
50% 70% 100% 50% 70% 100% 50% 70% 100%
ethanol ethyl-acetate acetone
mg
GA
/g d
ry m
ater
ial
RF 20°C RF 60°C
V. Extraction of Total anthocyanins from Refošk grape marc: comparison of
temperatures.
0.0
0.2
0.4
0.6
0.8
1.0
1.2
50% 70% 100% 50% 70% 100% 50% 70% 100%
ethanol ethyl-acetate acetone
mg
/ g
dry
mat
eria
l
RF 20°C RF 60°C

120
VI. Extraction of Total phenols from Cabernet grape marc: comparison of temperatures.
0
5
10
15
20
25
50% 70% 100% 50% 70% 100% 50% 70% 100%
ethanol ethyl-acetate acetone
mg
GA
/g d
ry m
ater
ial
CB 20°C CB 60°C
VII. Extraction of Total anthocyanins from Cabernet grape marc: comparison of
temperatures.
0.0
0.2
0.4
0.6
0.8
1.0
1.2
50% 70% 100% 50% 70% 100% 50% 70% 100%
ethanol ethyl-acetate acetone
mg
/ g
dry
mat
eria
l
CB 20°C CB 60°C

121
VIII. Extraction of Total phenols from Merlot grape marc: comparison of temperatures.
0
5
10
15
20
25
50% 70% 100% 50% 70% 100% 50% 70% 100%
ethanol ethyl-acetate acetone
mg
GA
/g d
ry m
ater
ial
ME 20°C ME 60°C
IX. Extraction of Total anthocyanins from Merlot grape marc: comparison of
temperatures.
0.0
0.2
0.4
0.6
0.8
1.0
1.2
50% 70% 100% 50% 70% 100% 50% 70% 100%
ethanol ethyl-acetate acetone
mg
/ g
dry
mat
eria
l
ME 20°C ME 60°C

122
X. Extraction of Total phenols from Elder berry with acetone: comparison of
temperatures.
0
5
10
15
20
25
20% 40% 60% 80% 100%
acetone
mg
GA
/g d
ry m
ater
ial
ELD 20°C ELD 40°C ELD 60°C
XI. Extraction of Total anthocyanins from Elder berry with acetone: comparison of
temperatures.
0.0
1.0
2.0
3.0
4.0
20% 40% 60% 80% 100%
acetone
mg
/ g
dry
mat
eria
l
ELD 20°C ELD 40°C ELD 60°C

123
XII. Effect of the change in the pH value of extraction solvents by extraction of Total phenols (left) and Total anthocyanins (right) from Elder
berry. Extraction solvents: acetone (40%) and ethanol (96%) in mixture with water. Acidifying agents: acetic acid (AcOH) and hydrogen-
chloride (HCl).
0
5
10
15
20
25
neutral pH2HCl
pH2AcOH
neutral pH2HCl
pH2AcOH
acetone-water ethanol-water
mg
GA
/g d
ry m
ater
ial
ELD - Total phenols
0
5
10
15
20
25
neutral pH2HCl
pH2AcOH
neutral pH2HCl
pH2AcOH
acetone-water ethanol-water
mg/
g dr
y m
ater
ial
ELD - Total anthocyanins

124
XIII. Potential co-pigments of Elder berry (ELD): quercetin (mg/100 g dry material) and
epicatechin (mg/100 g dry material) extracted with different solvents and at different
temperatures.
Material - Extraction solvent - Temperature Quercetin mg/100g dry material
Epicatechin mg/100g dry material
ELD – Acetone 20% - 20°C 4.66 140.3 ELD – Acetone 40% - 20°C 3.33 159.9
ELD – Acetone 60% - 20°C 3.72 n.d.*
ELD – Acetone 80% - 20°C 3.63 117.5
ELD – Acetone 100% - 20°C 6.27 82.2
ELD – Acetone 20% - 40°C 3.63 153.6
ELD – Acetone 40% - 40°C 9.74 192.8
ELD – Acetone 40% (pH2 with HCl) - 40°C 4.94 183.5
ELD – Acetone 40% (ph2 with acetic acid) - 40°C 11.37 165.9
ELD – Acetone 60% - 40°C 3.28 144.9
ELD – Acetone 80% - 40°C 21.83 113.1
ELD – Acetone 100% - 40°C 4.24 n.d
ELD – Acetone 20% - 60°C 7.12 154.6
ELD – Acetone 40% - 60°C 6.91 186.4
ELD – Acetone 60% - 60°C 6.16 188.6
ELD – Acetone 80% - 60°C 6.39 125.4
ELD – Acetone 100% - 60°C 7.63 n.d.
ELD – Ethanol 70% - 20°C 8.39 123.2
ELD – Ethanol 96% - 20°C 5.10 171.9
ELD – Ethanol 70% - 40°C 7.60 n.d.
ELD – Ethanol 96% - 40°C 5.66 196.9
ELD – Ethanol 96% (pH2 with HCl) - 40°C 2.76 258.4
ELD – Ethanol 96% (ph2 with acetic acid) - 40°C 4.92 162.6
ELD – Ethanol 70% - 60°C 7.84 144.2
ELD – Ethanol 96% - 60°C 11.83 218.4 *n.d.: not detected

125
XIV. MS spectra of malvidin-3-glycoside
XV. MS spectra of Nor-Grape (NG) commercial grape extract

126
XVI. MS spectra of grape marc extract V06.
XVII. MS spectra of grape marc extract V07.

127
XVIII. UV/Vis spectra of nor-grape (NG) commercial grape extract and grape marc extracts
V06 and V07 after 6 months of storage.
Nor-grape
0
0.2
0.4
0.6
0.8
1
300 400 500 600 700 800
wave length (nm)
abs
V06
0
0.2
0.4
0.6
0.8
1
300 400 500 600 700 800
wave length (nm)
abs
V07
0
0.2
0.4
0.6
0.8
1
300 400 500 600 700 800
wave length (nm)
abs

128
XIX. MS and UV/Vis spectrum of Nor-grape extract (NG) purified by column
chromatography. Methanol fraction.
0
0.5
1
1.5
2
400 500 600 700 800
wave length (nm)
abs

129
XX. MS and UV/Vis spectrum of grape skin extract (GS) purified by column
chromatography. Methanol fraction.
0
0.6
1.2
1.8
2.4
300 400 500 600 700 800
wave length (nm)
abs

130
XXI. The performed CPF™ experiments: experimental details.
No Liquid
(wt) Carrier Nozzle
Pressure (MPa)
Pressure (carrier)
Liquid/ carrier
(wt)
Liquid/ carrier
(wt) Powder
CPF™-RF1
1% RF in water
Silica 500LS
0.2 17.2 0.1 40 42
CPF™-RF2
1% RF in water
Silica 500LS
0.3 16.0 0.1 n.m. n.m
CPF™-RF3
1% RF in water
Silica 500LS
0.3 18.9 0.1 n.m. n.m
CPF™-RF4
1% RF in water
Silica 500LS
0.3 12.9 0.18 58 63
CPF™-RF5
1% RF in water
Silica 500LS
0.3 9.6 0.18 59 66
CPF™-RF6
1% RF in water
Silica 22LS
0.3 11.4 0.18 57 68
CPF™-RF7
1% RF in water
Silica 22LS
0.3 10.4 0.18 n.m. n.m.
CPF™-RF8
10% RF in water
Silica 22LS
0.2 16.8 0.11 n.m. n.m.
CPF™-RF9
10% RF in water
Silica 22LS
0.2 16.5 0.18 54 52
CPF™-RF10
10% RF in water
Silica 22LS
0.2 16.5 0.15 59 57
CPF™-RF11
10% RF in water
Silica 22LS
0.2 16.5 0.13 66 37
CPF™-RF12
10% RF in water
Silica 22LS
0.2 16.9 0.11 65 65
CPF™-RF13
10% RF in water
Silica 22LS
0.2 16.1 0.1 n.m. n.m.
CPF™-RF14
10% RF in water
Silica 22LS
0.3 15.1 0.15 67 65
CPF™-RF15
10% RF in water
Silica 22LS
0.3 15.0 0.13 66 64
CPF™-RF16
10% RF in EtOH/water
Silica 22LS
0.3 12.0 0.13 n.m. n.m.
CPF™-RF17
10% RF in EtOH/water
Silica 22LS
0.3 12.3 0.15 54 50
CPF™-RF18
10% RF in EtOH/water
Silica 22LS
0.3 14.3 0.13 63 60
CPF™-RF19
10% RF in EtOH/water
Silica 22LS
0.3 12.9 0.11 n.m. n.m.
CPF™-RF20
10% RF in EtOH/water
Silica 22LS
0.3 15.2 0.12 65 60
CPF™-RF21
10% RF in EtOH/water
Starch 0.2 15.6 0.25 n.m. n.m.
CPF™-RF22
10% RF in EtOH/water
Starch 0.2 15.1 0.3 n.m. n.m.
CPF™-RF23
10% RF in EtOH/water
pH1 citric acid
Silica 22LS
0.3 16.0 0.12 66 56
CPF™-RF24
10% RF in EtOH/water
pH1 citric acid
Silica 22LS
0.3 14.4 0.12 n.m n.m.
CPF™-RF25
10% RF in EtOH/water
Silica 22LS
0.3 12.4 0.14 41 35

131
pH1 citric acid
CPF™-RF26
30% RF in EtOH/water
pH1 citric acid
Silica 22LS
0.3 16.3 0.14 67 43
CPF™-RF27
30% RF in EtOH/water
pH1 citric acid
Silica 22LS
0.3 15.1 0.14 66 44
n.m.= not measurable
Sample Obtained powder Obtained powder after drying
CPF™ RF5
CPF™ RF6
CPF™ RF8
CPF™ RF12
CPF™ RF15
CPF™ RF17

132
CPF™ RF20
CPF™ RF22
CPF™ RF23
CPF™ RF25
CPF™ RF27

133
XXII. The performed PGSS™ experiments: experimental details.
Sample Liquid Liquid/carrier
(wt) TA
mg/kg powder Tpre (°C)
ppre
(MPa) Tspray
(°C) GPR
AF1 Red wine 50 100 64 12.4 15 1.19 AF2 Red wine 31 62 68 12.4 15 1.20 AF3 Red wine 17 34 74 12.3 15 1.94 AF4 Red wine 5 10 72 12.4 17 1.98 AF5 Conc. Red wine (22%) 5 65 69 12.4 20 1.44 AF6 Conc. Red wine (8.5%) 5 100 71 12.4 19 1.18 AF7 Grape marc (10% in water) 5 10 71 12.4 18 1.34 AF8 Grape marc (50% in water) 5 48 72 12.4 20 1.20 AF9 Nor-grape (10% in water) 5 17 68 12.4 17 1.32 AF10 ELD juice (non-treated) 5 40 72 12.5 18 1.18 AF11 ELD juice MF 7.5 45 74 12.4 17 0.92 AF12 Nor-grape 35 85 71 12.4 18 0.76
AF13 Grape marc
(20% in 50%ethanol-water) 37 133 66 11.6 18 0.90
AF14 Grape marc
(20% in 50%ethanol-water) 42 141 67 11.9 18 0.93
AF15 ELD juice
(30% in water) 20 101 67 11.5 17 1.20
AF16 ELD MF (30% in water) 38 54 70 11.1 19 1.69
AF17 Conc. Red wine (22%)
(50% in water) 29 247 67 11.8 17 0.83
AF18 Conc. Red wine (8.5%)
(20% in water) 37 116 69 11.9 18 0.77
AF19 ELD UF (50% in water) 40 98 67 11.2 19 1.23 AF20 ELD NF (50% in water) 35 67 10.9 20 1.22
M1 ELD UF 5 27 63 12.5 M2 ELD RO 5 98 68 13.0 M3 ELD OD 5 333 70 13.0 M4 ELD OD 10 666 70 13.0 M5 ELD OD 20 1332 68 13.0 M6 ELD OD 30 1998 71 14.5 M7 ELD OD 35 2378 69 14.0 M8 ELD OD 41 2737 71 14.0 M9 ELD OD 48 3223 71 14.0 M10 ELD OD 50 3350 74 14.0
M11 Grape marc
(50% in 50%ethanol-water) 40 378 70 13.0
M12 Grape marc
(50% in 50%ethanol-water) 48 460 70 13.0
M13 Grape marc
(50% in 50%ethanol-water) citric acid 1%
39 373 70 14.5
M14 Grape marc
(50% in 50%ethanol-water) citric acid 1%
49 468 70 13.0

134
XXIII. Particle size distribution. Probability density of three PGSS™ (elder berry with palm
fat) products: 5, 20 and 42 wt % liquid on the carrier.
0
2
4
6
8
10
0.1 1.0 10.0 100.0 1000.0 10000.0
particle size (μm)
Prob
abili
ty d
ensit
y(1
/μm
)
Liquid/carrier ratio (wt)5/95
20/8042/58
XXIV. Particle size distribution. Probability density of three PGSS™ (grape marc with palm
fat) products: 5, 35 and 40 wt % liquid on the carrier.
0
2
4
6
8
10
0.1 1.0 10.0 100.0 1000.0 10000.0
particle size (μm)
Prob
abili
ty d
ensit
y(1
/μm
)
Liquid/carrier ratio (wt)5/95
35/6540/60

135
XXV. View cell experiments: phase behaviour observations.
Blackcurrant Juice (BC) and ScCO2
0.1 MPa, 35 °C
10 MPa, 37 °C
BC-Acetone-ScCO2
0.1 MPa, 38 °C
7 MPa, 39 °C
BC-Methanol-ScCO2
7.6 MPa, 39 °C
BC/methanol=5/95 (wt)
9.6 MPa, 40 °C
BC/methanol=10/90 (wt)
14 MPa, 40 °C
BC/methanol=5/95 (wt)

136
BC-Ethanol-ScCO2
0.1 MPa, 38 °C
7.7 MPa, 39 °C
8.0 MPa, 39 °C
12 MPa, 40 °C

137
XXVI. The performed SAS experiments: experimental details.
Initial settings Spraying Drying Total Mol ratio Sample
code BC/EtOH
wt % p
(MPa) T
(°C) Liq. flow (ml/min)
Liq. (g/min)
CO2 (g/min)
CO2/Liq ratio
Time (min)
CO2
(g/min) CO2 (g)
CO2/Liq ratio
CO2/EtOH CO2/H2O
1 10 40 0.5 0.24 0.67 2.85 60 1.10 150 5.60 20.8 2 8 40 0.5 0.43 0.69 1.58 60 0.45 49 3.37 6.2 3 8 35 0.5 0.42 0.27 0.63 60 0.48 58 8.57 6.3 4 10 35 0.5 0.21 0.28 1.33 60 0.48 65 7.31 11.3 5 10 40 0.25 0.13 0.39 2.91 60 0.22 50 3.67 12.4 6 8 40 0.5 0.31 1.00 3.27 30 1.10 89 2.54 9.6 7 10 35 0.5 0.26 0.69 2.71 45 0.70 101 3.63 11.4 8 10 40 0.5 0.41 0.77 1.91 45 1.09 96 5.91 13.1 9 10 40 0.25 0.21 0.75 3.52 30 1.05 87 2.48 10.1 10 10 35 0.25 0.21 0.71 3.36 30 0.31 53 1.67 6.5 11 5 10 35 0.25 0.15 0.66 4.39 30 0.66 71 2.07 11.1 82.8 12 10 10 35 0.25 0.25 0.95 3.86 45 0.78 85 2.65 13.2 46.4 13 10 7-10 35 0.15 0.17 0.50 2.92 45 0.55 65 2.87 10.8 38.1 14 10 10 35 0.05 0.09 0.43 4.61 60 0.45 76 2.33 13.9 48.9 15 10 10 35 0.25 0.20 0.61 3.06 60 0.61 102 2.81 5.0 39.1 16 10 10 35 0.2 0.19 1.02 5.41 60 0.98 188 4.09 11.4 100.6 17 5 10 35 0.25 0.25 0.91 3.57 45 0.86 99 2.21 9.6 71.7 18 5 10 35 0.25 0.21 0.84 4.02 45 0.81 116 2.13 10.5 77.9 19 10 35 0.25 0.22 0.90 4.05 45 0.47 99 1.68 7.9 20 10 35 0.25 0.23 1.01 4.37 50 1.07 136 2.45 12.4
Precipitation indicated with grey colour During drying EtOH was added at the same flow as Liquid flow

138
REFERENCES
Adams, J. B. (1972). Changes in polyphenols of red fruits during processing - The kinetics and mechanism of anthocyanin degradation. Campden Food Pres. Res. Assoc. Tech. Bull. Gluocestershire, England, Chipping Campden, 1-185.
Alessi, P., L. Alvarez, B. Lafuente, I. Kikic and F. Vecchione (2007). Drug Delivery Systems with SC Process: Precipitation of ß-carotene by SAS Process and Supercritical Carbon dioxide Impregnation. 5th International Symposium on High Pressure Process Technology and Chemical Engineering, Segovia (Spain).
Amico, V., E. M. Napoli, A. Renda, G. Ruberto, C. Spatafora and C. Tringali (2004). Constituents of grape pomace from the Sicilian cultivar `Nerello Mascalese'. Food Chemistry, 88(4), 599.
Asen, S., R. N. Stewart and K. H. Norris (1972). Co-pigmentation of anthocyanins in plant tissues and its effect on color. Phytochemistry, 11(1189.
Beardmore, C. (2004). The use of polyphosphate in beverages to provide colour stabilty. Bouchard, A., N. Jovanovic, A. Martin, G. W. Hofland, D. J. A. Crommelin, W. Jiskoot and
G.-J. Witkamp (2008). Effect of the modifier on the particle formation and crystallisation behaviour during precipitation from aqueous solutions. The Journal of Supercritical Fluids, 44(3), 409-421.
Bravi, M., F. Spinoglio, N. Verdone, M. Adami, A. Aliboni, A. D'Andrea, A. De Santis and D. Ferri (2007). Improving the extraction of [alpha]-tocopherol-enriched oil from grape seeds by supercritical CO2. Optimisation of the extraction conditions. Journal of Food Engineering, 78(2), 488.
Bridle, P. and C. F. Timberlake (1997). Anthocyanins as natural food colours--selected aspects. Food Chemistry, 58(103.
Brouillard, R., S. Chassaing and A. Fougerousse (2003). Why are grape/fresh wine anthocyanins so simple and why is it that red wine color lasts so long? Phytochemistry, 64(7), 1179.
Brunner, G. (2005). Supercritical fluids: technology and application to food processing. Journal of Food Engineering, 67(1-2), 21.
Byrappa, K., S. Ohara and T. Adschiri (2008). Nanoparticles synthesis using supercritical fluid technology - towards biomedical applications. Advanced Drug Delivery Reviews, 60(3), 299.
Cacace, J. E. and G. Mazza (2003). Mass transfer process during extraction of phenolic compounds from milled berries. Journal of Food Engineering, 59(4), 379.
Caliceti, P., S. Salmaso, N. Elvassore and A. Bertucco (2004). Effective protein release from PEG/PLA nano-particles produced by compressed gas anti-solvent precipitation techniques. Journal of Controlled Release, 94(1), 195.
Carretier, E., E. Badens, P. Guichardon, O. Boutin and G. Charbit (2003). Hydrodynamics of Supercritical Antisolvent Precipitation: Characterization and Influence on Particle Morphology. Ind. Eng. Chem. Res., 42(2), 331-338.
Cevallos-Casals, B. A. and L. Cisneros-Zevallos (2004). Stability of anthocyanin-based aqueous extracts of Andean purple corn and red-fleshed sweet potato compared to synthetic and natural colorants. Food Chemistry, 86(1), 69.
Cliff, M. A., M. C. King and J. Schlosser (2007). Anthocyanin, phenolic composition, colour measurement and sensory analysis of BC commercial red wines. Food Research International, 40(1), 92.
Corrigan, O. I. and A. M. Crean (2002). Comparative physicochemical properties of hydrocortisone-PVP composites prepared using supercritical carbon dioxide by the GAS anti-solvent recrystallization process, by coprecipitation and by spray drying. International Journal of Pharmaceutics, 245(1-2), 75.
Dimitric Markovic, J. M., J. M. Baranac and T. P. Brdaric (2005). Electronic and infrared vibrational analysis of cyanidin-quercetin copigment complex. Spectrochimica Acta Part A: Molecular and Biomolecular Spectroscopy, 62(1-3), 673.

139
Durling, N. E., O. J. Catchpole, S. J. Tallon and J. B. Grey (2007). Measurement and modelling of the ternary phase equilibria for high pressure carbon dioxide-ethanol-water mixtures. Fluid Phase Equilibria, 252(1-2), 103.
Elvassore, N., A. Bertucco, P. Caliceti. (2001). Production of insulin-loaded poly(ethylene glycol)/poly(l-lactide) (PEG/PLA) nanoparticles by gas antisolvent techniques. Journal of Pharmaceutical Sciences, 90(10), 1628-1636.
Elvassore, N., A. Bertucco, P. Caliceti. (2001). Production of different morphologies of biocompatible polymeric materials by supercritical CO2 antisolvent techniques. Biotechnology and Bioengineering, 73(6), 449-457.
Escribano-Bailon, T., M. Alvarez-Garcia, J. C. Rivas-Gonzalo, F. J. Heredia and C. Santos-Buelga (2001). Color and Stability of Pigments Derived from the Acetaldehyde-Mediated Condensation between Malvidin 3-O-Glucoside and (+)-Catechin. J. Agric. Food Chem., 49(3), 1213-1217.
Fages, J., H. Lochard, J.-J. Letourneau, M. Sauceau and E. Rodier (2004). Particle generation for pharmaceutical applications using supercritical fluid technology. Powder Technology, 141(3), 219.
Fonyó, Z. and G. Fábry (1998). Vegyipari Művelettani Alapismeretek. Budapest, Nemzeti Tankönyvkiadó Rt.
Francis, F. J. (1982). Analysis of anthocyanins. New York, Academic Press. Francis, F. J. (1989). Food Colorants: Anthocyanins. Critical Reviews in Food Science and
Nutrition, 28(4), 273-314. Fuleki, T. and F. J. Francis (1968). Quantitative methods for anthocyanins. Extraction and
determination of total anthocyanins in cranberries. Journal of Food Science, 33(72-77.
Gamse, T. (2002). Liquid-liquid Extraction and Solid-liquid Extraction. Lecture: University of Valladolid.,
García-Beneytez, E., E. Revilla and F. Cabello (2002). Anthocyanin pattern of several red grape cultivars and wines made from them. European Food Research and Technology, 215(1), 32.
Gilbert, M. L. and M. E. Paulaitis (1986). Gas-liquid equilibrium for ethanol-water-carbon dioxide mixtures at elevated pressures. J. Chem. Eng. Data, 31(3), 296-298.
Giusti, M. M., L. E. Rodriguez-Saona, J. R. Baggett, G. L. Reed, R. W. Durst and R. E. Wrolstad (1998). Anthocyanin Pigment Composition of Red Radish Cultivars as Potential Food Colorants. Journal of Food Science, 63(2), 219-224.
Giusti, M. M., L. E. Rodriguez-Saona, D. Griffin and R. E. Wrolstad (1999b). Electrospray and Tandem Mass Spectroscopy As Tools for Anthocyanin Characterization. J. Agric. Food Chem., 47(11), 4657-4664.
Giusti, M. M., L. E. Rodriguez-Saona and R. E. Wrolstad (1999a). Molar Absorptivity and Color Characteristics of Acylated and Non-Acylated Pelargonidin-Based Anthocyanins. J. Agric. Food Chem., 47(11), 4631-4637.
Giusti, M. M. and R. E. Wrolstad (2000). Characterization and Measurement of Anthocyanins by UV-Visible Spectroscopy. Current Protocols in Food Analytical Chemistry. T. E. A. C. U. Ronald E. Wrolstad (Editor-in-Chief; Oregon State University), Eric A. Decker (University of Massachusetts), Michael H. Penner (Oregon State University), David S. Reid (University of California at Davis), Steven J. Schwartz (The Ohio State University), Charles F. Shoemaker (University of California at Davis), Denise M. Smith (University of Idaho), and Peter Sporns (University of Alberta), John Wiley & Sons, Inc. F 1.2.
Giusti, M. M. and R. E. Wrolstad (2003). Acylated anthocyanins from edible sources and their applications in food systems. Biochemical Engineering Journal, 14(3), 217.
Gomez-Miguez, M., S. Gonzalez-Manzano, M. T. Escribano-Bailon, F. J. Heredia and C. Santos-Buelga (2006). Influence of Different Phenolic Copigments on the Color of Malvidin 3-Glucoside. J. Agric. Food Chem., 54(15), 5422-5429.
Gomez-Plaza, E., A. Minano and J. M. Lopez-Roca (2006). Comparison of chromatic properties, stability and antioxidant capacity of anthocyanin-based aqueous extracts

140
from grape pomace obtained from different vinification methods. Food Chemistry, 97(1), 87.
Gonzalez-Paramas, A. M., F. Lopes da Silva, P. Martin-Lopez, G. Macz-Pop, S. Gonzalez-Manzano, C. Alcalde-Eon, J. J. Perez-Alonso, M. T. Escribano-Bailon, J. C. Rivas-Gonzalo and C. Santos-Buelga (2006). Flavanol-anthocyanin condensed pigments in plant extracts. Food Chemistry, 94(3), 428.
Gurbuz, O., D. Gocmen, F. Dagdelen, M. Gursoy, S. Aydin, I. Sahin, L. Buyukuysal and M. Usta (2007). Determination of flavan-3-ols and trans-resveratrol in grapes and wine using HPLC with fluorescence detection. Food Chemistry, 100(2), 518.
Hadolin, M., M. Skerget, Z. Knez and D. Bauman (2001). High pressure extraction of vitamin E-rich oil from Silybum marianum. Food Chemistry, 74(3), 355.
Havsteen, B. H. (2002). The biochemistry and medical significance of the flavonoids. Pharmacology and Therapeutics, 96(67.
Heredia, F. J., E. M. Francia-Aricha, J. C. Rivas-Gonzalo, I. M. Vicario and C. Santos-Buelga (1998). Chromatic characterization of anthocyanins from red grapes--I. pH effect. Food Chemistry, 63(4), 491.
Herrero, M., A. Cifuentes and E. Ibanez (2006). Sub- and supercritical fluid extraction of functional ingredients from different natural sources: Plants, food-by-products, algae and microalgae: A review. Food Chemistry, 98(1), 136.
Hilton, B. W., R. I. Lin and M. G. Topor (1982). Processed anthocyanin pigment extracts. Hirotoshi, T., S. Kohei, I. Nobuhiro, K. Hirotsugu, A. Mikinori and N. Takeshi (2001).
Stabilization of anthocyanin dyestuff by surfactant. Japan. Hunek, J. (1992). Vegyipari Műveletek VI: Extrakció. Budapest, Budapesti Műszaki
Egyetem, Vegyészmérnöki Kar, Tankönykiadó. Iacobucci, G. A. and J. G. Sweeny (1980). The use of ascorbic acid derivative as bio-available
vitamin C in a food containing an anthocyanin pigment and a color stable food compositions containing the same.
Iacobucci, G. A. and J. G. Sweeny (1983). The chemistry of anthocyanins, anthocyanidins and related flavylium salts. Tetrahedron, 39(19), 3005.
Jackman, R. L. and J. L. Smith (1996). Anthocyanins and Betalains. Natural Food Colorants. G. A. F. Hendry and J. D. Houghton. Glasgow, Scotland, Blackie&Son. 8.
Jackman, R. L., R. Y. Yada and M. A. Tung (1987b). A Review: Separation and Chemical Properties of Anthocyanins Used for their Qualitative and Quantitative Analysis. Journal of Food Biochemistry, 11(279-308.
Jackman, R. L., R. Y. Yada, M. A. Tung and R. A. Alex (1987a). Anthocyanins as Food Colorants - A Review. Journal of Food Biochemistry, 11(201-247.
Jackman, R. L., R. Y. Yada, M. A. Tung and R. A. Speers (1987). Anthocyanins as Food Colorants. Journal of Food Biochemistry, 11(201-247.
Ju, Z. Y. and L. R. Howard (2003). Effects of Solvent and Temperature on Pressurized Liquid Extraction of Anthocyanins and Total Phenolics from Dried Red Grape Skin. J. Agric. Food Chem., 51(18), 5207-5213.
Jung, J. and M. Perrut (2001). Particle design using supercritical fluids: Literature and patent survey. The Journal of Supercritical Fluids, 20(3), 179.
K. Gong, R. V. I. U. R. G. B. J. A. D. (2005). Formation and characterization of porous indomethacin-PVP coprecipitates prepared using solvent-free supercritical fluid processing. Journal of Pharmaceutical Sciences, 94(12), 2583-2590.
Kallithraka, S., A. A.-A. Mohdaly, D. P. Makris and P. Kefalas (2005). Determination of major anthocyanin pigments in Hellenic native grape varieties (Vitis vinifera sp.): association with antiradical activity. Journal of Food Composition and Analysis, 18(5), 375.
Kammerer, D., J. Gajdos Kljusuric, R. Carle and A. Schieber (2005). Recovery of anthocyanins from grape pomace extracts (Vitis vinifera L. cv. Cabernet Mitos) using a polymeric adsorber resin. European Food Research and Technology, 220(3), 431.
Kerc, J., S. Srcic, Z. Knez and P. Sencar-Bozic (1999). Micronization of drugs using supercritical carbon dioxide. International Journal of Pharmaceutics, 182(1), 33.

141
Kerrola, K. (1995). Literature review: isolation of essential oils and flavour compounds by dense carbon dioxide. Food Rev. International, 11(547-573.
Kikic, I., F. Vecchione, P. Alessi, A. Cortesi, F. Eva and N. Elvassore (2003). Polymer Plasticization Using Supercritical Carbon Dioxide: Experiment and Modeling. Ind. Eng. Chem. Res., 42(13), 3022-3029.
Kinpei, O. (2006). Method for producing dried material of eggplant. Japan. Knez, Z. and E. Weidner (2003). Particles formation and particle design using supercritical
fluids. Current Opinion in Solid State and Materials Science, 7(4-5), 353. Kohno, Y., Y. Shibata, N. Oyaizu, K. Yoda, M. Shibata and R. Matsushima (2008).
Stabilization of flavylium dye by incorporation into the pore of protonated zeolites. Microporous and Mesoporous Materials, 114(1-3), 373.
Kohno, Y., S. Tsubota, Y. Shibata, K. Nozawa, K. Yoda, M. Shibata and R. Matsushima Enhancement of the photostability of flavylium dye adsorbed on mesoporous silicate. Microporous and Mesoporous Materials, In Press, Corrected Proof(
Kompella, U. B. and K. Koushik (2001). Preparation of drug delivery systems using supercritical fluid technology. Critical Reviews in Ther. Drug Carrier Systems, 18(2), 173-199.
Kong, J.-M., L.-S. Chia, N.-K. Goh, T.-F. Chia and R. Brouillard (2003). Analysis and biological activities of anthocyanins. Phytochemistry, 64(5), 923.
Kraemer-Schafhalter, A., H. Fuchs, A. Strigl, S. Silhar, M. Kovac and W. Pfannhauser (1996). Process consideration for anthocyanin extraction from Black Chokeberry (Aronia meloncarpa L). Second International Symposium on Natural Colorants, S.I.C. Publishing Col., Hamden Ct.
Kucharska, A. Z. and J. Oszmiaski (2002). Anthocyanins in fruits of Prunus padus bird cherry. Journal of the Science of Food and Agriculture, 82(1483.
Kuskoski, E. M., J. M. Vega, J. J. Rios, R. Fett, A. M. Troncoso and A. G. Asuero (2003). Characterization of Anthocyanins from the Fruits of Baguacu (Eugenia umbelliflora Berg). J. Agric. Food Chem., 51(18), 5450-5454.
Lack, E., H. Seidlitz, G. Luft, A. Bertucco, A. Striolo, F. Zanette and A. B. a. G. Vetter (2001). Chapter 8 Economics of high pressure processes. Industrial Chemistry Library, Elsevier Science B.V. Volume 9, 437.
Lang, Q. and C. M. Wai (2001). Supercritical fluid extraction in herbal and natural product studies - a practical review. Talanta, 53(771-782.
Lankes, H., K. Sommer and B. Weinreich (2003). Liquid absorption capacity of carriers in the food technology. Powder Technology, 134(3), 201.
Lapornik, B., M. Prosek and A. Golc Wondra (2005). Comparison of extracts prepared from plant by-products using different solvents and extraction time. Journal of Food Engineering, 71(2), 214.
Lenoble, R., S. L. Richheimer, V. R. Bank and D. T. Bailey (1999). Pigment composition containing anthocyanins stabilized by plant extracts.
Li, J., M. Rodrigues, H. A. Matos and E. GomesdeAzevedo (2005). VLE of Carbon Dioxide/Ethanol/Water: Applications to Volume Expansion Evaluation and Water Removal Efficiency. Ind. Eng. Chem. Res., 44(17), 6751-6759.
Longo, L. and G. Vasapollo (2006). Extraction and identification of anthocyanins from Smilax aspera L. berries. Food Chemistry, 94(2), 226.
Luetge, C. and E. Schuetz (2007). Market Trends and Technical Developments in High Pressure Technologies. 5th International Symposium on High Pressure Processes Technology and Chemical Engineering, Segovia, Spain.
Majerik, V., G. Charbit, E. Badens, G. Horvath, L. Szokonya, N. Bosc and E. Teillaud (2007b). Bioavailability enhancement of an active substance by supercritical antisolvent precipitation. The Journal of Supercritical Fluids, 40(1), 101.
Majerik, V., G. Horváth, L. Szokonya, G. Charbit, E. Badens, N. Bosc and E. Teillaud (2007a). Supercritical Antisolvent Versus Coevaporation-Preparation and Characterization of Solid Dispersions. Drug Development and Industrial Pharmacy, 33(9), 975 - 983.
Malien-Aubert, C., O. Dangles and M. J. Amiot (2001). Color Stability of Commercial Anthocyanin-Based Extracts in Relation to the Phenolic Composition. Protective

142
Effects by Intra- and Intermolecular Copigmentation. J. Agric. Food Chem., 49(1), 170-176.
Markakis, P. (1982). Anthocyanins as food colors. Academic Press, London. Marr, R. and T. Gamse (2000). Use of supercritical fluids for different processes including
new developments--a review. Chemical Engineering and Processing, 39(1), 19. Martin, A. and M. J. Cocero (2004). Numerical modeling of jet hydrodynamics, mass
transfer, and crystallization kinetics in the supercritical antisolvent (SAS) process. The Journal of Supercritical Fluids, 32(1-3), 203.
Martín, A. and M. J. Cocero (2008). Micronization processes with supercritical fluids: Fundamentals and mechanisms. Advanced Drug Delivery Reviews, 60(3), 339.
Martin, A., F. Mattea, L. Gutierrez, F. Miguel and M. J. Cocero (2007). Co-precipitation of carotenoids and bio-polymers with the supercritical anti-solvent process. The Journal of Supercritical Fluids, 41(1), 138.
Matsumoto, H., S. Tominaga, M. Kishi, T. Kawakami, T. Tokunaga and M. Hirayama (2001). Compositions for foods, process for producing the same and functional foods and drinks containing the same.
Mazza, G. and R. Brouillard (1987). Recent developments in the stabilization of anthocyanins in food products. Food Chemistry, 25(3), 207.
Mazza, G. and E. Miniati (1993). Anthocyanins in Fruits, Vegetables and Graines. London, CRC Press.
McCallum, J. L., R. Yang, J. C. Young, J. N. Strommer and R. Tsao (2007). Improved high performance liquid chromatographic separation of anthocyanin compounds from grapes using a novel mixed-mode ion-exchange reversed-phase column. Journal of Chromatography A, 1148(1), 38.
Meireles, M. A. A. (2003). Supercritical extraction from solid: process design data (2001-2003). Current Opinion in Solid State and Materials Science, 7(4-5), 321.
Meterc, D., M. Petermann and E. Weidner (2008). Drying of aqueous green tea extracts using a supercritical fluid spray process. The Journal of Supercritical Fluids, 45(2), 253.
Metivier, R. P., F. J. Francis and F. M. Clydesdale (1980). Solvent Extraction of Anthocyanins from Wine Pomace. Journal of Food Science, 45(4), 1099-1100.
Miguel, F., A. Martin, T. Gamse and M. J. Cocero (2006). Supercritical anti solvent precipitation of lycopene: Effect of the operating parameters. The Journal of Supercritical Fluids, 36(3), 225.
Mishima, K. (2008). Biodegradable particle formation for drug and gene delivery using supercritical fluid and dense gas. Advanced Drug Delivery Reviews, 60(3), 411.
Monagas, M., I. Garrido, B. Bartolome and C. Gomez-Cordoves (2006). Chemical characterization of commercial dietary ingredients from Vitis vinifera L. Analytica Chimica Acta, 563(1-2), 401.
Moneghini, M., I. Kikic, D. Voinovich, B. Perissutti and J. Filipovic-Grcic (2001). Processing of carbamazepine-PEG 4000 solid dispersions with supercritical carbon dioxide: preparation, characterisation, and in vitro dissolution. International Journal of Pharmaceutics, 222(1), 129.
Moneghini, M., B. Perissutti, I. Kikic, M. Grassi, A. Cortesi and F. Princivalle (2006). Preparation of Theophylline-Hydroxypropylmethylcellulose Matrices Using Supercritical Antisolvent Precipitation: A Preliminary Study. Drug Development and Industrial Pharmacy, 32(39.
Morais, H., C. Ramos, E. Forgacs, T. Cserhati and J. Oliviera (2002). Influence of storage conditions on the stability of monomeric anthocyanins studied by reversed-phase high-performance liquid chromatography. Journal of Chromatography B, Analytical Technologies in the Biomedical and Life Sciences, 770(297.
Morariu, M. (2007). Topical macqui berry formulation. Moyler, D. A. (1993). Extraction of Flavours and Fragrances with Compressed CO2.
Glasgow, Blackie. Mumper, R. J., J. Dai and V. S. Gallicchio (2007). Berry preparations and extracts. Münüklü, P. and P. J. Jansens (2007). Particle formation of edible fats using the supercritical
melt micronization process (ScMM). The Journal of Supercritical Fluids, 43(1), 181.

143
Nakajima, N., K. Ishihara, H. Hamada, S.-I. Kawabe and T. Furuya (2000). Regioselective acylation of flavonoid glucoside with aromatic acid by an enzymatic reaction system from cultured cells of Ipomoea batatas. Journal of Bioscience and Bioengineering, 90(3), 347.
Nakajima, N., K. Ishihara, T. Itoh, T. Furuya and H. Hamada (1999). Lipase-catalyzed direct and regioselective acylation of flavonoid glucoside for mechanistic investigation of stable plant pigments. Journal of Bioscience and Bioengineering, 87(1), 105.
Negro, C., L. Tommasi and A. Miceli (2003). Phenolic compounds and antioxidant activity from red grape marc extracts. Bioresource Technology, 87(1), 41.
Nguyen, I. (2004). Novel confectionery compositions. Nyman, N. A. and J. T. Kumpulainen (2001). Determination of Anthocyanidins in Berries
and Red Wine by High-Performance Liquid Chromatography. J. Agric. Food Chem., 49(9), 4183-4187.
Ortega-Regules, A., I. Romero-Cascales, J. M. López-Roca, J. M. Ros-García and E. Gómez-Plaza (2006). Anthocyanin fingerprint of grapes: environmental and genetic variations. Journal of the Science of Food and Agriculture, 86(10), 1460-1467.
Palmer, M. V. and S. S. T. Ting (1995). Applications for supercritical fluid technology in food processing. Food Chemistry, 52(4), 345.
Pazmińo-Durán, E. A., M. Mónica Giusti, R. E. Wrolstad and M. B. A. Glória (2001). Anthocyanins from Oxalis triangularis as potential food colorants. Food Chemistry, 75(2), 211.
Perrut, M., J. Jung and F. Leboeuf (2005a). Enhancement of dissolution rate of poorly-soluble active ingredients by supercritical fluid processes: Part I: Micronization of neat particles. International Journal of Pharmaceutics, 288(1), 3.
Perrut, M., J. Jung and F. Leboeuf (2005b). Enhancement of dissolution rate of poorly soluble active ingredients by supercritical fluid processes: Part II: Preparation of composite particles. International Journal of Pharmaceutics, 288(1), 11.
Petermann, M., E. Weidner, S. Grüner and B. Weinreich (2001). CPF-Concentrated Powder Form-a high pressure spray agglomeration technique. Spray Drying, Dortmund (Germany).
Piga, A., A. Del Caro, I. Pinna and M. Agabbio (2005). Anthocyanin and colour evolution in naturally black table olives during anaerobic processing. LWT - Food Science and Technology, 38(4), 425.
Pinelo, M., M. Rubilar, M. Jerez, J. Sineiro and M. J. Nunez (2005). Effect of Solvent, Temperature, and Solvent-to-Solid Ratio on the Total Phenolic Content and Antiradical Activity of Extracts from Different Components of Grape Pomace. J. Agric. Food Chem., 53(6), 2111-2117.
Pomar, F., M. Novo and A. Masa (2005). Varietal differences among the anthocyanin profiles of 50 red table grape cultivars studied by high performance liquid chromatography. Journal of Chromatography A, 1094(1-2), 34.
RAPS CPF Technology - The perfect combination of liquid and powder. Information brochure,
Reid, R. C., J. M. Prausnitz and B. E. Poling (1987). The properties of gases and liquids. New York, McGraw-Hill.
Reverchon, E. (1997). Supercritical fluid extraction and fractionation of essential oils and related products. The Journal of Supercritical Fluids, 10(1), 1.
Reverchon, E. (1999). Supercritical antisolvent precipitation of micro- and nano-particles. Journal of Supercritical Fluids, The, 15(1), 1.
Reverchon, E., R. Adami and G. Caputo (2006). Supercritical assisted atomization: Performance comparison between laboratory and pilot scale. The Journal of Supercritical Fluids, 37(3), 298.
Reverchon, E., R. Adami, I. D. Marco, C. G. Laudani and A. Spada (2005). Pigment Red 60 micronization using supercritical fluids based techniques. The Journal of Supercritical Fluids, 35(1), 76.
Reverchon, E., G. Caputo and I. DeMarco (2003). Role of Phase Behavior and Atomization in the Supercritical Antisolvent Precipitation. Ind. Eng. Chem. Res., 42(25), 6406-6414.

144
Reverchon, E. and I. De Marco (2006). Supercritical fluid extraction and fractionation of natural matter. The Journal of Supercritical Fluids, 38(2), 146.
Reverchon, E., G. Della Porta, I. De Rosa, P. Subra and D. Letourneur (2000). Supercritical antisolvent micronization of some biopolymers. The Journal of Supercritical Fluids, 18(3), 239.
Reverchon, E. and P. Pallado (1996). Hydrodynamic modeling of the RESS process. The Journal of Supercritical Fluids, 9(4), 216.
Revilla, E., J. M. Ryan and G. Martin-Ortega (1998). Comparison of Several Procedures Used for the Extraction of Anthocyanins from Red Grapes. J. Agric. Food Chem., 46(11), 4592-4597.
Revilla, I., S. Perez-Magarino, M. L. Gonzalez-SanJose and S. Beltran (1999). Identification of anthocyanin derivatives in grape skin extracts and red wines by liquid chromatography with diode array and mass spectrometric detection. Journal of Chromatography A, 847(83.
Rodrigues, M., N. Peirico, H. Matos, E. Gomes de Azevedo, M. R. Lobato and A. J. Almeida (2004). Microcomposites theophylline/hydrogenated palm oil from a PGSS process for controlled drug delivery systems. The Journal of Supercritical Fluids, 29(1-2), 175.
Rosa, P. T. V. and M. A. A. Meireles (2005). Supercritical Technology in Brazil: system investigated. Journal of Supercritical Fluids, 34(109-117.
Ruberto, G., A. Renda, C. Daquino, V. Amico, C. Spatafora, C. Tringali and N. D. Tommasi (2007). Polyphenol constituents and antioxidant activity of grape pomace extracts from five Sicilian red grape cultivars. Food Chemistry, 100(1), 203.
Sencar-Bozic, P., S. Srcic, Z. Knez and J. Kerc (1997). Improvement of nifedipine dissolution characteristics using supercritical CO2. International Journal of Pharmaceutics, 148(2), 123.
Sethia, S. and E. Squillante (2004). Solid dispersion of carbamazepine in PVP K30 by conventional solvent evaporation and supercritical methods. International Journal of Pharmaceutics, 272(1-2), 1.
Shariati, A. and C. J. Peters (2003). Recent developments in particle design using supercritical fluids. Current Opinion in Solid State and Materials Science, 7(4-5), 371.
Simandi, B., M. Oszagyan, E. Lemberkovics, A. Kery, J. Kaszacs, F. Thyrion and T. Matyas (1998). Supercritical carbon dioxide extraction and fractionation of oregano oleoresin. Food Research International, 31(10), 723.
Simándi, B. and J. Sawinsky (1996). Műveletek szuperkritikus oldószerekkel. Olaj, Szappan, Kozmetika, 45(spec.ed.), 3.
Skerget, M., P. Kotnik, M. Hadolin, A. R. Hras, M. Simonic and Z. Knez (2005). Phenols, proanthocyanidins, flavones and flavonols in some plant materials and their antioxidant activities. Food Chemistry, 89(2), 191.
Sondheimer, E. and Z. I. Kertesz (1948). Anthocyanin pigments: Colorimetric determination in strawberries and strawberry products. Anal. Chem., 20(245-248.
Song, K., C.-H. Lee, J. Lim and Y.-W. Lee (2002). Preparation of L-PLA submicron particles by a continuous supercritical antisolvent precipitation process. Korean Journal of Chemical Engineering, 19(1), 139.
Spigno, G. and D. M. De Faveri (2007). Antioxidants from grape stalks and marc: Influence of extraction procedure on yield, purity and antioxidant power of the extracts. Journal of Food Engineering, 78(3), 793.
Sun, M. and F. Temelli (2006). Supercritical carbon dioxide extraction of carotenoids from carrot using canola oil as a continuous co-solvent. The Journal of Supercritical Fluids, 37(3), 397.
Takehiko Yasuji, J. H. A. K. M. P. M. R. A. R. (2006). Preliminary evaluation of polymer-based drug composite microparticle production by coacervate desolvation with supercritical carbon dioxide. Journal of Pharmaceutical Sciences, 95(3), 581-588.
Taki, S., E. Badens and G. Charbit (2001). Controlled release system formed by supercritical anti-solvent coprecipitation of a herbicide and a biodegradable polymer. The Journal of Supercritical Fluids, 21(61.

145
Tandya, A., F. Dehghani and N. R. Foster (2006). Micronization of cyclosporine using dense gas techniques. The Journal of Supercritical Fluids, 37(3), 272.
Timberlake, C. F. (1980). Anthocyanins-Occurence, Extraction and Chemistry. Food Chemistry, 5(69-80.
Timberlake, C. F. (1988). The biological properties of anthocyanin compounds. NATCOL Quaterly Bulletin, 1(4-15.
Tominaga, S., H. Matsumoto, M. Kishi, E. Iwasaki, H. Oike and T. Tokunaga (2001). Stabilizers for anthocyanin-rich ompositions.
Tseng, K.-C., H.-M. Chang and J. S.-B. Wu (2006). Degradation Kinetics of Anthocyanin in Ethanolic Solutions. Journal of Food Processing & Preservation, 30(503.
Tsukui, A. and K. Hayashi (1997). Stabilizing method for anthocyanin color. Turker, N. and F. Erdogdu (2006). Effects of pH and temperature of extraction medium on
effective diffusion coefficient of anthocynanin pigments of black carrot (Daucus carota var. L.). Journal of Food Engineering, 76(4), 579.
Turner, C., C. S. Eskilsson and E. Bjorklund (2002). Review: Supercritical fluid extraction and chromatography for fat-soluble vitamin analysis. Journal of Chromatography A, 936(215-237.
Veigas, J. M., M. S. Narayan, P. M. Laxman and B. Neelwarne (2007). Chemical nature, stability and bioefficacies of anthocyanins from fruit peel of syzygium cumini Skeels. Food Chemistry, 105(2), 619.
Vidal, S., Y. Hayasaka, E. Meudec, V. Cheynier and G. Skouroumounis (2004). Fractionation of Grape Anthocyanin Classes Using Multilayer Coil Countercurrent Chromatography with Step Gradient Elution. J. Agric. Food Chem., 52(4), 713-719.
Wang, H. and K. Helliwell (2001). Determination of flavonols in green and black tea leaves and green tea infusions by high-performance liquid chromatography. Food Research International, 34(2-3), 223.
Weidner, E., G. Brandin, T. Wendt, M. Petermann, A. Kilzer, S. Kareth, B. Weinreich, H. Seidlitz and S. Grüner-Richter (2006). Innovative Solution for Powder Production in the Food Industry - Particles from Gas Saturated Solutions. 8th International Symposium on Supercritical Fluids. Kyoto, Japan.
Weidner, E., Z. Knez and Z. Novak (1995). Process for preparing particles or powders. Weidner, E., M. Petermann and Z. Knez (2003). Multifunctional composites by high-pressure
spray processes. Current Opinion in Solid State and Materials Science, 7(4-5), 385. Weinreich, B., R. Steiner, E. Weidner and J. Dirscherl (2002). Method for producing a
powder product from a liquid substance or mixture of substances. Wendt, T. (2006). Herstellung von funktionellen organischen Partikelsystemen durch ein Hochdrucksprühverfahren. Chair for Process Technology, Faculty of Mechanical
Engineering. Bochum, Bochum Ruhr-University. Ph.D. Wendt, T., G. Brandin, A. Kilzer, E. Weidner and M. Petermann (2006). Generation of fluid-
filled micro particles using PGSS technology. 3rd International Meeting in High Pressure Chemical Engineering. Erlangen, Germany.
Wrolstad, R. E. (2004). Anthocyanin pigments - bioactivity and coloring properties. Journal of Food Science, 69(5), C419-C421.
Wrolstad, R. E., J. D. Culbertson, C. J. Cornwell and L. R. Mattick (1982). Detection of adulteration in blackberry juice concentrates and wines. Journal of Assoc. Off. Anal. Chem., 65(1417-1423.
Wrolstad, R. E., R. W. Durst and J. Lee (2005). Tracking color and pigment changes in anthocyanin products. Trends in Food Science & Technology, 16(9), 423.
Wrolstad, R. E. and L. E. Rodriguez-Saona (2001). Natural colorant from potato extract. Wu, X. and R. L. Prior (2005). Systematic Identification and Characterization of
Anthocyanins by HPLC-ESI-MS/MS in Common Foods in the United States: Fruits and Berries. J. Agric. Food Chem., 53(7), 2589-2599.
Yajima, M., S. Furuhashi, K. Katsuyama, H. Domichi and T. Muroya (2003). Pigment-stabilizing agent and pigment-stabilizing method.

146
Yao, S., Y. Guan and Z. Zhu (1994). Investigation of phase equilibrium for ternary systems containing ethanol, water and carbon dioxide at elevated pressures. Fluid Phase Equilibria, 99(249-259.
Yeo, S.-D. and E. Kiran (2005). Formation of polymer particles with supercritical fluids: A review. The Journal of Supercritical Fluids, 34(3), 287.

BIOGRAPHY
Personal information
First name: Tünde Family name: Vatai Date of birth: 28/05/1981 Place of birth: Novi Sad, Serbia Nationality: Hungarian Educational background
2005-2008 Marie Curie EST Fellowship (EU), Ph. D. research work: Developing anthocyanin-based products Including research work at: University of Maribor (Slovenia), Faculty of Chemistry and Chemical
Engineering, Laboratory for Separation Processes and Product design (18 months);
Ruhr-University Bochum (Germany), Faculty of Mechanical Engineering, Chair for Process Technology (3 months);
University of Nottingham (England), School of Chemistry, (2 months) University of Trieste, Department of Chemical, Environmental and Raw
Materials Engineering (12 months) 2000-2005 Budapest University of Technology and Economics (BUTE), M. Sc. in
Chemical Engineering, Major: Industrial Pharmaceutics (Budapest). Master thesis: Selective Extraction of St. John’s Wort (Hypericum Perforatum
L.). 1996-2000 Jozsef Attila Secondary Grammar School, Advanced mathematics class
(Budapest). Professional experience, training activities, courses
2007 Short training on NMR and MS, 27th July, Centre for Biomolecular Sciences,
University of Nottingham, England. 2006 Course of the Centre of Applied Spectroscopy – Instrumental Analysis
„GC/MS application in the area of soil and water contamination with hydrocarbons and polycyclic aromatic hydrocarbons, as well as identification of the fatty acid methyl esters”, 9th-16th July, Novi Sad, Serbia.
2006 Course of the Centre of Applied Spectroscopy - Instrumental Analysis „GC and UV-VIS application for analysis of grapes and wine”, 27th August-3rd September, Skopje, F. Y. R. Macedonia.
2005 “Safety Seminar on High-pressure Equipment and Technology”, 28th September, School of Chemistry, University of Nottingham, England.
2005 Socrates Intensive Course: HPCEP-IP „Basics, Development, Research and Industrial Applications in High Pressure Chemical Engineering Processes”, 8th-20th June, Prague, Czech Republic.
2005 Course on protection of industrial property, Hungarian Patent Office, 7th-28th March, Budapest, Hungary.
2004-2005 Product development at Gradiens Ltd. (Budapest, Hungary): pharmaceutical herb products (6 months).

148
2003 Summer practice at Sartorius AG (Göttingen, Germany): chemical modifications of membranes (2 months).
2002-2005 Students’ Scientific Circle research work. Topic: Selective Extraction of St. John’s Wort (Hypericum Perforatum L.). Chemical Engineering Department, BUTE.
1998 University of Horticulture and Food: experiments on ultrafiltration of surfactants (2 months).
Professional accomplishments, scholarships
2004/2005 Demonstration activity at the Department of Chemical Engineering (2 semesters) 2005 Faculty Scholarship of the BUTE 2004 University Scholarship of the BUTE 2004 Faculty Scholarship of the BUTE 2004 Students’ Scientific Circle 3rd prize in the section of Chemical Technology 2004 National Students’ Scientific Circle of METE 3nd prize in the section of Food
Technology and Engineering 2003 Students’ Scientific Circle 3rd prize in the section of Chemical Technology Language skills
High level Hungarian, English, Serbian, Croatian Medium level Slovenian, Italian Basic German, French

149
BIBLIOGRAPHY
Osebna bibliografija
ČLANKI IN DRUGI SESTAVNI DELI
1.01 Izvirni znanstveni članek
1. VATAI, Tünde, ŠKERGET, Mojca, KNEZ, Željko, KARETH, Sabine, WEHOWSKI, Manuel, WEIDNER, Eckhard. Extraction and formulation of anthocyanin-concentrates from grape residues. J. supercrit. fluids. [Print ed.], May 2008, vol. 45, iss. 1, str. 32-36. http://dx.doi.org/10.1016/j.supflu.2007.12.008. [COBISS.SI-ID 12228630] JCR IF (2007): 2.189, SE (43/110), chemistry, physical, x: 2.506, SE (9/114), engineering, chemical, x: 1.015
2. VATAI, Tünde, ŠKERGET, Mojca, KNEZ, Željko. Extraction of phenolic compounds from
elder berry and different grape marc varieties using organic solvents and/or supercritical carbon dioxide. J. food process eng., 2009, vol. 90, iss. 2, str. 246-254. http://dx.doi.org/10.1016/j.jfoodeng.2008.06.028. [COBISS.SI-ID 12483094] JCR IF (2007): 0.849, SE (53/114), engineering, chemical, x: 1.015, SE (56/103), food science & technology, x: 1.15
1.08 Objavljeni znanstveni prispevek na konferenci
3. HOJNIK, M., VATAI, T., ŠKERGET, M., KNEZ, Ž. Isolation of polyphenols. In: 3rd International Meeting on High Pressure Chemical Engineering, May, 2006, Erlangen, Germany. Final manuscripts. Düsseldorf: Verein Deutscher Ingenieure, cop. 2006, 8 f
4. VATAI, T., ŠKERGET, M., KNEZ, Ž. Extraction of phenolic compounds from elder berry (Sambucus nigra L.). In: Múszaki Kémiai Napok `06, Conference of Chemical Engineering, Veszprém, 2006. Konferencia kiadvány. Veszprém: Pannon Egyetem, 2006, 168-171.
5. VATAI, T., ŠKERGET, M., KNEZ, Ž. Aktivne komponente iz tropin refoška. In: GLAVIČ, Peter (Ed.), BRODNJAK-VONČINA, Darinka (Ed.). Slovenski kemijski dnevi 2006, Maribor: FKKT, 2006, 6.
6. VATAI, T., ŠKERGET, M., KNEZ, Ž., KARETH, S., WEHOWSKI, M., WEIDNER, E. Extraction and formulation of anthocyanin-concentrates from grape residues. In: KNEZ, Željko (Ed.), COCERO, Maria José (Ed.). 5th International symposium on high pressure process technology and chemical engineering, June, 2007, Segovia, Spain, (European Federation of Chemical Engineering, Event 661), 2007, 1-7.

150
7. VATAI, T., ŠKERGET, M., ALESSI, P., KIKIC, I., KARETH, S., WEIDNER, E., KNEZ, Ž. Supercritical fluids for formulation and stabilization of anthocyanin colorants. In: 11th European Meeting on Supercritical Fluids, May, 2008, Barcelona, Spain. Reactions, materials and natural products processing: International Society for the Advancement of Supercritical Fluids, cop. 2008, [6] f.
1.12 Objavljeni povzetek znanstvenega prispevka na konferenci
8. VATAI, T., ŠKERGET, M., KNEZ, Ž. Natural colorants from plant material. In: 3rd Central European Congress on Food, May, 2006, Sofia, Bulgaria. Book of abstracts. Sofia: Bulgarian Industrial Association: Technical University of Sofia: Bulgarian Association of Food and Drink Industries, 2006, 79.
9. VATAI, T., ŠKERGET, M., KNEZ, Ž. Extraction of anthocyanins and product formulation with high pressure techniques. In: 12. Österrechische Chemietage: September, 2007, Klagenfurt, Austria: book of abstracts. [Vienna]: Gesellschaft Österreichische Chemiker, 2007, OP-29.
10. ŠKERGET, M., VATAI, T., BANVOLGYI, S., HORVATH, S., KNEZ, Ž., VATAI, G. Concentration and formulation of blackcurrant anthocyanins using membrane process and PGSS technology. In: First European Food Congress, November 2008, Ljubljana, Slovenia. Food production, nutrition, healthy consumers: delegate manual. Ljubljana, 2008, 1.
11. VATAI, T., ŠKERGET, M., ALESSI, P., KIKIC, I., KARETH, S., WEIDNER, E., KNEZ, Ž. Antocianin-kivonatok formulálása szuperkritikus széndioxiddal. In: Szuperkritikus oldószerek analitikai és műveleti alkalmazása konferencia 2008, Budapest, 2008, 15.
1.13 Objavljeni povzetek strokovnega prispevka na konferenci
12. VATAI, T., KNEZ, Ž., ŠKERGET, M. Extraction and formulation of anthocyanin-concentrates. In: 3rd Meeting of Students and University Professors Applied Biocatalysis, March, 2007, Maribor, Slovenia. Applied biocatalysis: book of abstracts. Maribor: Fakulteta za kemijo in kemijsko tehnologijo; Zagreb: Faculty of Chemical Engineering and Technology, 2007, 12.