Developing a Predictive Model of Quality of …xia/resources/Documents/balachandan... · Developing...
12
Developing a Predictive Model of Quality of Experience for Internet Video Athula Balachandran Vyas Sekar ‡ Aditya Akella † Srinivasan Seshan Ion Stoica * Hui Zhang Carnegie Mellon University † University of Wisconsin–Madison ‡ Stony Brook University * University of California, Berkeley ABSTRACT Improving users’ quality of experience (QoE) is crucial for sus- taining the advertisement and subscription based revenue models that enable the growth of Internet video. Despite the rich litera- ture on video and QoE measurement, our understanding of Internet video QoE is limited because of the shift from traditional meth- ods of measuring video quality (e.g., Peak Signal-to-Noise Ratio) and user experience (e.g., opinion scores). These have been re- placed by new quality metrics (e.g., rate of buffering, bitrate) and new engagement-centric measures of user experience (e.g., view- ing time and number of visits). The goal of this paper is to develop a predictive model of Internet video QoE. To this end, we identify two key requirements for the QoE model: (1) it has to be tied in to observable user engagement and (2) it should be actionable to guide practical system design decisions. Achieving this goal is challeng- ing because the quality metrics are interdependent, they have com- plex and counter-intuitive relationships to engagement measures, and there are many external factors that confound the relationship between quality and engagement (e.g., type of video, user connec- tivity). To address these challenges, we present a data-driven ap- proach to model the metric interdependencies and their complex relationships to engagement, and propose a systematic framework to identify and account for the confounding factors. We show that a delivery infrastructure that uses our proposed model to choose CDN and bitrates can achieve more than 20% improvement in over- all user engagement compared to strawman approaches. Categories and Subject Descriptors C.4 [Performance and Systems]: measurement techniques, per- formance attributes; C.2.4 [Computer-Communication Networks]: Distributed Systems—Client/server Keywords Video quality, Measurement, Performance, Human Factors Permission to make digital or hard copies of all or part of this work for personal or classroom use is granted without fee provided that copies are not made or distributed for profit or commercial advantage and that copies bear this notice and the full cita- tion on the first page. Copyrights for components of this work owned by others than ACM must be honored. Abstracting with credit is permitted. To copy otherwise, or re- publish, to post on servers or to redistribute to lists, requires prior specific permission and/or a fee. Request permissions from [email protected]. SIGCOMM’13, August 12–16, 2013, Hong Kong, China. Copyright 2013 ACM 978-1-4503-2056-6/13/08 ...$15.00. 1. INTRODUCTION The growth of Internet video has been driven by the confluence of low content delivery costs and the success of subscription- and advertisement-based revenue models [2]. Given this context, there is agreement among leading industry and academic initiatives that improving users’ quality of experience (QoE) is crucial to sustain these revenue models, especially as user expectations of video qual- ity are steadily rising [3, 20, 26]. Despite this broad consensus, our understanding of Internet video QoE is limited. This may surprise some, especially since QoE has a very rich history in the multimedia community [5, 6, 11]. The reason is that Internet video introduces new effects with respect to both quality and experience. First, traditional quality indices (e.g., Peak Signal-to-Noise Ratio (PSNR) [7]) are now replaced by met- rics that capture delivery-related effects such as rate of buffering, bitrate delivered, bitrate switching, and join time [3, 15, 20, 28, 36]. Second, traditional methods of quantifying experience through user opinion scores are replaced by new measurable engagement mea- sures such as viewing time and number of visits that more directly impact content providers’ business objectives [3, 36]. The goal of this paper is to develop a predictive model of user QoE in viewing Internet video. To this end, we identify two key requirements that any such model should satisfy. First, we want an engagement-centric model that accurately predicts user engage- ment in the wild (e.g., measured in terms of video play time, num- ber of user visits). Second, the model should be actionable and useful to guide the design of video delivery mechanisms; e.g., adap- tive video player designers can use this model to tradeoff bitrate, join time, and buffering [12, 13, 21] and content providers can use it to evaluate cost-performance tradeoffs of different CDNs and bi- trates [1, 28]. Meeting these requirements, however, is challenging because of three key factors (Section 2): • Complex relationship between quality and engagement: Prior measurement studies have shown complex and counter-intuitive effects in the relationship between quality metrics and engage- ment. For instance, one might assume that increasing bitrate should increase engagement. However, the relationship between bitrate and engagement is strangely non-monotonic [20]. • Dependencies between quality metrics: The metrics have sub- tle interdependencies and have implicit tradeoffs. For example, bitrate switching can reduce buffering. Similarly, aggressively choosing a high bitrate can increase join time and also cause more buffering. • Confounding factors: There are several potential confounding factors that impact the relationship between quality and engage- ment: the nature of the content (e.g., live vs. Video on Demand
Transcript of Developing a Predictive Model of Quality of …xia/resources/Documents/balachandan... · Developing...

Developing a Predictive Model ofQuality of Experience for Internet Video
Athula Balachandran Vyas Sekar‡ Aditya Akella†
Srinivasan Seshan Ion Stoica∗ Hui Zhang
Carnegie Mellon University † University of Wisconsin–Madison‡ Stony Brook University ∗ University of California, Berkeley
ABSTRACTImproving users’ quality of experience (QoE) is crucial for sus-taining the advertisement and subscription based revenue modelsthat enable the growth of Internet video. Despite the rich litera-ture on video and QoE measurement, our understanding of Internetvideo QoE is limited because of the shift from traditional meth-ods of measuring video quality (e.g., Peak Signal-to-Noise Ratio)and user experience (e.g., opinion scores). These have been re-placed by new quality metrics (e.g., rate of buffering, bitrate) andnew engagement-centric measures of user experience (e.g., view-ing time and number of visits). The goal of this paper is to developa predictive model of Internet video QoE. To this end, we identifytwo key requirements for the QoE model: (1) it has to be tied in toobservable user engagement and (2) it should be actionable to guidepractical system design decisions. Achieving this goal is challeng-ing because the quality metrics are interdependent, they have com-plex and counter-intuitive relationships to engagement measures,and there are many external factors that confound the relationshipbetween quality and engagement (e.g., type of video, user connec-tivity). To address these challenges, we present a data-driven ap-proach to model the metric interdependencies and their complexrelationships to engagement, and propose a systematic frameworkto identify and account for the confounding factors. We show thata delivery infrastructure that uses our proposed model to chooseCDN and bitrates can achieve more than 20% improvement in over-all user engagement compared to strawman approaches.
Categories and Subject DescriptorsC.4 [Performance and Systems]: measurement techniques, per-formance attributes; C.2.4 [Computer-Communication Networks]:Distributed Systems—Client/server
KeywordsVideo quality, Measurement, Performance, Human Factors
Permission to make digital or hard copies of all or part of this work for personal orclassroom use is granted without fee provided that copies are not made or distributedfor profit or commercial advantage and that copies bear this notice and the full cita-tion on the first page. Copyrights for components of this work owned by others thanACM must be honored. Abstracting with credit is permitted. To copy otherwise, or re-publish, to post on servers or to redistribute to lists, requires prior specific permissionand/or a fee. Request permissions from [email protected]’13, August 12–16, 2013, Hong Kong, China.Copyright 2013 ACM 978-1-4503-2056-6/13/08 ...$15.00.
1. INTRODUCTIONThe growth of Internet video has been driven by the confluence
of low content delivery costs and the success of subscription- andadvertisement-based revenue models [2]. Given this context, thereis agreement among leading industry and academic initiatives thatimproving users’ quality of experience (QoE) is crucial to sustainthese revenue models, especially as user expectations of video qual-ity are steadily rising [3, 20, 26].
Despite this broad consensus, our understanding of Internet videoQoE is limited. This may surprise some, especially since QoE hasa very rich history in the multimedia community [5, 6, 11]. Thereason is that Internet video introduces new effects with respect toboth quality and experience. First, traditional quality indices (e.g.,Peak Signal-to-Noise Ratio (PSNR) [7]) are now replaced by met-rics that capture delivery-related effects such as rate of buffering,bitrate delivered, bitrate switching, and join time [3, 15, 20, 28, 36].Second, traditional methods of quantifying experience through useropinion scores are replaced by new measurable engagement mea-sures such as viewing time and number of visits that more directlyimpact content providers’ business objectives [3, 36].
The goal of this paper is to develop a predictive model of userQoE in viewing Internet video. To this end, we identify two keyrequirements that any such model should satisfy. First, we want anengagement-centric model that accurately predicts user engage-ment in the wild (e.g., measured in terms of video play time, num-ber of user visits). Second, the model should be actionable anduseful to guide the design of video delivery mechanisms; e.g., adap-tive video player designers can use this model to tradeoff bitrate,join time, and buffering [12, 13, 21] and content providers can useit to evaluate cost-performance tradeoffs of different CDNs and bi-trates [1, 28].
Meeting these requirements, however, is challenging because ofthree key factors (Section 2):• Complex relationship between quality and engagement: Prior
measurement studies have shown complex and counter-intuitiveeffects in the relationship between quality metrics and engage-ment. For instance, one might assume that increasing bitrateshould increase engagement. However, the relationship betweenbitrate and engagement is strangely non-monotonic [20].• Dependencies between quality metrics: The metrics have sub-
tle interdependencies and have implicit tradeoffs. For example,bitrate switching can reduce buffering. Similarly, aggressivelychoosing a high bitrate can increase join time and also causemore buffering.• Confounding factors: There are several potential confounding
factors that impact the relationship between quality and engage-ment: the nature of the content (e.g., live vs. Video on Demand

Engagement-centric ActionablePSNR-like(e.g., [17])
7 X
OpinionScores(e.g., [6])
X 7
Network-level(e.g., bandwidth,latency [35])
7 X
Single metric(e.g., bitrate,buffering)
7 X
Naive learning 7 7Our approach X X
Table 1: A summary of prior models for video QoE and how theyfall short of our requirements
(VOD), popularity), temporal effects (e.g., prime time vs. off-peak), and user-specific attributes (e.g., connectivity, device,user interest) [26].
As Table 1 shows, past approaches fail on one or more of theserequirements. For instance, user opinion scores may be reflective ofactual engagement, but these metrics may not be actionable becausethese do not directly relate to system design decisions. On the otherhand, network- and encoding-related metrics are actionable but donot directly reflect the actual user engagement. Similarly, one maychoose a single quality metric like buffering or bitrate, but this ig-nores the complex metric interdependencies and relationships ofother metrics to engagement. Finally, none of the past approachestake into account the wide range of confounding factors that impactuser engagement in the wild.
In order to tackle these challenges, we present a data-driven ap-proach to develop a robust model to predict user engagement. Weleverage large-scale measurements of user engagement and videosession quality to run machine learning algorithms to automaticallycapture the complex relationships and dependencies [23]. A directapplication of machine learning, however, may result in models thatare not intuitive or actionable, especially because of the confound-ing factors. To this end, we develop a systematic framework toidentify and account for these confounding factors.
Our main observations are:• Compared to machine learning algorithms like naive Bayes and
simple regression, a decision tree is sufficiently expressive enoughto capture the complex relationships and interdependencies andprovides close to 45% accuracy in predicting engagement. Fur-thermore, decision trees provide an intuitive understanding intothese relationships and dependencies.• Type of video (live vs. VOD) , device (PC vs. mobile devices
vs. TV) and connectivity (cable/DSL vs. wireless) are the threemost important confounding factors that affect engagement. Infact, the QoE model is considerably different across differenttypes of videos.• Refining the decision tree model that we developed by incorpo-
rating these confounding factors can further improve the accu-racy to as much as 70%.• Using a QoE-aware delivery infrastructure that uses our pro-
posed model to choose CDN and bitrates can lead to more than20% improvement in overall user engagement compared to otherapproaches for optimizing video delivery.
Contributions and Roadmap: To summarize, our key contribu-tions are• Systematically highlighting challenges in obtaining a robust video
QoE model (Section 2);
Control Parameters e.g., CDN, bitrate, CDN server
Quality Metrics e.g., buffering, join <me
Engagement e.g., play <me, number of visits
Confounding Factors
e.g., device, genre e.g., mobile users are more tolerant
e.g., live users don’t view to completion
e.g., live vs VoD have different join time
Problem Scope
Figure 1: Our goal is to develop a predictive model of engagementthat accounts for the complex relationship between quality and en-gagement, the interdependencies between quality metrics, and theconfounding factors that impact different aspects of this learning.We do not attempt to model the impact of the control parameters onquality or engagement in this paper.
• A roadmap for developing Internet video QoE that leveragesmachine learning (Section 3);• A methodology for identifying and addressing the confounding
factors that affect engagement (Section 4 and Section 5); and• A practical demonstration of the utility of our QoE models to
improve engagement (Section 6)We discuss outstanding issues in Section 7 and related work in Sec-tion 8 before concluding in Section 9.
2. MOTIVATION AND CHALLENGESIn this section, we provide a brief background of the problem
space and highlight the key challenges in developing a unified QoEmodel using data-driven techniques.
2.1 Problem scopeMultiple measurement studies have shown that video quality im-
pacts user engagement [20,26]. Given that engagement directly af-fects advertisement- and subscription-based revenue streams, thereis broad consensus across the different players in the Internet videoecosystem (content providers, video player designers, third-partyoptimizers, CDNs) on the need to optimize video quality accordingto these metrics. In this paper, we focus on the fraction of videothat the user viewed before quitting as the measure of engagementand the following industry-standard quality metrics:• Average bitrate: Video players typically switch between differ-
ent bitrate streams during a single video session. Average bi-trate, measured in kilobits per second, is the time average of thebitrates played during a session weighted by the time durationeach bitrate was played.• Join time: This represents the time it takes for the video to start
playing after the user initiates a request to play the video and ismeasured in seconds.• Buffering ratio: It is computed as the ratio of the time the video
player spends buffering to the sum of the buffering and playtime and is measured in percentage.• Rate of buffering: It captures the frequency at which buffering
events occur during the session and is computed as the ratio ofthe number of buffering events to the duration of the session.
In this paper, we are not reporting the impact of rate of bitrateswitching due to two reasons. First, we were unable to collect thisdata for the large time frames that we are working on. Second, theproviders use specific bitrate adaptation algorithms and we want to
avoid reaching conclusions based on them. That said, the frame-work and the techniques that we propose are applicable if we wantto later include more quality metrics to the above list.
Our goal in this paper is to develop a principled predictive modelof the user engagement as a function of these quality metrics. Sucha model can then be used to inform the system design decisionsthat different entities in the video ecosystem make in order to tunethe video according to the quality metrics to maximize engagement.For example, a video control plane may choose the CDN and bitratefor a video session based on a global optimization scheme [28],CDNs choose the servers and the specific bitrates [3], video playerdesigners can adaptively switch bitrates [13] and so on.
An alternative direction one may consider is building a predic-tive model that relates the control parameters used (e.g., CDN,CDN server, adaptive bitrate selection logic) to the user engage-ment. While this is certainly a viable approach that a specific entityin the video delivery chain (e.g., CDN, player, “meta-CDN”)1 canemploy, we believe that we can decouple this into two problems:(a) learning the relationship between the quality metrics and en-gagement (quality→ engagement) and (b) learning the relationshipbetween the control parameters and engagement (knobs→ quality).We do so because these two relationships evolve at fundamentallydifferent timescales and depend on diverse factors (e.g., user be-havior vs. network/server artifacts). First, the control parametersavailable to different entities in the ecosystem may be very differ-ent; e.g., the control plane [28] operates at a coarse granularity ofchoosing the CDN whereas the CDN can choose a specific server.Second, the control knobs for each entity may themselves changeover time; e.g., new layered codecs or more fine-grained bitrates.One can view this as a natural layering argument—decoupling thetwo problems allows control logics to evolve independently andhelps us reuse a reference QoE model across different contexts(e.g., control plane, CDN, video player).
While modeling the knobs→quality problem is itself an interest-ing research challenge, this is outside the scope of this paper; thefocus of this paper is on the problem of modeling the quality →engagement relationship.2 As we discuss next, there are three keychallenges in addressing this problem.
2.2 DatasetThe data used in this paper was collected by conviva.com in
real time using a client-side instrumentation library. This librarygets loaded when users watch video on conviva.com’s affiliatecontent providers’ websites. We collect all the quality metrics de-scribed earlier as well as play time for each individual session. Inaddition we also collect a range of user-specific (e.g., location, de-vice, connectivity), content (e.g., live vs. VOD, popularity), andtemporal attributes (e.g., hour of the day).
The dataset that is used for various analysis in this paper is basedon 40 million video viewing sessions collected over 3 months span-ning two popular video content providers (based in the US). Thefirst provider serves mostly VOD content that are between 35 min-utes and 60 minutes long. The second provider serves sports eventsthat are broadcast while the event is happening. Our study is lim-ited to clients in the United States.3
1Some services offer CDN switching services across multiplephysical CDNs to offer better cost-performance tradeoffs (e.g., [9]).2To evaluate the potential improvement due to our approach, how-ever, we need to model this relationship as well. We use a simplequality prediction model in Section 6.3These are distinct providers and there is no content overlap; i.e.,none of the VOD videos is a replay of a live event.
500 1000 1500 2000Average bitrate (Kbps)
20
22
24
26
28
30
32
34
Frac
tion
ofco
nten
tvie
wed
(%)
(a) Non-monotonic relationship be-tween average bitrate and engagement
0.0 0.2 0.4 0.6 0.8Rate of buffering (# of buff events/min)
20
30
40
50
60
70
80
Frac
tion
ofco
nten
tvie
wed
(%)
(b) Threshold effect between rate ofbuffering and engagement
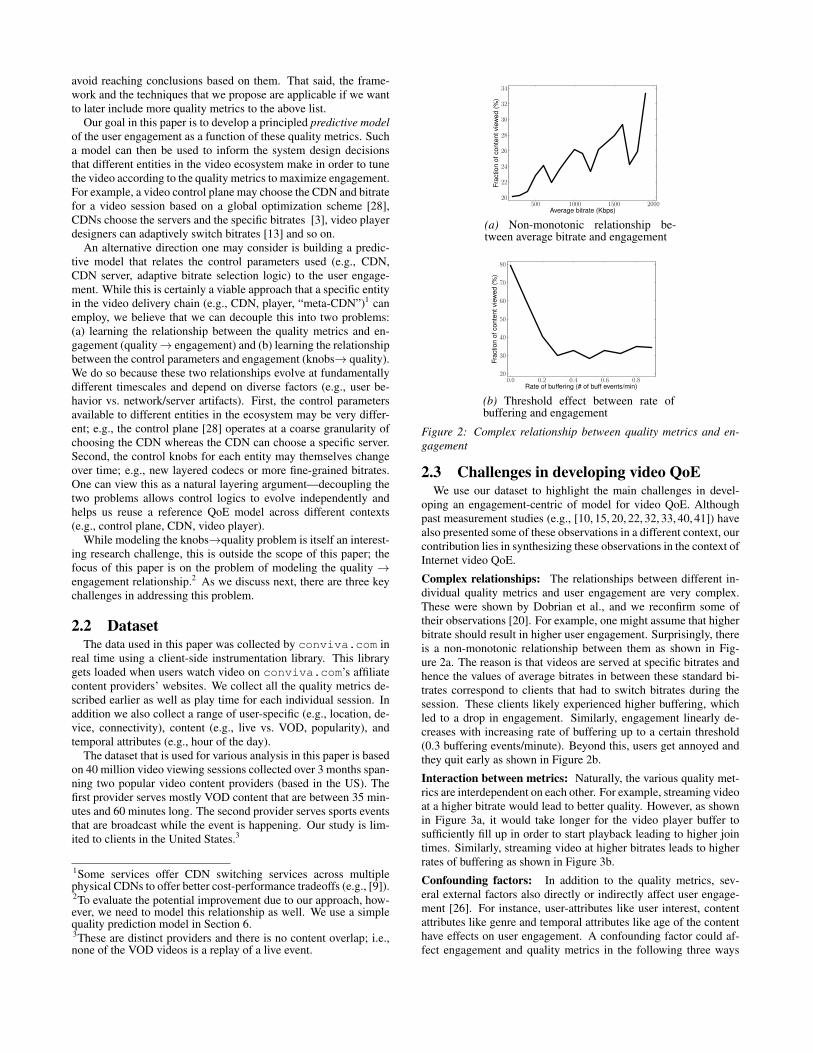
Figure 2: Complex relationship between quality metrics and en-gagement
2.3 Challenges in developing video QoEWe use our dataset to highlight the main challenges in devel-
oping an engagement-centric of model for video QoE. Althoughpast measurement studies (e.g., [10, 15, 20, 22, 32, 33, 40, 41]) havealso presented some of these observations in a different context, ourcontribution lies in synthesizing these observations in the context ofInternet video QoE.
Complex relationships: The relationships between different in-dividual quality metrics and user engagement are very complex.These were shown by Dobrian et al., and we reconfirm some oftheir observations [20]. For example, one might assume that higherbitrate should result in higher user engagement. Surprisingly, thereis a non-monotonic relationship between them as shown in Fig-ure 2a. The reason is that videos are served at specific bitrates andhence the values of average bitrates in between these standard bi-trates correspond to clients that had to switch bitrates during thesession. These clients likely experienced higher buffering, whichled to a drop in engagement. Similarly, engagement linearly de-creases with increasing rate of buffering up to a certain threshold(0.3 buffering events/minute). Beyond this, users get annoyed andthey quit early as shown in Figure 2b.
Interaction between metrics: Naturally, the various quality met-rics are interdependent on each other. For example, streaming videoat a higher bitrate would lead to better quality. However, as shownin Figure 3a, it would take longer for the video player buffer tosufficiently fill up in order to start playback leading to higher jointimes. Similarly, streaming video at higher bitrates leads to higherrates of buffering as shown in Figure 3b.
Confounding factors: In addition to the quality metrics, sev-eral external factors also directly or indirectly affect user engage-ment [26]. For instance, user-attributes like user interest, contentattributes like genre and temporal attributes like age of the contenthave effects on user engagement. A confounding factor could af-fect engagement and quality metrics in the following three ways

0.0 0.2 0.4 0.6 0.8 1.0Fraction of video viewed
0
20
40
60
80
100
cdf(
%of
view
ers)
liveVOD
(a) User viewing pattern for live and VOD
0 2 4 6 8 10Join Time (s)
0
20
40
60
80
100
cdf(
%of
view
ers)
liveVOD
(b) Join time distribution for live and VOD
0.0 0.2 0.4 0.6 0.8Rate of buffering (/minute)
20
30
40
50
60
70
80
Frac
tion
ofco
nten
tvie
wed
(%) DSL/Cable providers
Wireless providers
(c) Tolerence to rate of buffering on differentconnectivity
Figure 4: Various confounding factors directly or indirectly affect engagement
400 600 800 1000 1200 1400 1600 1800Average bitrate (Kbps)
0
20
40
60
80
Join
time
(s)
(a) Higher bitrates cause higher jointimes
400 600 800 1000 1200 1400Average bitrate (Kbps)
0
1
2
3
4
Rat
eof
buffe
ring
(/min
ute)
(b) Higher bitrates cause higher rates ofbuffering
Figure 3: The quality metrics are interdependent on each other
(Figure 1). First, some factors may affect user viewing behavioritself and result in different observed engagements. For instance,Figure 4a shows that live and VOD video sessions have signifi-cantly different viewing patterns. While a significant fraction ofthe users view VOD videos to completion, live sessions are moreshort-lived. Second, the confounding factor can impact the qual-ity metric. As Figure 4b shows, the join time distribution for liveand VOD sessions are considerably different. Finally, and perhapsmost importantly, the confounding factor can affect the relationshipbetween the quality metrics and engagement. For example, we seein Figure 4c that users on wireless connectivity are more tolerant torate of buffering compared to users on DSL/cable connectivity.
3. APPROACH OVERVIEWAt a high-level, our goal is to express user engagement as a func-
tion of the quality metrics. That is, we want to capture a relation-ship Engagement = f({QualityMetrici}), where Engagementcan be the video playtime, number of visits to a website, and eachQualityMetrici represents observed metrics such as buffering ra-
Machine Learning e.g., Decision Trees
Quality Metrics e.g., buffering
Engagement e.g., playtime
å
Refined Predictive Model e.g., Multiple decision trees
Extract Confounding e.g., InfoGain
Section 3 Section 4
Section 5
Figure 5: High level overview of our approach. We begin by us-ing standard machine learning approaches to build a basic predic-tive model and also to extract the key confounding factors. Havingidentified the confounding factors, we refine our predictive modelto improve the accuracy.
tio, average bitrate etc. Ideally, we want this function f to be ac-curate, intuitive, and actionable in order to be adopted by contentproviders, video player designers, CDNs, and third-party optimiza-tion services to evaluate different provisioning and resource man-agement tradeoffs (e.g., choosing different CDNs and bitrates).
As we saw in the motivating measurements in the previous sec-tion, developing such a model is challenging because of the com-plex relationships between the quality metrics and engagement, in-terdependencies between different quality metrics, and the pres-ence of various confounding factors that affect the relationship be-tween the quality metrics and engagement. In this section, webegin by presenting a high-level methodology for systematicallytackling these challenges. While the specific quality and engage-ment metrics of interest may change over time and the output ofthe prediction model may evolve as the video delivery infrastruc-ture evolves, we believe that the data-driven and machine learningbased roadmap and techniques we envision will continue to apply.
3.1 RoadmapFigure 5 provides a high-level overview showing three main com-
ponents in our approach. A key enabler for the viability of ourapproach is that several content providers, CDNs and third-partyoptimization services today collect data regarding individual videosessions using client-side instrumentation on many popular videosites. This enables a data-driven machine learning approach totackle the above challenges.
Tackling complex relationships and interdependencies: We needto be careful in using machine learning as a black-box on two ac-counts. First, the learning algorithms must be expressive enough totackle our challenges. For instance, naive approaches that assumethat the quality metrics are independent variables or simple regres-sion techniques that implicitly assume that the relationships be-

5 10 15 20Number of classes
0
20
40
60
80
100
Acc
urac
yin
%
Naive BayesDecision TreeRegressionSingle metric regressionRandom coin toss
Figure 6: Decision tree is more expressible than naive Bayes andregression based schemes
tween quality and engagement are linear are unlikely to work. Sec-ond, we do not want an overly complex machine learning algorithmthat becomes unintuitive or unusable for practitioners. Fortunately,as we discuss in Section 3.2 we find that decision trees, which aregenerally perceived as usable intuitive models [24, 27, 37, 39]4 arealso the most accurate. In some sense, we are exploiting the ob-servation that given large datasets, simple non-parametric machinelearning algorithms (e.g., decision trees) actually work [23].
Identifying the important confounding factors: Even thoughpast studies have shown that external factors such as users’ de-vice and connectivity affect engagement [26], there is no systematicmethod to identify these factors. In Section 4, we propose a taxon-omy for classifying potentially confounding factors. As we saw inthe previous section, the confounding factors can affect our under-standing in all three respects: affecting quality, affecting engage-ment, and also affecting how quality impacts engagement. Thus,we need a systematic methodology to identify the factors that havean impact on all three dimensions.
Refinement to account for confounding factors: As we willshow in Section 3.2, decision trees are expressive enough to cap-ture the relationships between quality metrics and engagement. Itmay not, however, be expressive enough to capture the impact ofall the confounding factors on engagement. In Section 5, we evalu-ate different ways by which we can incorporate these confoundingfactors to form a unified model.
3.2 Machine learning building blocksDecision trees as predictive models: We cast the problem of mod-eling the relationship between the different quality metrics as a dis-crete classification problem. We begin by categorizing engagementinto different classes based on the fraction of video that the userviewed before quitting. For example, when the number of classesis set to 5 the model tries to predict if the user viewed 0-20% or 20-40% or 40-60% or 60-80% or 80-100% of the video before quitting.We can select the granularity at which the model predicts engage-ment by appropriately setting the number of classes (e.g., 5 classesmeans 20% bins vs. 20 classes means 5% bins). We use similardomain-specific discrete classes to bin the different quality met-rics. For join time, we use bins of 1 second interval; for bufferingratio we use 1% bins; for rate of buffering we use 0.1/minute bins;and for average bitrate we use 100 kbps-sized bins.
Figure 6 compares the performance of three different machinelearning algorithms: binary decision trees, naive Bayes, and classi-fication based on linear regression. The results are based on 10-fold
4Decision trees can be directly mapped into event processing rulesthat system designers are typically familiar with [39].
cross-validation—the data is divided into 10 equally sized subsetsand the model is trained 10 times, leaving out one of the subsetseach time from training and tested on the omitted subset [31]. Nat-urally, the prediction accuracy decreases when the model has topredict at a higher granularity. We observe that decision trees per-form better than naive Bayes and linear regression. This is becausenaive Bayes algorithm assumes that the quality metrics are inde-pendent of each other and hence it does not attempt to capture in-terdependencies between them. Similarly, linear regression is notexpressible enough to capture the complex relationships betweenquality metrics and engagement. Also, as shown in Figure 6, per-forming linear regression based on just a single “best" metric (av-erage bitrate) yields even lower accuracy since we are ignoring thecomplex metric interdependencies and the relationships betweenother metrics and engagement.
Information gain analysis: Information gain is a standard ap-proach for uncovering hidden relationships between variables. Moreimportantly, it does so without making any assumption about thenature of these relationships (e.g., monotone, linear effects); it merelyidentifies that there is some potential relationship. Informationgain is a standard technique used in machine learning for featureextraction—i.e., identifying the key features that we need to use ina prediction task. Thus, it is a natural starting point for systemati-cally identifying confounding factors.
The information gain is based on the idea of entropy of a randomvariable Y which is defined as H(Y ) =
∑i P [Y = yi]log
1P [Y =yi]
where P [Y = yi] is the probability that Y = yi. It represents thenumber of bits that would have to be transmitted to identify Y fromn equally likely possibilities. The lesser the entropy the more uni-form the distribution is. The conditional entropy of Y given anotherrandom variable X is H(Y |X) =
∑j P [X = xj ]H(Y |X = xj).
It represents the number of bits that would be required to be trans-mitted to identify Y given that both the sender and the receiverknow the corresponding value of X . Information gain is definedas H(Y ) − H(Y |X) and it is the number of bits saved on aver-age when we transmit Y and both sender and receiver know X. Therelative information gain can then be defined as H(Y )−H(Y |X)
H(Y ).
In the next section, we use the information gain analysis to rea-son if a confounding factor impacts either engagement or quality.
Compacted decision trees: Decision trees help in categorizingand generalizing the data given in the dataset and provide a vi-sual model representing various if-then rules. One main drawbackwhile dealing with multi-dimensional large datasets is that thesetechniques produce too many rules making it difficult to under-stand and use the discovered rules with just manual inspection orother analysis techniques [27]. In order to get a high-level intuitiveunderstanding of the impact of different quality metrics on engage-ment, we compact the decision tree. First, we group the qualitymetrics into more coarse-grained bins. For instance, we classifyaverage bitrate into three classes—very low, low, and high. Theother quality metrics (buffering ratio, buffering rate, and join time)and engagement are classified as either high or low. We then runthe decision tree algorithm and compact the resulting structure toform general rules using the technique described in [27]. The high-level idea is to prune the nodes whose majority classes are signif-icant; e.g., if more than 75% of the data points that follow a par-ticular rule belong to a particular engagement class then we prunethe tree at that level. The tree formed using this technique may notbe highly accurate. Note that the goal of compacting the decisiontree is only to get a high-level understanding of what quality met-rics affect engagement the most and form simple rules of how theyimpact engagement. Our predictive model uses the original (i.e.,
uncompressed) decision tree; we do not sacrifice any expressivepower. In the next section, we use this technique to test if a con-founding factor impacts the relationship between quality metricsand engagement—particularly to check if it changes the relativeimportance of the quality metrics.
3.3 LimitationsWe acknowledge three potential limitations in our study that could
apply more broadly to video QoE measurement.
• Fraction of video viewed as a metric for engagement: Whilefraction of video viewed before quitting may translate into rev-enue associated from actual advertisement impressions, it doesnot capture various psychological factors that affect engage-ment (e.g., user may not be interested in the video and mightbe playing the video in the background). We use fraction ofvideo viewed as a measure of engagement since it can be eas-ily and objectively measured and it provides a concrete startingpoint. The high-level framework that we propose can be appliedto other notions of engagement.• Coverage over confounding factors: There might be several
confounding factors that affect engagement that are not cap-tured in our dataset (e.g., user interest in the content). Ourmodel provides the baseline in terms of accuracy—uncoveringother confounding factors and incorporating them into the modelwill lead to better models and higher prediction accuracy.• Early quitters: A large fraction of users quit the session after
watching the video for a short duration. These users might beeither “sampling" the video or quitting the session because ofquality issues. They can be treated in three ways: (1) Removethem completely from the analysis, (2) Separate them into twogroups based on their quality metrics (high quality populationand low quality population) and learn a separate model for eachgroup (3) Profile users based on their viewing history and pre-dict whether they will quit early or not based on their interestin the video content. We use (1) in this paper as it provides aclearer understanding of how quality impacts engagement. Thatsaid, approaches (2) and (3) are likely to be useful and com-plementary in a system-design context; e.g., to guide resource-driven tradeoffs on which users to prioritize.
4. IDENTIFYING CONFOUNDING FACTORSIn this section, we propose a framework for identifying con-
founding factors. To this end, we begin with a taxonomy of po-tentially confounding factors. Then, we use the machine learningbuilding blocks described in the previous section to identify thefactors that have a non-trivial impact on engagement.
4.1 ApproachWe identify three categories of potential confounding factors from
our dataset:
• Content attributes: This includes the type of video (i.e., livevs. VOD) and the overall popularity (i.e., number of views).• User attributes: This includes the user’s location (region within
continental US), device (e.g., smartphones, tablets, PC, TV),and connectivity (e.g., DSL, cable, mobile or wireless).• Temporal attributes: Unlike live content that is viewed dur-
ing the event, VOD objects in the dataset are available to beaccessed at any point in time since its release. This opens upvarious temporal attributes that can possibly affect engagementincluding the time of day and day of week of the session and thetime since release for the object (e.g., day of release vs. not).
ConfoundingFactor
Engagement JoinTime
Buff.Ratio
Rate ofbuff.
Avg. bi-trate
Type of video(live or VOD)
8.8 15.2 0.7 0.3 6.9
Overall popu-larity (live)
0.1 0.0 0.0 0.2 0.4
Overall popu-larity (VOD)
0.1 0.2 0.4 0.1 0.2
Time since re-lease (VOD)
0.1 0.1 0.1 0.0 0.2
Time of day(VOD)
0.2 0.6 2.2 0.5 0.4
Day of week(VOD)
0.1 0.2 1.1 0.2 0.1
Device (live) 1.3 1.3 1.1 1.2 2.7Device (VOD) 0.5 11.8 1.5 1.5 10.3Region (live) 0.6 0.7 1.3 0.5 0.4Region (VOD) 0.1 0.3 1.2 0.2 0.2Connectivity(live)
0.7 1.1 1.4 1.1 1.5
Connectivity(VOD)
0.1 0.4 1.1 1.4 1.3
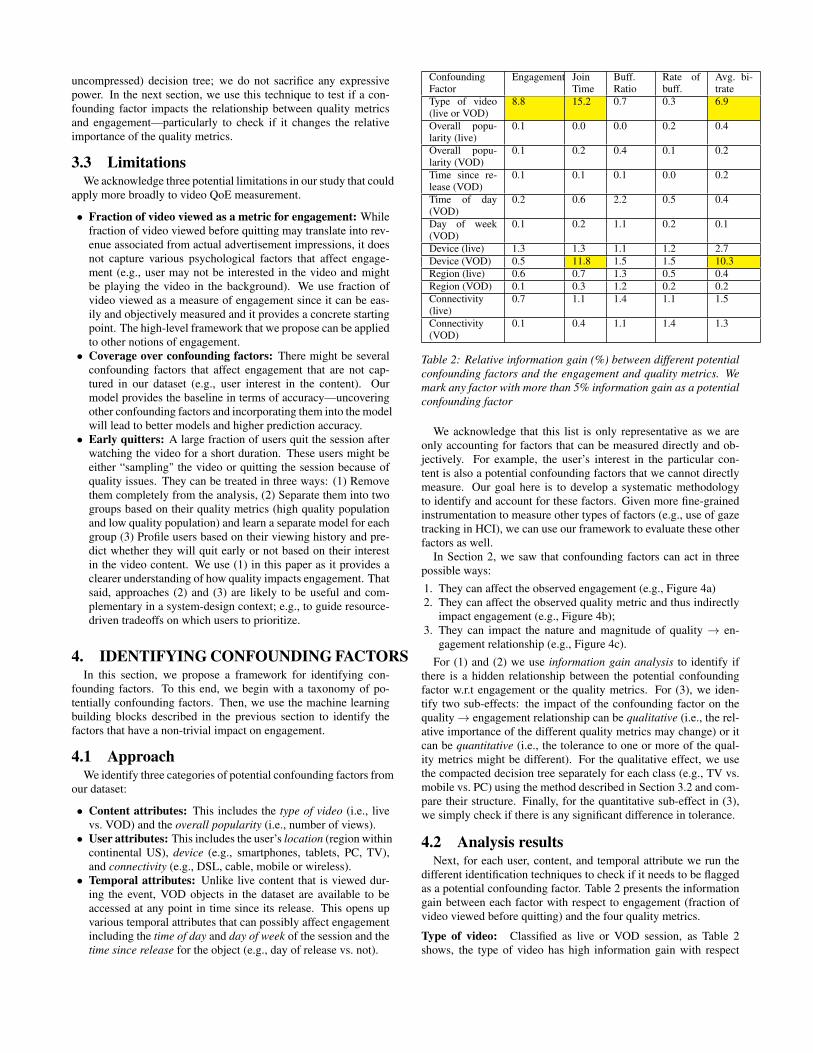
Table 2: Relative information gain (%) between different potentialconfounding factors and the engagement and quality metrics. Wemark any factor with more than 5% information gain as a potentialconfounding factor
We acknowledge that this list is only representative as we areonly accounting for factors that can be measured directly and ob-jectively. For example, the user’s interest in the particular con-tent is also a potential confounding factors that we cannot directlymeasure. Our goal here is to develop a systematic methodologyto identify and account for these factors. Given more fine-grainedinstrumentation to measure other types of factors (e.g., use of gazetracking in HCI), we can use our framework to evaluate these otherfactors as well.
In Section 2, we saw that confounding factors can act in threepossible ways:1. They can affect the observed engagement (e.g., Figure 4a)2. They can affect the observed quality metric and thus indirectly
impact engagement (e.g., Figure 4b);3. They can impact the nature and magnitude of quality → en-
gagement relationship (e.g., Figure 4c).For (1) and (2) we use information gain analysis to identify if
there is a hidden relationship between the potential confoundingfactor w.r.t engagement or the quality metrics. For (3), we iden-tify two sub-effects: the impact of the confounding factor on thequality→ engagement relationship can be qualitative (i.e., the rel-ative importance of the different quality metrics may change) or itcan be quantitative (i.e., the tolerance to one or more of the qual-ity metrics might be different). For the qualitative effect, we usethe compacted decision tree separately for each class (e.g., TV vs.mobile vs. PC) using the method described in Section 3.2 and com-pare their structure. Finally, for the quantitative sub-effect in (3),we simply check if there is any significant difference in tolerance.
4.2 Analysis resultsNext, for each user, content, and temporal attribute we run the
different identification techniques to check if it needs to be flaggedas a potential confounding factor. Table 2 presents the informationgain between each factor with respect to engagement (fraction ofvideo viewed before quitting) and the four quality metrics.
Type of video: Classified as live or VOD session, as Table 2shows, the type of video has high information gain with respect
!"#$%&'($
%&)*$(+$,"#*-./0$ 1/0$2$3(4$
1/0$2$3(4$1/0$2$5.05$
3(4$ 5.05$
3(4$ 5.05$
(a) VOD
!"#$%&#'()*$%*#'
(+,'-%./'
-%*#'/0'1+,#$)2&'
32&'4'5/6'
32&'4'5/6'
32&'4'5/6'32&'4'7)&7'
'''5/6' "#$8'5/69'7)&7'
5/6' 7)&7'
5/6' 7)&7'
(b) Live
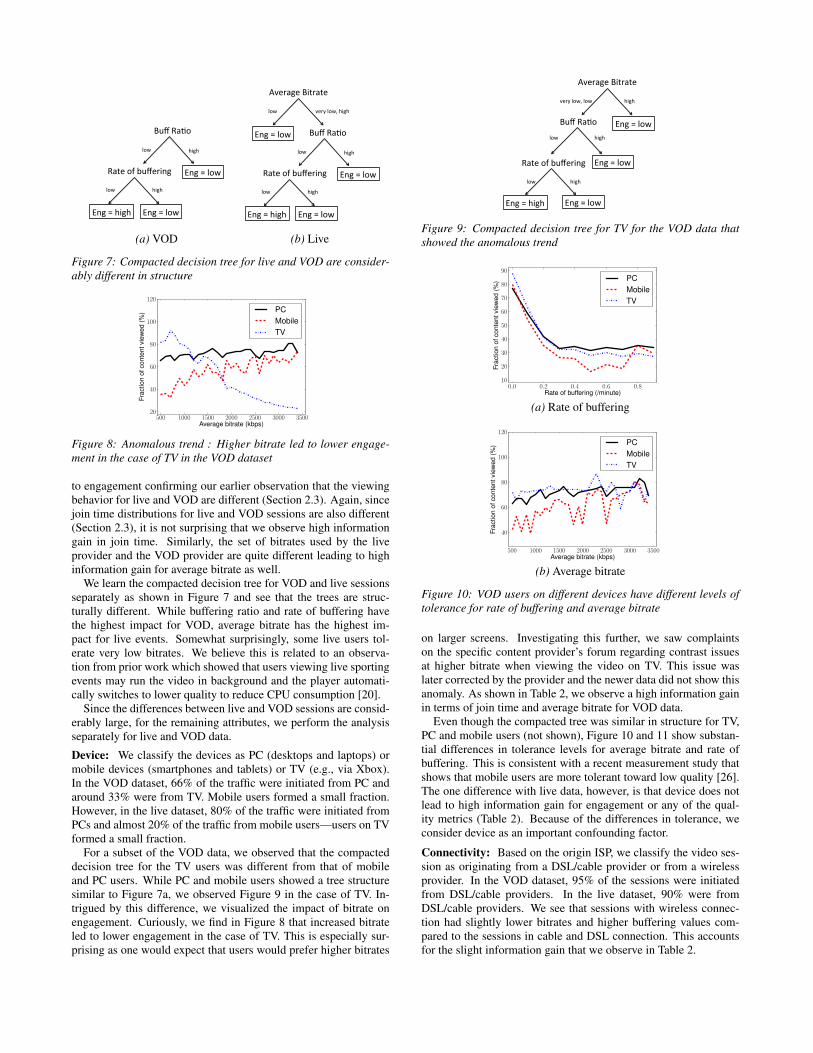
Figure 7: Compacted decision tree for live and VOD are consider-ably different in structure
500 1000 1500 2000 2500 3000 3500Average bitrate (kbps)
20
40
60
80
100
120
Frac
tion
ofco
nten
tvie
wed
(%) PC
MobileTV
Figure 8: Anomalous trend : Higher bitrate led to lower engage-ment in the case of TV in the VOD dataset
to engagement confirming our earlier observation that the viewingbehavior for live and VOD are different (Section 2.3). Again, sincejoin time distributions for live and VOD sessions are also different(Section 2.3), it is not surprising that we observe high informationgain in join time. Similarly, the set of bitrates used by the liveprovider and the VOD provider are quite different leading to highinformation gain for average bitrate as well.
We learn the compacted decision tree for VOD and live sessionsseparately as shown in Figure 7 and see that the trees are struc-turally different. While buffering ratio and rate of buffering havethe highest impact for VOD, average bitrate has the highest im-pact for live events. Somewhat surprisingly, some live users tol-erate very low bitrates. We believe this is related to an observa-tion from prior work which showed that users viewing live sportingevents may run the video in background and the player automati-cally switches to lower quality to reduce CPU consumption [20].
Since the differences between live and VOD sessions are consid-erably large, for the remaining attributes, we perform the analysisseparately for live and VOD data.
Device: We classify the devices as PC (desktops and laptops) ormobile devices (smartphones and tablets) or TV (e.g., via Xbox).In the VOD dataset, 66% of the traffic were initiated from PC andaround 33% were from TV. Mobile users formed a small fraction.However, in the live dataset, 80% of the traffic were initiated fromPCs and almost 20% of the traffic from mobile users—users on TVformed a small fraction.
For a subset of the VOD data, we observed that the compacteddecision tree for the TV users was different from that of mobileand PC users. While PC and mobile users showed a tree structuresimilar to Figure 7a, we observed Figure 9 in the case of TV. In-trigued by this difference, we visualized the impact of bitrate onengagement. Curiously, we find in Figure 8 that increased bitrateled to lower engagement in the case of TV. This is especially sur-prising as one would expect that users would prefer higher bitrates
!"#$%&#'()*$%*#'
(+,'-%./'
-%*#'/0'1+,#$)2&'
32&'4'5/6'
32&'4'5/6'
32&'4'5/6'32&'4'7)&7'
'"#$8'5/69'5/6' 7)&7'
5/6' 7)&7'
5/6' 7)&7'
Figure 9: Compacted decision tree for TV for the VOD data thatshowed the anomalous trend
0.0 0.2 0.4 0.6 0.8Rate of buffering (/minute)
10
20
30
40
50
60
70
80
90
Frac
tion
ofco
nten
tvie
wed
(%) PC
MobileTV
(a) Rate of buffering
500 1000 1500 2000 2500 3000 3500Average bitrate (kbps)
40
60
80
100
120
Frac
tion
ofco
nten
tvie
wed
(%) PC
MobileTV
(b) Average bitrate
Figure 10: VOD users on different devices have different levels oftolerance for rate of buffering and average bitrate
on larger screens. Investigating this further, we saw complaintson the specific content provider’s forum regarding contrast issuesat higher bitrate when viewing the video on TV. This issue waslater corrected by the provider and the newer data did not show thisanomaly. As shown in Table 2, we observe a high information gainin terms of join time and average bitrate for VOD data.
Even though the compacted tree was similar in structure for TV,PC and mobile users (not shown), Figure 10 and 11 show substan-tial differences in tolerance levels for average bitrate and rate ofbuffering. This is consistent with a recent measurement study thatshows that mobile users are more tolerant toward low quality [26].The one difference with live data, however, is that device does notlead to high information gain for engagement or any of the qual-ity metrics (Table 2). Because of the differences in tolerance, weconsider device as an important confounding factor.
Connectivity: Based on the origin ISP, we classify the video ses-sion as originating from a DSL/cable provider or from a wirelessprovider. In the VOD dataset, 95% of the sessions were initiatedfrom DSL/cable providers. In the live dataset, 90% were fromDSL/cable providers. We see that sessions with wireless connec-tion had slightly lower bitrates and higher buffering values com-pared to the sessions in cable and DSL connection. This accountsfor the slight information gain that we observe in Table 2.

0.0 0.2 0.4 0.6 0.8Rate of buffering (/minute)
0
5
10
15
20
25
30
Frac
tion
ofco
nten
tvie
wed
(%) PC
MobileTV
(a) Rate of buffering
500 1000 1500 2000Average bitrate (kbps)
0
10
20
30
40
50
60
Frac
tion
ofco
nten
tvie
wed
(%) PC
MobileTV
(b) Average bitrate
Figure 11: Live users on different devices have different levels oftolerance for rate of buffering and average bitrate
0.0 0.2 0.4 0.6 0.8Rate of buffering (/minute)
5
10
15
20
25
30
Frac
tion
ofco
nten
tvie
wed
(%) DSL/Cable providers
Wireless providers
Figure 12: For live content, users on DSL/cable connection andusers on wireless connection showed difference in tolerance forrate of buffering
The compacted decision trees had the same structure for cablevs. wireless providers for both live and VOD data. But we observeddifference in tolerance to rate of buffering for both live and VODcontent. As we observed earlier in Section 2.3, users were moretolerant to buffering rate when they were on a wireless providerfor VOD content. For live content, as shown in Figure 12, we ob-served difference in tolerance for rate of buffering. Due to thesedifferences, we consider connectivity as a confounding factor.
Time of day: Based on the time of the day, the sessions were clas-sified as during night time (midnight-9am), day time (9am-6pm)or peak hours(6pm-midnight). We observed that 15% of the traf-fic were during night time, 30% during day time and 55% duringpeak hours. We also observed that users experienced slightly morebuffering during peak hours when compared to late nights and daytime. The compacted decision trees were similar for peak hours vs.day vs. night. Users were, however, slightly more tolerant to rateof buffering during peak hours as shown in Figure 13. Since wewant to take a conservative stance while shortlisting confoundingfactors, we consider time of day to be a confounding factor.
Other factors: We did not observe high information gain or sig-nificant differences in the compacted decision tree or the toleranceto quality for other factors such as region, popularity, day of week,
0.0 0.2 0.4 0.6 0.8Rate of buffering (/minute)
20
30
40
50
60
70
80
90
Frac
tion
ofco
nten
tvie
wed
(%) Night time
Day timePeak hour
Figure 13: For VOD, users tolerance for rate of buffering is slightlyhigher during peak hours
Confounding Factor Engmnt Quality Q→EQual
Q→EQuant
Type of video - live or VOD X X X XOverall popularity (live) 7 7 7 7Overall popularity (VOD) 7 7 7 7Time since release (VOD) 7 7 7 7Time of day (VOD) 7 7 7 XDay of week (VOD) 7 7 7 7Device (live) 7 7 7 XDevice (VOD) 7 X X 7 XRegion (live) 7 7 7 7Region (VOD) 7 7 7 7Connectivity (live) 7 7 7 XConnectivity (VOD) 7 7 7 X
Table 3: Summary of the confounding factors. Check markindicates if a factor impacts quality or engagement or thequality→engagement relationship. The highlighted rows show thekey confounding factors that we identify and use for refining ourpredictive model
and time since video release (not shown). Thus, we do not considerthese as confounding factors.
4.3 Summary of main observationsTable 3 summarizes our findings from the analysis of various
potential confounding factors. Our main findings are:
• The main confounding factors are type of video, device, andconnectivity.• The four techniques that we proposed for detecting confound-
ing factors are complementary and expose different facets of theconfounding factors.• Our model also reconfirmed prior observations on player-specific
optimizations for background video sessions. It was also ableto reveal interesting anomalies due to specific player bugs.
5. ADDRESSING CONFOUNDING FACTORSNext, we describe how we refine the basic decision tree model
we saw in Section 3.2 to take into account the key confoundingfactors from the previous section. We begin by describing two can-didate approaches for model refinement and the tradeoffs involved.We study the impact of both candidate approaches and choose aheuristic “splitting” based approach.
5.1 Candidate approachesThere are two candidate approaches to incorporate the confound-
ing factors into the predictive model:• Add as new feature: The simplest approach is to add the key
confounding factors as additional features in the input to themachine learning algorithm and relearn the prediction model.
Type
VOD-Device
VOD-Device-2
Live-Device
VOD-Conn
Live-Conn
VOD-Time of day
Confounding factor
0
2
4
6
8
10
12
Impr
ovem
enti
nac
cura
cy(%
) SplitFeature
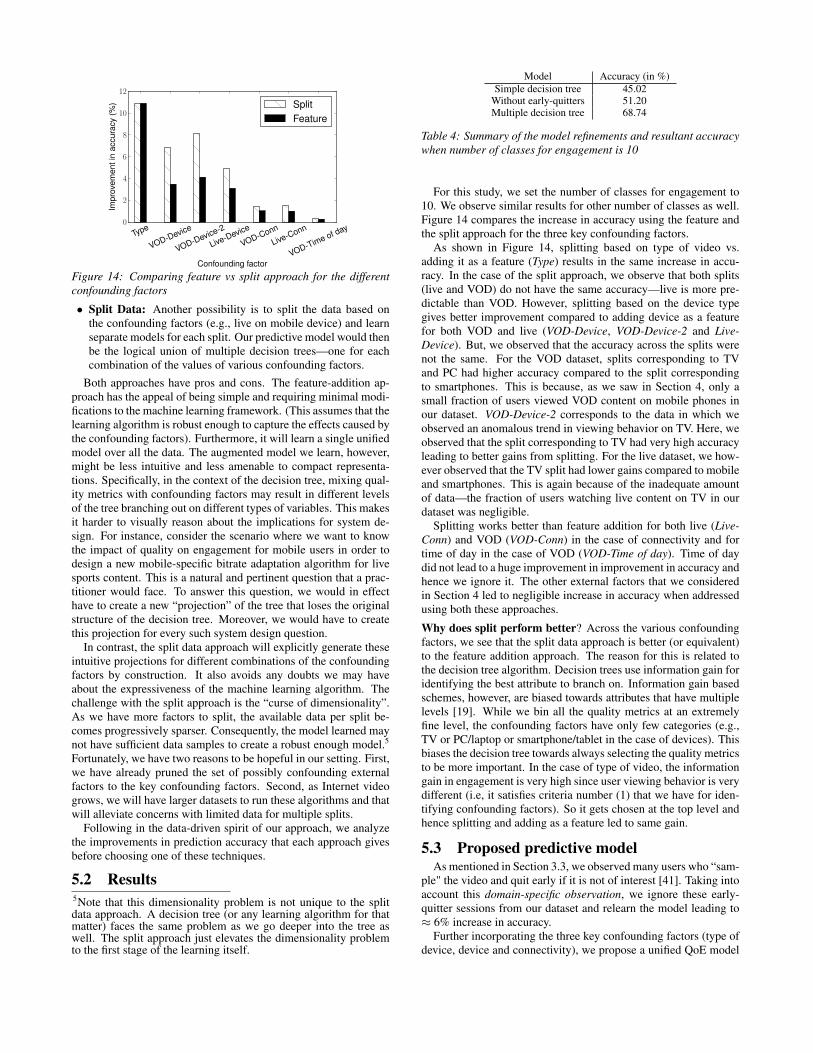
Figure 14: Comparing feature vs split approach for the differentconfounding factors
• Split Data: Another possibility is to split the data based onthe confounding factors (e.g., live on mobile device) and learnseparate models for each split. Our predictive model would thenbe the logical union of multiple decision trees—one for eachcombination of the values of various confounding factors.
Both approaches have pros and cons. The feature-addition ap-proach has the appeal of being simple and requiring minimal modi-fications to the machine learning framework. (This assumes that thelearning algorithm is robust enough to capture the effects caused bythe confounding factors). Furthermore, it will learn a single unifiedmodel over all the data. The augmented model we learn, however,might be less intuitive and less amenable to compact representa-tions. Specifically, in the context of the decision tree, mixing qual-ity metrics with confounding factors may result in different levelsof the tree branching out on different types of variables. This makesit harder to visually reason about the implications for system de-sign. For instance, consider the scenario where we want to knowthe impact of quality on engagement for mobile users in order todesign a new mobile-specific bitrate adaptation algorithm for livesports content. This is a natural and pertinent question that a prac-titioner would face. To answer this question, we would in effecthave to create a new “projection” of the tree that loses the originalstructure of the decision tree. Moreover, we would have to createthis projection for every such system design question.
In contrast, the split data approach will explicitly generate theseintuitive projections for different combinations of the confoundingfactors by construction. It also avoids any doubts we may haveabout the expressiveness of the machine learning algorithm. Thechallenge with the split approach is the “curse of dimensionality”.As we have more factors to split, the available data per split be-comes progressively sparser. Consequently, the model learned maynot have sufficient data samples to create a robust enough model.5
Fortunately, we have two reasons to be hopeful in our setting. First,we have already pruned the set of possibly confounding externalfactors to the key confounding factors. Second, as Internet videogrows, we will have larger datasets to run these algorithms and thatwill alleviate concerns with limited data for multiple splits.
Following in the data-driven spirit of our approach, we analyzethe improvements in prediction accuracy that each approach givesbefore choosing one of these techniques.
5.2 Results5Note that this dimensionality problem is not unique to the splitdata approach. A decision tree (or any learning algorithm for thatmatter) faces the same problem as we go deeper into the tree aswell. The split approach just elevates the dimensionality problemto the first stage of the learning itself.
Model Accuracy (in %)Simple decision tree 45.02
Without early-quitters 51.20Multiple decision tree 68.74
Table 4: Summary of the model refinements and resultant accuracywhen number of classes for engagement is 10
For this study, we set the number of classes for engagement to10. We observe similar results for other number of classes as well.Figure 14 compares the increase in accuracy using the feature andthe split approach for the three key confounding factors.
As shown in Figure 14, splitting based on type of video vs.adding it as a feature (Type) results in the same increase in accu-racy. In the case of the split approach, we observe that both splits(live and VOD) do not have the same accuracy—live is more pre-dictable than VOD. However, splitting based on the device typegives better improvement compared to adding device as a featurefor both VOD and live (VOD-Device, VOD-Device-2 and Live-Device). But, we observed that the accuracy across the splits werenot the same. For the VOD dataset, splits corresponding to TVand PC had higher accuracy compared to the split correspondingto smartphones. This is because, as we saw in Section 4, only asmall fraction of users viewed VOD content on mobile phones inour dataset. VOD-Device-2 corresponds to the data in which weobserved an anomalous trend in viewing behavior on TV. Here, weobserved that the split corresponding to TV had very high accuracyleading to better gains from splitting. For the live dataset, we how-ever observed that the TV split had lower gains compared to mobileand smartphones. This is again because of the inadequate amountof data—the fraction of users watching live content on TV in ourdataset was negligible.
Splitting works better than feature addition for both live (Live-Conn) and VOD (VOD-Conn) in the case of connectivity and fortime of day in the case of VOD (VOD-Time of day). Time of daydid not lead to a huge improvement in improvement in accuracy andhence we ignore it. The other external factors that we consideredin Section 4 led to negligible increase in accuracy when addressedusing both these approaches.
Why does split perform better? Across the various confoundingfactors, we see that the split data approach is better (or equivalent)to the feature addition approach. The reason for this is related tothe decision tree algorithm. Decision trees use information gain foridentifying the best attribute to branch on. Information gain basedschemes, however, are biased towards attributes that have multiplelevels [19]. While we bin all the quality metrics at an extremelyfine level, the confounding factors have only few categories (e.g.,TV or PC/laptop or smartphone/tablet in the case of devices). Thisbiases the decision tree towards always selecting the quality metricsto be more important. In the case of type of video, the informationgain in engagement is very high since user viewing behavior is verydifferent (i.e, it satisfies criteria number (1) that we have for iden-tifying confounding factors). So it gets chosen at the top level andhence splitting and adding as a feature led to same gain.
5.3 Proposed predictive modelAs mentioned in Section 3.3, we observed many users who “sam-
ple" the video and quit early if it is not of interest [41]. Taking intoaccount this domain-specific observation, we ignore these early-quitter sessions from our dataset and relearn the model leading to≈ 6% increase in accuracy.
Further incorporating the three key confounding factors (type ofdevice, device and connectivity), we propose a unified QoE model

based on splitting the dataset for various confounding factors andlearning multiple decision trees—one for each split. Accountingfor all the confounding factors further leads to around 18% im-provement. Table 4 summarizes the overall accuracies when num-ber of classes for engagement is set to 10. This implies that about70% of the predictions are within the same 10% bucket as the actualuser viewing duration.
6. IMPLICATIONS FOR SYSTEM DESIGNIn this section, we demonstrate the practical utility of the QoE
model using trace-driven simulations. We simulate a video controlplane setting similar to previous work and use our QoE model toguide the choice of CDN and bitrate [28]. We compare the potentialimprovement in engagement using our QoE model against otherstrawman solutions.
6.1 Overview of a video control planeThe QoE model that we developed can be used by various prin-
cipals in the Internet video ecosystem to guide system design de-cisions. For instance, video player designers can use the model toguide the design of efficient bitrate adaptation algorithms. Simi-larly, CDNs can optimize overall engagement by assigning bitratesfor each individual client using our QoE model.
Prior work makes the case for a coordinated control plane forInternet video based on their observation that a purely client- orserver- driven bitrate and CDN adaptation scheme for video ses-sions might be suboptimal [28]. This (hypothetical) control planedesign uses a global view of the network and CDN performanceto choose the CDN and bitrates for each session based on a globaloptimization framework. The goal of the optimization is to pickthe right control parameters (in this case, CDN and bitrate) in orderto maximize the overall engagement. As shown in Figure 15, thiscontrol plane takes as input control parameters (CDN, bitrate) andother attributes (device, region, ISP etc.) as input and predicts theexpected engagement.
Our QoE model can be used to guide the design of such a videocontrol plane. Note, however, that the QoE model from Section 5takes various quality metrics and attributes that are confounding asinput and predicts the expected engagement. Thus, as discussedin Section 2, we also need to develop a quality model which takesCDN, bitrate, and client attributes as input and predicts the qualitymetrics (buffering ratio, rate of buffering and join time) in order tofully realize this control plane design. Figure 15 shows the vari-ous components and their inputs and outputs. Our key contribu-tion here is in demonstrating the use of the QoE model within thiscontrol plane framework and showing that a QoE-aware deliveryinfrastructure could further improve the overall engagement.
6.2 Quality modelWe use a simplified version of the quality prediction model pro-
posed from prior work [28]. It computes the mean performance(buffering ratio, rate of buffering and join time) for each combina-tion of attributes (e.g., type of video, ISP, region, device) and con-trol parameters (e.g., bitrate and CDN) using empirical estimation.For example, we estimate the performance of all Comcast clients inthe east coast of the United States that streamed live content overan Xbox from Akamai at 2500 Kbps by computing the empiricalmean for each of the quality metrics.
When queried with specific attributes (CDN and bitrate) the mod-els returns the estimated performance. One challenge, however, isthat adding more attributes to model often leads to data sparsity. Inthis case, we use a hierarchical estimation heuristic—i.e, if we donot have sufficient data to compute the mean performance value for
Quality model
QoE model
Control plane model
Quality metrics
CDN
A7ributes
Bitrate
Engagement
Figure 15: We use a simple quality model along with our QoEmodel to simulate a control plane. The inputs and outputs to thevarious components are shown above.
a specific attribute, CDN and bitrate combination, we use a coarser-grained granularity of attribute elements [28]. For example, if wedo not have enough data regarding the performance of Xbox overAkamai over Comcast connection from the east coast at 2500 Kbps,we return the mean performance that we observed over all the de-vices over Akamai at 2500 Kbps over Comcast connection from theeast coast. We follow the following hierarchy for this estimation:{Type of video, ISP, region, device} < {Type of video, ISP, region}< {Type of video, ISP}.
6.3 StrategiesWe compare the following strategies to pick the control parame-
ters (CDN and bitrate):
1. Smart QoE approach: For our smart QoE approach, we use apredicted quality model and a predicted QoE model based on his-torical data. For choosing the best control parameters for a partic-ular session, we employ the following brute force approach. Weestimate the expected engagement for all possible combinations ofCDNs and bitrates by querying the predicted quality model andthe predicted QoE model with the appropriate attributes (ISP, de-vice etc.). This approach assigns the CDN, bitrate combination thatgives the best predicted engagement.
2. Smart CDN approaches: We find the best CDN for a givencombination of attributes (region, ISP and device) using the pre-dicted quality model by comparing the mean performance of eachCDN in terms of buffering ratio across all bitrates and assign clientsto this CDN. We implement three variants for picking the bitrate:2(a) Smart CDN, highest bitrate: The client always chooses tostream at the highest bitrate that is available.2(b) Smart CDN, lowest buffering ratio: The client is assigned thebitrate that is expected to cause the lowest buffering ratio based onthe predicted quality model2(c) Smart CDN, control plane utility function: The client is as-signed the bitrate that would maximize the utility function (−3.7×BuffRatio+ Bitrate
20) [28].
3. Baseline: We implemented a naive approach where the clientpicks a CDN and bitrate randomly.
6.4 EvaluationTo quantitatively evaluate the benefit of using the QoE model, we
perform a trace based simulation. We use week-long trace to sim-ulate client attributes and arrival times. In each epoch (one hourtime slots), a number of clients with varying attributes (type ofvideo, ISP, device) arrive. For each client session, we assign theCDN and bitrate based on the various strategies mentioned earlier.For simplicity, we assume the CDNs are sufficiently provisionedand do not degrade their performance throughout our simulation.To evaluate the performance of these strategies, we develop actualengagement models and an actual quality models based on the em-pirical data from the current measurement epoch and compare theengagement predicted by these models for each session. (Note that
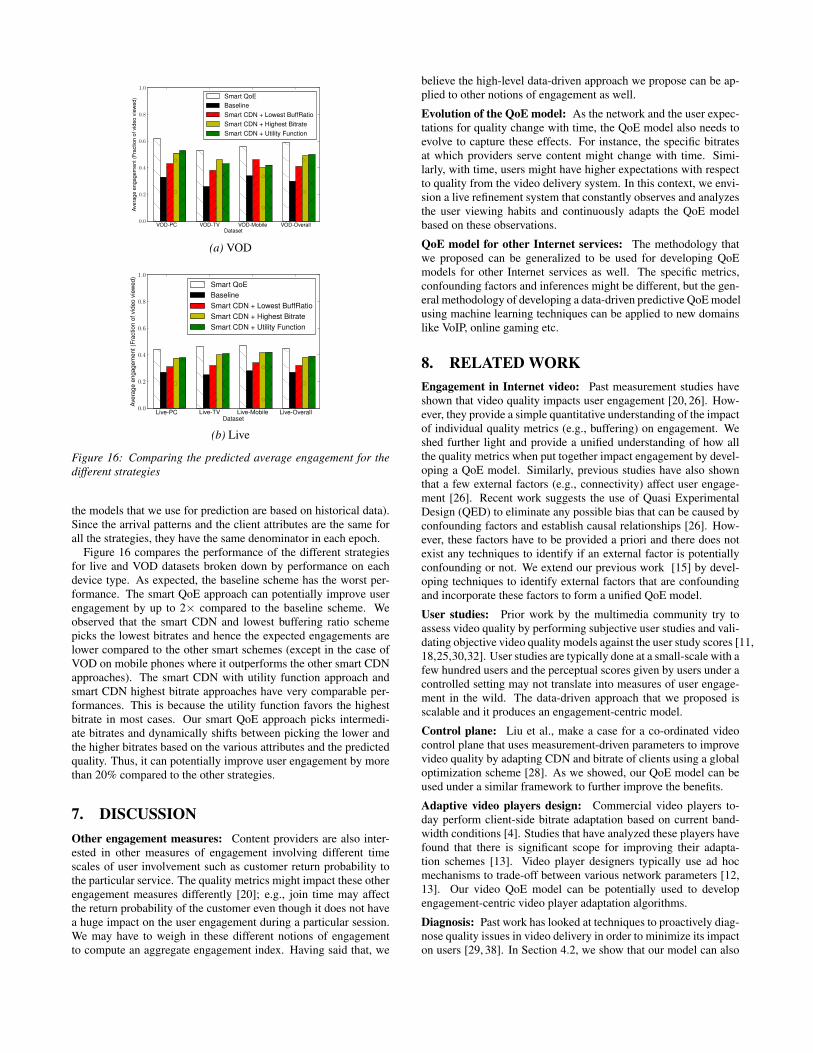
VOD-PC VOD-TV VOD-Mobile VOD-OverallDataset
0.0
0.2
0.4
0.6
0.8
1.0
Ave
rage
enga
gem
ent(
Frac
tion
ofvi
deo
view
ed) Smart QoE
BaselineSmart CDN + Lowest BuffRatioSmart CDN + Highest BitrateSmart CDN + Utility Function
(a) VOD
Live-PC Live-TV Live-Mobile Live-OverallDataset
0.0
0.2
0.4
0.6
0.8
1.0
Ave
rage
enga
gem
ent(
Frac
tion
ofvi
deo
view
ed)
Smart QoEBaselineSmart CDN + Lowest BuffRatioSmart CDN + Highest BitrateSmart CDN + Utility Function
(b) Live
Figure 16: Comparing the predicted average engagement for thedifferent strategies
the models that we use for prediction are based on historical data).Since the arrival patterns and the client attributes are the same forall the strategies, they have the same denominator in each epoch.
Figure 16 compares the performance of the different strategiesfor live and VOD datasets broken down by performance on eachdevice type. As expected, the baseline scheme has the worst per-formance. The smart QoE approach can potentially improve userengagement by up to 2× compared to the baseline scheme. Weobserved that the smart CDN and lowest buffering ratio schemepicks the lowest bitrates and hence the expected engagements arelower compared to the other smart schemes (except in the case ofVOD on mobile phones where it outperforms the other smart CDNapproaches). The smart CDN with utility function approach andsmart CDN highest bitrate approaches have very comparable per-formances. This is because the utility function favors the highestbitrate in most cases. Our smart QoE approach picks intermedi-ate bitrates and dynamically shifts between picking the lower andthe higher bitrates based on the various attributes and the predictedquality. Thus, it can potentially improve user engagement by morethan 20% compared to the other strategies.
7. DISCUSSIONOther engagement measures: Content providers are also inter-ested in other measures of engagement involving different timescales of user involvement such as customer return probability tothe particular service. The quality metrics might impact these otherengagement measures differently [20]; e.g., join time may affectthe return probability of the customer even though it does not havea huge impact on the user engagement during a particular session.We may have to weigh in these different notions of engagementto compute an aggregate engagement index. Having said that, we
believe the high-level data-driven approach we propose can be ap-plied to other notions of engagement as well.
Evolution of the QoE model: As the network and the user expec-tations for quality change with time, the QoE model also needs toevolve to capture these effects. For instance, the specific bitratesat which providers serve content might change with time. Simi-larly, with time, users might have higher expectations with respectto quality from the video delivery system. In this context, we envi-sion a live refinement system that constantly observes and analyzesthe user viewing habits and continuously adapts the QoE modelbased on these observations.
QoE model for other Internet services: The methodology thatwe proposed can be generalized to be used for developing QoEmodels for other Internet services as well. The specific metrics,confounding factors and inferences might be different, but the gen-eral methodology of developing a data-driven predictive QoE modelusing machine learning techniques can be applied to new domainslike VoIP, online gaming etc.
8. RELATED WORKEngagement in Internet video: Past measurement studies haveshown that video quality impacts user engagement [20, 26]. How-ever, they provide a simple quantitative understanding of the impactof individual quality metrics (e.g., buffering) on engagement. Weshed further light and provide a unified understanding of how allthe quality metrics when put together impact engagement by devel-oping a QoE model. Similarly, previous studies have also shownthat a few external factors (e.g., connectivity) affect user engage-ment [26]. Recent work suggests the use of Quasi ExperimentalDesign (QED) to eliminate any possible bias that can be caused byconfounding factors and establish causal relationships [26]. How-ever, these factors have to be provided a priori and there does notexist any techniques to identify if an external factor is potentiallyconfounding or not. We extend our previous work [15] by devel-oping techniques to identify external factors that are confoundingand incorporate these factors to form a unified QoE model.
User studies: Prior work by the multimedia community try toassess video quality by performing subjective user studies and vali-dating objective video quality models against the user study scores [11,18,25,30,32]. User studies are typically done at a small-scale with afew hundred users and the perceptual scores given by users under acontrolled setting may not translate into measures of user engage-ment in the wild. The data-driven approach that we proposed isscalable and it produces an engagement-centric model.
Control plane: Liu et al., make a case for a co-ordinated videocontrol plane that uses measurement-driven parameters to improvevideo quality by adapting CDN and bitrate of clients using a globaloptimization scheme [28]. As we showed, our QoE model can beused under a similar framework to further improve the benefits.
Adaptive video players design: Commercial video players to-day perform client-side bitrate adaptation based on current band-width conditions [4]. Studies that have analyzed these players havefound that there is significant scope for improving their adapta-tion schemes [13]. Video player designers typically use ad hocmechanisms to trade-off between various network parameters [12,13]. Our video QoE model can be potentially used to developengagement-centric video player adaptation algorithms.
Diagnosis: Past work has looked at techniques to proactively diag-nose quality issues in video delivery in order to minimize its impacton users [29, 38]. In Section 4.2, we show that our model can also
detect anomalous behavior among users watching VOD content onTV, and potentially other quality issues as well.
QoE metrics in other media: There have been attempts to studythe impact of network factors on user engagement and user satis-faction in the context of other media technologies. For example,in [16], the authors study the impact of bitrate, jitter and delay oncall duration in Skype and propose a unified user satisfaction metricas a combination of these factors. Our approach derives a unifiedQoE model in the context of Internet video and it is very timelygiven that Internet video has gone mainstream in the past few years.
Other video measurement studies: Several measurement studiesof Internet video have focused on content popularity, user behav-ior and viewing patterns [22, 41]. The observations made in theseworks have implications on understanding measurement-driven in-sights and performing domain-specific refinements to improve theQoE model. For instance, Yu et al., also observed that users samplevideos and quit the session early [41]. Similarly, we observed thatsome users tolerate low bitrate while watching live content. Pre-vious work also observed this phenomena which is a result of theplayer running in the background [20].
9. CONCLUSIONSAn imminent challenge that the Internet video ecosystem—content
providers, content delivery networks, analytics services, video playerdesigners, and users—face is the lack of a reference methodologyto measure the Quality-of-Experience (QoE) that different solutionsprovide. With the “coming of age” of this technology and the es-tablishment of industry standard groups (e.g., [34]), such a measurewill become a fundamental requirement to promote further inno-vation by allowing us to objectively compare different competingdesigns [8, 14].
Internet video presents both a challenge and an opportunity forQoE measurement. On one hand, the nature of the delivery in-frastructure introduces new complex relationships between qual-ity and engagement and between quality metrics themselves. Tofurther make matters worse, there are many confounding factorsintroduced by different aspects of this ecosystem that directly orindirectly impact engagement (e.g., genre, popularity, device). Atthe same time, however, we have an unprecedented opportunity toobtain a systematic understanding of QoE because of the abilityto collect large client- and server-side measurements of actual userbehavior in the wild.
This paper is a significant first step in seizing this opportunityand addressing the above challenges. We developed a data-drivenmachine learning approach to capture the complex interactions aswell as confounding effects. We also demonstrated significant prac-tical benefits that content providers can obtain by using an im-proved QoE prediction model over current ad hoc approaches.
AcknowledgementsWe thank our shepherd Jon Crowcroft and the anonymous review-ers for their feedback that helped improve the paper. We also thankthe Conviva staff for answering several questions about the datasetand the data collection infrastructure. This work is partially sup-ported by the National Science Foundation under grants CNS-1050170,CNS-1017545, CNS-0905134 and CNS- 0746531
10. REFERENCES[1] Buyer’s Guide: Content Delivery Networks. http://goo.gl/B6gMK.[2] Cisco study. http://goo.gl/tMRwM.[3] Driving Engagement for Online Video. http://goo.gl/pO5Cj.[4] Microsoft Smooth Streaming. http://goo.gl/6JOXh.
[5] P.800 : Methods for subjective determination of transmission quality.http://www.itu.int/rec/T-REC-P.800-199608-I/en.
[6] P.910 : Subjective video quality assessment methods for multimediaapplications. http://goo.gl/QjFhZ.
[7] Peak signal to noise ratio. http://en.wikipedia.org/wiki/Peak_signal-to-noise_ratio.
[8] SPEC philosophy. http://www.spec.org/spec/#philosophy.[9] Turbobytes: How it works.
http://www.turbobytes.com/products/optimizer/.[10] Video quality metrics. http://goo.gl/Ga9Xz.[11] Vqeg. http://www.its.bldrdoc.gov/vqeg/vqeg-home.aspx.[12] S. Akhshabi, L. Anantakrishnan, C. Dovrolis, and A. C. Begen. What Happens
when HTTP Adaptive Streaming Players Compete for Bandwidth? In Proc.NOSSDAV, 2012.
[13] S. Akhshabi, A. Begen, and C. Dovrolis. An Experimental Evaluation of RateAdaptation Algorithms in Adaptive Streaming over HTTP. In MMSys, 2011.
[14] R. H. Allen and R. D. Sriram. The Role of Standards in Innovation. Elsevier:Technology Forecasting and Social Change, 2000.
[15] A. Balachandran, V. Sekar, A. Akella, S. Seshan, I. Stoica, and H. Zhang. Aquest for an internet video quality-of-experience metric. In Hotnets, 2012.
[16] K. Chen, C. Huang, P. Huang, and C. Lei. Quantifying skype user satisfaction.In SIGCOMM, 2006.
[17] S. Chikkerur, V. Sundaram, M. Reisslein, and L. J. Karam. Objective videoquality assessment methods: A classification, review, and performancecomparison. In IEEE Transactions on Broadcasting, 2011.
[18] N. Cranley, P. Perry, and L. Murphy. User perception of adapting video quality.International Journal of Human-Computer Studies, 2006.
[19] H. Deng, G. Runger, and E. Tuv. Bias of importance measures for multi-valuedattributes and solutions. In ICANN, 2011.
[20] F. Dobrian, V. Sekar, A. Awan, I. Stoica, D. A. Joseph, A. Ganjam, J. Zhan, andH. Zhang. Understanding the impact of video quality on user engagement. InProc. SIGCOMM, 2011.
[21] J. Esteban, S. Benno, A. Beck, Y. Guo, V. Hilt, and I. Rimac. InteractionsBetween HTTP Adaptive Streaming and TCP. In Proc. NOSSDAV, 2012.
[22] A. Finamore, M. Mellia, M. Munafo, R. Torres, and S. G. Rao. Youtubeeverywhere: Impact of device and infrastructure synergies on user experience.In Proc. IMC, 2011.
[23] A. Halevy, P. Norvig, and F. Pereira. The unreasonable effectiveness of data. InIEEE Intelligent Systems, 2009.
[24] L. Huang, J. Jia, B. Yu, B. G. Chun, P. Maniatis, and M. Naik. PredictingExecution Time of Computer Programs Using Sparse Polynomial Regression.In Proc. NIPS, 2010.
[25] A. Khan, L. Sun, and E. Ifeachor. Qoe prediction model and its applications invideo quality adaptation over umts networks. In IEEE Transactions onMultimedia, 2012.
[26] S. S. Krishnan and R. K. Sitaraman. Video stream quality impacts viewerbehavior: inferring causality using quasi-experimental designs. In IMC, 2012.
[27] B. Liu, M. Hu, and W. Hsu. Intuitive Representation of Decision Trees UsingGeneral Rules and Exceptions. In Proc. AAAI, 2000.
[28] X. Liu, F. Dobrian, H. Milner, J. Jiang, V. Sekar, I. Stoica, and H. Zhang. A casefor a coordinated internet video control plane. In SIGCOMM, 2012.
[29] A. Mahimkar, Z. Ge, A. Shaikh, J. Wang, J. Yates, Y. Zhang, and Q. Zhao.Towards Automated Performance Diagnosis in a Large IPTV Network. In Proc.SIGCOMM, 2009.
[30] V. Menkvoski, A. Oredope, A. Liotta, and A. C. Sanchez. Optimized onlinelearning for qoe prediction. In BNAIC, 2009.
[31] T. Mitchell. Machine Learning. McGraw-Hill.[32] R. K. P. Mok, E. W. W. Chan, X. Luo, and R. K. C. Chang. Inferring the QoE of
HTTP Video Streaming from User-Viewing Activities . In SIGCOMMW-MUST, 2011.
[33] L. Plissonneau and E. Biersack. A Longitudinal View of HTTP VideoStreaming Performance. In MMSys, 2012.
[34] I. Sodagar. The MPEG-DASH Standard for Multimedia Streaming Over theInternet. IEEE Multimedia, 2011.
[35] H. H. Song, Z. Ge, A. Mahimkar, J. Wang, J. Yates, Y. Zhang, A. Basso, andM. Chen. Q-score: Proactive Service Quality Assessment in a Large IPTVSystem. In Proc. IMC, 2011.
[36] M. Watson. Http adaptive streaming in practice. In MMSys - Keynote, 2011.[37] I. H. Witten and E. Frank. Data Mining: Practical Machine Learning Tools and
Techniques. Morgan Kaufmann, 2000.[38] C. Wu, B. Li, and S. Zhao. Diagnosing Network-wide P2P Live Streaming
Inefficiencies. In Proc. INFOCOM, 2009.[39] W. Xu, L. Huang, A. Fox, D. Patterson, and M. Jordan. Detecting large-scale
system problems by mining console logs. In Proc. SOSP, 2009.[40] H. Yin et al. Inside the Bird’s Nest: Measurements of Large-Scale Live VoD
from the 2008 Olympics.[41] H. Yu, D. Z. B. Y. Zhao, and W. Zheng. Understanding User Behavior in
Large-Scale Video-on-Demand Systems. In Proc. Eurosys, 2006.