
Developing a National Strategy in Addressing Inequities in NCDs Mapping …€¦ · ·...
89
Developing a National Strategy in Addressing Inequities in NonCommunicable Diseases: Mapping Phase This report presents the findings of the research conducted by the Philippine Institute for Development Studies (PIDS) on leading non-communicable diseases. With the collaborative efforts of World Health Organization (WHO) and Food and Nutrition Research Institute (FNRI), this research project was conducted to supplement the Department of Health’s initiative in crafting a national strategy in the prevention and control of non- communicable diseases. This study presents evidences on mortality, morbidity, some social determinants and inequities. Different secondary data sets like the National Nutrition Survey, National Demographic and Health Survey, Death Registry from National Statistics Office, Family Income and Expenditure Surveys were analysed to come up with a unified and comprehensive study the depicts the true picture of NCDs epidemic in the country. Keywords: Non-communicable diseases, Cardio-vascular Diseases, Cancer, Diabetes mellitus, risk factors, social determinants, inequity For comments and suggestions: Mr. Valerie Gilbert T. Ulep, MSc Supervising Research Specialist Philippine Institute for Development Studies [email protected]; [email protected]
Transcript of Developing a National Strategy in Addressing Inequities in NCDs Mapping …€¦ · ·...

Developing a National Strategy in Addressing Inequities in Non-‐Communicable Diseases: Mapping Phase
This report presents the findings of the research conducted by the Philippine Institute for Development Studies
(PIDS) on leading non-communicable diseases. With the collaborative efforts of World Health Organization
(WHO) and Food and Nutrition Research Institute (FNRI), this research project was conducted to supplement the
Department of Health’s initiative in crafting a national strategy in the prevention and control of non-
communicable diseases.
This study presents evidences on mortality, morbidity, some social determinants and inequities. Different
secondary data sets like the National Nutrition Survey, National Demographic and Health Survey, Death Registry
from National Statistics Office, Family Income and Expenditure Surveys were analysed to come up with a unified
and comprehensive study the depicts the true picture of NCDs epidemic in the country.
Keywords: Non-communicable diseases, Cardio-vascular Diseases, Cancer, Diabetes mellitus, risk
factors, social determinants, inequity
For comments and suggestions:
Mr. Valerie Gilbert T. Ulep, MSc Supervising Research Specialist Philippine Institute for Development Studies [email protected]; [email protected]

Executive Summary
The main findings are listed below:
• This study ascertains the growing dominance of NCDs as major cause of death in emerging
economies like the Philippines. Analysis of the latest mortality data from NSO shows that majority of
deaths can be attributed to NCDs.
• Result of one analysis shows a negative correlation between poverty incidence and crude death rate
of major NCDs (R=-0.44; p value: 0.000). In other words, as poverty incidence of a province
increases the crude death rate of major NCDs (CVDs, diabetes and malignancies) decreases.
Nevertheless, the result should not lead policy makers in a perception that NCDs are diseases of the
affluent. The result of ‘crude’ ecologic analysis may be undermined, and supports for more validated
empirical evidence through age-sex standardization of mortality data from National Statistics Office
and usage of micro-data to analyse the effect of wealth on mortality and morbidity attributed to
NCDs.
• However, NCDs are more likely to occur in the richer population as ascertained by the higher
prevalence of hypercholesterolemia, diabetes mellitus and obesity compared to their poorer
counterparts. Multivariate regression analyses of 2008 National Nutrition Survey also validated this
result. Interestingly, other risk factors of NCDs like smoking (including second hand smoking) and
high salt consumption are leaning towards the poorer population, while other indicators have no
difference across socio-economic groups (i.e. hypertension). The negative relationship of wealth and
several NCDs indicators is commonly found in most emerging countries like India and China. In
developed countries, NCDs are afflicting the poorer segments the population.
• As noted, NCDs indicators in the country show that NCDs are more likely to affect the richer
population. However, there is also growing concern that NCDs are now shifting to the poorer
segments, specifically the urban poor. Given the expanding domestic economy and related processes
(i.e. globalization and trade, urban migration and urban concentration of employment), the non-
resilience of the poor population to NCD is highly possible. Analysis of several NCD indicators
shows the higher vulnerabilities of urban poor population compared to their counterparts in rural
areas (i.e. high consumption and expenditure of unhealthy diet).

• It is well known that NCDs like cardio-vascular diseases and diabetes are more likely to occur in
older age group. However, there is also a concern on the ‘risky’ practices of young adolescents (i.e.
higher consumption of unhealthy food and smoking).
• In terms of NCD-related consultation, health service delivery is highly segmented in nature. Poor
population would visit public and non-hospital facilities while their richer counterparts would tend to
visit private hospitals. In general, majority of the population visit private health facilities for their
NCD-related consultation.
• In terms of policy, the Department of Health issued the Administrative Order: 2011-003. (National
Policy on the Prevention of Non-communicable Lifestyle-related Diseases). This laudable policy
piece outlines the general position of the agency in terms of NCD mitigation. However, this policy
should harness a more specific, synchronized and sustainable strategy targeting primarily the poor
segments of population.
• There is a wide experience in scanning other specific laws on trade, physical activity, tobacco, alcohol
and unhealthy food regulation. With regard to tobacco control, the country has strong national
position in controlling for tobacco, though several features are still needed (i.e. amendment of sin tax
laws, graphic warnings). For regulation of unhealthy diet and alcohol, there are no comprehensive
laws on these domains. If present, they are scattered and highly dependent on local government
units. The effectiveness of these existing laws is another matter and will not be tackled in this report.
Recommendation
• As noted, NCDs are more likely to occur in richer population. However, this should not make policy
makers and managers to be complacent. Looking NCDs as diseases of the affluent restrict
programmatic and financial investments in mitigating and preventing NCDs. The expanding
domestic economy which might change the consumption and expenditure patterns increases the
vulnerability of population regardless of socio-economic class. The non-inclusive economic growth
may also exacerbate the problems of NCDs among the poor. In this regard, the Department of
Health should craft specific, multi-sectoral and sustainable strategy in mitigating the problems of
NCDs especially the poor population.

Acronym AO-Administrative Order ASEAN-Association of Southeast Asian Nations ATIGA-ASEAN Trade in Goods Agreement BAS-Bureau of Agricultural Statistics BMI-Body Mass Index BP-Blood Pressure BPO-Business Process Outsourcing CI-Confidence Interval COD-Cause of Death CSC-Civil Service Commission CVD-Cardio-vascular Diseases DHS-Demographic and Health Survey DM-Diabetes mellitus DOH-Department of Health DOH-Department of Health DOLE- Department of Labour and Employment DTI-Department of Trade and Industry DUIC-Drivers Under the Influence of Alcohol Act FDA-Food and Drug Administration FDI-Foreign Direct Investments FIES-Family Income and Expenditure Survey FNRI-Food and Nutrition Research Institute GATS-Global Adult Tobacco Survey GDP-Gross Domestic Product GNI-Gross National Income ILO-International Labour Organization LGU-Local Government Units MDRP-Maximum Drug Retail Price MMDA-Metro Manila Development Authority NCDs-Non-communicable Diseases NEDA-National Economic Development Authority NCR-National Capital Region NNS-National Nutrition Survey NSCB-National Statistical Coordination Board NSO-National Statistics Office PANA-Philippine Association of National Advertisers PCA-Principal Component Analysis PCSO-Philippine Charity Sweepstakes Office PIDS-Philippine Institute for Development Studies RA-Republic Act RHUs-Rural Health Units SES-Socio-economic Status TTC-Transnational Tobacco Companies UN-United Nations WB-World Bank WHO-World Health Organization WTO-World Trade Organization

Contents
Background .......................................................................................................................................................................... 1
Objectives of study ............................................................................................................................................................. 2
Methodology ........................................................................................................................................................................ 2
Conceptual approach in understanding social determinants of NCDs ...................................................................... 2
NCD epidemic in emerging economies .......................................................................................................................... 5
Status of NCD mortality and morbidity in the Philippines .......................................................................................... 7
a. Cardio-vascular diseases ..................................................................................................................................... 10
b. Cancer ................................................................................................................................................................... 12
c. Diabetes mellitus ................................................................................................................................................. 15
d. Chronic Lower Respiratory Disease ................................................................................................................. 17
Determinants of NCDs ................................................................................................................................................... 19
The role of macroeconomic and macro-social factors on NCDs ........................................................................ 19
A. Economic growth ........................................................................................................................................... 19
B. Economic flows (food trade) ........................................................................................................................ 24
C. Advancement in technology ......................................................................................................................... 27
Vulnerabilities ............................................................................................................................................................... 29
A. Body Mass Index (BMI) ................................................................................................................................ 29
B. Total blood cholesterol .................................................................................................................................. 33
C. Hypertension ................................................................................................................................................... 36
Exposures ...................................................................................................................................................................... 39
A. Unhealthy diet ................................................................................................................................................. 39
B. Smoking ........................................................................................................................................................... 52
C. Alcohol consumption .................................................................................................................................... 55
D. Physical inactivity ............................................................................................................................................ 56
E. Barriers in health service delivery and health financing ............................................................................ 57
Policy scanning .................................................................................................................................................................. 63
Trade policies ................................................................................................................................................................ 63
Tobacco control policies ............................................................................................................................................. 66
Alcohol regulation policies ......................................................................................................................................... 70
Food regulations ........................................................................................................................................................... 71
Physical activity ............................................................................................................................................................. 72
Access to medicine ....................................................................................................................................................... 73

Recommendations ............................................................................................................................................................ 74
Bibliography ....................................................................................................................................................................... 77

List of Tables Table 1. Top ten causes of mortality, Philippines, 2009. ................................................................................ 7 Table 1. Distribution of deaths, by cause and gender, 2008. ........................................................................... 8 Table 2. Distribution of CVD deaths by type and sex, Philippines, 2008. ..................................................... 11 Table 3. Age-sex incidence and mortality of different cancers (number of new cases per 100,000), Philippines, 2008 ........................................................................................................................................................... 14 Table 4. Prevalence of Diabetes mellitus among adults 20 years old and above, by age group and sex, Philippines, 2008. ........................................................................................................................................ 16 Table 5. Prevalence of Diabetes mellitus among adults 20 years old and above, by socio-economic status, urbanization and educational attainment, Philippines, 2008. ........................................................................ 17 Table 6. Prevalence of Diabetes mellitus among adults 20 years old over, by urban and rural poor, Philippines, 2008. ........................................................................................................................................................... 17 Table 7. Deaths due to Chronic Lower Respiratory Diseases (CLRD), Philippines, 2008 ............................. 18 Table 8. Percent of the population living in urban areas, 1970-2010 ........................................................... 21 Table 9. Percent and frequency of urban poor population, Philippines, 2000 and 2006 ............................... 22 Table 10. Top ten food and alcohol corporations, Philippines, 2008 ........................................................... 25 Table 11. Foreign Direct Investments in manufacturing industry, Philippines. 1980-2007. ........................... 26 Table 12. Quantity of food import and export, Philippines, 1994-2010. ....................................................... 27 Table 13. Prevalence of obesity among adults 20 years old and above, by age group and sex, Philippines, 2008. ........................................................................................................................................................... 30 Table 14. Prevalence of obesity among adults 20 years old and above, by urbanization and educational attainment, Philippines, 2008. ..................................................................................................................... 30 Table 15. Prevalence of obesity among adults 20 years old and above, by urban and rural poor, Philippines, 2008. ........................................................................................................................................................... 31 Table 16. Regression results of BMI and different predictors. ...................................................................... 32 Table 17. Prevalence of high Total Cholesterol (> 240 mg/dl) among adults 20 years old and above, Philippines, 2008. ........................................................................................................................................ 33 Table 18. Prevalence of high cholesterol among adults 20 years old and above, by socio-economic status, urbanization and educational attainment, Philippines, 2008. ........................................................................ 34 Table 19. Prevalence of high cholesterol among adults 20 years old and above, by urban and rural poor, Philippines, 2008. ........................................................................................................................................ 34 Table 20. Regression results of total cholesterol and different predictors. .................................................... 35 Table 21. Prevalence of hypertension by single visit BP among adults 20 years and above, by age Philippines, 2008. ........................................................................................................................................................... 36 Table 22. Prevalence of hypertension by single visit BP among adults 20 years and above by socio-economic status, urbanization and educational attainment, Philippines, 2008. .............................................................. 37 Table 23. Prevalence of hypertension by single visit BP among adults 20 years and above by urban and rural poor, Philippines, 2008. .............................................................................................................................. 37 Table 24. Regression results of hypertension and different predictors. ......................................................... 38 Table 25. Average daily food consumption per capita per day, by socio-economic status, Philippines, 2008. 39 1. Saturated oil ........................................................................................................................................ 40 Table 26. Mean intake of oil in grams per day among adults 20 years and above, Philippines, 2008. ........... 40

Table 27. Mean intake of oil among adults 20 years and above, by socio-economic status, urbanization and educational attainment, Philippines, 2008. ................................................................................................... 41 Table 28. Mean intake of oil among adults 20 years and above, by socio-economic status, urbanization and educational attainment, Philippines, 2008. ................................................................................................... 41 Table 29. Mean intake of soft drinks in grams per day among adults 20 years and above, Philippines, 2008. 50 Table 30. Mean intake of soft drinks in grams per day among adults, 20 years and above by socio-economic status, urbanization and educational attainment, Philippines, 2008. .............................................................. 51 Table 31. Mean salt intake in grams per day among adults 20 years and above, by age, Philippines, 2008. .... 52 Table 32. Mean salt intake in grams per day among adults, 20 years and above by socio-economic status, urbanization and educational attainment, Philippines, 2008. ........................................................................ 52 Table 33. Prevalence of current smokers among adults 20 years and above, by age, Philippines, 2008. ......... 53 Table 34. Prevalence of current smokers among adults 20 years and above, by socio-economic status, urbanization and educational attainment, Philippines, 2008. ........................................................................ 54 Table 35. Prevalence of adults 15 years and older who are exposed to tobacco smoke at home, by sex, age, socio-economic status, Philippines, 2009. .................................................................................................... 55 Table 36. Prevalence of current alcohol drinkers among adults 20 years and above, Philippines, 2008. ......... 55 Table 37. Prevalence of current alcohol drinking among adults 20 years and above, by socio-economic status, urbanization and educational attainment, Philippines, 2008. ........................................................................ 56 Table 38. Prevalence of work or occupation related physical activity among adults 20 years and above, Philippines, 2008. ........................................................................................................................................ 56 Table 39. Prevalence of work or occupation related physical activity among adults 20 years and above, by socio-economic status, urbanization and educational attainment, Philippines, 2008. .................................... 57 Table 40. Travel time going to health facility during NCD consultation. ...................................................... 60 Table 41. Claims benefit from social insurance, sponsored and non-sponsored, Philippines, 2009. .............. 62 Table 42. Claims benefit from social insurance, sponsored and non-sponsored, Philippines, 2010. .............. 62 Table 43. Summary of trade-related laws. ................................................................................................... 65 Table 44. Summary of vital components of RA 9211. .................................................................................. 67 Table 45. Tobacco excise tax. ...................................................................................................................... 68 Table 46. Summary of policies related to tobacco control. ........................................................................... 69 Table 47. Vulnerable population segments .................................................................................................. 75

Table of Figures
Figure 1. Priority public health conditions analytical framework. ............................................................................... 3 Figure 2. Priority public health conditions knowledge network framework ............................................................. 4 Figure 3. Number of deaths, by cause and country income classification, 2008. .................................................... 5 Figure 4. Estimated annual growth rates of infectious and NCD mortality, by world region, .............................. 6 Figure 5. Conceptual concentration of burden of NCDs. .......................................................................................... 7 Figure 6. Share of premature deaths due to NCDs, Philippines, 2008. .................................................................... 9 Figure 7. Crude death rates of common NCDs, by province, Philippines, 2005. .................................................. 10 Figure 8. Distribution of population diagnosed with myocardial infarction, by age, 2008. .................................. 12 Figure 9. Distribution of population with diagnosed coronary heart disease, age, 2008. ..................................... 12 Figure 10. Distribution of deaths due to malignancies, Philippines, 2008. .............................................................. 13 Figure 11. Distribution of deaths due to malignancies, males, Philippines, 2008. ................................................. 13 Figure 12. Distribution of deaths due to malignancies, females, Philippines, 2008. .............................................. 14 Figure 13. Distribution of deaths due to Diabetes mellitus, Philippines, 2008. ...................................................... 15 Figure 14. Crude death rate due to NCDs vs. GNI per capita, Philippines, 1980-2005. ...................................... 20 Figure 15: Poverty incidence and crude death rate of common NCDs, Philippines, 2005. ................................. 21 Figure 16: Supply kilogram per capita per year of meat and vegetable products, 1960-2007, Philippines ......... 23 Figure 17: Supply kilogram per capita per year of animal fat and starchy root crops, 1960-2007, Philippines and selected emerging economies .................................................................................................................................. 24 Figure 18. Number of employed person by major occupation group, Philippines, 2002-2010. .......................... 27 Figure 19. Percentage of population that eats at take away restaurants at least once a week, by selected countries, 2004. ................................................................................................................................................................. 42 Figure 20 . Expenditure of food consumed at home vs. outside home, Philippines, 1994-2006. ........................ 1 Figure 21. Share of food eaten outside home expenditure on total food expenditure, Philippines, 2009. ........ 44 Figure 22. Share of food outside home expenditure on total food expenditure, by rural and urban poor, Philippines, 2009. .............................................................................................................................................................. 44 Figure 23. Share of food outside home expenditure on total food expenditure, by income decile, NCR, Philippines, 2009. .............................................................................................................................................................. 45 Figure 24. Advertising time per hour of children’s program by selected countries, 2004. .................................... 46 Figure 25. Share of selected food expenditure on total expenditure, Philippines, 1994-2006. ............................. 47 Figure 26. Mean intake in grams, by major food classification and age, Philippines, 2008. ................................. 48 Figure 27. Mean intake in grams, by major food classification and socio-economic status, Philippines, 2008. Figure 28. Mean intake in grams per day, by major food classification and rural and urban poor, Philippines, 2008. .................................................................................................................................................................................... 49 Figure 29. Distribution of facility visited during a NCD-related consult, Philippines, 2008. .............................. 58 Figure 30. Distribution of facility visited during a NCD-related consult among the poor (Q1 and Q2) Philippines, 2008. .............................................................................................................................................................. 59 Figure 31. Distribution of facility visited during a NCD-related consult among the non-poor (Q3-Q5), Philippines, 2008. .............................................................................................................................................................. 59 Figure 32. Sources of financing during NCD consultation, Philippines. 2008. ...................................................... 61

1
Background
Infectious and pregnancy-related morbidities are still major health problems in the country. However, there is
a noticeable epidemiologic shift from infectious to non-communicable diseases (NCDs) over the years.
NCDs are broad classification of medical conditions which are non-infectious in nature. In general, they have
relatively slow and long prognosis compared to infectious diseases. In 2007, seven of the ten leading causes of
death are non-communicable in etiology. Twenty percent (20%) of the total deaths are due to heart diseases
followed by cerebrovascular diseases (11%) and malignant neoplasms (10%). The continuous dominance of
NCDs as the leading cause of death is expected in the next few years (World Health Organization, 2011;
(National Statistics Office, 2007).
The growing problem of NCDs should push policy makers to craft effective strategy to mitigate the
enormous economic and social costs they bring. According to World Health Organization, cardio-vascular
diseases, stroke and diabetes are estimated to reduce the Gross Domestic Product (GDP) from 1-5 percent in
low and middle countries (World Health Organization, 2011; Abegunde & Stanciole, 2006). In response to
the growing threat, institutions like World Health Organization have already conceptualized general
frameworks on the prevention and control of NCDs.
Prevention and control of NCDs is complex. It entails rigorous identification of different risk factors that
exacerbates their occurrence. NCDs occur as a result of accumulated and synergistic effect of biological,
environmental and social risk factors. Analyses of different risk factors would lead to the identification of
different points of intervention in the disease process. Though several studies have been made in the past,
there are no comprehensive and updated analyses on social determinants of NCDs. These analyses are useful
in the development of multi-sectorial framework for monitoring, prevention and control of these diseases. In
this light, the aim of the study is to gather wide range of information on leading NCDs, from mortality,
morbidity and their social determinants. This study utilized different secondary data sets like National
Nutrition Survey, National Demographic and Health Survey, Family Income and Expenditure Surveys and
other relevant data. Scanning of existing laws and policies related to NCDs was also performed.

2
Objectives of study
This study is part of the bigger initiative of the Department of Health and World Health Organization in
developing a national strategy in combating non-communicable diseases, primarily their social determinants.
The objective of this study is to analyze mortality, morbidity and risk factors attributed to NCDs. This study
attempts to present the disparity of NCDs across socio-demographic variables (e.g. socio-economic status,
education, urbanity, gender and other relevant indicators that posit inequity). Macro-level perspectives (e.g.
economic growth, urbanization, trade practices) were also discussed as one way to generally explain the
growing burden of NCDs in the country. Lastly, a policy scanning was performed to determine the current
position and pace of the country in terms of NCD prevention and control.
Methodology
The researchers used quantitative and qualitative methods. For quantitative analysis, different secondary
micro-data sets like National Nutrition Survey (NNS), Demographic Health Survey (DHS) and Family
Income and Expenditure Survey (FIES) were used. Both bivariate and multivariate analyses were performed
to present the different risk factors of major non-communicable diseases.
For the qualitative component of the study, policies related to non-communicable diseases of different
agencies like Department of Health, Food and Drugs Administration (FDA), Philippine Health Insurance
Corporation (PhilHealth) and other legislated law (if possible) were scanned. Guidelines and policies of World
Health Organization (WHO) and World Trade Organization (WTO) were also covered.
Conceptual approach in understanding social determinants of NCDs
Unlike infectious diseases where necessary cause is easier to identify (e.g. TB bacilli is a necessary cause of
Tuberculosis), NCDs have multiple factors that epidemiologists can hardly identify and quantify. The
occurrence of NCDs is the cumulative and synergistic effects of biological and social factors. Biological
factors include genetic predispositions and viral organisms (e.g. HPV linkage with cervical cancer). On the
other hand, social determinants are social and economic conditions which predispose them to NCDs
(Beaglehole & Yach, 2003; Miranda, Kinra, Casas, Smith, & Ebrahim, 2008; Rothman & Greenland, 2005)

3
To better understand the complexities, the Priority Public Health Conditions Knowledge Network
Framework1 was adopted in this study to organize and categorize their social determinants. The framework
(figure 1) depicts a multi-level interaction of different factors starting from the societal to individual factor
levels. The value of organizing and analyzing social determinants in a systematic manner would lead to an
easier appreciation of the causal pathway and determination of different point interventions later on (World
Health Organization, 2010).
Figure 1. Priority public health conditions analytical framework.
• Societal and political structures, particularly, government, social and macroeconomic policies,
culture and societal values are important factors in determining the magnitude and distribution of
wealth and commodities. The high level of unequal distribution of resources may lead to high
disparity in risk factors exposure, and eventually on health outcomes. The issue of unequal
distribution of social provisions is not a sole concern of the health sector per se but an issue needed
to be addressed by all sectors in the government. In this regard, the context of relating societal and
political dynamics posits the need of a multi-sectorial approach in understanding and analyzing health
occurrence like non-communicable diseases.
• The high levels of inequality in a society as a result of societal, political and market structures may
provide differential exposure to environmental risk factors. For example, people with higher
socio-economic status consume more fast food because of their higher disposable income and higher
exposure to media advertisement. On the other hand, poorer segments are more at risk of stressful
behavior. Also, they lack physical access to healthcare providers which exacerbates the manifestation
of physical vulnerabilities.
• The accumulation of environment and social risk factors may lead to differential physical
vulnerability. As an example, the high level of consumption of food outside home (risk factor) may 1 Framework used by WHO

4
then lead to obesity. It is noteworthy that similar levels of exposure across social groups do not
translate into equal risk of occurrence of vulnerabilities or disease. The occurrence is also dependent
on other factors and the exposure duration.
• As a result of synergistic effect of vulnerabilities, health outcomes for a particular segment of social
class can be manifested as higher incidence, frequent recurrence and higher case fatality rate. The
result of differential health outcomes should be the main concern of the government to address.
Equity in health care ideally implies that everyone in need of health care receives it regardless of
social position. The result should be the reduction of all systematic differences in health outcomes.
• Disparity in health outcomes may lead also to variation in health consequences. That is why a
social class with high incidence of a particular disease may suffer higher loss of productivity,
disability, impoverishment or poor quality of life.
In summary, the conceptual pathway can be best illustrated by the figure below. The framework presents that
NCDs is preceded by interaction of different levels of factors and vulnerabilities.
Figure 2. Priority public health conditions knowledge network framework
Source: World Health Organization
Disability, poor quality of life, high levels of expenditure
Economic development, urbanization and globalization
Age/sex/SES
Exposure to fast food advertising, tobacco, alcohol, disposable income, urban infrastructure, physical activity, high caloric intake, high salt intake, high saturated fat diet, tobacco use low fiber diet
Raised cholesterol, raised blood sugar, raised blood pressure, obesity, lack of access to health services and support
Higher incidence and prevalence of NCDs
Social context
Differential exposure
Differential vulnerabilities
Differential consequences
Differential outcomes

5
NCD epidemic in emerging economies
NCD burden presents a growing threat in both developed and developing nations. In 2008, 25 million deaths
were attributed to NCDs or 65 percent of the total deaths in middle income countries compared to 8 million
deaths or 87 percent of the total deaths in high income countries (Figure 3). However, the higher share of
NCDs in high income countries is attributed to senility and insignificant share of infectious diseases which is
not the case in middle income countries (World Health Organization, 2011; Magnusson, 2007).
Figure 3. Number of deaths, by cause and country income classification, 2008.
Source: World Health Organization
Currently, the burden of NCDs is highlighted in emerging economies like China, India, Philippines and
Brazil. In middle income countries which most of the emerging economies are classified, the share of death
attributed to NCDs may reach 80 percent by 2030. In a study conducted by Stuckler (2008), developing Asia
posted to have the highest projected annual growth rate of mortality due to NCDs (Stuckler, 2008).

6
Figure 4. Estimated annual growth rates of infectious and NCD mortality, by world region, 2002-2030.
Source: Stuckler, D (2008).
It is a common perception that NCDs are diseases of the affluent. Mortality and risk factor indicators in low
and middle income countries suggest that NCDs afflicts more the richer population compared to their poorer
counterparts. At the macro-level, the concentration of NCDs towards richer segments in developing
countries can be explained by the changes in unhealthy behaviour and practices among the growing rich and
middle class population which put them at risk of NCDs. It is important to understand the processes related
to economic growth and urbanization can change consumption, expenditure and lifestyle patterns.
However, NCDs are getting complex every day which posits the eventual non-resilience of any population
group. Looking NCDs as diseases of the affluent creates misguided policy intervention and restricts financial
and programmatic investments. As developing countries are too keen on the lingering problem of infectious
diseases and oblivious on the growing threat of NCDs, they may be caught off guard on the growing disease
burden (World Health Organization, 2006; Vellakkal, 2009).
The concentration of NCDs towards a particular socio-economic class in developed and developing countries
can be best illustrated in figure 5. In rich countries, NCDs are afflicting the poorer population. This is in
contrast to developing countries where NCDs afflicts generally the richer segments. However, it can be
hypothesized that NCDs is now also affecting the poorer segments in developing countries. A case in point
is the growing non-resilience of the urban poor population. The increasing risk among the urban poor
population can be attributed to different factors like higher level of stress due to physical and environmental
pollution (e.g. overcrowding and noise), the rampant consumption of unhealthy diet (e.g. pre-cooked food
sold in the streets) and the lack of access to health service which left their physical vulnerabilities undiagnosed

7
(Uusitalo, Pietinen, & Puska, 2002).The fast rate of internal migration from rural areas to highly urbanized
cities due to localized concentration of labour opportunities increases the pool of poor in urban areas.
Figure 5. Conceptual concentration of burden of NCDs.
Developed countries Developing countries
rich poor rich urban poor poor
Source: This study.
Status of NCD mortality and morbidity in the Philippines
In 2009, seven of the ten leading causes of death are non-communicable in aetiology. Cardio-vascular
diseases (diseases of the heart, and cerebro-vascular diseases) malignant neoplasms (cancer), chronic
obstructive pulmonary disease and diabetes are the leading non-communicable diseases. The lingering
problems on infectious diseases particularly pneumonia and tuberculosis are still evident as they ranked 4th
and 5th leading cause of death (table 1).
Table 1. Top ten causes of mortality, Philippines, 2009. Diseeases Number of deaths Percent share
Diseases of the heart 100,908 21.0%
Cerebro-vascular diseases 56,670 11.8%
Malignant neoplasm 47,732 9.9%
Pneumonia 42,642 8.9%
Tuberculosis 25,470 5.3%
COPD 22,755 4.7%
Diabetes 22,345 4.6%
Nephritis, Nephrotic syndrome 13,799 2.9%
Assault 12,227 2.5%
Certain conditions arising from perinatal period 11,514 2.4%

8
When mortality data is further analysed, around 63 percent of the total deaths can be attributed to NCDs
which is similar to the estimates in most developing countries. Of the total NCDs, almost half can be
accounted to cardio-vascular diseases.
A noticeable variation is also observed if deaths are further disaggregated by sex. The shares of cardio-
vascular diseases, diabetes and malignancy on total deaths are higher in females while the shares of chronic
respiratory disease and accidents and injuries are higher in males. The difference between females and males
can be attributed to variation of risk factors. For example, females have more mortality due to diabetes
because of their higher risk to insulin resistance due to hormonal and physiologic dynamics. On the other
hand, males have higher share on accidents and chronic respiratory diseases because of their higher
involvement on behaviours that known to increase the risk of NCDs (e.g. smoking and reckless driving).
Table 1. Distribution of deaths, by cause and gender, 2008. Disease classification Total Male Female
N % N % N %
Infectious diseases (A,B,J22) 81,821 17.73% 46,465 17.29% 35,356 18.34%
Non-infectious in origin 292,170 63.30% 173,486 64.55% 118,684 61.55%
CVDs (I00-I99) 152,964 43.77% 86,042 41.62% 66,922 46.88%
Cancer (C00-D48) 49,047 14.04% 25,341 12.26% 23,706 16.61%
Accidents and injuries (V01-Y89) 35,522 10.17% 28,915 13.99% 6,607 4.63%
Diabetes(E10-E14) 22,778 6.52% 11,034 5.34% 11,744 8.23%
Chronic lower respiratory diseases (J40-J67) 21,870 6.26% 15,188 7.35% 6,682 4.68%
Chronic liver diseases and cirrhosis (K70-K74) 6,774 1.94% 5,293 2.56% 1,481 1.04%
Malnutrition (E40-E64) 2,453 0.70% 1,094 0.53% 1,359 0.95%
Mental disorder (F01-F99) 762 0.22% 579 0.28% 183 0.13%
Other NCDs (D50-D89; E01 -E07; E15; E16; E22-E88 ;G00-G96; H; remaining J K; L; M; N;Q)
57,284 16.39% 33,228 16.07% 24,056 16.85%
Maternal and child health related (O00-P96) 14,296 3.10% 7,537 2.80% 6,759 3.51%
Ill-defined ( R ) 16,010 3.47% 8,048 2.99% 7,962 4.13%
Source: Authors’ calculation of National Statistics Office mortality data for 2008.
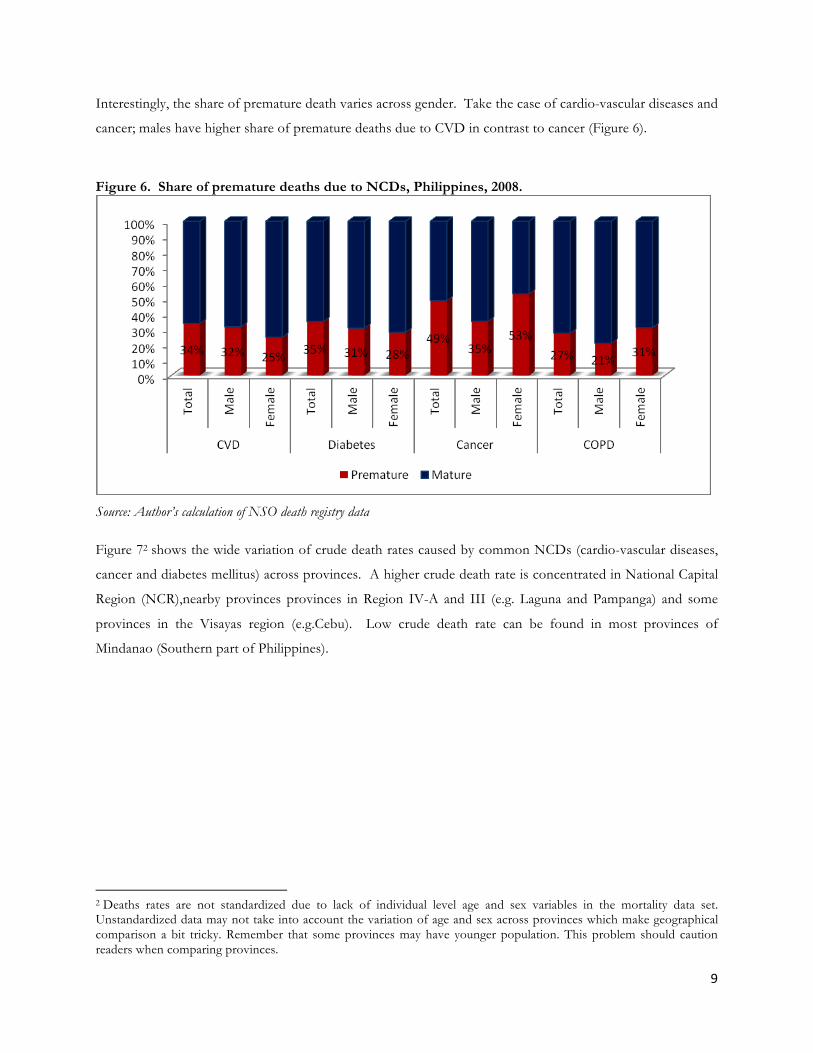
It can be argued that mortality due to NCDs is highly attributed to senility or old age. However, there is
growing evidence that significant portion of NCD deaths in the country occurred prematurely. Any NCD
mortality occurred in the productive years of life (0-60 years old) is considered premature. Early death due to
NCD is an important indicator as this relates to modifiable and lifestyle-related risk-factors. In the
Philippines, around 30-50% of deaths due to NCDs occur before the age of 60 years. In a policy perspective,
the high level of premature deaths signals eventual threat as this may affect labour and economic productivity.
9
Interestingly, the share of premature death varies across gender. Take the case of cardio-vascular diseases and
cancer; males have higher share of premature deaths due to CVD in contrast to cancer (Figure 6).
Figure 6. Share of premature deaths due to NCDs, Philippines, 2008.
Source: Author’s calculation of NSO death registry data
Figure 72 shows the wide variation of crude death rates caused by common NCDs (cardio-vascular diseases,
cancer and diabetes mellitus) across provinces. A higher crude death rate is concentrated in National Capital
Region (NCR),nearby provinces provinces in Region IV-A and III (e.g. Laguna and Pampanga) and some
provinces in the Visayas region (e.g.Cebu). Low crude death rate can be found in most provinces of
Mindanao (Southern part of Philippines).
2 Deaths rates are not standardized due to lack of individual level age and sex variables in the mortality data set. Unstandardized data may not take into account the variation of age and sex across provinces which make geographical comparison a bit tricky. Remember that some provinces may have younger population. This problem should caution readers when comparing provinces.

10
Figure 7. Crude death rates of common NCDs, by province, Philippines, 2005.
Data Source: Philippine Health Statistics 2005. Common NCDs include CVD, diabetes and cancers.
a. Cardio-vascular diseases
Cardio vascular diseases (CVD), a group of diseases that involves the heart and vascular system is responsible
for 137,000 deaths in 2007 (NSO, 2007). Atherosclerosis (e.g. ischemic heart disease, cerebro-vascular
disease, diseases of the aorta and arteries including hypertension and peripheral vessels), the leading cause of
CVD is a complex pathological process in the walls of blood vessels that develops over many years. In
atherosclerosis, fatty material and cholesterol are deposited inside the lumen of medium- and large-sized
blood vessels (World Health Organization, 2011).
Table 2 shows the frequency of deaths that were classified as CVD. Blockage of blood vessels is the leading
cause of mortality under cardio-vascular diseases (e.g cerebro-vascular disease, myocardial infarction). Small
portion of the total CVD deaths can be attributed to rheumatic heart disease and other possible forms of
congenital disorders. The table also posits a strong possibility of misclassification of the primary cause of
death (COD) related to CVD. The high level of ill-defined description of heart diseases and the inclusion of
vague COD (e.g. angina pectoris) suggest a better movement to standardize mortality reporting.

11
Like most of the major NCDs, cardio-vascular diseases, particularly atherosclerosis are functions of
accumulated effects of biological (e.g. genetics), social and environmental risk factors. The known social and
environmental risk factors of CVDs are also shared with other non-communicable diseases like diabetes
mellitus and certain cancers. These factors include sedentary lifestyle, unhealthy diet, hazardous dinking of
alcohol and tobacco use. CVDs are also linked to other physical vulnerabilities like hypertension, high blood
sugar and cholesterol and obesity (WHO,2011).
Table 2. Distribution of CVD deaths by type and sex, Philippines, 2008. Cardiovascular Disease Total Male Female
Cerebrovascular disease 51,275 28,911 22,364
Acute myocardial infarction 37,199 23,440 13,759
Disease of pulmonary circulation and other heart diseases 19,541 10,332 9,209
Hypertension without heart involvement 18,078 9,959 8,119
Other forms of ischemic heart disease 15,380 7,842 7,538
Complications and ill-defined description of heart disease 5,458 2,695 2,763
Chronic rheumatic heart disease 2,107 884 1,223
Atherosclerosis 2,106 889 1,217
Aortic aneurysm and dissection 554 343 211
Angina pectoris 440 255 185
Other diseases of arteries, and arterioles 421 237 184
Other and unspecified disorders of circulatory 207 141 66
Hypertension with heart involvement 96 58 38
Venous thrombosis and embolism 53 30 23
Acute rheumatic fever 49 26 23
Source: Authors’ calculation of NSO Mortality data for 2008
With regard to morbidity, no existing data set at the national level that attempts to disaggregate detailed
information on cardio-vascular diseases. The National Nutrition Survey only captures two general CVD
related morbidities--myocardial infarction and coronary heart disease. In 2008, the prevalence of diagnosed
myocardial infarction and coronary heart disease are both one percent. The occurrence of cardio-vascular
diseases varies by age and sex. In figures 8 and 9, it is noteworthy that females have higher prevalence of
diagnosed myocardial infarction while males have higher prevalence of diagnosed coronary heart disease. The
prevalence of both diseases increases along with age.

12
Figure 8. Distribution of population diagnosed with myocardial infarction, by age, 2008.
Figure 9. Distribution of population with diagnosed coronary heart disease, age, 2008.
Source: Authors’ calculation of National Nutrition Survey, 2008.
b. Cancer Cancer (malignant tumors or neoplasms) is a broad group of diseases that affect any part of the body. The
feature that makes cancer lethal is the abnormal proliferation of abnormal cells beyond their usual location
(metastasis). In 2008, cancer is responsible for the 7.6 million deaths worldwide (World Health Organization,
2011). In the Philippines, cancer is the second leading cause of death accounted for 44,000 deaths in 2007
(NSO, 2007).

13
Using NSO mortality data, approximately 40 percent of the cancer deaths reported have no indication of
malignancy site. Excluding those observations, figure 10 presents that cancer of the respiratory system
(trachea, bronchus and lungs), breast and colon are the leading types of cancers. Among males, cancer of the
respiratory system (trachea, bronchus and lungs), prostate and colon are the predominant type while cancers
of the breast, respiratory system and colon are common among females (Figures 11 and 12).
Figure 10. Distribution of deaths due to malignancies, Philippines, 2008.
Figure 11. Distribution of deaths due to malignancies, males, Philippines, 2008.

14
Figure 12. Distribution of deaths due to malignancies, females, Philippines, 2008.
Source: Authors’ calculation of NSO Mortality data for 2008.
Table 3 presents the incidence and mortality of different cancers. With regard to the occurrence of new cases,
breast have the highest incidence rate followed by lung cancer. However, the mortlaity rate is higher in lung
than breast cancer. Crrude inspection of mortality vis a vis with incidence rate somehow suggest the degree of
fatality of different cancers.
Table 3. Age-sex incidence and mortality of different cancers (number of new cases per 100,000), Philippines, 2008 Type of cancer ALL Male Female
Incidence Death Incidence Death Incidence Death All cancers 116.1 75.9 118.7 87.4 115.0 65.9 Breast 31.9 11.9 31.9 11.9 Lungs 17.4 14.2 27.9 22.8 7.7 6.4 Cervix 11.7 5.3 11.7 5.3 Liver 10.6 9.9 16.5 15.4 5.1 4.9 Colo-rectum 8.6 4.7 10.0 5.5 7.3 3.9 Ovary 5.7 2.8 5.7 2.8 Stomach 4.7 3.5 6.1 4.4 3.5 2.7 Corpus uteri 4.6 2.2 4.6 2.2 Leukemia 3.8 3.2 4.1 3.4 3.6 3.0 Brain 2.8 2.4 3.2 2.8 2.5 2.0 Source: Philippine Cancer Society

15
c. Diabetes mellitus
Diabetes mellitus is a chronic disease that occurs when the human body does not produce enough insulin or
when they cannot effectively use the produced insulin. Insulin is a hormone that regulates the blood sugar.
Chronic hyperglycemia (high sugar levels in the blood) is associated with the long-term consequences of
diabetes that include damage and dysfunction of the cardiovascular system, eyes, kidneys and nerves. The
complications of diabetes are often divided into two groups: micro-vascular (retinopathy, nephropathy, and
neuropathy) and macro-vascular (ischemic heart disease, stroke, peripheral vascular disease).
In general, there are two kinds of diabetes-- Type 1 and Type 2. Ninety percent of total diabetes is clinically
classified as type 2. It is important to understand that risk factors are different for type 1 and 2. Type 1 has
strong linkage on genetics while type 2 has similar risk factors and physical vulnerabilities with other NCDs.
This includes obesity, decreased physical activity and unhealthy diets, with hypertension and dyslipidemia
(Wild, 2004; World Health Organization, 2011)
In 2004, an estimated 3.5 million people died worldwide from consequences of high blood sugar. In the
Philippines, 21,000 deaths were attributed to the disease in 2007 (Figure 13). The number of deaths is almost
equal for males and females (WHO, 2011; NSO, 2011).
Figure 13. Distribution of deaths due to Diabetes mellitus, Philippines, 2008.
Source: Authors’ calculation of NSO Mortality data for 2008.

16
With regard to morbidity, approximately 5 percent of the adult population (20 years old and older) had a
blood sugar of more than 125 mg/dl, one of recommended cut-off values to diagnose diabetes mellitus.
Table 4 shows that females have slightly higher prevalence of diabetes mellitus compared to males (4 percent
to 5.5 percent).
Among females, there is a noticeable positive relationship between age and prevalence of diabetes mellitus.
As female age increases, the prevalence of diabetes also increases. However, the prevalence decreases after a
certain age group.
Table 4. Prevalence of Diabetes mellitus among adults 20 years old and above, by age group and sex, Philippines, 2008. Variable Category Total Male Female
% 95% CI % 95% CI % 95% CI Philippines 4.8 4.2-5.4 4.0 3.2-4.8 5.5 4.6-6.3 Age 20-29 0.4 0.0-0.7 0.3 0.1-0.8 0.4 0.02-1.0 30-39 3.2 2.0-4.3 2.5 1.1-3.9 3.8 2.1-5.5 40-49 5.7 4.4-7.0 6.0 4.1-8.0 5.4 3.7-7.1 50-59 9.0 7.0-11.1 7.8 5.2-10.3 10.0 7.2-12.8 60-60 9.1 6.8-11.4 6.8 3.8-9.8 10.9 7.5-14.3 70-up 4.4 2.4-6.4 2.2 0.02-4.3 5.9 2.9-9.0
Source: Author’s calculation of NNS 2008.
Table 5 also shows a variation of diabetes mellitus prevalence across socio-economic class. Using educational
attainment and socio-economic status3 (Filmer & Pritchett, 2001) as welfare indicator, the prevalence of
diabetes increases as socio-economic status and educational status increases. The higher prevalence of
diabetes mellitus among the affluent population follows the same pattern of some developing countries
wherein there is a positive relationship between socio-economic status and diabetes mellitus (WHO, 2011).
3Since the National Nutrition Survey did capture neither income nor expenditure, socio-economic status was derived using Principal Component Analysis (PCA). PCA calculates socio-economic scores using the seven tangible household assets namely, refrigerator, television, radio, electricity, motorcycle, telephone, electric fan, car, range, washing machine and movie player

17
Table 5. Prevalence of Diabetes mellitus among adults 20 years old and above, by socio-economic status, urbanization and educational attainment, Philippines, 2008. Characteristics Category Total Male Female
% 95% CI % 95% CI % 95% CI Lower Upper Lower Upper Lower Upper
Total 4.8 4.2 5.4 4.0 3.2 4.8 5.5 4.6 6.3 SES Poorest 1.8 1.0 2.5 1.4 0.5 2.3 2.2 1.1 3.4 Poor 3.0 2.0 4.1 2.2 1.0 3.4 3.9 2.3 5.5 Middle 3.5 2.5 4.5 3.0 1.6 4.4 3.9 2.5 5.3 Rich 6.4 4.9 7.8 5.4 3.3 7.6 7.1 5.2 9.0 Richest 8.1 6.4 9.8 6.7 4.3 9.2 9.1 6.8 11.5 Urbanization Urban 5.6 4.6 6.5 4.5 3.2 5.7 6.4 5.2 7.7 Rural 3.7 3.0 4.4 2.9 2.0 3.8 4.6 3.5 5.6 Educational no education 2.6 0.3 4.9 1.7 -0.7 4.1 3.6 -0.5 7.7 Attainment elementary 4.6 3.6 5.5 2.9 1.8 3.9 6.0 4.6 7.5 secondary 4.4 3.5 5.3 3.9 2.7 5.1 4.9 3.4 6.4 Tertiary 5.3 4.2 6.4 4.7 3.1 6.4 5.8 4.2 7.3 Source: Author’s calculation of NNS 2008.
By synergistically combining socio-economic status and urbanity, it can be noticed that the urban poor have
higher prevalence of Diabetes mellitus compared to their counterparts in rural areas. The variation is more
obvious among females while the prevalence among males is relatively the same.
Table 6. Prevalence of Diabetes mellitus among adults 20 years old over, by urban and rural poor4, Philippines, 2008.
Diabetes Total Male Female % 95% CI % 95% CI % 95% CI
Lower Upper Lower Upper Lower Upper Rural poor 2.2 1.5 3.0 1.8 0.8 2.8 2.8 1.6 3.9 Urban poor 2.9 1.5 4.2 1.8 0.5 3.2 3.9 1.8 6.0 Source: Author’s calculation of NNS 2008.
d. Chronic Lower Respiratory Disease
Chronic Lower Respiratory Diseases (CLRD) encompasses the three major diseases: chronic bronchitis,
emphysema and asthma. All CLRD are characterized by shortness of breath caused by airway obstruction. In
the previous years, chronic bronchitis and emphysema belong to another sub-group called Chronic Obstructive
Pulmonary Disease or COPD.
4 Households are considered urban poor if they belong to Q1 and Q2, and living in urban areas (not necessarily highly urbanized areas). The NNS cannot be used to disaggregate the estimates by highly urbanized cities due to limited sample size.

18
In the Philippines, approximately 7 percent of the total deaths can be attributed to CLRD, and majority of
these can be classified as COPD (60%). It is also necessary to observe the high concentration of mortality in
males. Approximately, 69 percent of total CLDR-related deaths occurred in males.
Table 7. Deaths due to Chronic Lower Respiratory Diseases (CLRD), Philippines, 2008 Major Chronic Lung Diseases Total Male Female
N % N % N %
Other chronic obstructive pulmonary disease* 10,179 47% 7,748 51% 2,431 36%
Status asthmaticus** 4,873 22% 2,852 19% 2,021 30%
Asthma 4,216 19% 2,587 17% 1,629 24%
Emphysema* 2,038 9% 1,676 11% 362 5%
Bronchiectasis* 285 1% 132 1% 153 2%
Unspecified chronic bronchitis* 225 1% 158 1% 67 1%
Bronchitis, not specified as acute or chronic* 37 0% 25 0% 12 0%
*considered as COPD ** considered as asthma Source: Authors’ calculation of NSO Mortality data for 2008.
Tobacco smoking is the most important risk factor for chronic bronchitis and emphysema. The higher deaths
due to chronic bronchitis and emphysema in males compared to females can be attributed to the higher
smoking prevalence in males. In the United States, smoking accounted for about 80% of chronic bronchitis
and emphysema cases (Department of Health and Human Resources, 2006). On the other hand, asthma is a
chronic inflammatory disorder of the airways, usually associated with airway hyper-responsiveness and
variable airflow obstruction that is often reversible. Allergen sensitization is an important risk factor for
asthma. However, studies have shown that smoking significantly aggravates the occurrence of asthma.

19
Determinants of NCDs
The role of macroeconomic and macro-social factors on NCDs
Macroeconomic and social factors can generally explain the high participation of the population on risky
activities and behaviours which exacerbate their occurrence. Stuckler (2008) argues that the growing NCD
can be best explained by the structural concepts of globalization which are (a) economic growth, (b)
economic flows and (c) technological change.
A. Economic growth
Arguably, the growing burden of NCDs in most emerging countries can be attributed to the processes of
strong economic activity. Relating economic activity to the emergence of NCDs is complex as this may not
directly describe causality. However, conditions and processes of economic growth like urbanization, food
availability, employment and technology are favourable to the possible emergence of NCDs. It is important
to understand that as the population’s income level increases, people’s behaviour, consumption and
expenditure change. Rapid growth open doors to modify a population’s risk just as their lifestyle catch up to
their new found wealth. This scenario is a growing trend in China, India and other countries in ASEAN like
Indonesia and the Philippines (Stuckler, 2008; Vellakal, S, 2009).
In the Philippines, crude death rates attributed to major NCDs like diseases of the heart and cancer are
increasing over time in contrast to decreasing death rate of infectious diseases (Figure 14). The figure also
shows the positive relationship between crude death rate of common non-communicable diseases and
increasing economic activity (gross national income). Though economic growth in the country is in slower
pace compared to other countries in the region, there were significant improvements in the macroeconomic
conditions over the years. However, the growing NCDs can also be attributed to improvements in diagnosis
and recording of diseases which might mask the true trend of epidemiologic shift. As mentioned in some
studies, there was enough evidence suggesting that poor areas are more likely to misclassify the cause of death
(P. & Chalapati, 2001).

20
Figure 14. Crude death rate due to NCDs vs. GNI per capita, Philippines, 1980-2005.
Source: Philippine Health Statistics and World Bank. Rapid economic growth drives many of the population out from poverty. Analysis between poverty incidence
and crude death rate attributed to major NCDs clearly depicts strong negative correlation (R= -0.44, p value
= 0.000). As poverty incidence decreases, the crude death rate attributed to major NCDs increases. Take the
case of NCR and nearby provinces like Laguna, Cavite and Pampanga. These provinces have low poverty
incidence but the crude death rates are high. In contrast, provinces in Mindanao have high levels of poverty
incidence but the crude death rates are low compared to the national levels (World Bank, 2011; Department
of Health, 2005; National Statistical Coordination Board, 2006)5.
5. Provinces might have low death rates because its population is younger. It is noteworthy that higher fertility rates are also associated with poverty.

21
Figure 15: Poverty incidence and crude death rate of common NCDs, Philippines, 2005.
Source: Authors calculation of CDR using NSO Mortality data of 2005 and Poverty incidence was adopted from NSCB.
Changes in l i f e s t y l e due to urbanizat ion
The rapid economic growth in some developing countries significantly changed the societal structures in
communities and households. One of the processes related to economic growth is rapid urbanization. In
Asia, the growth of urbanization is very fast. Table 8 presents the share of urban population to total
population from the 1970 to 2010. It can be observed that emerging countries in Asia like demonstrate higher
rate of urbanization compared to the global picture.
Table 8. Percent of the population living in urban areas, 1970-2010 Country 1970 1980 1990 2000 2010 Annual
Growth Rate World 36.0 39.1 43.0 46.7 50.9 0.9% OECD 65.0 68.8 72.0 74.6 77.0 0.5% Philippines 33.0 37.5 48.8 58.5 66.4 1.6% Indonesia 17.1 22.1 30.6 42.0 53.7 2.7% Thailand 20.9 26.8 29.4 31.1 34.0 1.1% Vietnam 18.3 19.2 20.3 24.3 28.8 1.4% China 17.4 19.6 27.4 35.8 44.9 2.1% India 19.8 23.1 25.5 27.7 30.1 1.1% Source: World Bank

22
To cope with the fast pace in urban areas, many people resorted to dietary and lifestyle changes. The growing
participation of women in labour market has also significantly changed the dietary consumption and
expenditure patterns of households. Currently, many households especially in the urban areas resort to food
outside home since mothers do not have time any more in preparing food for their families. Traditionally,
mothers are expected to perform major domestic roles like food preparation (Uusitalo, Pietinen, & Puska,
2002; Cohen B. , 2004; Cohen B. , 2006).
Though there have been significant changes in the domestic economy, inclusive growth seems very elusive as
manifested by the increasing number poor population especially the urban poor. Table 9 presents the
growing share and frequency of poor in areas considered as highly urbanized. It is established in many studies
that urban poor population shares a higher risks of acquiring NCD compared to their counterpart in rural
area. As noted, the increasing risk among the urban poor population can be attributed to different factors
like higher level of stress due to physical and environmental pollution (e.g. overcrowding and noise), the
rampant consumption of unhealthy diet (e.g. pre-cooked food sold in the streets) and the lack of access to
health service which left their physical vulnerabilities undiagnosed (Uusitalo, Pietinen, & Puska, 2002).
Table 9. Percent and frequency of urban poor population, Philippines, 2000 and 2006 Location 2000 2006
% to Population Number of Poor % to Population Number of Poor Philippines 33.02 25,472,358 32.89 27,589,745
Rural 47.76 18,645,869 48.72 19,663,144 Urban 17.92 6,826,489 19.17 7,926,601 Small Cities 22.14 219,081 29.8 335,990
Large Towns 11.36 450,223 11.62 499,285
Large Cities 15.64 1,947,512 17.56 2,329,661
Large Towns/Cities 14.61 2,397,735 17.24 2,828,946
Metro Manila 7.75 860,934 10.41 1,156,313 *Source: Calculation of Family Income and Expenditure Survey

23
Dietary t rans i t ion
The rapid industrialization has changed the methods of production, processing, distribution and marketing of food
products. The progression of marketing techniques and practices have led also modified the dietary preferences
and food composition of typical diet (Uusitalo, Pietinen, & Puska, 2002). Today, there is a noticeable dietary shift
towards high in fat, refined carbohydrates and low-fiber diet in most countries. Though dietary transition was first
experienced in the developed nations, there is now a significant dietary shift in developing countries. Figure 16
shows growing per capita supply of meat products which are good source of fat while the per capita supply of
vegetables is noticeably decreasing over time.
Another pertinent example is the decreasing per capita consumption of healthier food products like root crops.
Though it is important to understand root crops are considered as inferior goods. In other words, as the
population of a country becomes more affluent, their consumption of root crops decreases. Vis a vis with the
decreasing consumption of root crops is the increasing per capita consumption of products from animal fat. Most
emerging economies like India, China and Philippines are experiencing drastic increase in the per capita
consumption of products from animal fat. Though consumption of animal fat is still higher in developed
countries, the rates in emerging economies are notably increasing in a faster rate (Figure 17).
Figure 16: Supply kilogram per capita per year of meat and vegetable products, 1960-2007, Philippines
*
Source: FAOSTAT

24
Figure 17: Supply kilogram per capita per year of animal fat and starchy root crops, 1960-2007, Philippines and selected emerging economies
*
Source: FAOSTAT
B. Economic flows (food trade)
Growing t ransnat iona l and domes t i c food corpora t ions
In the last decades, rapid changes in food production, distribution and retailing have occurred in emerging
economies. As more transnational food corporations (TNCs) expanded in emerging economies, the demand
and supply of new food products drastically changed. It is important to understand that these TNCs have
developed global brand names and possess effective marketing strategy which eases the adaptation of these
new food products to the local taste. Though it has been struggle for most researchers to empirically link the
effect of these TNCs in the emergence of NCDs, they are widely viewed to increase the consumption of
food high in refined sugar and saturated fat. In The Philippines, players in the food industry are dominated by
by well-known TNCs like Nestle, Nissins and Dole and local food companies with global infleunce like San
Miguel and Jolibee (Table 10).
The transformation and growth of ‘modern’ food retail industry is also contributory to the changes in the
supply-side of food products. In the late 90’s to 2000’s, there was an observable proliferation of supermakets,
hypermarkets and convenient stores replacing the old style sari-sari store and wet markets. In the Philippines,
food retail industry is dominated by local players (i.e. SM, Robinsons) and some transnational corporation (i.e.

25
foreign cash & carry chain SHV Makro of the Netherlands). The proliferation of new sources of food can be
driven by a lot of demand-side factors such as urbanization, rise in incomes, and infrastructure improvements.
Table 10. Top ten food and alcohol corporations, Philippines, 2008 Ranking Company Sales ('000) Main Products
6 Nestle Phils., Inc. 82,815,652 Processed dairy products, cereals, infant products
16 San Miguel Brewery, Inc. 49,145,000 Beverages 20 San Miguel Foods, Inc. 42,475,807 Processed meat; dairy,
snacks 22 Supervalue, Inc. 39,547,840 Retail 28 Fortune Tobacco Corporation 33,221,005 Tobacco 29 Philip Morris Philippines Manufacturing, Inc. 32,770,827 Tobacco 35 Dole Philippines, Inc. 25,055,651 Processed fruits and
vegetables 38 Jollibee Foods Corporation 22,544,009 Fast food 40 Monde Nissin Corporation 21,200,562 Snacks 43 Puregold Price Club, Inc. 19,733,358 Retail
**Securities and Exchange Commission
Fore ign Dire c t Inves tments
Changes in the type of food supply can be driven by different factors such as urbanization, rising income and
employment, etc. However, in general, the influx of Foreign Direct Investments (FDI) has been very
instrumental in changing the type of food available in the market. By definition, FDI is investment of foreign
assets into domestic structures, equipment, and organizations. In most cases, as foreign companies acquire
large shares and pour significant investments to local food firms, they have the ability to produce retail and
distribute locally and globally accepted products. Conditions for FDI were facilitated through the easing on
FDI regulations as part of structural adjustment programs and free trade agreements among countries.
FDI has played a critical role in the diet transition as it has especially targeted highly processed foods. There
is a close relationship between a rise in FDI and increased investments in processed foods. In most emerging
markets like the Philippines, FDI in food industries grew significantly. Though the country is experiencing
fluctuations of total value FDI in contrast to many ASEAN countries, food and beverage industry is one of
the few industries that sustained growth from 1980 to 2007. At present, 41 percent of FDI in manufacturing
are from food and beverage products (Aldaba, R. and Aladaba, 2010).

26
Table 11. Foreign Direct Investments in manufacturing industry, Philippines. 1980-2007. Manufacturing Industry Cumulative FDI Inflows (in million
USD) Percent share
80-89 90-99 00-07 80-89 90-99 00-07 Food Products and Beverages 214.5 1,004.0 1,055.8 23 26 41 Chemicals and Chemical Products
246.5 329.2 347.3 27 9 13
Coke, Refined Petroleum 53.6 760.4 270.8 6 20 11 Basic Metals 105.7 198.3 92.4 11 5 4 Machinery, Apparatus, Supplies, Communication equipment
769.3 175.9 0 20 7
Others manufacturing 302.7 748.2 635.0 33 20 25 Total manufacturing 923.1 3,809.5 2,577.2 100 100 100 *Source: Aldaba et. al, 2010.
Food impor ta t ions
Philippines is committed to free trade liberalization as one way to boost economic growth. Under the free
trade liberazation, countries can now ship goods, materials and services beyond their political and economic
boundaries. Undoubltedly, it has positive impact on employment, competitive prices of goods and enhances
the quality and quanity of the labor force. Its negative effects on health outcomes especially in developing
countries are still poorly understood. Some literature would argue that lowering trade barriers is directly
associated with increased imports which then, in most cases, leads to greater availability of goods including
tobacco, alcohol and processed foods. As these goods become more readily available and increasingly
affordable – and social trends continue to favor convenience and transitional foods – the burden of NCDs
continues to grow (Rayner, Hawkes, Lang, & Bello, 2007).
Before 1940’s, many countries were self-sufficient, but during the “era of development,” countries had
become more reliant on imports, with impact on diet and food supply chain dynamics (Rayner, Hawkes,
Lang, & Bello, 2007). In the Philippines, the quantity of import is more than twice the export, ascertaining
the country’s reliance on imported food items. In addition, there was a significant increase in the quantity of
imported food like meat, dairy products and oils in the past two decades (Table 12). In meat and related
preparations, the country imported 41 million kilograms in the early 90’s compared to 381 million kilograms
in 2010, a 32 percent annual increase. A similar pattern was also observed in other food items especially
animal and vegetable fat. The rising quantity of imported food items maybe driven by burgeoning
population. However, pieces of evidence show that there were also an increase in food consumption per
capita (Bureau of Agricultural Statistics, 2010).

27
Table 12. Quantity of food import and export, Philippines, 1994-2010. Food Items Import Export
2010 Quantity (kg) '000
Growth rate (1994-2010)
2010 Quantity (kg) '000
Growth rate (1994-2010)
Food and live animals (TOTAL) 8,921.78 10.8% 3,515.97 1.5% Meat and Meat Preparations 380.77 31.8% 10.34 101.2% Dairy Products and Bird's Eggs 326.56 5.5% 34.74 71.2% Fish and Fish Preparations 171.13 3.9% 177.17 2.8% Cereal and Cereal Preparations 4,856.08 9.4% 52.28 31.0% Vegetables and Fruits 552.06 12.6% 2,266.19 2.1%
Tobacco and related products 39.00 0.8% 56.94 15.9% Animal and vegetable fat 258.98 19.3% 1,379.00 5.9% Source: Calculation of data from Bureau of Agricultural Statistics, 2010.
C. Advancement in technology
In addition to economic growth and economic flows, advancement in technology is part of the bigger picture.
As societies mature and grow, labour shifts from agricultural to a more intellectual production. Consequently,
work becomes increasingly sedentary (Stuckler, 2008). In the Philippines, there is a noticeable decline in
number of people working on the agriculture sector while there is an increase in the number of employees in
“intellectual” industries like banking, finance and healthcare. The increasing number of laborers and unskilled
workers posits growing demand in other industries highly related to macroeconomic growth like
infrastructure (Department of Labor and Empoyment).
Figure 18. Number of employed person by major occupation group, Philippines, 2002-2010.
Source: Department of Labor and Employment

28
As technology advances in society, work also becomes more concentrated in a specific area. A case in point is
the growing business outsourcing industry in the country. The burgeoning opportunities in BPO industries
which are highly concentrated in major cities drive many people from rural to urban areas. Consequently, the
high urbanization rate will then affect food and lifestyle dynamics. In urban settings where food production
is concentrated, manufacturers take advantage of economies of scale. This leads to lower prices encouraging
people to eat outside the home. Urbanization may also promote physical inactivity as a result of fast and
convenient transport system (Stuckler, 2008).

29
Vulnerabilities
This section presents different indicators of vulnerabilities of non-communicable diseases. By definition,
vulnerabilities are intermediate factors of certain exposures and the actual disease6. According to World
Health Organization, Body Mass Index (BMI), hypertension, high serum or blood cholesterol and high
fasting blood sugar are the major indicators under vulnerabilities. It is important to note that these indicators
are shared risk factors of major NCDs like cardio-vascular disease and certain cancers.
A. Body Mass Index (BMI)
Body Mass Index (BMI) is a number calculated from a person's weight and height. BMI provides a reliable
indicator of body fatness and is used to screen for weight categories. Similar to WHO recommended cut-off
point, a BMI of 30 or more is considered obese. It is proven in many studies that obesity as ascertained by
high BMI is associated with many diet-related chronic diseases including diabetes mellitus, cardiovascular
disease, stroke, hypertension and certain cancers (World Health Organization, 2011).
Inherent to non-communicable diseases, the occurrence of obesity is relative contributions of both genetics
and environmental factors. Genetics can contribute 30-40 percent variance in BMI while environmental
factors can contribute 60-70 percent variance. However, epidemiological studies suggest that even in
population with a certain gene prone to obesity but living in a traditional lifestyle (less consumption of animal
fat, low caloric density intake, eat more complex carbohydrates and have greater energy expenditure from
physical labor), still have significantly lower risk of obesity (Pi-Sunyer, 2002).
Obesity is increasing in an alarming rate in both developing and developed nations (Mortell, Khan, Hughes,
& Grummer-Strawn, 2000). In the Philippines, the prevalence of obesity among adult population (20 years
old-up) is 3.7% for males and 6.6% for females. The prevalence is highly associated with age following a “bell
shape” relationship. Prevalence of obesity increases along with age then decreases after reaching a certain age
period (Table 13).
6There are instances wherein vulnerabilities can also be the actual disease. For example, diabetes can be the disease but it is also an important vulnerability factor that exacerbates the occurrence of other diseases like CVDs.

30
Table 13. Prevalence of obesity among adults 20 years old and above, by age group and sex, Philippines, 2008. Variable Category Total Male Female
% 95% CI % 95% CI % 95% CI Philippines 5.2 5.0-5.4 3.7 3.5-4.0 6.6 6.3-6.9 Age group 20-29 2.9 2.6-3.1 2.2 1.9-2.6 3.6 3.1-4.1 30-39 6.1 5.7-6.5 4.9 4.4-5.4 7.3 6.7-7.9 40-49 6.8 6.4-7.2 5.0 4.4-5.5 8.4 7.8-9.0 50-59 6.3 5.8-6.7 4.2 3.6-4.8 8.0 7.3-8.6 60-60 4.6 4.1-5.2 2.4 1.8-3.0 6.4 5.6-7.2 70-up 2.4 1.9-2.9 1.2 0.6-1.7 3.2 2.4-3.9 Source: NNS 2008.
Affluence and urbanity have been linked with obesity especially in developing countries. Analysis by socio-
economic status shows positive relationship between obesity and common used socio-economic indices. The
prevalence of obesity increases along with socio-economic status and educational attainment, while higher
prevalence of obesity was found in urban areas compared to rural areas (table 14).
Table 14. Prevalence of obesity among adults 20 years old and above, by urbanization and educational attainment, Philippines, 2008. Characteristics Category Total Male Female
% 95% CI % 95% CI % 95% CI Lower Upper Lower Upper Lower Upper
Total 5.2 5.0 5.4 3.7 3.5 4.0 6.6 6.3 6.9 SES Poorest 1.1 0.5 1.7 0.8 0.1 1.4 1.5 0.5 2.5 Poor 2.5 1.6 3.3 1.1 0.3 1.9 3.8 2.3 5.3 Middle 5.0 3.8 6.2 4.5 2.8 6.2 5.5 3.7 7.3 Rich 6.2 4.8 7.6 6.6 4.5 8.7 5.9 4.1 7.7 Richest 7.9 6.4 9.4 6.6 4.6 8.5 8.9 6.8 11.0 Urbanization urban 5.7 4.8 6.6 5.1 3.8 6.3 6.2 5.0 7.4 Rural 3.6 2.9 4.3 2.7 1.9 3.5 4.5 3.5 5.5 Educational no education 0.5 -0.4 1.4 0.9 -0.9 2.7 0.0 0.0 0.0 Attainment elementary 3.6 2.8 4.4 2.4 1.4 3.4 4.6 3.3 5.8 secondary 4.9 4.0 5.9 3.5 2.2 4.7 6.3 5.0 7.7 tertiary 6.3 5.1 7.4 6.8 5.0 8.7 5.8 4.4 7.2
Source: NNS 2008.

31
Table 15. Prevalence of obesity among adults 20 years old and above, by urban and rural poor, Philippines, 2008.
Obesity Total Males Females
% 95% CI
% 95% CI
% 95% CI
Lower Upper Lower Upper Lower Upper Rural poor 1.6 1 2.2 0.6 0.2 1.1 2.5 1.4 3.6 Urban poor 2.4 1.3 3.5 1.6 0.2 2.8 3.2 1.4 4.9 Source: NNS 2008.
Multivariate regression analysis was performed to predict the possible factors that decreases or increases body
mass index. Stepwise regression analysis would allow us to measure the independent relationships controlling
for other independent variables. Body Mass Index, in continuous measurement is the dependent variable
while wide range of socio-demographic characteristics and consumption patterns were included as
independent variables. Spurious
Table 60 presents the different significant variables associated with BMI. The positive coefficient is
interpreted as unit increase of BMI in every unit change of an independent variable while the negative
coefficient is interpreted as decrease in every unit of BMI in every unit change in the independent variables.
Take the case of age, if all other variables are constant, there is an increase in BMI as age increases to 30-39
and 40-49 years old but there is a decrease in BMI as age further increases to 60-69 and 70 and up.
Other socio-demographic characteristics like sex and socio-economic status are important predictors of BMI.
If other variables are fixed, females have higher average unit increase of BMI relative to males while a unit
increase in socio-economic scores positively increases BMI. For other significant variables, the direction of
their coefficients is shown in table 10.

32
Table 16. Regression results of BMI and different predictors. Variable Category Coef p value Lower limit Upper limit
Age (ref 20-29) 30-39 0.951 0.000 0.541 1.361
40-49 0.704 0.001 0.290 1.118
50-59 0.186 0.436 -0.281 0.653
60-69 -0.725 0.016 -1.317 -0.133
70-up -1.278 0.002 -2.094 -0.462
Sex (ref: males) Sex 0.606 0.001 0.240 0.972
Socio-economic scores Socio-economic scores 0.335 0.000 0.263 0.407
Cholesterol (mg/dl) cholesterol (mg/dl) 0.912 0.000 0.753 1.070
Sugar level(ref: less than 110) FBS (110-125 mg/dl) 0.548 0.183 -0.258 1.354
FBS (more than 125 mg/dl) 0.881 0.013 0.183 1.579
Region (ref: Region 1) Cagayan Valley 1.212 0.003 0.405 2.018
Central Luzon 0.762 0.038 0.042 1.482
Bicol Region 0.384 0.347 -0.416 1.183
Western Visayas 0.896 0.023 0.122 1.670
Central Visayas 1.298 0.000 0.570 2.026
Eastern Visayas 1.446 0.001 0.567 2.325
Zamboanga Peninsula 1.261 0.005 0.388 2.135
Northern Mindanao 1.678 0.000 0.829 2.528
Davao Region 0.779 0.088 -0.116 1.674
SOCCSKSARGEN 1.523 0.000 0.699 2.348
NCR 0.804 0.022 0.117 1.491
CAR 1.502 0.006 0.436 2.568
ARMM 0.295 0.638 -0.933 1.522
CARAGA 1.180 0.022 0.173 2.186
CALABARZON 1.470 0.000 0.772 2.169
MIMAROPA 0.989 0.043 0.033 1.944
Alcohol (ref: never) current alcohol drinker 0.073 0.738 -0.353 0.499
past alcohol drinker 0.497 0.010 0.116 0.877
Smoking (ref: non-smokers) Past smoker -0.575 0.001 -0.921 -0.230
Current smoker 0.427 0.048 0.004 0.850
Hypertension(ref: normal) High normal 0.371 0.036 0.025 0.718
Pre-hypertension 1.091 0.000 0.645 1.538
Hypertension 1.377 0.000 1.013 1.741
Physical activity Physical activity -0.267 0.098 -0.584 0.050
Total energy (kcal) Total energy (kcal) 0.001 0.000 0.000 0.001
History of obesity History of obesity 1.060 0.000 0.710 1.409
Source: Author’s calculation of NNS 2008.

33
B. Total blood cholesterol
The World Health Organization included high serum cholesterol as important risk factor of major non-
communicable diseases. Excessive cholesterol in the blood can deposit overtime so that the arteries become
narrower and blood flow to the heart is blocked. Biological and lifestyle changes are important factors that
contribute in the development of hypercholesterolemia. Some studies noted that lowering the total serum
cholesterol is an ideal strategy for reducing the burden of cardio-vascular diseases (World Health
Organization, 2011; Fuller, Stevens, Wang, & Group, 2001).
In the Philippines, 7.3 percent of adult males and 12.8 percent of females have hypercholesterolemia or
excessively high levels of blood cholesterol (≥240 mg/dl). The prevalence of hypercholesterolemia is highest
in the age group 50-59 years old. Among females, the prevalence is 25 percent compared to 13 percent of
their male counterparts (Table 17).
Table 17. Prevalence of high Total Cholesterol (> 240 mg/dl) among adults 20 years old and above, Philippines, 2008. Variable Category Total Male Female
% 95% CI % 95% CI % 95% CI Philippines 10.2 9.3-11.2 7.3 6.2-8.3 12.8 11.5-14.1 Age 20-29 4.0 2.9-5.2 4.3 2.6-6.0 3.7 2.2-5.2 30-39 6.4 5.0-7.7 6.3 4.3-8.2 6.4 4.6-8.3 40-49 10.0 8.3-11.7 7.7 5.5-9.8 12.2 9.6-14.7 50-59 20.0 17.2-22.8 13.0 9.7-16.3 25.5 21.6-29.4 60-60 15.6 12.5-18.5 7.0 3.7-10.2 22.5 18.1-26.9 70-up 12.4 9.2-15.5 7.9 3.3-12.4 15.5 11.0-20.0 Source: Author’s calculation of NNS 2008.
Disaggregating the prevalence of hypercholesterolemia by socio-economic status, the prevalence increases as
the socio-economic status increases. There is a similar trend if educational attainment is used as indicator to
measure welfare. The prevalence of hypercholesterolemia increases along with educational attainment (Table
18).

34
Table 18. Prevalence of high cholesterol among adults 20 years old and above, by socio-economic status, urbanization and educational attainment, Philippines, 2008. Characteristics Category Total Male Female
% 95% CI % 95% CI % 95% CI Lower Upper Lower Upper Lower Upper
Total 10.2 9.3 11.2 7.3 6.2 8.3 12.8 11.5 14.1
SES Poorest 4.7 3.3 6.0 2.9 1.4 4.4 6.7 4.5 8.8 Poor 6.7 5.3 8.2 3.9 2.4 5.4 9.6 7.2 11.9 Middle 8.1 6.5 9.8 6.1 4.1 8.0 10.0 7.7 12.4 Rich 12.5 10.4 14.5 10.1 7.2 13.1 14.2 11.5 17.0 Richest 17.3 14.9 19.7 14.4 11.3 17.6 19.4 16.2 22.6 Urbanization Urban 11.9 10.5 13.3 9.4 7.8 10.9 13.9 11.9 15.9 Rural 8.0 7.0 9.1 5.3 4.0 6.5 10.8 9.2 12.3 Educational No education 5.8 2.4 9.2 2.0 -0.4 4.3 9.9 3.5 16.4 Attainment Elementary 8.3 7.0 9.6 3.7 2.5 4.9 12.3 10.3 14.2 Secondary 9.6 8.3 11.0 8.3 6.5 10.0 11.0 9.0 13.1 Tertiary 13.1 11.2 15.1 11.3 8.7 13.9 14.5 12.0 17.0
Source: Author’s calculation of NNS 2008.
Rapid urbanization has been associated with high blood cholesterol levels. In the Philippines, the prevalence
of hypercholesterolemia is relatively higher in urban areas. Analyzing the levels of hypercholesterolemia
among the poor urban poor, the prevalence is higher compared to their rural counterparts.
Table 19. Prevalence of high cholesterol among adults 20 years old and above, by urban and rural poor, Philippines, 2008.
hypercholesterolemia Total Male Female
% 95% CI % % 95% CI % Lower Upper Lower Upper LL UL
Rural poor 5.4 4.2 6.6 3.2 1.9 4.5 7.9 6 9.8 Urban poor 6.4 4.7 8.2 3.9 1.9 6 8.9 6 11.8 Source: Author’s calculation of NNS 2008.
Using stepwise multivariate regression analysis, table 20 presents the different significant predictors of total
cholesterol. Taking the case of age, if all other variables are constant, there is an increase in total cholesterol
as age increases.
Other socio-demographic characteristics like sex, socio-economic status and urbanity are important
predictors of total cholesterol. If other variables are fixed, females have higher average unit increase of total
cholesterol relative to males while a unit increase in socio-economic scores positively increases total
cholesterol. People living in rural areas have lower average decrease compared to people living in urban areas.
For other significant predictors, the direction of their coefficients is shown in table 20.

35
Table 20. Regression results of total cholesterol and different predictors. Variable
Category Coefficient p value Lower limit Upper limit
BMI BMI 1.99 0.00 1.73 2.25
Age (ref 20-29) 30-39 9.11 0.00 6.12 12.10
40-49 14.44 0.00 11.39 17.49
50-59 26.95 0.00 23.58 30.32 60-69 27.33 0.00 23.29 31.36
70-up 26.47 0.00 21.57 31.36
Sex (Ref: males) Sex 8.47 0.00 6.21 10.73
Socio-economic scores Socio-economic scores 1.21 0.00 0.62 1.80
Educational attainment Primary 5.85 0.10 -1.04 12.75 Secondary 11.29 0.00 4.22 18.36
Tertiary 15.11 0.00 7.79 22.44
Urbanity (ref: urban) Urbanity -2.72 0.02 -4.98 -0.45
Sugar level (ref: less than 110) FBS (110-125 mg/dl) 4.65 0.12 -1.18 10.48 FBS (more than 125 mg/dl) 15.65 0.00 11.14 20.16
Region Cagayan Valley -6.75 0.04d -13.22 -0.28
Central Luzon -5.49 0.04 -10.73 -0.25
Bicol Region 7.40 0.02 1.39 13.40
Western Visayas -4.33 0.13 -9.89 1.24 Central Visayas -5.82 0.03 -11.19 -0.45
Eastern Visayas -4.21 0.18 -10.31 1.89
Zamboanga Peninsula -12.92 0.00 -19.53 -6.31
Northern Mindanao -12.37 0.00 -18.70 -6.04
Davao Region -8.93 0.00 -14.94 -2.92 SOCCSKSARGEN -12.62 0.00 -19.06 -6.19
NCR 1.16 0.66 -3.97 6.30
CAR -3.72 0.38 -12.12 4.67
ARMM 7.79 0.08 -1.02 16.61
CARAGA -10.90 0.00 -18.26 -3.53 CALABARZON -1.99 0.45 -7.19 3.20
MIMAROPA -5.66 0.14 -13.07 1.75
Alcohol (ref: never) current alcohol drinker -5.39 0.00 -8.42 -2.37
past alcohol drinker -1.22 0.34 -3.70 1.26
Hypertension (ref:normal) High normal 5.70 0.00 3.12 8.28 Pre-hypertension 6.61 0.00 3.23 9.99
Hypertension 11.71 0.00 9.03 14.39
total fat (g) total fat (g) 0.13 0.00 0.08 0.17
Source: Author’s calculation of NNS 2008.

36
C. Hypertension
Hypertension plays a major role in the development of cardio-vascular diseases. Stable blood pressure has
been associated with about 40 percent reduction of stroke and 15 percent reduction on myocardial infarction.
In addition, hypertension often co-exist with other risk factors like diabetes, hypercholesterolemia, smoking,
obesity and tobacco use which exacerbates the risk of cardio-vascular diseases (World Health Organization
and International Society of Hypertension Writing Group, 2003).
In the Philippines, 29 percent of males in the country are considered hypertensive while 22 percent among
females. Table 15 shows that the prevalence of hypertension is higher among older age group. The prevalence
of hypertension among population aged 50 years old and above would range from 40-56 percent. The
prevalence of hypertension among males in the younger age group (20-29 years old) is much higher than
females (17 percent vs. 4.6 percent).
Table 21. Prevalence of hypertension by single visit BP among adults 20 years and above, by age Philippines, 2008. Variable Category Total Male Female
% 95 CI LL % 95 CI LL % 95 CI LL
Philippines 25.3 24.2-26.6 29.1 27.4-31.0 22.2 20.9-23.6
Age 20-29 10.4 8.8-11.7 17.0 14.2-19.4 4.7 3.3-6.0 30-39 17.5 15.5-19.7 21.5 18.7-25.1 14.2 11.5-16.5
40-49 31.0 28.6-33.8 35.8 32.2-39.5 26.5 23.8-30.2 50-59 45.0 41.6-47.9 48.9 43.9-53.2 41.8 37.7-46.0 60-60 48.9 45.1-52.9 43.9 38.6-50.1 53.0 47.7-57.8 70-up 53.5 48.3-58.0 50.0 42.1-57.3 55.8 49.4-61.5
Source: Author’s calculation of NNS 2008.
Disaggregation of the prevalence of hypertension by socio-economic status shows that the prevalence of
hypertension has no discernable pattern on socio-economic status. This is ascertained by educational
attainment wherein no pattern of decrease nor increase in hypertension in relation to educational attainment
(Table 22).

37
Table 22. Prevalence of hypertension by single visit BP among adults 20 years and above by socio-economic status, urbanization and educational attainment, Philippines, 2008. Characteristics Category Total Male Female
% 95% CI % 95% CI % 95% CI
Lower Upper Lower Upper Lower Upper
Total 25.3 24.2 26.6 29.1 27.4 31.0 22.2 20.9 23.6
SES Poorest 24.4 21.9 27.0 25.1 21.7 28.5 23.7 20.3 27.1
Poor 23.8 21.4 26.1 25.1 21.9 28.4 22.5 19.3 25.6
Middle 25.1 22.9 27.3 29.0 25.6 32.5 21.6 18.7 24.5
Rich 27.6 25.0 30.2 34.7 30.4 38.9 22.5 19.6 25.4
Richest 25.9 23.2 28.5 32.6 28.1 37.1 21.0 18.0 24.0
Urbanization Urban 24.3 22.8 25.9 29.4 26.8 31.9 20.4 18.7 22.2
Rural 26.6 24.9 28.3 29.0 26.7 31.4 24.4 22.4 26.4
Educational no education 26.2 19.8 32.5 30.3 21.1 39.6 21.7 14.2 29.1
Attainment Elementary 31.8 29.8 33.9 31.0 28.1 33.8 32.6 29.8 35.4
Secondary 22.3 20.6 24.0 26.5 23.7 29.3 18.4 16.4 20.5
Tertiary 23.1 21.1 25.2 31.7 28.3 35.1 17.0 14.7 19.3
Source: Author’s calculation of NNS 2008.
Looking at the status in highly urbanized areas like NCR, a similar pattern can also be observed. The level of
hypertension is not skewed towards specific group of socio-economic class.
Table 23. Prevalence of hypertension by single visit BP among adults 20 years and above by urban and rural poor, Philippines, 2008. Hypertension Total Total Total
% 95% CI % 95% CI %
95% CI Lower Upper Lower Upper Lower Upper
Rural poor 24.9 22.7 27.1 25.3 22.4 28.2 24.5 21.6 27.4 Urban poor 22.4 19.7 25.1 24.8 20.8 28.8 20.2 16.6 23.9
Source: Author’s calculation of NNS 2008.
Table 24 shows the result of stepwise logistic regression. Among the following socio-demographic
characteristics: sex, educational attainment and socio-economic status, only age and sex are significant
predictors. Assuming all variables are held constant, the odds of having hypertension are lower among
females. With regard to age, the odds of having hypertension are higher among older age compared to 20-29
age groups. Table 24 depicts in detail other significant variables and the direction of their coefficients.

38
Table 24. Regression results of hypertension and different predictors. Variable Category coefficient p value Lower limit Upper limit
Total cholesterol (g) Total cholesterol 0.01 0.00 0.00 0.01
BMI 0.08 0.00 0.06 0.10
Age group (ref 20-29) 30-39 0.33 0.01 0.08 0.57
40-49 1.04 0.00 0.81 1.27
50-59 1.56 0.00 1.32 1.80
60-69 1.98 0.00 1.71 2.24
70-up 2.27 0.00 1.96 2.58
Sex (ref: males) -0.47 0.00 -0.63 -0.30
Sugar level (ref: below 110mg/dl) FBS (110-125 mg/dl) 0.63 0.00 0.26 0.99
FBS (more than 125 mg/dl) 0.24 0.09 -0.04 0.52
Region (ref: Region 1) Cagayan Valley -0.19 0.34 -0.59 0.20
Central Luzon -0.46 0.02 -0.83 -0.09
Bicol Region 0.34 0.08 -0.04 0.72
Western Visayas -0.18 0.35 -0.55 0.20
Central Visayas 0.38 0.04 0.03 0.73
Eastern Visayas -0.22 0.25 -0.60 0.16
Zamboanga Peninsula 0.15 0.47 -0.26 0.56
Northern Mindanao 0.07 0.72 -0.33 0.47
Davao Region 0.13 0.49 -0.25 0.52
SOCCSKSARGEN -0.18 0.38 -0.58 0.22
NCR -0.25 0.15 -0.59 0.09
CAR 0.42 0.04 0.01 0.82
ARMM -0.32 0.24 -0.86 0.22
CARAGA 0.27 0.18 -0.12 0.67
CALABARZON -0.27 0.14 -0.63 0.09
MIMAROPA -0.06 0.79 -0.49 0.37
Alcohol(ref: never) current alcohol drinker 0.32 0.00 0.11 0.53
past alcohol drinker -0.12 0.19 -0.29 0.06
Smoking (ref: never) Past smoker -0.24 0.01 -0.42 -0.06
Current smoker -0.05 0.62 -0.25 0.15
Total fat (g) total fat (g) -0.01 0.00 -0.01 0.00
Total meat (g) total meat (g) 0.00 0.00 0.00 0.00
History of high blood History of high blood 0.37 0.00 0.24 0.51
Source: Author’s calculation of NNS 2008.

39
Exposures
Following the framework mentioned in the earlier section, exposures are the predecessors of vulnerabilities.
In this study, exposure includes the following: unhealthy diet, smoking, alcohol consumption and exposure to
advertisement. Barriers to physical and financial components of health care are also discussed under this
section.
A. Unhealthy diet
Dietary and nutrition are important factors in the promotion of good health. Its pertinent role in the
occurrence of non-communicable diseases is well established. As modifiable risk factors, these therefore
occupy prominent position in the prevention and control of non-communicable diseases (WHO; 2011).
Accompanied by economic development, the quality and quantity of food consumption have changed
drastically in emerging economies like the Philippines. Studies have shown that there was a noticeable shift
towards high fat, refined carbohydrates and low fiber diet. In current nutrition studies, one of the ways to
measure dietary transitions is to observe per capita food consumption expressed in kcal over time. In
developing and transition economies, the average per capita food consumption is expected to increase in a
faster rate compared to developed and industrialized countries (Uusitalo, Pietinen, & Puska, 2002;
Organization, 2003).
In the Philippines, the average consumption which is 1835 kcal per day is way below the average food
consumption per capita of the world. Table 25 shows that there is slight variation in the food consumption
across quintiles. The average daily consumption in terms of kcal among the poorest is slightly lower than the
first and second quintiles. Looking at the food quantity, the lower quintiles would tend to have higher
consumption of carbohydrates but lower in proteins. In terms of fat consumption, the higher quintile has
higher average consumption compared to their poorer counterparts.
Table 25. Average daily food consumption per capita per day, by socio-economic status, Philippines, 2008. Quintile Food consumption (kcal) Protein (grams) Carbohydrates (grams) Fat (grams)
Poorest 1689.1 50.7 326.8 17.8
Poor 1797.1 56.7 335.7 23.9
Middle 1882.8 59.3 341.8 29.3
Rich 1834.1 61.5 317.1 33.9
Richest 1940.3 66.7 317.2 43.7
Source: Author’s calculation of NNS 2008.

40
1. Saturated o i l
Saturated oil is usually found in animal fat and some plant oils. Though there are inconsistencies among
epidemiologic studies that links high consumption of saturated fat increases risk of CVDs, saturated oil is still
considered as an important risk factor of major non-communicable diseases. The World Health Organization
included saturated oil along with trans-fats as one of unhealthy diet that needs to be controlled (Aschero,
1996; World Health Organization, 2011; Siri-Tarino, Sun, & R., 2010).
Table 26 shows the daily consumption of saturated oil by age group and sex. It can be observed that the
intake of saturated oil is very high among younger age group. The average consumption of population aged
20-29 years old is almost half compared to the oldest age group (70-up).
Table 26. Mean intake of oil in grams per day among adults 20 years and above, Philippines, 2008. Characteristics Category Total Male Female
Mean 95% CI Mean 95 % CI Mean 95% CI
Philippines 9.4 8.9-9.9 10.0 9.3-10.7 8.8 8.3-9.4
Age 20-29 11.2 10.0-12.3 11.4 9.8-13.0 11.0 9.6-12.4
30-39 9.8 8.9-10.6 10.5 9.4-11.6 9.1 8.2-10.0
40-49 9.6 8.7-10.5 9.9 8.7-11.2 9.3 8.2-10.3
50-59 8.9 8.0-9.9 9.6 8.3-10.9 8.4 7.4-9.4
60-69 7.2 6.2-8.2 8.5 6.9-10.1 6.2 5.3-7.1
70-up 6.2 4.9-7.5 6.3 4.4-8.2 6.1 4.8-7.5 Source: Author’s calculation of NNS 2008.
The average consumption of saturated oil is relatively higher among population with higher level of education
and socio-economic status. Higher intake of saturated oil was also found among urban population compared
to their counterparts living in rural areas. However, the urban poor population also consumes high levels of
saturated. Their average daily consumption of oil among the urban poor is higher than the national average
(tables 27 and 28).

41
Table 27. Mean intake of oil among adults 20 years and above, by socio-economic status, urbanization and educational attainment, Philippines, 2008. Characteristics Category Total Male Female
Mean 95% CI Mean 95% CI Mean 95% CI
Lower Upper Lower Upper Lower Upper
Total 9.4 8.9 9.9 10.0 9.3 10.7 8.8 8.3 9.4
SES Poorest 8.1 6.9 9.3 8.8 7.4 10.3 7.2 6.0 8.4 Poor 9.0 7.4 10.5 9.8 7.8 11.9 8.1 6.7 9.5
Middle 8.9 7.9 9.9 9.7 8.3 11.0 8.1 7.1 9.1 Rich 8.9 8.0 9.8 9.2 8.2 10.3 8.6 7.5 9.7
Richest 11.7 10.7 12.7 12.5 11.2 13.8 11.2 10.1 12.3
Urbanization urban 10.0 9.3 10.7 10.6 9.7 11.6 9.5 8.7 10.3 rural 8.7 8.0 9.4 9.4 8.4 10.3 8.0 7.3 8.8
Educational no education 7.2 5.2 9.2 7.4 4.8 10.1 6.9 4.1 9.7
Attainment elementary 8.0 7.2 8.8 9.3 8.2 10.5 6.9 6.2 7.6 secondary 9.4 8.7 10.0 9.9 9.0 10.9 8.7 8.0 9.5
tertiary 11.4 10.5 12.4 11.4 10.3 12.5 11.5 10.3 12.7
Source: Author’s calculation of NNS 2008.
Table 28. Mean intake of oil among adults 20 years and above, by socio-economic status, urbanization and educational attainment, Philippines, 2008.
Oil
All Males Females
Ave. 95% CI
Ave. 95% CI
Ave. 95% CI
Lower Upper Lower Upper Lower Upper Rural poor 8.5 7.4 9.6 9.4 8 10.8 7.6 6.5 8.7 Urban poor 8.6 6.5 10.7 9.3 6.6 12 7.9 6.1 9.7 Source: Author’s calculation of NNS 2008.
2 . Fast food
It is becoming more common to eat meals away from home or to eat pre-cooked food in restaurants. In the
Philippines, foodservice sales are currently valued at approximately US$3 billion, increasing by an estimated
15%-20% per year in the past decade (Food Export). The growing market for fast food chain can also be
ascertained by consumer study showing that the Philippines ranked third as the heaviest consumers of fast
food in the world. Majority of heaviest consumers are in developed and emerging markets in Asia (AC
Nielsen, 2004).

42
Figure 19. Percentage of population that eats at take away restaurants at least once a week, by selected countries, 2004.
Source: AC Nielsen Consumer Survey Report 2004.
In many studies, increase prevalence of vulnerabilities like obesity has been linked by many investigators to
increase frequency of outside home eating. Food prepared outside the home is generally high in refined
carbohydrates and saturated fat. In a study by Haddad (2003) in selected countries, saturated fat content of
food consumed at home has dropped significantly, whereas the fat content in fast foods and street food
remains high. Moreover, outside eating as a frequent practice is highly dangerous because of its high
association with sedentary lifestyle and other forms of unhealthy habits. This form of dietary transition can be
explained by the different factors like rapid urbanization, economic growth and employment. Ultimately, the
growing participation of women in the labor force had also driven many families to utilize fast and
convenient way of eating (Haddad, 2003; Uusitalo, Pietinen, & Puska, 2002; Orfanos, 2007).
Using expenditure as an indicator, the share of “food outside the home expenditure” to total expenditure is
drastically increasing while expenditure on food prepared at home is decreasing (Figure 20).

43
Figure 20 . Expenditure of food consumed at home vs. outside home, Philippines, 1994-2006.
Source: Family Income and Expenditure Survey
Eating outside home may be a common practice among the affluent population. If we base on food
expenditure, the richer population spends higher share of food outside home on their total food expenditure
compared to their poorer counterparts (Figure 19). However, this may not be reflective enough since it is
always best to couple this analysis with quantity of consumption. If we try to synergistically analyze urbanity
and wealth index, figure 21 shows that urban poor7 spends 8 percent of their total food expenditure on food
outside home compared to 5 percent of their poor counterparts.
7 Households are classified as urban poor if they belong to first two wealth quintiles and if they live in urban areas based on NSO classification.
47.8
44.243.6
42.6
41.4
4.24.7
55.3
5.8
0
1
2
3
4
5
6
7
38
40
42
44
46
48
50
1994 1997 2000 2003 2006
Percen
tage sh
are on
total expen
diture
Percen
tage sh
are on
total expen
diture
Food consumed at home Food consumed outside the home (fast food)

44
Figure 21. Share of food eaten outside home expenditure on total food expenditure, Philippines, 2009.
Source: Family Income and Expenditure Survey
Figure 22. Share of food outside home expenditure on total food expenditure, by rural and urban poor, Philippines, 2009.
Sour
ce: Family Income and Expenditure Survey

45
It is hypothesized that population in predominantly urban regions is more prone to outside home eating.
Food purchases outside the home tend to be more processed. Fast food restaurants tend to attract consumers
from the richer segment. Among the urban poor dwellers, street foods are significant source of food, both in
terms of energy intake and food expenditure (Uusitalo et al, 2002).
In National Capital Region (Metro Manila), the share of food outside the home on total food expenditure is
100 percent higher than the national average (10 percent vs. 21 percent). The share of food outside the home
expenditure has a positive relationship with the income deciles. Affluent households tend to have higher
share compared to households that belong to lower deciles8. However, it is important to note that even the
lower decile groups which can be assumed as the urban poor, have high level of expenditures compared to
the national estimates (16 percent for the lowest decile).
Figure 23. Share of food outside home expenditure on total food expenditure, by income decile, NCR, Philippines, 2009.
. Source: Family Income and Expenditure Survey
8 Income deciles were calculated based on the income of NCR households and the researchers did not include households of other regions in the ranking

46
3 . Unhea l thy food adver t i s ing
Many factors contribute to the risk of developing physical vulnerabilities associated with NCDs. One of these
is the way how unhealthy food is marketed or endorsed. A handful of studies have demonstrated the adverse
effects of advertising on the consumption and perception on unhealthy food items (International, The Junk
Food Generation: A multi-country survey of the influence of television advertisements on childre, 2004).
Manufacturers of unhealthy food items, mostly multinational companies, can easily promote their products in
low and middle income countries. This can be attributed to lesser knowledge of advertising and the lingering
perception of western food brands as part of superior and modern lifestyle. Moreover, in a country where
there are lax policies in controlling food advertising and marketing, manufacturer of unhealthy food items
have started to capitalize on this loophole by promoting their products especially to younger age groups.
Most manufacturers of unhealthy food have used variety of promotional activities from event sponsorships,
celebrity endorsements; freebies in fast foods (e.g. kid meals in McDonalds and Jollibee), movie or show tie-
ins and television and radio advertising (Consumer International, 2008).
In most developing countries like the Philippines, marketing and endorsement of unhealthy diet are not
properly regulated. The inability of a governing body to regulate messages and themes can mislead especially
the younger population groups. In a study conducted by Nielsen, one third of an hour of children television
show in the country is allotted to advertising. It is noteworthy that Jollibee, Nestle, San Miguel and Monde
Nissin Biscuits are the biggest sponsors of food advertising in the country (AC Nielsen 2004).
Figure 24. Advertising time per hour of children’s program by selected countries, 2004.

47
Source: AC Nielsen 2004.
4. Fiber and meat consumpt ion
Dietary fiber, comprising non-digestible carbohydrate naturally occurring in plants, has been associated with
reduced incidence of several non-communicable diseases like cardio-vascular diseases and certain cancers.
Potential benefits include effect on serum cholesterol levels, postprandial glucose, insulin sensitivity and
blood pressure (Ness & Powles, 1997).
Dietary transition is common in developing countries. In the Philippines, there is a noticeable decrease on the
expenditure share of healthy and pre-cooked staple food like root crops and cereals and decreasing share of
pre-cooked and processed foods (Uusitalo, Pietinen, & Puska, 2002; Haddad, 2003).
Figure 25. Share of selected food expenditure on total expenditure, Philippines, 1994-2006.

48
Source: Family Income and Expenditure Survey
There is a wide variation of meat and fiber consumption across socio-economic status and age groups. The
youngest age group (20-29 years old) consumes more meat than vegetables. The consumption of meat
decreases as age increases while vegetable consumption is relatively lower in the extreme age groups. With
regard to fruit and root crops, there is no noticeable pattern across age group.
Figure 26. Mean intake in grams, by major food classification and age, Philippines, 2008.

49
Source: Author’s calculation of NNS data, 2008.
Looking at the average consumption of staple food by socio-economic status, meat and fruit consumption
increases as socio-economic status increases. In contrast, the consumption of vegetables decreases as socio-
economic status increases. There is no noticeable pattern of root crop consumption across socio-economic
status but it is still relatively low compared to other items.
Figure 27. Mean intake in grams, by major food classification and socio-economic status, Philippines, 2008.
Source: Author’s calculation of NNS data, 2008.
Figure 28. Mean intake in grams per day, by major food classification and rural and urban poor, Philippines, 2008.

50
5. Sugar
The association between diet that is high in saturated fats and sugar with obesity and other NCDs has led to
the identification of extremely fatty, sweet and salty western-style food as risk factor. Concern has been
focused particularly on carbonated drinks.
Though the country’s soft drinks industry is facing bottlenecks because of noticeable shift from carbonated
drinks to other ready-to-drink quenchers and healthier fluid alternatives, it is still anticipated to grow
modestly. The total size of soft drinks market in the country was estimated at 8,580 million liters in 2007,
with an anticipated growth of almost 8 percent in 2008 (Macabasco, 2008).
The average daily consumption of soft drink per capita is 21 grams. The consumption of soft drink increases
as age increases. The high consumption of unhealthy items like soft drinks among the younger generation
reflects their consumption practices towards other unhealthy food. The unhealthy practices of the younger
generations may not be reflected in the short term but this has implications in later adult life.
Table 29. Mean intake of soft drinks in grams per day among adults 20 years and above, Philippines, 2008. Characteristics Category Total Male Female

51
Mean CI Mean CI Mean CI
Philippines 50.3 46.4-54.2 53.4 48.2-58.6 47.4 42.9-51.9
Age 20-29 74.0 64.5-83.5 74.7 63.7-85.7 73.3 60.2-86.4
30-39 57.6 50.4-64.8 61.1 49.5-72.7 54.2 46.2-62.1
40-49 52.0 45.3-58.7 58.1 48.3-67.9 46.2 37.5-54.9
50-59 39.5 32.6-46.3 37.7 27.7-47.7 40.9 32.8-48.9
60-60 23.4 16.4-30.4 23.1 13.0-33.3 23.6 16.0-31.2
70-up 14.7 9.8-19.6 10.9 3.6-18.3 17.1 11.2-22.9
Source: Author’s calculation of NNS data, 2008.
High consumption of carbonated soft drinks is also noted in higher quintile groups. However, the soft drinks
industry is moving towards the poorer segments of the population as they introduced affordable soft drinks
which even the poorest of the poor can buy.
Table 30. Mean intake of soft drinks in grams per day among adults, 20 years and above by socio-economic status, urbanization and educational attainment, Philippines, 2008. Characteristics Category Total Male Female
Mean 95% C.I Mean 95% CI Mean 95% CI Lower Upper Lower Upper Lower Upper
Total 50.3 46.4 54.2 53.4 48.2 58.6 47.4 42.9 51.9
SES Poorest 19.2 14.3 24.0 21.1 14.6 27.6 16.9 11.5 22.4 Poor 33.5 27.7 39.3 36.6 28.7 44.4 30.4 23.5 37.3 Middle 44.1 36.7 51.4 53.9 43.0 64.7 34.4 26.4 42.3 Rich 59.4 51.7 67.0 68.5 55.6 81.4 52.5 44.7 60.3 Richest 86.5 75.0 98.1 87.4 71.9 102.9 85.9 72.2 99.6 Urbanization Urban 60.3 54.9 65.6 65.7 57.9 73.5 55.8 49.5 62.2 Rural 39.0 33.4 44.7 41.0 33.9 48.0 37.1 30.9 43.3 Educational no education 12.5 2.5 22.6 14.9 -2.5 32.2 10.1 0.7 19.5 Attainment elementary 25.1 21.1 29.1 27.4 21.3 33.4 23.2 19.0 27.3 Secondary 53.0 47.5 58.5 60.9 52.9 68.9 44.6 38.2 50.9 Tertiary 81.8 73.1 90.6 79.5 68.7 90.3 83.6 72.2 95.1
Source: Author’s calculation of NNS data, 2008.
6 . Sal t consumpt ion
High salt consumption has been linked to other vulnerabilities which are known to be risk factors of cardio-
vascular diseases.
Using the National Nutrition Survey (NNS) data, the poorest quintiles would tend to consume excessive
amount of salt compared to other quintile groups. However, given the limitations of the data set, there is no
exact way on how to estimate the amount of salt being consumed in prepared food. It is known that food like
junk foods have high level of salt content. In addition, certain regions use excessive amount of salty

52
condiments which are high in salt (e.g. fish sauce). This caveat would be impossible for researchers to
estimate the exact among of salt consumed.
High consumption of salt was observed among population 70 years old and above. With regard to socio-
economic status, the average daily consumption of salt is relatively high among poorest quintile. This was also
ascertained in the educational attainment. The population with no education has the highest level of salt
consumption. This can be attributed to the lack of refrigeration among the poor which force them to use
large amounts of salt to preserve their food longer.
Table 31. Mean salt intake in grams per day among adults 20 years and above, by age, Philippines, 2008. Characteristics Category Total Male Female
Mean CI Mean CI Mean CI Philippines 3.3 2.4-4.1 3.6 2.3-4.8 3.0 2.2-3.8 Age 20-29 1.1 0.5-1.8 0.8 0.3-1.4 1.4 0.2-2.6 30-39 4.0 1.9-6.0 4.3 1.1-7.5 3.7 1.3-6.0 40-49 2.8 1.5-4.1 3.8 1.5-6.1 1.8 0.8-2.9 50-59 4.3 1.9-6.7 4.7 1.0-8.3 4.0 1.5-6.5 60-60 2.2 0.6-3.7 3.0 -0.1-6.1 1.5 0.2-2.9 70-up 8.6 3.5-13.6 8.8 2.0-15.5 8.4 1.7-15.2
Source: Author’s calculation of NNS data, 2008.
Table 32. Mean salt intake in grams per day among adults, 20 years and above by socio-economic status, urbanization and educational attainment, Philippines, 2008. Characteristics Category Total Male Female
Mean 95% CI Mean 95% CI Mean 95% CI Lower Upper Lower Upper Lower Upper
Total 3.3 2.4 4.1 3.6 2.3 4.8 3.0 2.2 3.8 SES Poorest 12.6 8.1 17.0 14.8 8.5 21.1 9.9 6.6 13.3 Poor 1.4 0.9 2.0 1.4 0.6 2.1 1.5 0.6 2.3 Middle 1.1 0.3 2.0 0.8 -0.1 1.8 1.5 0.3 2.7 Rich 1.6 0.5 2.6 0.8 0.0 1.5 2.1 0.6 3.7 Richest 1.3 0.2 2.5 0.5 -0.1 1.1 1.9 0.1 3.8 Urbanization Urban 1.0 0.5 1.6 0.6 0.2 1.0 1.4 0.5 2.3 Rural 5.8 4.1 7.5 6.6 4.1 9.0 5.0 3.5 6.4 Educational no education 10.3 3.6 17.1 12.0 1.1 22.9 8.6 0.8 16.4 Attainment Elementary 6.2 4.3 8.2 7.7 4.5 10.9 5.0 3.5 6.5 Secondary 1.6 0.9 2.3 1.2 0.5 2.0 1.9 0.7 3.1 Tertiary 1.1 0.3 2.0 0.8 0.1 1.4 1.4 0.1 2.8
Source: Author’s calculation of NNS data, 2008.
B. Smoking

53
Many epidemiologic studies demonstrated the devastating effects of smoking on health. On NCDs, tobacco
use is considered as one of the commonly shared risk factors of major NCDs like cardio-vascular disease,
certain cancers and diabetes mellitus. Smoking is also linked with chronic obstructive pulmonary disease and
injuries. Thus, mitigating smoking can significantly reduce various forms of illness. The detrimental effect of
smoking is not solely found in smokers. Many studies have also implicated the dangers of second hand
smoking on health.
In the Philippines, almost 30.9 percent of the adult population is current smokers and 14 percent used
tobacco in the past. Majority of adult male population are current smokers (53 percent). Interestingly, the
prevalence of smoking in different age groups is relatively the same.
Table 33. Prevalence of current smokers among adults 20 years and above, by age, Philippines, 2008. Variables Category Total Male Female
% 95 CI LL % 95 CI LL % 95 CI LL
Philippines 31.0 29.7-32.0 53.2 51.1-54.8 12.5 11.3-13.6
Age 20-29 31.1 28.7-33.6 57.7 53.8-61.4 8.6 6.6-10.8
30-39 30.2 27.8-32.2 53.2 49.4-57.2 10.8 8.3-12.7
40-49 33.0 30.4-35.2 55.5 51.5-58.9 12.1 9.4-14.6
50-59 32.6 29.4-35.2 54.6 48.9-58.4 15.3 12.7-18.8
60-60 28.2 24.1-31.8 45.0 39.0-51.3 14.8 10.8-17.9
70-up 27.1 22.8-31.4 32.9 26.0-40.2 23.2 17.8-28.2
Source: Author’s calculation of NNS data, 2008.
With regard to socio-economic status, there is an inverse relationship between socio-economic status and the
prevalence of tobacco use. Same pattern was also observed on educational attainment.
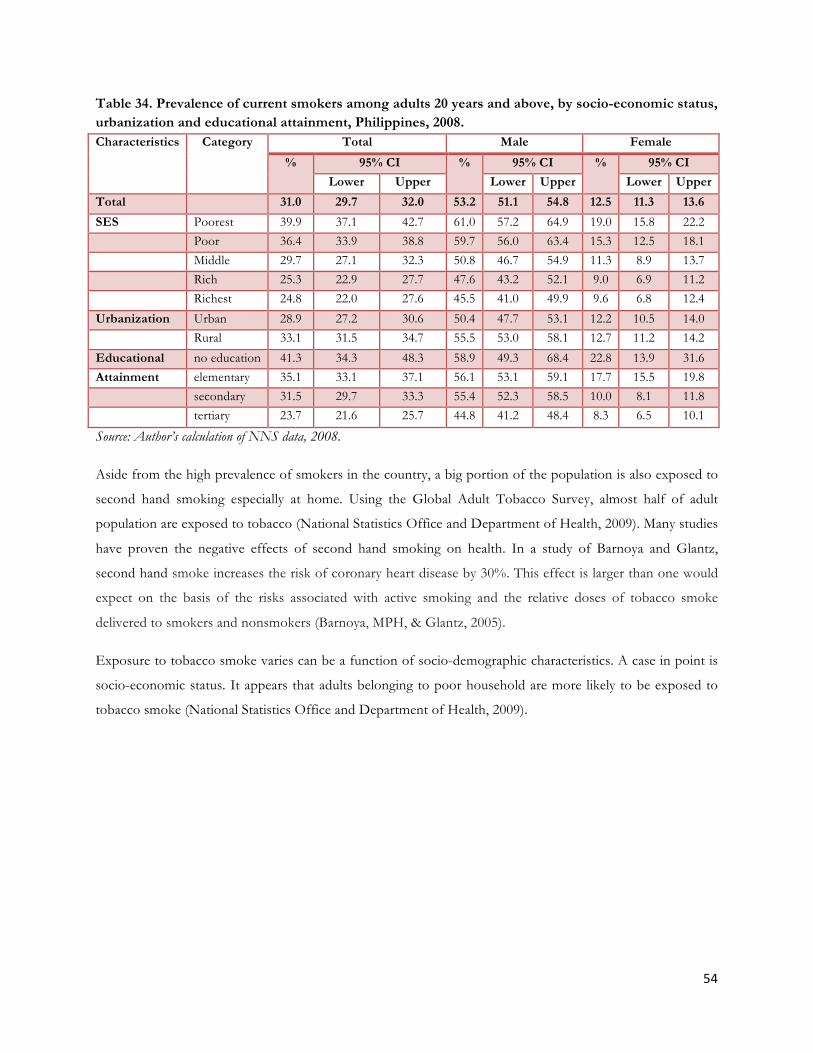
54
Table 34. Prevalence of current smokers among adults 20 years and above, by socio-economic status, urbanization and educational attainment, Philippines, 2008. Characteristics Category Total Male Female
% 95% CI % 95% CI % 95% CI
Lower Upper Lower Upper Lower Upper
Total 31.0 29.7 32.0 53.2 51.1 54.8 12.5 11.3 13.6
SES Poorest 39.9 37.1 42.7 61.0 57.2 64.9 19.0 15.8 22.2 Poor 36.4 33.9 38.8 59.7 56.0 63.4 15.3 12.5 18.1 Middle 29.7 27.1 32.3 50.8 46.7 54.9 11.3 8.9 13.7 Rich 25.3 22.9 27.7 47.6 43.2 52.1 9.0 6.9 11.2 Richest 24.8 22.0 27.6 45.5 41.0 49.9 9.6 6.8 12.4
Urbanization Urban 28.9 27.2 30.6 50.4 47.7 53.1 12.2 10.5 14.0 Rural 33.1 31.5 34.7 55.5 53.0 58.1 12.7 11.2 14.2
Educational no education 41.3 34.3 48.3 58.9 49.3 68.4 22.8 13.9 31.6 Attainment elementary 35.1 33.1 37.1 56.1 53.1 59.1 17.7 15.5 19.8 secondary 31.5 29.7 33.3 55.4 52.3 58.5 10.0 8.1 11.8 tertiary 23.7 21.6 25.7 44.8 41.2 48.4 8.3 6.5 10.1
Source: Author’s calculation of NNS data, 2008.
Aside from the high prevalence of smokers in the country, a big portion of the population is also exposed to
second hand smoking especially at home. Using the Global Adult Tobacco Survey, almost half of adult
population are exposed to tobacco (National Statistics Office and Department of Health, 2009). Many studies
have proven the negative effects of second hand smoking on health. In a study of Barnoya and Glantz,
second hand smoke increases the risk of coronary heart disease by 30%. This effect is larger than one would
expect on the basis of the risks associated with active smoking and the relative doses of tobacco smoke
delivered to smokers and nonsmokers (Barnoya, MPH, & Glantz, 2005).
Exposure to tobacco smoke varies can be a function of socio-demographic characteristics. A case in point is
socio-economic status. It appears that adults belonging to poor household are more likely to be exposed to
tobacco smoke (National Statistics Office and Department of Health, 2009).

55
Table 35. Prevalence of adults 15 years and older who are exposed to tobacco smoke at home, by sex, age, socio-economic status, Philippines, 2009. Variable Category Smoking is allowed
at home Smokes inside the home at
least once daily Smokes inside the home at
least once monthly % 95% CI % 95% CI % 95% CI
Overall 48.8 46.5 -‐ 51.1 39.6 37.9 -‐ 41.2 54.4 52.5 -‐ 56.3
Gender Male 50.9 48.3 -‐ 53.5 43.1 41.0 -‐ 45.2 58.1 55.9 -‐ 60.4
Female 46.7 44.2 -‐ 49.2 36 34.0 -‐ 38.0 50.6 48.4 -‐ 52.8
Age 15-24 47.9 44.6 -‐ 51.2 38.3 35.6 -‐ 41.0 53.1 50.1 -‐ 56.2)
25-‐44 48.7 46.0 -‐ 51.4) 40.5 38.3 -‐ 42.6 55.2 52.9 -‐ 57.5
45-‐64 50 46.6 -‐ 53.4 40 37.1 -‐ 43.0 54.3 51.2 -‐ 57.4
65+ 49.4 44.2 -‐ 54.7 37.8 33.1 -‐ 42.5 54.9 50.2 -‐ 59.5
SES Poorest 64.3 59.6 -‐ 69.0 53.6 50.0 -‐ 57.3 74.8 71.7 -‐ 77.8
Richest 44.1 37.9 -‐ 50.2 30.4 25.0 -‐ 35.7 48.7 42.3 -‐ 55.1
Source: Global Adult Tobacco Survey, 2009
C. Alcohol consumption
Alcohol is causally linked (to varying degrees) to eight different cancers. Similarly, alcohol use is associated
detrimentally with many cardiovascular outcomes, including hypertension, stroke and atrial fibrillation and
other cardiovascular outcomes. Alcohol is furthermore linked to various forms of liver disease (particularly
with fatty liver, alcoholic hepatitis and cirrhosis) and pancreatitis (Parry, Patra, & Rehm, 2011).
In the Philippines, the prevalence of hazardous drinkers is relatively high in the young and mid-age adults.
The prevalence decreases as age approaches 70 years old. The prevalence of hazardous drinkers is relatively
higher compared to females.
Table 36. Prevalence of current alcohol drinkers among adults 20 years and above, Philippines, 2008. Variables Category Total Male Female
% 95 CI LL % 95 CI LL % 95 CI LL Philippines 26.9 25.7-28.1 47.5 45.5-49.5 9.8 8.8-10.8 Age 20-29 26.5 24.3-28.7 47.2 43.4-51.0 9.0 7.2-10.8 30-39 30.3 27.9-32.7 54.2 50.2-58.2 10.4 8.2-12.6 40-49 30.7 28.3-33.1 52.8 48.6-57.0 10.2 7.8-12.6 50-59 27.0 24.0-30.0 47.6 42.8-52.4 10.8 8.2-13.4 60-60 19.8 16.8-22.8 32.8 27.6-38.0 9.5 6.7-12.3 70-up 14.0 10.6-17.4 23.3 17.1-29.5 7.8 4.4-11.2
Source: Author’s calculation of NNS data, 2008.
With regard to socio-economic and educational status, there is no discernable trend on the prevalence of
hazardous drinkers. The prevalence is relatively the same across socio-economic groups.

56
Table 37. Prevalence of current alcohol drinking among adults 20 years and above, by socio-economic status, urbanization and educational attainment, Philippines, 2008. Characteristics Category Total Male Female
% 95% CI % 95% CI % 95% CI Lower Upper Lower Upper Lower Upper
Total 26.9 25.7 28.1 47.8 45.5 49.5 9.5 8.8 10.8 SES Poorest 28.8 26.1 31.5 46.6 42.5 50.8 11.2 8.8 13.6 Poor 26.6 24.0 29.2 48.3 44.0 52.5 7.1 5.1 9.0 Middle 28.9 26.5 31.3 49.8 45.9 53.7 10.6 8.3 12.9 Rich 26.0 23.4 28.7 47.2 42.7 51.6 10.6 8.3 12.9 Richest 24.6 22.1 27.1 46.8 42.2 51.3 8.4 6.3 10.5 Urbanization urban 25.8 24.1 27.4 47.1 44.2 50.0 9.3 7.9 10.7 rural 28.2 26.4 29.9 48.4 45.8 51.0 9.8 8.3 11.3 Educational no education 17.5 12.0 23.1 29.7 20.8 38.7 4.7 0.7 8.8 Attainment elementary 27.1 25.1 29.1 46.4 43.3 49.5 11.1 9.3 12.9 secondary 28.6 26.8 30.4 50.0 47.1 52.8 9.2 7.6 10.8 tertiary 25.1 23.0 27.3 48.1 44.5 51.8 8.3 6.5 10.1
Source: Author’s calculation of NNS data, 2008.
D. Physical inactivity
Physical inactivity is one of the most important risk factors of certain NCDs like cardio-vascular diseases.
Technology and economic incentives tend to discourage physical activity. Technology allows people to
perform daily function with reduced energy expenditure and economics, by paying more for sedentary jobs
compared to active work (Haskell, 2007).
Table 38. Prevalence of work or occupation related physical activity among adults 20 years and above, Philippines, 2008. Variables Category Total Male Female
% 95 CI LL % 95 CI LL % 95 CI LL
Philippines 23.7 22.0-25.4 23.8 21.8-25.8 23.6 20.9-26.2
Age 20-29 20.4 17.2-23.7 20.3 16.3-24.3 20.6 15.1-26.2
30-39 26.5 23.2-29.9 27.4 23.4-31.4 24.8 19.2-30.3
40-49 23.2 20.1-26.3 22.7 18.9-26.4 24.1 18.9-29.3
50-59 26.1 22.2-30.1 26.0 20.9-31.1 26.3 20.2-32.3
60-60 22.6 16.6-28.5 22.1 15.0-29.1 23.4 14.0-32.8
70-up 17.5 9.5-25.6 19.9 10.0-29.9 13.6 2.3-24.9
Source: Author’s calculation of NNS data, 2008.
The nature of physical activity can either be in the form of occupational or leisure. In the Philippines, the
proportion of adequate physical activity due to occupation is higher among poorer segment. In contrast, the

57
prevalence of adequate physical activity due to leisure is higher in richer population. Same pattern can be
observed if educational attainment is used as welfare indicator. There is also wide variation between urban
and rural. Higher prevalence of adequate physical activity due to occupation was found among population
living in rural areas.
Table 39. Prevalence of work or occupation related physical activity among adults 20 years and above, by socio-economic status, urbanization and educational attainment, Philippines, 2008. Characteristics Category Total Male Female
% 95% CI % 95% CI % 95% CI
Lower Upper Lower Upper Lower Upper
Total 23.7 22.0 25.4 23.8 21.8 25.8 23.6 20.9 26.2
SES Poorest 26.9 23.2 30.7 27.9 23.5 32.2 24.8 18.7 30.9
Poor 22.5 19.0 26.0 22.4 18.3 26.4 22.8 16.8 28.8
Middle 22.0 18.4 25.7 22.7 18.2 27.2 20.8 14.8 26.8
Rich 23.5 19.6 27.3 22.9 18.1 27.7 24.3 18.3 30.4
Richest 23.1 19.1 27.0 21.3 16.2 26.5 24.9 19.2 30.6
Urbanization Urban 21.8 19.4 24.3 20.7 17.7 23.7 23.6 19.6 27.5
Rural 25.1 22.8 27.4 25.8 23.1 28.6 23.6 19.9 27.2
Educational no education 30.1 19.9 40.3 30.2 18.8 41.7 29.9 11.8 48.0
Attainment elementary 25.1 22.4 27.9 25.6 22.2 28.9 24.3 19.9 28.6
secondary 23.4 20.7 26.1 23.0 19.9 26.2 24.3 19.5 29.1
Tertiary 20.9 17.7 24.0 20.5 16.3 24.6 21.3 16.6 26.0
Source: Author’s calculation of NNS data, 2008.
E. Barriers in health service delivery and health financing
Presence of bottlenecks in health service delivery and financing can ultimately derail the health status of the
population. Primary health care units such as the Rural Health Units and Barangay Health Stations should
also be responsible for the NCDs preventive programs. Institutional problems of the health system are most
felt during the curative phase of the disease. Prognosis of NCDs is longer and slower that financial and
physical requirements are needed to be addressed both at the preventive and curative phases of NCDs.
1. Health s e rv i c e de l i v e ry
Using the National Demographic Health Survey, majority of the population who visited health facility for a
NCD-related consult went to private hospitals and clinics (figure 29). In the Philippines, the service delivery is

58
highly segmented system. As ascertained by the figures 30 and 31, the poorer segment of the population
utilize more government facilities like government hospitals and primary health care centers like Rural Health
Units RHUs) and Barangay Health Stations while the affluent segment would tend to utilize private health
facilities during NCD-related consultations.
One of the interesting results is the higher outpatient visit in hospitals compared to non-hospitals (clinics,
RHUs and BHU). Though there are no studies that determine initial contact (referral systems) or the severity
of the disease (may be for cancer and end stage NCDs), there is a strong notion that patient with simple cases
would go directly to hospitals for outpatient visits and bypass clinics and level 1 hospitals. As a result,
hospitals become crowded with primary cases that hinder them to accommodate patients that need true
inpatient care (Lavado et al, 2011).
Figure 29. Distribution of facility visited during a NCD-related consult, Philippines, 2008.
Source: Author’s calculation of NDHS data.
The perceived dismal quality of public hospitals in the Philippines drives richer population to utilize private
hospitals. As noted, higher NCD was observed among the richer segment of the population. The inefficiency
of safety net schemes for the poor may have also contributed to the highly segmented market. The heavy
reliance on out-of-pocket spending even among the poor prevents them from utilizing private facilities when
they want to. A recent study shows that PhilHealth has not improved financial access of the poor (Lavado &
Ulep, 2011).

59
Figure 30. Distribution of facility visited during a NCD-related consult among the poor (Q1 and Q2) Philippines, 2008.
Source: Author’s calculation of NDHS data.
Figure 31. Distribution of facility visited during a NCD-related consult among the non-poor (Q3-Q5), Philippines, 2008.
So
urce: Author’s calculation of NDHS data
It is also interesting to examine the travel time of patients to healh faciliites during consultation. It is
hypothesized that shorter duration of travel from their house to health facility increases their chances of

60
better access and compliance. Patients with NCDs need regular visits due to constant monitoring of clinical
indicators (e.g. FBS or blood pressure). Travel time varies by urbanity and region. It can be noticed that
regions like National Capital Region, Region X and CALABARZON have shorter travel duration. This can
be attributed to the high concentration of health facilities in these regions. On the other hand, travel time in
ARMM region is more than twice that of National Capital Region.
Similar trend was also noticed as far as urbanity is concern. Urban areas would tend to have shorter travel
time from house to health facility compared to rural areas. One of the caveat of this analysis is the inclusion
of patients who cannot access as they forego care due to physcial and financial barriers.
Table 40. Travel time going to health facility during NCD consultation. Region Total Urban Rural
Ilocos Region 31.6 23.0 36.8
Cagayan 49.9 50.7 49.4
Cenral Luzon 35.2 33.4 37.7
Bicol 30.6 23.8 33.2
`Western Visayas 36.8 25.6 44.3
Central Visayas 43.3 31.1 53.8
Eastern Visayas 63.6 56.4 65.6
Zamboanga 61.5 78.7 46.8
Northern Mindanao 27.9 27.9 28.0
Davao Peninsula 47.0 35.5 53.4
SOCCSKSARGEN 31.4 22.6 35.1
CARAGA 45.6 66.5 36.2
NCR 28.0 28.0
CAR 63.3 41.8 76.1
ARMM 82.7 72.2 88.0
CALABARZON 31.8 26.2 44.5
MIMAROPA 42.0 30.0 47.9
Philippines 38.7 32.2 45.3
Source: Author’s calculation of NDHS data.

61
2. Health f inanc ing
Health financing is critical for NCDs especially for the curative phase of the disease. Patients with NCDs (e.g.
cancer and complications of cardio-vascular disease) need constant and regular visit to doctors. Thus, the
burden of health payments is very high in NCDs.
In the country, different sources of financing are being used. The major source of financing during an NCD
consultation to a health facility is still out of pocket. Figure 32 shows that almost 40 percent of those who had
NCD-related consultations utilized any form of out-of-pocket expenditures like savings, salary or loans.
Almost 20 percent also relied on donations. Donations can be through the Philippine Charity Sweepstakes
Office (PCSO) or local government leaders. Utilization of insurance based financing is minimal in the
country. Only 13 percent of those who visited facility used their PhilHealth benefits while only 3 percent used
other forms of private insurance.
Figure 32. Sources of financing during NCD consultation, Philippines. 2008.
Source: Author’s calculation of NDHS data
The role of social insurance in avoiding catastrophic effects of health payments especially during the curative
phase of the disease is very important. Analysing social insurance data, around 20 percent of the amount of
claims processed can be directly attributed to the four major NCDs. Similar picture can be observed for both
the sponsored and non-sponsored members.

62
It is hypothesized that the NCD patients are more likely to experience catastrophic payments due to the
complexity of diagnosis and requirement of long term treatment compared infectious diseases. The lack of
data on total cost incurred by patients limits the researchers to estimate the actual cost of care of every disease
and value being supported by PhilHealth and only average amount of claim can be calculated. In general, the
average claim for major NCDs significantly higher compared to other diseases except for COPD. Philhealth
document reveals that the average PhilHealth claim is 8,127 pesos.
Table 41. Claims benefit from social insurance, sponsored and non-sponsored, Philippines, 2009. NCDs Sponsored Non-sponsored Total
Average Claim
Total Amount
of Claim$
Share to total PHIC
benefit
Average Claim
Total Amount
of Claim$
Share to total PHIC
benefit
Average Claim
Total Amount
of Claim$
Share to total PHIC benefit
CVD 13,010 323 10% 11,441 2080 10% 10,974 2,410 10% COPD 7,026 98 3% 6,471 423 2% 6,290 521 2%
DM 9,946 404 1% 9,251 273 1% 7,403 313 1% Malignancy 17,603 166 5% 12,592 1,350 7% 13,367 1,520 6%
Total 15,499 628 19% 11,936 4,130 20% 12,209 4,760 20% Total Benefit
Paid by PHIC * 3,331,391,095 20,294,437,930 23,625,829,025
*excluding capitation $in 000,000
Table 42. Claims benefit from social insurance, sponsored and non-sponsored, Philippines, 2010. NCD Sponsored Non-sponsored Total
Average Claim
Total Amount
of Claim$
Share to total PHIC
benefit
Average Claim
Total Amount
of Claim$
Share to total PHIC
benefit
Average Claim
Total Amount
of Claim$
Share to total PHIC benefit
CVD 11,727 487 9% 13,222 2,430 10% 12,878 2,920 10%
COPD 7,321 141 3% 7,706 478 2% 7,615 618 2%
DM 9,001 59 1% 9,312 318 1% 9,211 378 1%
Malignancy 16,864 260 5% 15,533 1,590 7% 15,671 1,850 6%
Total 14,629 947 17% 14,367 4,820 20% 14,336 5,760 20%
Total Benefit Paid by PHIC *
5,626,069,588 23,878,955,929 29,505,025,517
*excluding capitation $in 000,000

63
Policy scanning
In 2011, the Department of Health issued the Administrative Order no.003 (National Policy on the Prevention of
Non-communicable Lifestyle-related Diseases). This laudable policy piece would lay foundation for future national
strategy in mitigating NCDs. Specifically, this policy affirms and ascertains the general role of the Department
of Health in adopting community-based approach in the targeting lifestyle-related NCDs. Moreover, it links
other stakeholders in this national campaign. This policy would open doors for a more specific, synchronized
and sustainable programs on NCDs specifically targeting the health inequities.
Despite the presence of a national policy, it is deemed necessary to scanned and teased out other related
policies. Policies that have significant connection on NCD control and prevention were also discussed. The
following domains were tackled: (1) trade policies, (2) tobacco regulations, (3) alcohol regulation, (4) food
regulation and (5) physical activity and (6) physical access to medicine.
Trade policies Since 1980s, the Philippines has opened its economy to foreign markets through several trade reform
programs. Consequently, it established a network of free trade agreements (FTAs) with several countries. At
the time of writing, the country, as member of the Association of Southeast Asian Nations (ASEAN), has
existing FTA’s with Japan, China, Korea, Australia-New Zealand, European Union and India.
As part of the “global village,” the Philippines acceded to the WTO as a founding member in 1995. In view
thereof, it considerably lowered import restrictions and expanded trade. ASEAN is one of the top trading
partners of the Philippines along with Japan, China, and US. In 2009, according to the National Statistical
Coordination Board, trade between the Philippines and ASEAN member countries amounted to US
$16,812,730; followed by the US with US $11, 901,731; Japan with US $11,571,752; and China with US
$6,741,341. Primary imports of the Philippines include electronic products, mineral fuels, machinery fabrics,
grains, chemicals and plastic (NSCB, 2009).
If trade liberalization is left unchecked by domestic regulation, it may increase certain unhealthy consumption
habits, which in turn may lead to an increase in the prevalence of NCDs. In general, WTO rules do not
distinguish between ‘bad’ or ‘good’ products. Thus, legal products that are detrimental to health such as
tobacco may ‘benefit’ trade liberalization.
The developing world is currently experiencing rapid shifts in food availability and consumption brought
about by what has been termed as “nutrition transition” (Popkin, 2001; Thow & Hawkes, 2009). Local diets

64
are giving way to rising consumption of fatty foods and sweeteners and at the same time physical activity
levels decline.
One of the threats brought by trade liberalization is that it allows entry of low-cost processed and unhealthy
foods (oily and fatty foods), cigarettes and alcohol to the country. As the Philippines progressively liberalized
its trade in goods, it may reduce tariffs on alcohol as part of its WTO commitments. The significant reduction
in tariff may in effect increase alcohol and tobacco consumption for transnational tobacco companies (TTCs)
and multinational corporations (MNCs) to sell these goods in prices attractive to consumers. Thus, this may
have significant health implications particularly on risk factors associated with non-communicable diseases.
As such, the rapidly growing burden of NCDs in the Philippines is also driven by the negative effects of
globalization. Unfair trade and irresponsible marketing, rapid and unplanned urbanization and increasingly
sedentary lifestyles of Filipinos may well contribute to the detriments of globalization.
Under the Tariff and Customs Code of 1978, the President, upon the recommendation of National
Economic and Development Authority (NEDA), may modify import duties for the promotion of foreign
trade. This modification may mean a decrease in the tariffs of goods imported by the Philippines.
Consequently, the country, as a signatory to ASEAN Trade in Goods Agreement (ATIGA), had agreed to
reduce tariffs on goods traded within the ASEAN region. For example, transnational tobacco companies
(TTCs) that have long established their bases in Singapore, Philippines, Indonesia and Malaysia, would enjoy
a very low import tax giving them competitive advantage in the market.
Tobacco epidemic has been escalating in developing countries where there is significantly growing market of
tobacco due to the decline of such in the developed countries. The shift of capital of TTCs from west to east
because of globalization has also put forth several other factors of global expansion. First, many developing
countries voluntarily open up their economies to acquire jobs and foreign investment. TTCs take advantage
of the cheap land, labor and transport, tax exemption and lifting of import duties that these countries offer in
exchange of putting their bases. Second, political and economic clouts to pry open the closed markets in Asia.
For example, accession to WTO requires a unanimous vote of all 134 members, pressure from the TTCs
home governments to relax the rules in exchange of getting a support for membership in WTO. Finally,
TTCs try to get away from the prospect of stricter regulation at home and try to shield an increasing
proportion of their assets from litigation (Chitanondth 2000, Magnusson 2007).
Multilateral as well as regional trade agreements played significant roles in increasing the consumption of
tobacco and alcohol through tariff reduction. Without an offsetting consumption tax on these commodities,
trade liberalization can indeed increase tobacco and alcohol intake. Studies have also shown the strong link
between increased tobacco consumption and free trade and tobacco-related foreign direct investment
(Beaglehole and Yach 2003).

65
Under Philippine import laws, it is the responsibility of the importer to ensure that any product entering the
country’s customs territory is in full compliance with Philippine health and phytosanitary regulations. The
enforcing authorities will check for compliance by inspecting the goods and relevant import/export
documentation and decide on whether the goods may enter the Philippines.
All imported food and agricultural products are required to comply with the Philippines’ food health and
phytosanitary laws. In general, none of these products is allowed to enter the Philippines if it is deemed to
pose a danger to human life or well-being, either directly or indirectly.
Table 43. Summary of trade-related laws. Laws Provisions/Remarks
Presidential Decree No. 1464
Tariff and Customs Code of 1978
Empowers the President of the Republic of the
Philippines, upon the recommendation of the National
Economic and Development Authority, to modify import
duties for the promotion of foreign trade.
Covers imported articles subject to duty(tariff)
Includes prohibited importations (i.e. weapons of war,
written or printed materials of an obscene or immoral
character, adulterated and misbranded articles of food
among others)
Rates of import duty to all products imported directly or
indirectly by all foreign countries which include live
animals, meat and edible meat offal, fish and other aquatic
invertebrates, dairy products, fruits and vegetables, coffee,
tea, mate and spices; cereals; animal or vegetable fats and
oils; beverages, vinegar; tobacco and manufactured
tobacco substitutes; sugar; minerals; pharmaceutical
products; fertilizers; soap and perfume; printed books and
other products of printing industry; and textile.
The Tariff Commission and Bureau of Customs are the
implementing agencies in coordination with DTI.
Republic Act No. 3720 (RA 3720)
Food, Drug and Cosmetics Act of 1967
to ensure the safety and purity of foods, drugs and
cosmetics made available to the public

66
under this Act, the Bureau of Food and Drugs was made
responsible for the safety of processed food products and
oversees the control of the manufacture and sale of
processed foods, where the major concerns are
adulteration and mislabeling of food products; and
surveillance of imported food products at legal port entry.
Republic Act No. 4109
An Act To Convert The Division Of Standards Under
The Bureau Of Commerce Into A Bureau Of
Standards, To Provide For The Standardization
And/Or Inspection Of Products And Imports Of The
Philippines And For Other Purposes
The Bureau of Product Standards, under DTI, covers
inspection, sampling, testing and certification mark of both
locally produced and imported products prior to market
distribution.
Republic Act No. 8800
Safeguard Measures Act
Protects the local industries by providing general safeguard
measures against a serious threat brought by increased
imports
Provides penalties for violation, investigation, and actions
to be taken in the case thereof
It shall apply to all products being imported into the
country irrespective of source
The Tariff Commission will be the lead agency along with
the Secretary of Trade and Industry and Agriculture
concerning non-agricultural and agricultural products
respectively
Tobacco control policies
Spearheaded by Department of Health, significant policies on tobacco control were institutionalized in the
last decade. The issue of effectiveness of existing tobacco control policies is a different matter and it requires
advance methodological designs for proper evaluation. Thus, it would not be discussed in this study.
One of the most important pieces of legislation is the RA 9211 of 2003 which sets regulations on the use and
promotion of tobacco products. The intention of the law is to decrease the devastating effects of tobacco use,

67
eliminate second hand smoking and promote early cessation. Necessary features of an ideal tobacco control
policy such as restrictions on advertising, promotions and prohibitions are well articulated in the law.
However, other provisions like tobacco graphic warning and wider scope of smoking restrictions in public
areas are not included. There is a pending house bill (SB 2340) of Pia Cayetano that mandates all tobacco
companies to put graphic health warnings on tobacco products.
Though the law includes prohibition of tobacco use in public areas, it only captures selected establishments.
Section 5 of the act prohibits smoking in public places such as centers of youth activity including schools,
elevators and stairwells, locations where fire hazards are present, within public and private hospitals and other
medical facilities, public conveyances and facilities such as transport terminals, train and bus stations,
restaurants and conference halls, and food preparation areas. Currently, a court ruling prohibits agencies like
MMDA to apprehend smokers in major streets of Metro Manila since this is not beyond the scope of the
provision (MMDA, 2011).
Table 44. Summary of vital components of RA 9211. RA 9211 of 2003 Present or absent
Prohibitions in public areas Present but selected
Warning on labels Present
Visual warning Not present
Restriction on minor Present
Advertising regulations Present
Promotional regulation Present
Programs to mitigate the effects on tobacco growers
and manufacturers
Present
In terms of tobacco tax policy, the RA 8240 stipulates the imposition of excise tax in all tobacco products.
The tax policy of tobacco in the country is quite complex. The amount of tax is highly dependent on the
nature and preparation of tobacco products. Currently, President Aquino pushes the passage of sin taxes
which would change the mechanism on how the government taxes tobacco and alcohol. Under the proposed
sin taxes law, there would be an automatic adjustment of the tax rates using the relevant NSO-established
tobacco and alcohol indexes, which will track inflation (table 35).
Prior to the RA 9211, the Department of Health had already inked landmark policy pieces to control tobacco.
The first tobacco-related department law is Administrative Order no. 56 of 2001. The main objective of this
policy is to mandate all manufacturers to put health warning in all tobacco. This guideline on packaging was
eventually included in the provisions of RA 9211 in 2003.

68
Important administrative orders them followed after the passage of the Tobacco Regulation Act. DOH
expressed their commitment in the WHO-Tobacco Free Initiative, crafting guidelines in health promotions,
building smoke cessation clinics and support groups. In 2009, the DOH also issued the AO 0010 which aims
to prohibit smoking within the perimeter of DOH, DOH-attached agencies and all health facilities.
The Department of Education is also committed in prohibiting tobacco use and promotion in public schools
as ascertained by Department Order no. 73 of 2010.
Table 45. Tobacco excise tax. Products Imposed tax
Tobacco twisted by hand or reduced into a condition
to be consumed in any manner other than the
ordinary mode of drying and curing
Tobacco prepared or partially prepared with or
without the use of nay machine or instruments or
without being pressed or sweetened
Fine-cut shorts and refuse, scraps, clippings, cuttings,
stems and sweepings of tobacco
P0.75 on each kilogram
On tobacco specially prepared for chewing so as to be
unsuitable for use in any other manner, on each
kilogram, Sixty centavos
P0.60 on each kilogram
Cigars One peso (P1.00) per cigar
Cigarettes Packed by Hand (P0.40) per pack
Cigarettes Packed by Machine (1)If the net retail price (excluding the excise tax and the value-added tax) is above Ten pesos (P10.00) per pack, the tax shall be Twelve pesos (P12.00) per pack;
(2) If the net retail price (excluding the excise tax and the value-added tax) exceeds Six pesos and fifty centavos (P6.50) but does not exceed Ten pesos (P10.00) per pack, the tax shall be Eight pesos (8.00) per pack;
(3) If the net retail price (excluding the excise tax and the value-added tax) is Five pesos (P5.00) but does not exceed Six pesos and fifty centavos (P6.50) per pack, the tax shall be Five pesos (P5.00) per pack;
(4) If the net retail price (excluding the excise tax and the value-added tax is below Five pesos (P5.00) per pack, the tax shall be One peso (P1.00) per pack;
Source: Bureau of Internal Revenue

69
Table 46. Summary of policies related to tobacco control. Law Provisions
Administrative Order No. 56 of
2001: Guidelines on Labeling and
Advertising (DOH)
• The package of cigarette for sales and distribution within the
country should bear the statement: “Warning: Cigarette smoking is
dangerous to health.”
• FDA will lead implementing agency in full coordination of DTI.
Republic Act 9211-Tobacco
Regulation Act of 2003
• Smoking shall be absolutely prohibited in designated public places
areas.
• Prohibitions of retail, sell and distribution in minor.
• The sale or distribution of tobacco products is prohibited within
one hundred (100) meters from any point of the perimeter of a
school, public playground or other facility frequented particularly
by minors.
• All tobacco products should include the statement in their
packages: “Warning: Cigarette smoking is dangerous to health”
• Restrictions in print media advertising
• Total restriction in TV and outdoor advertising is prohibited by
2007.
• Ban on sponsorship and other forms of tobacco promotions
• Programs and project under the law:
1. Programs that would help tobacco farmers (e.g. alternative
cropping)
2. Smoke-free universities
3. Programs that would help displaced tobacco factory workers
4. Promulgation of Department of Education on the rules and
regulations in the incorporation of anti-tobacco programs in
curricula.
Administrative Order No 0010 of
2009: Rules and Regulations
Promoting a 100% Smoke-free
Environment (DOH)
• Smoke free environment in all health facilities, DOH and its
attached agencies
• The ban of sales and promotions near areas mentioned.
• Preferential on non-smokers for plantilla positions
Administrative Order No. 122 of
2003: A Smoking Cessation Program
to Support the National Tobacco
Control Program and Promotion of
Healthy Life (DOH)
• DOH supports the WHO Tobacco –Free Initiative
• DOH shall promote technical assistance to health facilities, LGUs,
schools and other agencies supporting the program
• Guidelines in the conduct of health education about tobacco

70
• Building smoke cessation clinics. For DOH hospitals they are
incorporated in the outpatient department.
• Creation of Smokers’ Family Support Group
Administrative Order No. 004 of
2007: National Tobacco Control
Program (DOH)
• DOH is committed in program to eliminate the dependence on
tobacco products.
• Programs that would eliminate second hand smoking (e.g. smoking
in public areas)
• Ensure of public disclosure of the toxic contents of tobacco
• National and local network building
• Ensure surveillance of tobacco –related indicators
• Promotion of research
• Resource mobilization (e.g. donor funds)
Alcohol regulation policies
Unlike tobacco, alcohol control policies are not well articulated. If present, they are highly dependent on laws
of local government units. Most of the national laws that pertain to alcohol control usually aim to eliminate
road traffic injuries. As enshrined under Section 53 of Republic Act 4136 also known as Land Transportation
Act and Traffic Code, driving any form of vehicle that are under the influence of alcohol and narcotics.
However, this old law with lax provisions has not been useful enough because of the lack of teeth (e.g. small
fines and the identification of drunk drivers are not included).
In 2010, the congress also legislated the Drivers Under the Influence of Alcohol Act (DUIC). The objective
of the law is to give more teeth on the existing traffic code. Under the new law, a person can be charged for
drunk driving if operating a motor vehicle while intoxicated with alcohol at levels where the driver’s mental
and motor skills are impaired or when blood alcohol concentration level is zero point zero six (0.06) or more.
The bill also requires applicants for driver’s licenses to complete a course on driving and safety matters that
will include the effects of alcohol consumption on the ability to operate a motor vehicle and the hazards of
driving under the influence of alcohol. All drivers involved in vehicular accidents that result in death or
physical injuries of a serious nature will be subjected to chemical tests to determine the presence and
concentration of alcohol in their bloodstream.
Another important piece of legislation is prohibition of alcohol to a certain vulnerable segment of the
population. According to WHO documents, like many other countries in the world, minors in the Philippines
71
(18 years below) are not allowed to drink alcohol. Several house and senate bills that are currently filed seek
stricter provisions with regard to underage drinking. For example, Senator Revilla’s proposed house bills
would tend to penalize minors caught drinking by obliging them to perform community service while fine
would be imposed to establishments. The creation of anti-underage drinking body was also proposed to
monitor the implementation of the law.
The WHO proposes that countries craft policies which would restrict and regulate alcohol drinking to
vulnerable population. Though underage drinking laws are now in the House and Senate, there is no law that
restricts alcohol to other vulnerable population like pregnant women. Neither is there any law that controls
and regulates alcohol promotions and advertising. After exhaustive scanning of policies from 1980-2010,
there is no existing comprehensive and specific policy in the side of Department of Health that depicts a
national framework with regard to alcohol control.
Food regulations
The Philippines has diverse food regulations and standards. In general, the Food and Drug Administration
and Department of Science and Technology are the key agencies that release pertinent food regulation policy.
Due to the inherent wide scope of food regulations, specific and relevant guidelines/policies which the World
Health Organization recommends are discussed below:
1. Establish and implement food-based dietary guidelines and support the healthier composition of food.
There are a lot of existing guidelines that promotes healthier food composition in the country. One example
is the Food Nutrition and Research Institute’s Daily Nutritional Guide Pyramid. The Food and Nutrition
Research Institute (FNRI) has developed a food pyramid, a simple and easy-to-follow daily eating guide for
Filipinos. The food guide pyramid is a graphic translation of the current "Your Guide to Good Nutrition"
based on the usual dietary pattern of Filipinos in general. The usual Filipino diet consists mainly of rice. It
contributes to the largest share of carbohydrates in the diet together with bread, corn and root crops such as
sweet potato, cassava and "gabi."
Though there are existing guidelines that promote healthier composition of food, there is no legal and solid
framework on how this would be disseminated.

72
2. Framework and/or mechanisms for promoting the responsible marketing of foods and non-alcoholic beverages to
children (none), in order to reduce the impact of foods high in saturated fats, trans-fatty acids, free sugars, or salt.
The Department of Health has proposed different mechanisms to promote responsible food marketing.
These include food certification to control salt and fats, consolidation of Sangkap Pinoy in “Wise Choice
Stamp” using CODEX standard, and the front pack labelling displaying what nutrients are included.
Regulations on fast foods are still on the advocacy stage. There is no legislation yet to control foods high in
saturated fats, trans-fatty acids, or salt. It is still the discretion of these food companies whether they would
adhere to the promotion of healthy foods to be offered in their respective food chains.
There is no agency in the country regulating advertisement of unhealthy foods and beverages except one
which is composed of the advertisers themselves. The Philippine Association of National Advertisers
(PANA) is a non-stock organization comprising every major industry in the country. Since it is self-regulating,
the FDA, even if it has police power, cannot impose what advertisement should not be shown on television,
print and other forms of media (except for clinical claims).
Hence, three problems/challenges arise concerning food regulation. These include the absence of national
framework, accountability and conflict of interest. The issue of whether what agency is authorized or legally
mandated to monitor and regulate food advertisement must be resolved. Finally, resolution on conflict of
interest between the advertisers and the regulating office is equally important.
Physical activity
Policies and laws regarding promotion of physical activity are limited. At present, there is no policy or
national framework promoting healthy lifestyle through physical activity. Nonetheless, the Department of
Health has prepared a draft administrative order on physical activity program adopted form the WHO
guidelines. The Department commissioned the University of the Philippines College of Human Kinetics to
develop a module on physical activity program for different age group and employment in the context of
current Philippine setting. What is lacking, however, is the provision of suitable program for specific risk
factors of NCDs (i.e. physical activity or exercise advisable for people with heart disease, diabetes, etc.).
On the other hand, the Civil Service Commission has issued Memorandum Circular No. 8, s. 2011 reiterating
Memorandum Circular No. 38, s. 1992, regarding the Physical and Mental Fitness Program for Government
Personnel. The CSC also issued MC No. 6, s. 1995 which requires all agencies to adopt “The Great Filipino
Workout” to form part of the National Physical Fitness and Sports Development Program for government
employees. The MC specifically provides the allotment of reasonable time for regular physical fitness exercise

73
which is one (1) hour each week for the conduct of health awareness program and twenty (20) minutes daily
for wellness or fitness program (MC No. 8, s. 2011, www.csc.gov.ph). In addition, the Department of Health
in collaboration with the International Labour Organization (ILO) and the Department of Labor and
Employment (DOLE), developed a module to promote healthy lifestyle in workplace. The baseline survey
was conducted by the Ateneo de Manila University wherein it highlighted the role of the private sector in the
promotion of physical activity.
Policy promoting physical activity is hypothesized to be highly dependent on local government ordinances
and private sector initiative. Since it is believed that health promotion is not prescriptive, LGUs can modify,
add or remove certain requirement/s to best suit their localities.
Though physical activity programs are drastically increasing, it is necessary that agencies like DOH should
issue position and guidelines enshrined into formal policies for sustainability and strict implementation. The
Department or the national government in general, should proactively pursue these programs and policies for
them not to continue to be in the pipeline.
Access to medicine
The Philippines has variety of national and department policies that would make medicines particularly for
NCDs cheap and accessible. Existing laws include price ceiling of major drugs for cardio-vascular diseases
and cancers, treatment packs and social insurance benefits that can directly benefit NCD patients.
In 2009, Republic Act (RA) 9502, an act providing for cheaper and quality medicines was enacted. This law
includes a provision that imposes price ceiling for widely used heart and cancer medicines like Amlodipine,
Atorvastatin, Cytarabine and Doxorubicin. The Maximum Drug Retail Price (MDRP) is imposed on all retail
outlets, public or private, including drugstores, hospitals and hospital pharmacies, health maintenance
organizations, convenience stores, supermarkets, and other sources. About 90 percent compliance rate among
40,000 drugstores and hospital pharmacies had been reported months after implementation. A significant
decline in prices of drugs was observed in the pharmaceutical industry since the regulation of price has been
applied (Picazo, 2011).
Policies on social insurance benefits can also improve health care access especially to people suffering from
NCD-related illnesses. It is important to understand that majority of existing social insurance benefits on
NCDs are curative in nature. No benefit was found for preventive procedures. Currently, the PhilHealth
issued the Circular No. 11-2011 that changes the provider payment mechanisms from fee for service to case
payment. This policy also guarantees no balance billing among the sponsored program. At this point, only
selected procedures and illnesses are covered by this policy. The following are the selected NCDs covered by

74
case payment scheme: essential hypertension, cerebral infarction, radio-therapy for cancer patients and
mastectomy.
Recommendations
The main objective of this paper is to analyze the social determinants of NCDs. By presenting the current
situation of NCDs, it is hoped that this will facilitate genuine interest among stakeholders in the development
of a national strategy in the prevention and control of NCDs. Though several programs on have been in the
past, most often these programs are quite scattered and unsynchronized.
It is important to understand that an inherent feature of NCD prevention and control must involve other
institutions outside the health sector. For example, a policy that would regulate unhealthy diet requires close
coordination with different agencies like the local government and Department of Trade and Industry.
Thus, there is a need to craft a holistic national framework and strategy in the control of NCDs. This future
initiative should contain the following features:
• Define a clear and specific national position on NCDs and their risk factors.
Risk factors like unhealthy food, alcohol and smoking are hard to regulate because of the possible political
and economic backlash once controlled. National position on tobacco control is already well-defined as
enshrined in several laws and policy guidelines. However, regulation of unhealthy food and alcohol seems
very lax. In setting a national position, all risk factors that are feasible for regulation should be well-identified,
and the level and kind regulation should also be set. The creation of a clear national position would result to a
more synchronized and continuous advocacy, technical and financial support from donors and other sectors.
• Identification of intervention points
The formulated strategy should have defined interventional mechanisms which should include the type of
programs and target population. The type of programs is highly dependent on the phase of the diseases.
Thus, programs that target both the preventive and curative phases of NCDs should be in place.
Arguably, our analysis of risk factors posits the non-concentration of all risk factors to a particular socio-
economic class or social segment as manifested in table 47. For example, factors like obesity and
consumption of unhealthy diet are leaning towards the richer population while their poorer counterparts have
several characteristics that increase their risk to NCDs. A case in point is the high consumption of salt, high
consumption saturated fat (specifically the urban poor) and the high prevalence of smoking. This posits the
need for the program to be customized depending on the target population.

75
Table 47. Vulnerable population segments Indicators Age Sex SES Urbanity Urban poor
Vulnerabilities
high blood sugar (diabetes) mid-adult Females Rich Urban
Obesity mid-adult Females Rich Urban urban poor
total cholesterol mid-adult Females Rich Urban urban poor
Hypertension late adult Both Both Both
Exposure
Saturated oil young adult Both Rich Urban urban poor
fast food expenditures young adult Both Rich Urban urban poor
low consumption of fiber young adult Rich Urban
high consumption of meat young adult Rich Urban
unnecessary sugar young adult Rich Urban
high salt intake late adult Poor Rural
Smoking All Males Poor Rural
Alcohol young adult Males All All
physical inactivity young and late adult Rich Urban
physical barriers All Poor Rural
• Setting accountabilities
One of the most effective ways in institutionalizing a national strategy is to convene different sectors of
society. By simply organizing and setting individual responsibilities produce complementary strengths that
would yield to better results. Most often, other sectors are oblivious on their pertinent role in NCD dynamics.
Thus, there should be consultation and dialogue in order to come up with a synchronized position and
objectives. This is mechanism is also a perfect avenue to check the level of commitment of these sectors in
the prevention and control efforts.
• Setting up national goals
There are no existing solid national goals with respects to NCDs and its risk factors. Ideally, national goals on
NCDs should contain very specific metrics that go beyond usual indicators. Behaviors and industry practices
should also be covered if needed.
• Financing
Elaborate mechanism on how to harness sustainable fund needed for preventive and curative programs.
Explore the possibility of financing preventive care using social health insurance.

76
• Creation of a implementing body
The creation of a body that would implement and track the programs is needed. Ideally, the Department of
Health leads this body with the participative action of different sectors.
• Strengthening the health promotional activities
Though the Department of Health has centre for health promotions, it is very timely to explore the
possibility of creating a separate national institution that design and manages the whole health promotional
activities of country which uses modern, sophisticated and corporate-type marketing and media strategy.
• Monitoring and Surveillance
Accurate data are vital in NCD control. The Philippines has usable mortality data and weak NCD
surveillance. Data on NCDs are often not integrated into national health information systems highly
dependent on national surveys. In other countries, their surveillance system is incorporated in health facilities.
• Sustainability
The national strategy should include a provision that open doors for more researches that tackles non-
communicable diseases. Building research centers that focuses on NCDs would lead more to collaboration
and network.

77
Bibliography Abegunde, D., & Stanciole, A. (2006). An estimation of the economic impact of chronic noncommunicable diseases in
selected countries. Geneva: World Health Organization.
AC Nielsen. (2004). Consumer in Europe: Fast-food and take-away food consumption. AC Nielsen.
Aschero, A. e. (1996). Dietary fat and risk of coronary heart disease in men: cohort follow up study in the United States. BMJ, 84-90.
Barnoya, J. & Glantz, S. (2005). Cardiovascular Effects of Secondhand Smoke. Circulation, 2684-2698 .
Beaglehole, & Yach, D. (2003). Globalisation and the prevention and control of non-communicable disease: the neglected chronic diseases of adults. Lancet, 903–908.
Bureau of Agricultural Statistics. (2010). Retrieved October 15, 2011, from BAS website: www.bas.gov.ph
Cohen, B. (2004). Urban Growth in Developing Countries: A Review of Current Trends and a Caution Regarding Existing Forecasts. World Development, 23-51.
Cohen, B. (2006). Urbanization in developing countries: Current trends future projections, and key challenges for sustainability. Technology in Society, 63-80.
Consumer International. (2004). “The Junk Food Trap: The Marketing of Unhealthy Food to Children in Asia Pacific. London: Consumer International.
Consumer International. (2008). The Marketing of Unhealthy Food to Children in Asia Pacific. London: Consumer International.
Cutler, D., Glaeser, L., & Shapiro, S. (2003). Why Have Americans Obese?. Journal of Economic Perspectives, 93-118.
Department of Health. (2005). The 2005 Philippine Health Statistics Report. Manila: Department of Health.
Department of Labor and Empoyment. (n.d.). Bureau of Labor and Employment Statistics. Retrieved October 5, 2011, from BLES website: www.bles.gov.ph
Filmer, D., & Pritchett, L. (2001). Estimating Wealth Effects Without Expenditure Data--Or Tears : with an application to educational enrollments in states of India. World Bank.
Food Export. (n.d.). Philippine Country Profile on Food Industry. Retrieved November 5, 2011, from http://www.foodexport.org/Resources/CountryProfileDetail.cfm?ItemNumber=1030
Fuller, J., Stevens, L., Wang, S., & Group, W. M. (2001). Risk factors for cardiovascular mortality and morbidity: The WHO multinational study of vascular disease in diabetes. Diabetologia, 54-64.
Haddad, L. (2003). What can food policy do to redirect the diet transition? Washington: International Food Policy Research Institute.

78
Haskell, W. (2007). Physical Activity and Public Health. Circulation, 1081-1093.
Lavado, R., & Ulep, V. (2011). Burden of Health Payments in the Philippines. Unpublished.
Macabasco, D. (2008). Softdrinks Industry: Another Side of a Filipino's Beverage Life. Manila: University of Asia and the Pacific.
Magnusson, R. (2007). Non-communicable diseases and global health governance: enhancing global processes to improve health development. Globalization and Health, 490-507.
Miranda, J., Kinra, S., Casas, J., Smith, G., & Ebrahim, S. (2008). Non-communicable diseases in low- and middle-income countries: context, determinants and health policy. Trop Med Int Health., 1225–1234.
Mortell, R., Khan, K., Hughes, M., & Grummer-Strawn, L. (2000). Obesity in women from developing countries. European Journal of Clinical Nutrition, 247-252.
Mozaffarian, D. (2003). Cereal, Fruit and Vegetable Fiber Intake and the Risk of CVD. JAMA.
National Statistical Coordination Board. (2006). Poverty Statistics. Retrieved October 5, 2011, from NSCB website: http://www.nscb.gov.ph/poverty/default.asp
National Statistics Office. (2007). Death Statistics: 2007. Retrieved November 5, 2011, from NSO website: http://census.gov.ph/data/sectordata/sr11564tx.html
National Statistics Office and Department of Health. (2009). 2009 Philippines Global Adult Tobacco Survey (GATS),. Manila.
Ness, A., & Powles, J. (1997). Fruit and Vegetables, and Cardiovascular Disease: A Review. International Journal of Epidemiology, 1-13.
Orfanos, P. e. (2007). Eating out of home and its correlates in 10 European countries. The European Prospective Investigation into Cancer and Nutrition (EPIC) study. Public Health Nutrition, 1515–1525.
Organization, W. H. (2003). Diet, Nutrition and the Prevention of Chronic Diseases. Geneva: World Health Organization.
P., M., & Chalapati, R. (2001). Cause of death reporting systems in India: performance analysis. Natl Med J India, 154-62.
Parry, C., Patra, J., & Rehm, J. (2011). Alcohol consumption and non- communicable diseases: epidemiology and policy implications. Addiction, 1718-24.
Pi-Sunyer, F. (2002). The Obesity Epidemic: Pathophysiology and Consequences of Obesity. Obesity Research, 97-104.
Popkin, B. (2001). Nutrition in transition: The changing global nutrition challenge. Asia Pacific Journal of Clinical Nutrition, 13-18.
Rayner, G., Hawkes, C., Lang, T., & Bello, W. (2007). Trade liberalization and the diet transition: a public health response. Health Promotion Internationa.

79
Rothman, K., & Greenland, S. (2005). Causation and Causal Inference in Epidemiology. Am J Public Health, 144-150.
Siri-Tarino, P., Sun, Q. H., & R., K. (2010). Meta-analysis of prospective cohort studies evaluating the association of saturated fat with cardiovascular disease. Am J Clin Nutr, 535–546.
Stuckler, D. (2008). “Population Causes and Consequences of Leading Chronic Diseases: A Comparative Analysis of Prevailing Explanations. The Milbank Quarterly, 273–326.
Thow, A., & Hawkes, C. (2009). The implications of trade liberalization for diet and health: a case study from Central America. Globalization and HEalth, 1-15.
Uusitalo, U., Pietinen, P., & Puska, P. (2002). Dietary Transition in Developing Countries: Challenges for Chronic Disease Preventio. Geneva: World Health Organization.
Vellakkal, S. (2009). Economic Implications of Chronic Diseases in India. South Asia Network for Chronic Disease.
Wild, S. (2004). Diabetes. Retrieved November 7, 2011, from WHO website: http://www.who.int/diabetes/facts/en/diabcare0504.pdf
World Bank. (2011). Data. Retrieved October 20, 2011, from World Bank Data website: http://data.worldbank.org/
World Health Organization. (2006). Noncommunicable Disease and Poverty: The Need for Pro-poor Strategies in the Western Pacific Region. Geneva: World Health Organization.
World Health Organization. (2010). Public health programmes and social determinants. Geneva: World Health Organization.
World Health Organization. (2011). Diabetes. Retrieved November 2, 2011, from WHO website: http://www.who.int/mediacentre/factsheets/fs312/en/
World Health Organization. (2011). Cancer. Retrieved October 28, 2011, from WHO website: http://www.who.int/cancer/en/
World Health Organization. (2011, September). Cardio-vascular Diseases (CVDs). Retrieved November 7, 2011, from WHO website: http://www.who.int/mediacentre/factsheets/fs317/en/index.html
World Health Organization. (2011). Global Atlas on cardiovascular disease prevention and control. Geneva: World Health Organization.
World Health Organization. (2011, February). Media Center. Retrieved November 5, 2011, from WHO website: http://www.who.int/mediacentre/news/notes/2011/cholesterol_20110201/en/index.html
World Health Organization. (2011). Obesity. Retrieved October 7, 2011, from WHO website.
World Health Organization. (2011). Projections of mortality and burden of disease, 2004-2030. Retrieved November 5, 2011, from who.int: http://www.who.int/healthinfo/global_burden_disease/projections/en/index.html

80
World Health Organization and International Society of Hypertension Writing Group. (2003). 2003 WHO and IHS statement of management of hypertension. Journal of Hypertension, 1983-1992.


