Developed FCC Catalysts with Novel Mesoporous Zeolite ...€¦ · Jointly Developed FCC Catalysts...
14
Paper AM-11-02 Page 1 Jointly Developed FCC Catalysts with Novel Mesoporous Zeolite Deliver Higher Yields and Economic Value to Refiners Barry Speronello i , Research Fellow Javier Garcia‐Martinez ii , Co‐Founder Allen Hansen iii , Process Modeling Engineer Rive Technology Inc. and Ruizhong Hu iv , Manager of Research and Tech Support Grace Davison Refining Technologies Background: Rive Technology and Grace Davison in partnership are commercializing advanced fluid catalytic cracking (FCC) catalyst technology that dramatically increases the yield of transportation fuels per barrel of crude oil. Rive’s Molecular Highway™ technology makes traditional zeolite catalysts more capable of cracking large hydrocarbon molecules, and allows valuable primary cracked products, like gasoline and diesel molecules, to more readily escape the catalyst before they are overcracked to less valuable light gases and coke. This new catalyst is a drop‐in replacement for current catalysts and will enable refiners to increase throughput and profitability without capital investment. In this paper we explain Rive™ zeolite technology, describe its incorporation into a Grace proprietary catalyst matrix formulation, and discuss preparations for a first refinery trial later this spring.
Transcript of Developed FCC Catalysts with Novel Mesoporous Zeolite ...€¦ · Jointly Developed FCC Catalysts...
Paper AM-11-02 Page 1
Jointly Developed FCC Catalysts with Novel Mesoporous Zeolite Deliver
Higher Yields and Economic Value to Refiners
Barry Speronelloi, Research Fellow
Javier Garcia‐Martinezii, Co‐Founder
Allen Hanseniii, Process Modeling Engineer
Rive Technology Inc.
and
Ruizhong Huiv, Manager of Research and Tech Support
Grace Davison Refining Technologies
Background: Rive Technology and Grace Davison in partnership are commercializing advanced fluid catalytic cracking
(FCC) catalyst technology that dramatically increases the yield of transportation fuels per barrel of crude
oil. Rive’s Molecular Highway™ technology makes traditional zeolite catalysts more capable of cracking
large hydrocarbon molecules, and allows valuable primary cracked products, like gasoline and diesel
molecules, to more readily escape the catalyst before they are overcracked to less valuable light gases
and coke. This new catalyst is a drop‐in replacement for current catalysts and will enable refiners to
increase throughput and profitability without capital investment. In this paper we explain Rive™ zeolite
technology, describe its incorporation into a Grace proprietary catalyst matrix formulation, and discuss
preparations for a first refinery trial later this spring.
Paper AM-11-02 Page 2
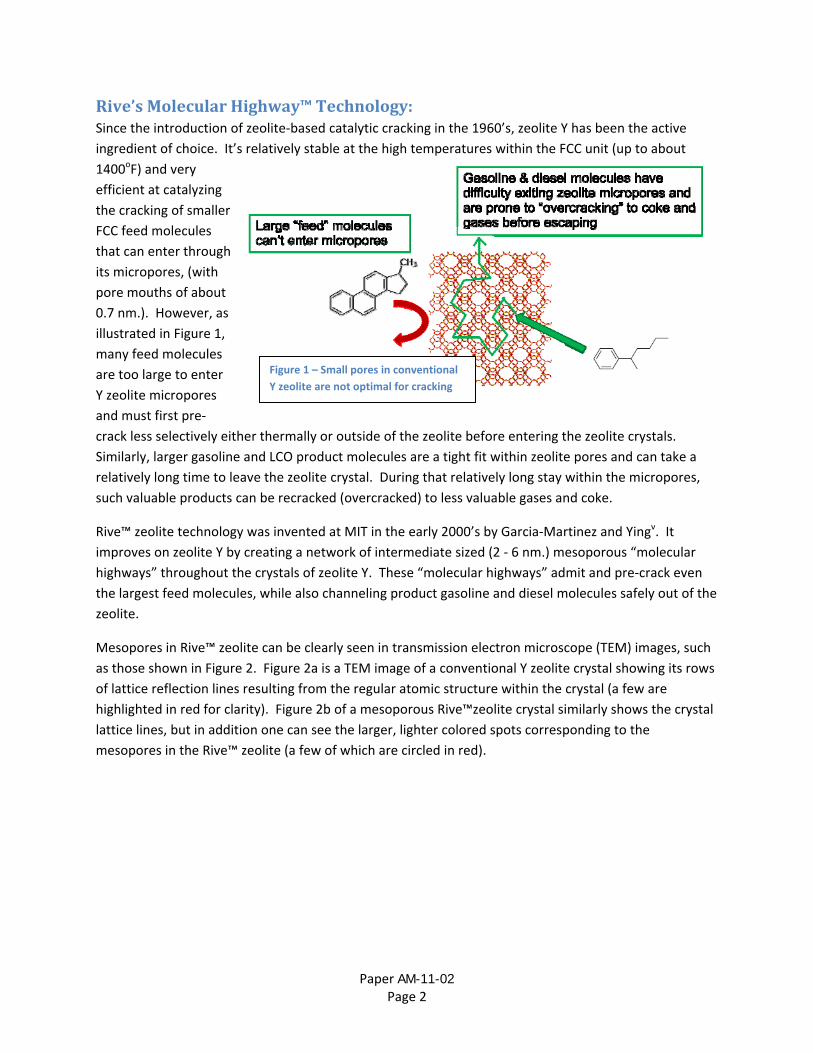
Rive’s Molecular Highway™ Technology: Since the introduction of zeolite‐based catalytic cracking in the 1960’s, zeolite Y has been the active
ingredient of choice. It’s relatively stable at the high temperatures within the FCC unit (up to about
1400oF) and very
efficient at catalyzing
the cracking of smaller
FCC feed molecules
that can enter through
its micropores, (with
pore mouths of about
0.7 nm.). However, as
illustrated in Figure 1,
many feed molecules
are too large to enter
Y zeolite micropores
and must first pre‐
crack less selectively either thermally or outside of the zeolite before entering the zeolite crystals.
Similarly, larger gasoline and LCO product molecules are a tight fit within zeolite pores and can take a
relatively long time to leave the zeolite crystal. During that relatively long stay within the micropores,
such valuable products can be recracked (overcracked) to less valuable gases and coke.
Rive™ zeolite technology was invented at MIT in the early 2000’s by Garcia‐Martinez and Yingv. It
improves on zeolite Y by creating a network of intermediate sized (2 ‐ 6 nm.) mesoporous “molecular
highways” throughout the crystals of zeolite Y. These “molecular highways” admit and pre‐crack even
the largest feed molecules, while also channeling product gasoline and diesel molecules safely out of the
zeolite.
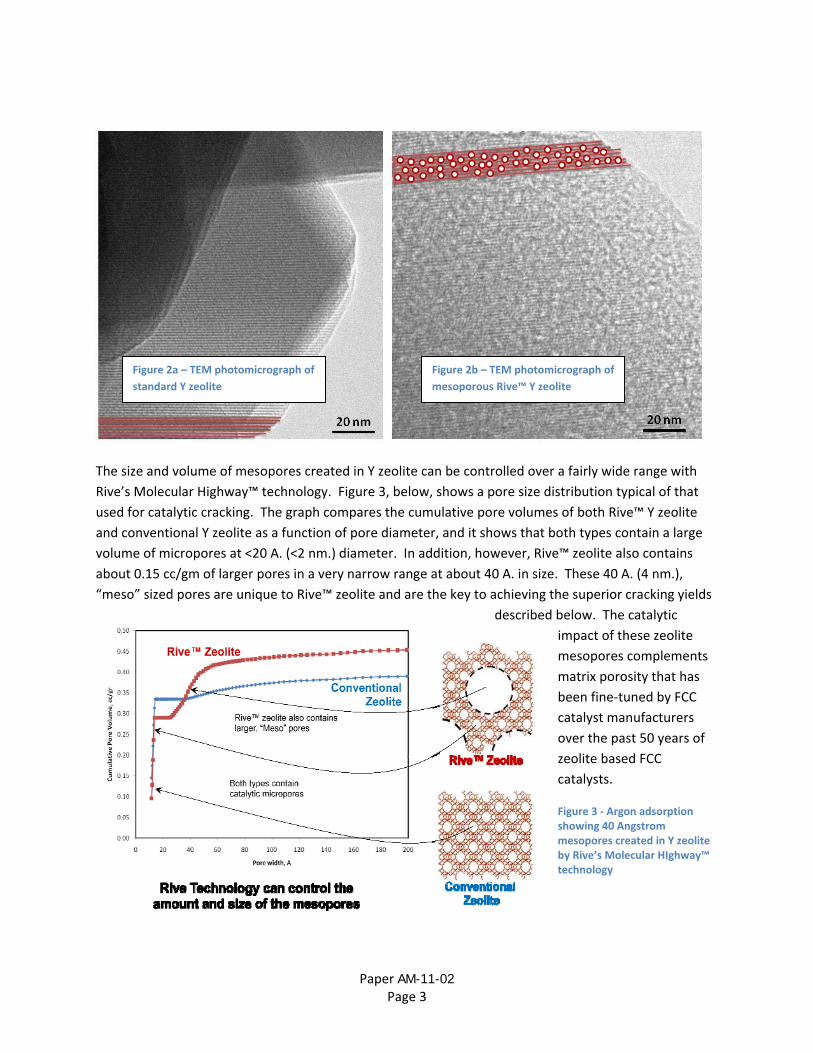
Mesopores in Rive™ zeolite can be clearly seen in transmission electron microscope (TEM) images, such
as those shown in Figure 2. Figure 2a is a TEM image of a conventional Y zeolite crystal showing its rows
of lattice reflection lines resulting from the regular atomic structure within the crystal (a few are
highlighted in red for clarity). Figure 2b of a mesoporous Rive™zeolite crystal similarly shows the crystal
lattice lines, but in addition one can see the larger, lighter colored spots corresponding to the
mesopores in the Rive™ zeolite (a few of which are circled in red).
Figure 1 – Small pores in conventional
Y zeolite are not optimal for cracking
Paper AM-11-02 Page 3
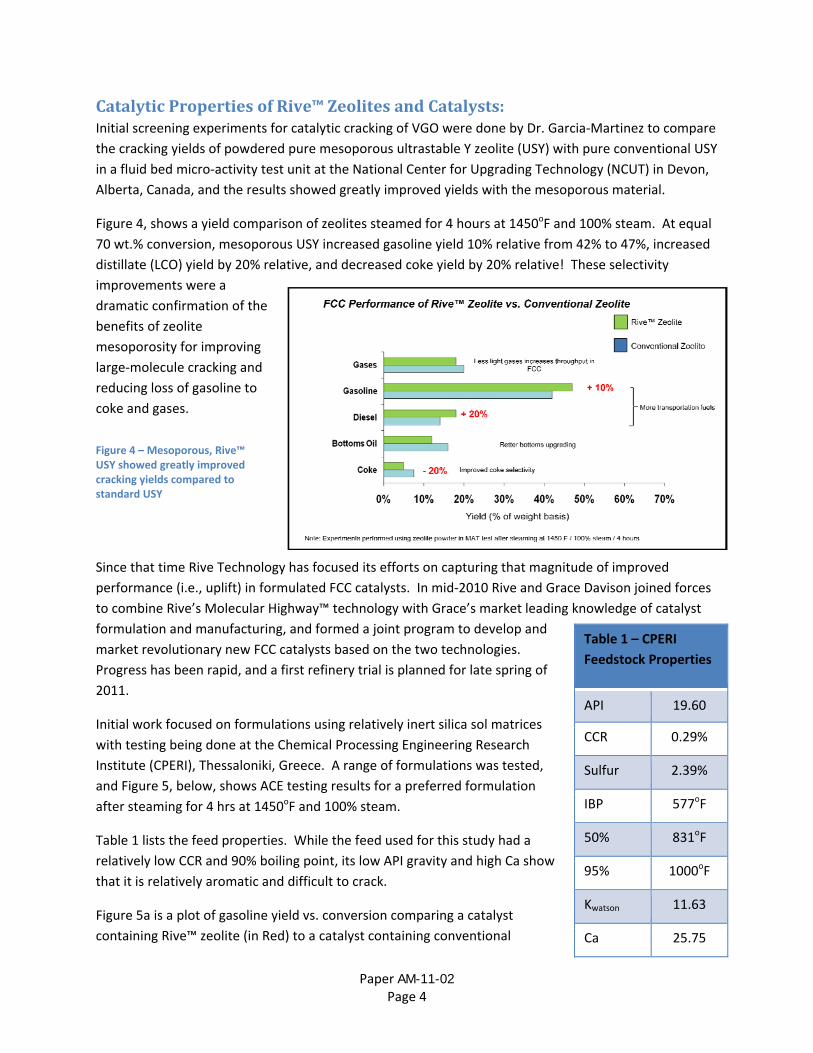
The size and volume of mesopores created in Y zeolite can be controlled over a fairly wide range with
Rive’s Molecular Highway™ technology. Figure 3, below, shows a pore size distribution typical of that
used for catalytic cracking. The graph compares the cumulative pore volumes of both Rive™ Y zeolite
and conventional Y zeolite as a function of pore diameter, and it shows that both types contain a large
volume of micropores at <20 A. (<2 nm.) diameter. In addition, however, Rive™ zeolite also contains
about 0.15 cc/gm of larger pores in a very narrow range at about 40 A. in size. These 40 A. (4 nm.),
“meso” sized pores are unique to Rive™ zeolite and are the key to achieving the superior cracking yields
described below. The catalytic
impact of these zeolite
mesopores complements
matrix porosity that has
been fine‐tuned by FCC
catalyst manufacturers
over the past 50 years of
zeolite based FCC
catalysts.
Figure 3 ‐ Argon adsorption showing 40 Angstrom mesopores created in Y zeolite by Rive’s Molecular HIghway™ technology
Figure 2a – TEM photomicrograph of
standard Y zeolite
Figure 2b – TEM photomicrograph of
mesoporous Rive™ Y zeolite
Paper AM-11-02 Page 4
Catalytic Properties of Rive™ Zeolites and Catalysts: Initial screening experiments for catalytic cracking of VGO were done by Dr. Garcia‐Martinez to compare
the cracking yields of powdered pure mesoporous ultrastable Y zeolite (USY) with pure conventional USY
in a fluid bed micro‐activity test unit at the National Center for Upgrading Technology (NCUT) in Devon,
Alberta, Canada, and the results showed greatly improved yields with the mesoporous material.
Figure 4, shows a yield comparison of zeolites steamed for 4 hours at 1450oF and 100% steam. At equal
70 wt.% conversion, mesoporous USY increased gasoline yield 10% relative from 42% to 47%, increased
distillate (LCO) yield by 20% relative, and decreased coke yield by 20% relative! These selectivity
improvements were a
dramatic confirmation of the
benefits of zeolite
mesoporosity for improving
large‐molecule cracking and
reducing loss of gasoline to
coke and gases.
Since that time Rive Technology has focused its efforts on capturing that magnitude of improved
performance (i.e., uplift) in formulated FCC catalysts. In mid‐2010 Rive and Grace Davison joined forces
to combine Rive’s Molecular Highway™ technology with Grace’s market leading knowledge of catalyst
formulation and manufacturing, and formed a joint program to develop and
market revolutionary new FCC catalysts based on the two technologies.
Progress has been rapid, and a first refinery trial is planned for late spring of
2011.
Initial work focused on formulations using relatively inert silica sol matrices
with testing being done at the Chemical Processing Engineering Research
Institute (CPERI), Thessaloniki, Greece. A range of formulations was tested,
and Figure 5, below, shows ACE testing results for a preferred formulation
after steaming for 4 hrs at 1450oF and 100% steam.
Table 1 lists the feed properties. While the feed used for this study had a
relatively low CCR and 90% boiling point, its low API gravity and high Ca show
that it is relatively aromatic and difficult to crack.
Figure 5a is a plot of gasoline yield vs. conversion comparing a catalyst
containing Rive™ zeolite (in Red) to a catalyst containing conventional
Table 1 – CPERI
Feedstock Properties
API 19.60
CCR 0.29%
Sulfur 2.39%
IBP 577oF
50% 831oF
95% 1000oF
Kwatson 11.63
Ca 25.75
Figure 4 – Mesoporous, Rive™ USY showed greatly improved cracking yields compared to standard USY

Paper AM-11-02 Page 5
zeolite. The zeolites were processed to have the same steamed crystal unit cell size and the catalysts
had the same zeolite contents and matrix formulations.
Figure 5a shows that the benefits of Rive™ zeolite mesoporosity translate well from pure zeolite
powders to catalysts. In this case the uplift was about 3 percentage points (about 6% relative)
compared to the catalyst made using conventional zeolite.
Similarly, Figure 5b compares the coke
yields of the two catalysts and shows
that that the catalyst having Rive™
zeolite made about 1 percentage
point (15% relative) less coke than the
catalyst containing conventional
zeolite.
LCO yields (Figure 5c) were similar for the two catalysts, though, so the advantage in bottoms cracking
seen with the pure powders was diminished when mesoporous zeolite was formulated into a silica sol
matrix and used to crack this relatively challenging feedstock.
The first commercial catalyst formulations containing Rive™ mesoporous zeolite were developed based
on ACE testing using paraffinic vacuum gasoil. Controls for these tests were alumina‐matrix commercial
catalysts A (moderate rare earth) and B (high rare earth). Both equilibrium catalyst and lab deactivated
fresh catalysts were used in the comparisons.
0
2
4
6
8
10
12
50 55 60 65 70 75 80 85
Coke, w
t%
Conversion, wt%
Conventional Zeolite RiveTM Zeolite
Figure 5 – Comparisons of gasoline, coke, and LCO yields of silica sol matrix FCC catalysts containing Rive™ and conventional zeolites when cracking aromatic gasoil in an ACE unit
Figure 5b – Coke
30
35
40
45
50
55
50 55 60 65 70 75 80 85
Gasoline, wt%
Conversion wt%
Conventional Zeolite RiveTM Zeolite
10
12
14
16
18
20
22
50 55 60 65 70 75 80 85
LCO, W
t%
Conversion wt%
Conventional Zeolite RiveTM Zeolite
Figure 5a – Gasoline
Figure 5c – LCO
Paper AM-11-02 Page 6
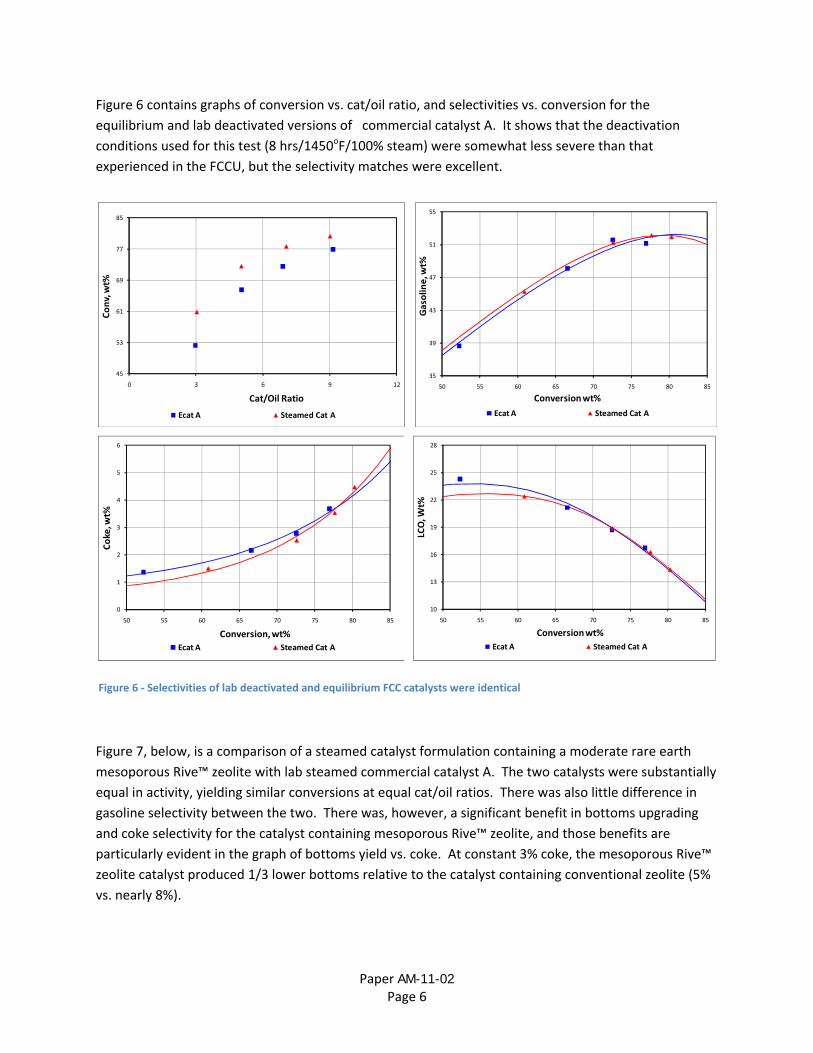
Figure 6 contains graphs of conversion vs. cat/oil ratio, and selectivities vs. conversion for the
equilibrium and lab deactivated versions of commercial catalyst A. It shows that the deactivation
conditions used for this test (8 hrs/1450oF/100% steam) were somewhat less severe than that
experienced in the FCCU, but the selectivity matches were excellent.
Figure 6 ‐ Selectivities of lab deactivated and equilibrium FCC catalysts were identical
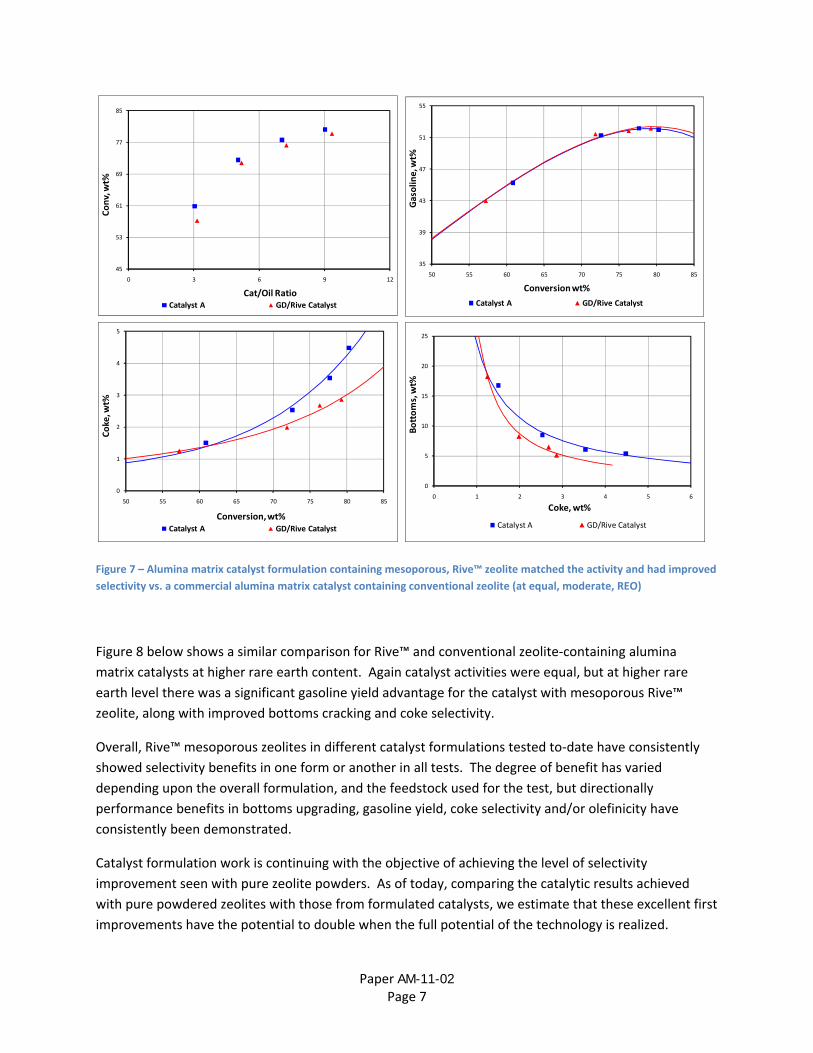
Figure 7, below, is a comparison of a steamed catalyst formulation containing a moderate rare earth
mesoporous Rive™ zeolite with lab steamed commercial catalyst A. The two catalysts were substantially
equal in activity, yielding similar conversions at equal cat/oil ratios. There was also little difference in
gasoline selectivity between the two. There was, however, a significant benefit in bottoms upgrading
and coke selectivity for the catalyst containing mesoporous Rive™ zeolite, and those benefits are
particularly evident in the graph of bottoms yield vs. coke. At constant 3% coke, the mesoporous Rive™
zeolite catalyst produced 1/3 lower bottoms relative to the catalyst containing conventional zeolite (5%
vs. nearly 8%).
45
53
61
69
77
85
0 3 6 9 12
Conv, wt%
Cat/Oil Ratio
Ecat A Steamed Cat A
35
39
43
47
51
55
50 55 60 65 70 75 80 85
Gasoline, w
t%
Conversion wt%
Ecat A Steamed Cat A
0
1
2
3
4
5
6
50 55 60 65 70 75 80 85
Coke, w
t%
Conversion, wt%
Ecat A Steamed Cat A
10
13
16
19
22
25
28
50 55 60 65 70 75 80 85
LCO, W
t%
Conversion wt%
Ecat A Steamed Cat A
Paper AM-11-02 Page 7
Figure 7 – Alumina matrix catalyst formulation containing mesoporous, Rive™ zeolite matched the activity and had improved
selectivity vs. a commercial alumina matrix catalyst containing conventional zeolite (at equal, moderate, REO)
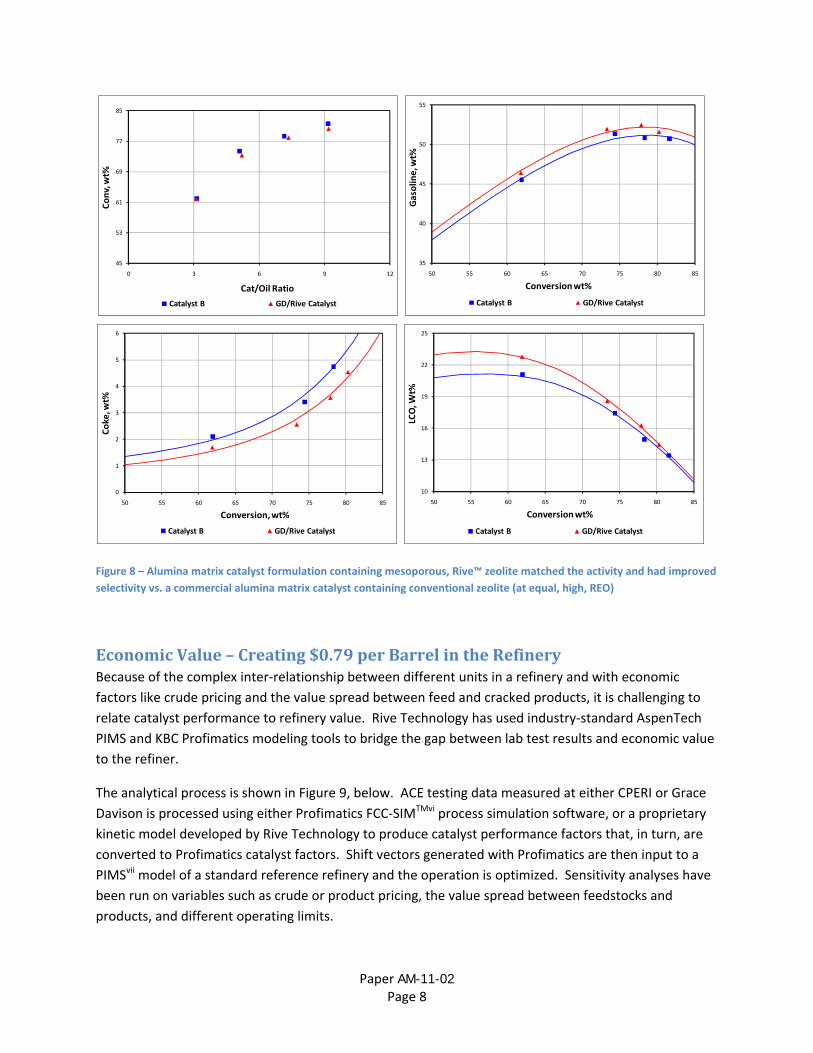
Figure 8 below shows a similar comparison for Rive™ and conventional zeolite‐containing alumina
matrix catalysts at higher rare earth content. Again catalyst activities were equal, but at higher rare
earth level there was a significant gasoline yield advantage for the catalyst with mesoporous Rive™
zeolite, along with improved bottoms cracking and coke selectivity.
Overall, Rive™ mesoporous zeolites in different catalyst formulations tested to‐date have consistently
showed selectivity benefits in one form or another in all tests. The degree of benefit has varied
depending upon the overall formulation, and the feedstock used for the test, but directionally
performance benefits in bottoms upgrading, gasoline yield, coke selectivity and/or olefinicity have
consistently been demonstrated.
Catalyst formulation work is continuing with the objective of achieving the level of selectivity
improvement seen with pure zeolite powders. As of today, comparing the catalytic results achieved
with pure powdered zeolites with those from formulated catalysts, we estimate that these excellent first
improvements have the potential to double when the full potential of the technology is realized.
0
1
2
3
4
5
50 55 60 65 70 75 80 85
Coke, w
t%
Conversion, wt%Catalyst A GD/Rive Catalyst
35
39
43
47
51
55
50 55 60 65 70 75 80 85
Gasoline, wt%
Conversion wt%
Catalyst A GD/Rive Catalyst
0
5
10
15
20
25
0 1 2 3 4 5 6
Bottoms, wt%
Coke, wt%
Catalyst A GD/Rive Catalyst
45
53
61
69
77
85
0 3 6 9 12
Conv, wt%
Cat/Oil RatioCatalyst A GD/Rive Catalyst
Paper AM-11-02 Page 8
35
40
45
50
55
50 55 60 65 70 75 80 85
Gasolin
e, w
t%
Conversion wt%
Catalyst B GD/Rive Catalyst
Figure 8 – Alumina matrix catalyst formulation containing mesoporous, Rive™ zeolite matched the activity and had improved
selectivity vs. a commercial alumina matrix catalyst containing conventional zeolite (at equal, high, REO)
Economic Value – Creating $0.79 per Barrel in the Refinery Because of the complex inter‐relationship between different units in a refinery and with economic
factors like crude pricing and the value spread between feed and cracked products, it is challenging to
relate catalyst performance to refinery value. Rive Technology has used industry‐standard AspenTech
PIMS and KBC Profimatics modeling tools to bridge the gap between lab test results and economic value
to the refiner.
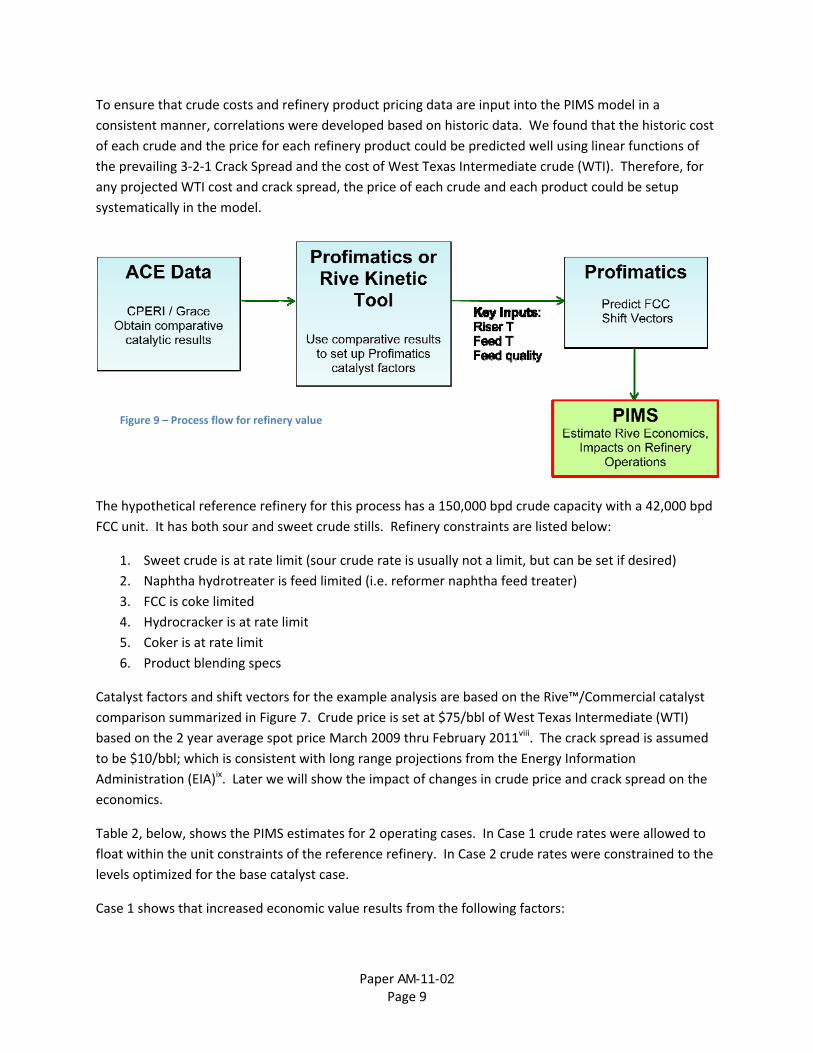
The analytical process is shown in Figure 9, below. ACE testing data measured at either CPERI or Grace
Davison is processed using either Profimatics FCC‐SIMTMvi process simulation software, or a proprietary
kinetic model developed by Rive Technology to produce catalyst performance factors that, in turn, are
converted to Profimatics catalyst factors. Shift vectors generated with Profimatics are then input to a
PIMSvii model of a standard reference refinery and the operation is optimized. Sensitivity analyses have
been run on variables such as crude or product pricing, the value spread between feedstocks and
products, and different operating limits.
45
53
61
69
77
85
0 3 6 9 12
Conv, wt%
Cat/Oil Ratio
Catalyst B GD/Rive Catalyst
0
1
2
3
4
5
6
50 55 60 65 70 75 80 85
Coke, w
t%
Conversion, wt%
Catalyst B GD/Rive Catalyst
10
13
16
19
22
25
50 55 60 65 70 75 80 85
LCO, W
t%
Conversion wt%
Catalyst B GD/Rive Catalyst
Paper AM-11-02 Page 9
To ensure that crude costs and refinery product pricing data are input into the PIMS model in a
consistent manner, correlations were developed based on historic data. We found that the historic cost
of each crude and the price for each refinery product could be predicted well using linear functions of
the prevailing 3‐2‐1 Crack Spread and the cost of West Texas Intermediate crude (WTI). Therefore, for
any projected WTI cost and crack spread, the price of each crude and each product could be setup
systematically in the model.
The hypothetical reference refinery for this process has a 150,000 bpd crude capacity with a 42,000 bpd
FCC unit. It has both sour and sweet crude stills. Refinery constraints are listed below:
1. Sweet crude is at rate limit (sour crude rate is usually not a limit, but can be set if desired)
2. Naphtha hydrotreater is feed limited (i.e. reformer naphtha feed treater)
3. FCC is coke limited
4. Hydrocracker is at rate limit
5. Coker is at rate limit
6. Product blending specs
Catalyst factors and shift vectors for the example analysis are based on the Rive™/Commercial catalyst
comparison summarized in Figure 7. Crude price is set at $75/bbl of West Texas Intermediate (WTI)
based on the 2 year average spot price March 2009 thru February 2011viii. The crack spread is assumed
to be $10/bbl; which is consistent with long range projections from the Energy Information
Administration (EIA)ix. Later we will show the impact of changes in crude price and crack spread on the
economics.
Table 2, below, shows the PIMS estimates for 2 operating cases. In Case 1 crude rates were allowed to
float within the unit constraints of the reference refinery. In Case 2 crude rates were constrained to the
levels optimized for the base catalyst case.
Case 1 shows that increased economic value results from the following factors:
Figure 9 – Process flow for refinery value
Paper AM-11-02 Page 10
1. The combination of improved coke selectivity and reduced gas selectivity for the catalyst with
Rive™ mesoporous zeolite allows both the quality of the feed to the FCC unit to be reduced and
a 17 degree increase in reactor top temperature while keeping within the FCCU coke limit.
a. Coker Distillate is rerouted from the FCC to the distillate hydrotreater, which augments
and improves diesel blending stock and makes the FCCU feed heavier.
b. Sweet crude train is limited, but to make up diverted FCCU feed and to provide more
blend stock for higher quality products coming from the FCCU, more sour crude is run.
Naphtha cut point is decreased to stay within the reformer naphtha pretreater feed
limit, thereby swinging more material to kero (jet).
c. FCCU feed rate decreases 1.8%, and feed quality is reduced.
d. Increased riser top temperature results in increased FCCU conversion and also increases
the octane and olefin content of the cracked products. Negative value bottoms fall 15%.
2. Feed to the Alkylation unit increases as a result of greater olefins from the FCCU and together
with the increased octane from the FCCU, total octane barrels is sustained.
3. Added jet from crude allows more FCC hydrotreated heavy naphtha to be blended into diesel
instead of jet.
4. Hydrocracker is at its maximum feedrate, but the unit is able to shift yields to more naphtha and
less distillate due to increased diesel from both FCC hydrotreated heavy naphtha and Coker
distillate.
5. Reformer pretreater is limited, but 2.1% more reformate is produced due to more Hydrocracker
naphtha production (which does not need to go through the constrained pretreater).
The net result of these changes, shown in Table 2, is a 5.3% increase in refinery throughput with 1.0%
coming in gasoline and 3.8% in distillates. The net value of these improvements is $0.79/bbl
($118,000/day, or $43,000,000/yr).
Case 2 in Table 2 focuses on the value to the FCCU alone by constraining the refinery feed rate to base
case levels. Consequently the spillover value to other units is diminished, but there is still an increase in
overall distillate and gasoline yields of 3.0% of the crude rate, and the FCCU experiences a 2 wt% drop in
bottoms yield. Increased gasoline octane and olefins yields also help sustain octane‐barrels.
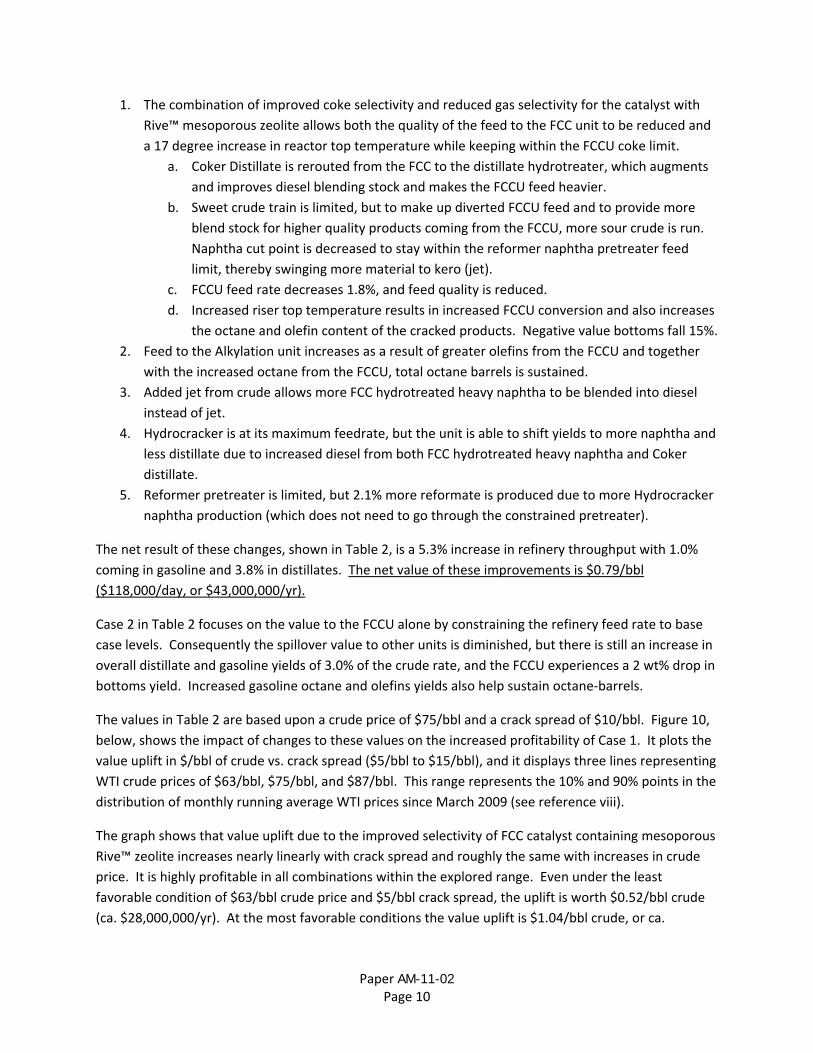
The values in Table 2 are based upon a crude price of $75/bbl and a crack spread of $10/bbl. Figure 10,
below, shows the impact of changes to these values on the increased profitability of Case 1. It plots the
value uplift in $/bbl of crude vs. crack spread ($5/bbl to $15/bbl), and it displays three lines representing
WTI crude prices of $63/bbl, $75/bbl, and $87/bbl. This range represents the 10% and 90% points in the
distribution of monthly running average WTI prices since March 2009 (see reference viii).
The graph shows that value uplift due to the improved selectivity of FCC catalyst containing mesoporous
Rive™ zeolite increases nearly linearly with crack spread and roughly the same with increases in crude
price. It is highly profitable in all combinations within the explored range. Even under the least
favorable condition of $63/bbl crude price and $5/bbl crack spread, the uplift is worth $0.52/bbl crude
(ca. $28,000,000/yr). At the most favorable conditions the value uplift is $1.04/bbl crude, or ca.

Paper AM-11-02 Page 11
$57,000,000/yr. While it is not shown, sensitivity analysis also indicates that the value uplift due to
improved FCC catalyst selectivity is approximately linear with refinery size.
Table 2 – Incremental value of improved catalytic selectivity from Rive™ FCC catalyst. All data shown are relative to base
case (not shown): Case 1 for optimized crude rates, Case 2 for crude rate constrained to base case levels
Parameter Case 1: Optimized Crude
Rates
Case 2: Crude Rates
Constrained to Base Case
Refinery Throughput +5.3 Vol% NA
Refinery Profitability +0.79 $/bbl crude +0.47 $/bbl crude
Refinery Products:
LPG +0.3 Vol% of Crude +0.2Vol% of Crude
Gasoline +1.0 Vol% of Crude +0.3 Vol% of Crude
Distillates +3.8 Vol% of Crude +2.7 Vol% of Crude
Fuel Oil +0.3 Vol% of Crude ‐2.6 Vol% of Crude
FCC Riser Temperature +17 F +11 F
FCC Rate ‐1.8 Vol% of Crude ‐2.0 Vol% of Crude
FCC Yields:
Conversion +3.8 Wt % +4.4 Wt %
Gas +0.6 Wt% +0.6 Wt%
C3+C4 Olefins +1.2 Wt% +1.2Wt%
C3+C4 Non‐Olefins +1.6 Wt% +1.7 Wt%
Gasoline +0.2 Wt% +0.8 Wt%
Distillate ‐2.2 Wt% ‐2.4 Wt%
Bottoms ‐1.6 Wt% ‐2.0 Wt%
Coke (constant max coke rate
constraint) +0.2 Wt% +0.1Wt%
Paper AM-11-02 Page 12
Figure 10 ‐ Improved profitability from FCC catalyst containing Rive™ mesoporous zeolite as a function of crude cost and crack spread.
Commercialization Manufacturing of the first FCC catalyst from this joint program between Grace Davison and Rive
Technology is now moving from the pilot scale to full commercial production. Thousands of pounds of
Rive™ Y zeolite have been produced at the pilot plant of Grace’s Curtis Bay, MD manufacturing facility,
and, as you can see from Figure 11, below, its performance matches that of smaller scale materials
made in Rive's Princeton NJ laboratory. Figure 11 compares two catalysts made using the same
formulation and rare earth level, but one catalyst contained Rive™ zeolite that was processed in the
laboratory and the other contained Rive™ zeolite that was produced in the pilot plant.
Figure 11 shows that catalyst made with pilot plant Rive™ zeolite was more active and had equal
selectivity compared to catalyst made using lab‐produced Rive™ zeolite. Continuous calcination at the
tech center allowed for more uniform stabilization of the zeolite which, in turn, produced a more
crystalline and more hydrothermally stable product. At equal zeolite content the pilot plant catalyst had
a steamed zeolite surface area of 190 m2/gm compared to 160 m2/gm for the catalyst with lab produced
zeolite. Consequently, the pilot plant catalyst had about 25% higher activity (i.e., pilot plant zeolite
catalyst achieved 75% conversion at 5.5 cat/oil vs. 7 cat/oil for the lab catalyst).
Otherwise, the two catalysts were identical. Figure 10 shows that there were no differences in either
the gasoline, LCO, or coke selectivities of the two catalysts.
Based on these excellent results, plant modifications to accommodate the Rive process are in progress,
and a first refinery trial is scheduled for later in the spring of 2011.
0.4
0.5
0.6
0.7
0.8
0.9
1.0
1.1
1.2
0 5 10 15 20
RIV
E™
ZE
OL
ITE
UP
LIF
T, $
/BB
L
CR
UD
E
CRACK SPREAD, $
WTI=$63
WTI=$75
WTI=$87

Paper AM-11-02 Page 13
What's Next? Along with FCC catalysts based upon Y zeolite, Rive and Grace Davison plan to introduce mesoporous
ZSM‐5 based catalysts and additives for cracking. Laboratory progress is well along on these materials,
and, if things go as expected, first results should be ready for publication by late this year or early in
2012.
50
55
60
65
70
75
80
85
2 3 4 5 6 7 8 9 10
Conv, wt%
Cat/Oil Ratio
Lab Zeolite Pilot Plant Zeolite
35
40
45
50
55
50 55 60 65 70 75 80 85
Gasoline, w
t%
Conversion wt%
Lab Zeolite Pilot Plant Zeolite
0
1
2
3
4
5
50 55 60 65 70 75 80 85
Coke, w
t%
Conversion, wt%
Lab Zeolite Pilot Plant Zeolite
10
13
16
19
22
25
28
50 55 60 65 70 75 80 85
LCO, W
t%
Conversion wt%
Lab Zeolite Pilot Plant Zeolite
Figure 11 ‐ Scale‐up of Rive™ zeolite manufacturing process at the Grace Davison Technical Center produced excellent quality
Paper AM-11-02 Page 14
References: i [email protected] ii Javier Garcia‐Martinez is also a Professor of Inorganic Chemistry at the University of Alicante (Spain): [email protected]
iii [email protected] iv [email protected] v Ying, Jackie Y and Garcia‐Martinez, Javier, US Patent 7,589,041, Sept. 15, 2009 vi Product of KBC Advanced Technology, Houston, Texas vii Product of Aspen Technology, Inc., Burlington, Massachusetts viii Cushing OK WTI average spot price March 9, 2009 thru February 25, 2011, www.eia.doe.gov ix Energy Information Administration, Petroleum Analysis & Projections, U.S. Department of Energy, www.eia.doe.gov