DEUTSCHE TELEKOM CAPITAL MARKETS DAY 2015
22
DEUTSCHE TELEKOM CAPITAL MARKETS DAY 2015 Bonn, February 26/27, 2015
Transcript of DEUTSCHE TELEKOM CAPITAL MARKETS DAY 2015

DEUTSCHE TELEKOM CAPITAL MARKETS DAY 2015 Bonn, February 26/27, 2015

GROUP STRATEGY COST AnD PORTfOLIO TRAnSfORMATIOn LEAD In bUSInESS SUPERIOR PRODUCTIOn MODEL EUROPE GERMAnY T-MObILE USA fInAnCE
DISCLAIMER
This presentation contains forward-looking statements that reflect the current views of Deutsche Telekom management with respect to future events. These forward-looking statements include statements with regard to the expected development of revenue, earnings, profits from operations, depreciation and amortization, cash flows and personnel-related measures. You should consider them with caution. Such statements are subject to risks and uncertainties, most of which are difficult to predict and are generally beyond Deutsche Telekom’s control. Among the factors that might influence our ability to achieve our objectives are the progress of our workforce reduction initiative and other cost-saving measures, and the impact of other significant strategic, labor or business initiatives, including acquisitions, dispositions and business combinations, and our network upgrade and expansion initiatives. In addition, stronger than expected competition, technological change, legal proceedings and regulatory developments, among other factors, may have a material adverse effect on our costs and revenue development. Further, the economic downturn in our markets, and changes in interest and currency exchange rates, may also have an impact on our business development and the availability of financing on favorable conditions. Changes to our expectations concerning future cash flows may lead to impairment write downs of assets carried at historical cost, which may materially affect our results at the group and operating segment levels. If these or other risks and uncertainties materialize, or if the assumptions underlying any of these statements prove incorrect, our actual performance may materially differ from the performance expressed or implied by forward-looking statements. We can offer no assurance that our estimates or expectations will be achieved. Without prejudice to existing obligations under capital market law, we do not assume any obligation to update forward-looking statements to take new information or future events into account or otherwise. In addition to figures prepared in accordance with IFRS, Deutsche Telekom also presents non-GAAP financial performance measures, including, among others, EBITDA, EBITDA margin, adjusted EBITDA, adjusted EBITDA margin, adjusted EBIT, adjusted net income, free cash flow, gross debt and net debt. These non-GAAP measures should be considered in addition to, but not as a substitute for, the information prepared in accordance with IFRS. Non-GAAP financial performance measures are not subject to IFRS or any other generally accepted accounting principles. Other companies may define these terms in different ways.
2

GROUP STRATEGY COST AnD PORTfOLIO TRAnSfORMATIOn LEAD In bUSInESS SUPERIOR PRODUCTIOn MODEL EUROPE GERMAnY T-MObILE USA fInAnCE
DT SUPERIOR PRODUCTIOn MODEL
Claudia Nemat, Board member for Europe and Technology Bruno Jacobfeuerborn, CTO
3

GROUP STRATEGY COST AnD PORTfOLIO TRAnSfORMATIOn LEAD In bUSInESS SUPERIOR PRODUCTIOn MODEL EUROPE GERMAnY T-MObILE USA fInAnCE
TECHNOLOGY LEADERSHIP
OUR STRATEGY
LEADING EUROPEAN TELCO
INTEGRATED IP NETWORKS
WIN WITH PARTNERS
BEST CUSTOMER
EXPERIENCE
LEAD IN BUSINESS
TRANSFORM PORTFOLIO
EVOLVE FINANCIAL TARGETS & EFFICIENCY
ENCOURAGE LEADERSHIP & PERFORMANCE DEVELOPMENT
4

GROUP STRATEGY COST AnD PORTfOLIO TRAnSfORMATIOn LEAD In bUSInESS SUPERIOR PRODUCTIOn MODEL EUROPE GERMAnY T-MObILE USA fInAnCE
SUPERIOR PRODUCTIOn MODEL wITH fOUR PROGRAMS bASED On TECHnOLOGY LEADERSHIP
Annual run rate adj. Opex savings:
≈ €-1.2 bn1
(steady state in early 2020ies)
1 Gross Opex savings D/EU before any counter effects (e.g. personnel cost increases)
5
PSTN migration in all NatCos PSTn
MIGRATIOn
Centralized, virtualized architecture and production platforms
PAn nET
BEST CONNECTIVITY TIME TO MARKET PLUG & PLAY
COST EFFICIENCY & SIMPLICITY
DIGITAL TRANSFORMATION OF CUSTOMER FACING PROCESSES
ALL-IP TRANSFORMATION PAN-EUROPEAN NETWORK INTEGRATED NETWORK STRATEGY
Vectoring
LTE roll-out
Optical fiber
Hybrid access Hybrid device
2
3
4
1

GROUP STRATEGY COST AnD PORTfOLIO TRAnSfORMATIOn LEAD In bUSInESS SUPERIOR PRODUCTIOn MODEL EUROPE GERMAnY T-MObILE USA fInAnCE
ALL IP TRAnSfORMATIOn: THE CREATIOn Of A SIMPLIfIED AnD STAnDARDIzED nETwORK
ALL IP PAnnET InS
FROM THE “OLD PSTN WORLD”… …TO THE “NEW IP ERA”
PSTN
Fixed Consumer
Carrier Mobile Consumer
Fixed Carrier Mobile
Virtualized Service Platforms
Infrastructure Cloud
NG IP Network (BNG/TeraStream)
Mobile Access Fixed Access Hybrid
CPE SIM
Fixed Consumer
Carrier Mobile Consumer
6

GROUP STRATEGY COST AnD PORTfOLIO TRAnSfORMATIOn LEAD In bUSInESS SUPERIOR PRODUCTIOn MODEL EUROPE GERMAnY T-MObILE USA fInAnCE
ALL-IP TRAnSfORMATIOn On TRACK
Remaining fixed access lines and expected completion dates
Total fixed access lines YE 2014
IP access lines YE2014
Macedonia
Slovakia
Croatia
Montenegro
Romania
Hungary
Greece
Europe1
Germany2
Jan 15th, 2014 237 237 (100%)
EoY 2014 894 894 (100%)
EoY 2015 1,076 843 (78%) 233
EoY 2015 149 87 (58%) 62
EoY 2018 2,239 301 (13%) 1,938
EoY 2016 1,645 968 (59%) 677
EoY 2018 2,624 15 (1%) 2,609
EoY 2018 9,033 3,486 (39%) 5,547
EoY 2018 23,427 5,805 (25%) 17,622
ALL IP PAnnET InS
ALL-IP TRANSFORMATION BY COUNTRY
Customer numbers in thd.
1 Incl. Czech Republic (131thd. fixed lines, 98% IP), and GTS (37thd. fixed lines, 32% IP) 2 Incl. retail, Call&Surf via Funk, wholesale bundled and unbundled
7

GROUP STRATEGY COST AnD PORTfOLIO TRAnSfORMATIOn LEAD In bUSInESS SUPERIOR PRODUCTIOn MODEL EUROPE GERMAnY T-MObILE USA fInAnCE
PAnnET TARGET PICTURE 2020+: fROM nATCO-CEnTRIC TO InTEGRATED PAn EUROPEAn SERvICE PRODUCTIOn
ALL IP PAnnET InS
TODAY FUTURE
Different, historically grown production in each NatCo
Complex service production with distributed vendor- specific network elements
Each NatCo with own product development logic
Integrated production, delivered to all NatCos
Highly simplified, virtualized, IP-based production architecture
One common product development logic for all countries
8

GROUP STRATEGY COST AnD PORTfOLIO TRAnSfORMATIOn LEAD In bUSInESS SUPERIOR PRODUCTIOn MODEL EUROPE GERMAnY T-MObILE USA fInAnCE
Executed in radically lean way IP+ Optical Integration to lower Capex & Opex Scalable up to the highest bandwidth
Based on SDN concept Software flexibility of previously HW dominated operator Standardized open interfaces Accelerated product introduction
REAL-TIME NETWORK AND SERVICE MANAGEMENT
DRASTICALLY SIMPLIFIED IP NETWORK (BNG/TERASTREAM)
DIffEREnTIATIOn: HOLISTIC AnD RADICALLY LEAn APPROACH AT DT
IP network BNG/TeraStream
SDN Realtime Network & Service Management
Infrastructure Cloud NFV
Tight integration of data centers and IP network = Infrastructure Cloud, foundation for NFV
Fully automated – = Cloudification of network functions
Minimized latency High bandwidth apps
HOLISTIC APPROACH
SUCCESSfULLY TESTED ALL ELEMEnTS
ALL IP PAnnET InS
INFRASTRUCTURE CLOUD
9

GROUP STRATEGY COST AnD PORTfOLIO TRAnSfORMATIOn LEAD In bUSInESS SUPERIOR PRODUCTIOn MODEL EUROPE GERMAnY T-MObILE USA fInAnCE
ALL IP PAnnET InS
Network & Services
PAnnET: SIMPLIfIED, CEnTRALIzED AnD vIRTUALIzED
fragmented, specific HW/SW boxes per functionality and service
Virtualized Network Functions & Services
HW Computing Storage Networking
Virtual Computing Storage Networking
OSS / Network and Service Management
Real-time Network &
Service Management
Core & Edge Routers
Access Network
Customer Equipment
BSS Customer Processes
centralized
decoupling
LEGACY, HETEROGENEOUS, DISTRIBUTED WORLD… …TOWARDS A LEAN AND CLOUDIFIED APPROACH
10

GROUP STRATEGY COST AnD PORTfOLIO TRAnSfORMATIOn LEAD In bUSInESS SUPERIOR PRODUCTIOn MODEL EUROPE GERMAnY T-MObILE USA fInAnCE
PHYSICAL InfRASTRUCTURE Of PAnnET
With PANNET we leverage the benefits of our portfolio
illustrative, locations and number of backend data and network operations
centers not decided yet
ALL IP PAnnET InS
DT EU PORTFOLIO: BROAD & ADJACENT FOOTPRINT IN EUROPE
PANNET characteristics: 3 backend data centers ( )
2 geo redundant network operations centers ( )
In each country minimum 2 data centers with routers at the edge of the network ( )
1 distribution network, fast and highly capable
11

GROUP STRATEGY COST AnD PORTfOLIO TRAnSfORMATIOn LEAD In bUSInESS SUPERIOR PRODUCTIOn MODEL EUROPE GERMAnY T-MObILE USA fInAnCE
LOCAL PRODUCT COnfIGURATIOn: CEnTRAL PRODUCTIOn CATALOGUE
Countries
Central Production Catalogue
OTT services
Standard Def.
High Definition
ADSL 16 Mbps
Vectoring 100 Mbps
Fiber 1 Gbps
One standard line
HD voice
Multiple lines
Country A
Country B
Country C
ALL IP PAnnET InS
VOICE BROADBAND TV
illustrative
12

GROUP STRATEGY COST AnD PORTfOLIO TRAnSfORMATIOn LEAD In bUSInESS SUPERIOR PRODUCTIOn MODEL EUROPE GERMAnY T-MObILE USA fInAnCE
MwC 2015: CLOUD Tv & GAMInG
First time B2C products introduced at the same time in three countries TV, gaming and applications on all screens
Cross-country recommendation engine Your personalized guide through media world
Cloud gaming with premium catalog of casual and bestseller games
Hundreds of games just out of cloud with no console
ALL IP PAnnET InS
13

GROUP STRATEGY COST AnD PORTfOLIO TRAnSfORMATIOn LEAD In bUSInESS SUPERIOR PRODUCTIOn MODEL EUROPE GERMAnY T-MObILE USA fInAnCE
First B2B product introduced at the same time in three countries Next generation DATA Virtual Private Network (VPN) for secure national and international communication
MwC 2015: nExT GEnERATIOn vPn
DELIvERInG A vPn SOLUTIOn fROM THE PAn-EUROPEAn CLOUD developed in less than 6 months
SIMPLICITY AnD SELf MAnAGEMEnT of all aspects of the network (speed, security, no of branches, traffic...)
AUTOMATIC PROvISIOnInG of system components in a few clicks
CARRIER GRADE SECURITY for all your branches and remote users by the same strong security mechanisms
ALL IP PAnnET InS
14
GROUP STRATEGY COST AnD PORTfOLIO TRAnSfORMATIOn LEAD In bUSInESS SUPERIOR PRODUCTIOn MODEL EUROPE GERMAnY T-MObILE USA fInAnCE
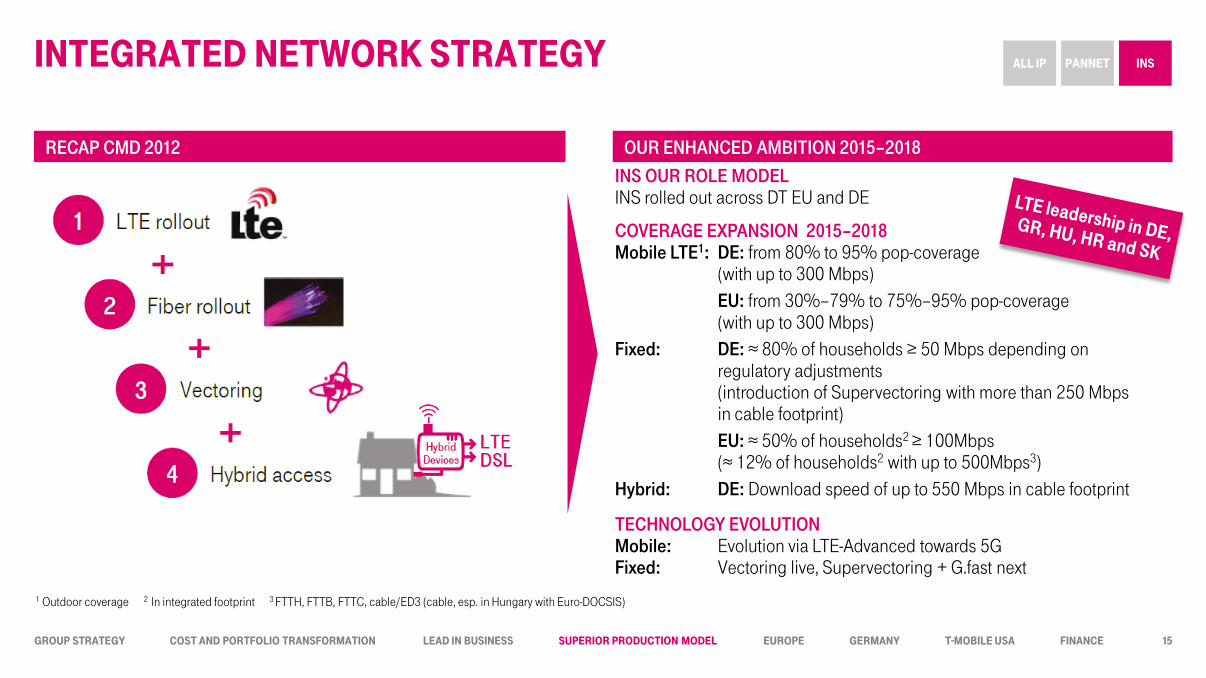
InTEGRATED nETwORK STRATEGY
INS OUR ROLE MODEL INS rolled out across DT EU and DE
TECHNOLOGY EVOLUTION Mobile: Evolution via LTE-Advanced towards 5G Fixed: Vectoring live, Supervectoring + G.fast next
1 Outdoor coverage 2 In integrated footprint 3 FTTH, FTTB, FTTC, cable/ED3 (cable, esp. in Hungary with Euro-DOCSIS)
RECAP CMD 2012 OUR ENHANCED AMBITION 2015–2018
ALL IP PAnnET InS
COVERAGE EXPANSION 2015–2018 Mobile LTE1: DE: from 80% to 95% pop-coverage (with up to 300 Mbps) EU: from 30%–79% to 75%–95% pop-coverage (with up to 300 Mbps) Fixed: DE: ≈ 80% of households ≥ 50 Mbps depending on regulatory adjustments (introduction of Supervectoring with more than 250 Mbps in cable footprint) EU: ≈ 50% of households2 ≥ 100Mbps
(≈ 12% of households2 with up to 500Mbps3) Hybrid: DE: Download speed of up to 550 Mbps in cable footprint
15

GROUP STRATEGY COST AnD PORTfOLIO TRAnSfORMATIOn LEAD In bUSInESS SUPERIOR PRODUCTIOn MODEL EUROPE GERMAnY T-MObILE USA fInAnCE
x 5–6
x 12
approx. x 25 Single RAN
Cell Coordination
Advanced Antennas
Self Optimizing Network
5G
Antennas (4x4)
Carrier Aggregation
LTE@20MHz
≥1Gbps
600Mbps
300Mbps
150Mbps
Small Cells
LTE (20+20MHz)
LTE (20MHz)
UMTS
MOBILE NETWORK UPGRADE OPTIONS
MObILE EvOLUTIOn COnTInUES ALL IP PAnnET InS
16

GROUP STRATEGY COST AnD PORTfOLIO TRAnSfORMATIOn LEAD In bUSInESS SUPERIOR PRODUCTIOn MODEL EUROPE GERMAnY T-MObILE USA fInAnCE
FIXED
fIbER EvOLUTIOn COnTInUES
ADSL2+
FTTC – Super VDSL-Vectoring
Fiber Copper
up to 16 Mbps
with more than 250 Mbps
1000+ Mbps
up to 500 Mbps
FTTC – VDSL-Vectoring up to 100 Mbps
FTTdp1/FTTB – G.fast
FTTH
CO
CO
dp1 CO
Fiber B
H
1 “Distribution Point”, so far not part of the Telekom access network
ALL IP PAnnET InS
17

GROUP STRATEGY COST AnD PORTfOLIO TRAnSfORMATIOn LEAD In bUSInESS SUPERIOR PRODUCTIOn MODEL EUROPE GERMAnY T-MObILE USA fInAnCE
PSTN migration in all NatCos PSTn
MIGRATIOn
Centralized architecture and production platforms
PAn nET
ALL-IP TRANSFORMATION PAN-EUROPEAN NETWORK INTEGRATED NETWORK STRATEGY
Vectoring
LTE roll-out
Optical fiber
Hybrid access
2
3
4
1
Hybrid device
ULTIMATE APP All service and usage relevant information at glance Proactively offering data plans following customer usage patterns One-click payment for all fixed and mobile services
HYbRID ROUTER Boost bandwidth
in fixed and mobile networks for even better customer experience
CLOUD Tv & GAMInG CLOUD vPn Perceived “Zero” latency Products introduction in
a few weeks across entire footprint
bROADbAnD On DEMAnD Plug & play Self service solutions Instant provisioning of
new features
SUPERIOR PRODUCTIOn MODEL DRIvInG CUSTOMER ExPERIEnCE
Examples
ALL IP PAnnET InS
18

GROUP STRATEGY COST AnD PORTfOLIO TRAnSfORMATIOn LEAD In bUSInESS SUPERIOR PRODUCTIOn MODEL EUROPE GERMAnY T-MObILE USA fInAnCE
SIGnIfICAnT InvESTMEnTS InTO TRAnSfORMATIOn YIELD SUPERIOR DIffEREnTIATIOn AnD COST SAvInGS In THE fUTURE
19
2013 2014 2015 2016 2017 2018 2019
0.8
Segments
≈ €0.7 bn Germany ≈ €0.5 bn Europe
Functional Areas
≈ €0.4 bn Technology / Platforms ≈ €0.8 bn Service
FIN. BENEFITS: ≈ €1.2 BILLION OPEX SAVINGS2
BENEFITS STEADY STATE FROM EARLY 2020IES
Enlarged fiber and LTE footprint and increased bandwidth for customers
Faster time to market
Easy to partner
COMMERCIAL BENEFITS
€ bn
2015 2014 2017 2018
1.3
2016
Capex
OPEX AND CAPEX: DIGITAL TRANSFORMATION, IP TRANSFORMATION, PAN-EUROPEAN NETWORK1
illustrative
CAPEX: INS NETWORK
€ bn
1 Excl. special factors. Measure related effects incl. savings. PanNet w/o transport & access. INS Opex in German fixed network also included . 2 Gross measure-related steady state Opex savings early 2020ies GER/EU vs. 2013, after accomplished IP and process-/e-transformation as well as PanNet (w/o transport & access) before any counter effects (e.g. personnel cost increases).

GROUP STRATEGY COST AnD PORTfOLIO TRAnSfORMATIOn LEAD In bUSInESS SUPERIOR PRODUCTIOn MODEL EUROPE GERMAnY T-MObILE USA fInAnCE
MID TERM AMbITIOn LEvEL
20

GROUP STRATEGY COST AnD PORTfOLIO TRAnSfORMATIOn LEAD In bUSInESS SUPERIOR PRODUCTIOn MODEL EUROPE GERMAnY T-MObILE USA fInAnCE
MID TERM AMbITIOn LEvEL ALL IP PAnnET InS
1 Depending on regulatory adjustments
MID TERM AMBITION LEVEL YEAR
ALL-IP TRANSFORMATION All integrated countries 100% IP-based
2018
PAN-EUROPEAN NETWORK
Backend and frontend data center set up
Geo-redundant Network Operations Centers established
Services fully migrated to PanNet
2018
2018
2018
INTEGRATED NETWORK STRATEGY
LTE pop-coverage Germany & Europe: 75%–95%
Germany: ≈ 80% Fixed high speed internet HH coverage ≥ 50 Mbps1
Europe: ≈ 50% Fixed high speed internet HH coverage ≥ 100 Mbps
2018
2018
2018
21

GROUP STRATEGY COST AnD PORTfOLIO TRAnSfORMATIOn LEAD In bUSInESS SUPERIOR PRODUCTIOn MODEL EUROPE GERMAnY T-MObILE USA fInAnCE
DEMOnSTRATIOn
Significant increase in down- and upload speed
Bonding of fixed and mobile connectivity
VDSL-Vectoring rollout
Upgraded street cabinet with new active technology (MSAN) complementing the old passive patch board
Factor of miniaturization: 2,600x
New IMS rack vs. legacy PSTN/ISDN cabinet
Simplification of network architecture
Instant provisioning enhances customer experience
HYBRID ROUTER UPGRADED STREET CABINET ALL-IP MIGRATION BNG + INSTANT PROVISIONING
Presented by: Claudia Nemat, Board member for Europe and Technology
ALL IP PANNET INS ALL IP PANNET INS ALL IP PANNET INS ALL IP PANNET INS
Presented by: Bruno Jacobfeuerborn, Group CTO
Presented by: Guido Menzel, Head of Network Engineering Germany
Presented by: Bruno Orth, Head of Network Architecture Germany
1 2 3 4
22