Deutsche Bank Roadshow Stefan Krause · Deutsche Bank Roadshow Stefan Krause Chief Financial...
45
Roadshow February / March 2012 Deutsche Bank Investor Relations financial transparency. Deutsche Bank Deutsche Bank Roadshow Stefan Krause Chief Financial Officer February / March 2012
Transcript of Deutsche Bank Roadshow Stefan Krause · Deutsche Bank Roadshow Stefan Krause Chief Financial...

RoadshowFebruary / March 2012
Deutsche BankInvestor Relations
financial transparency.
Deutsche Bank
Deutsche Bank RoadshowStefan KrauseChief Financial Officer
February / March 2012
RoadshowFebruary / March 2012
Deutsche BankInvestor Relations
financial transparency.
1 Overview
2
Agenda
2
3 Capital, funding and liquidity
FY2011 / 4Q2011 results
RoadshowFebruary / March 2012
Deutsche BankInvestor Relations
financial transparency.
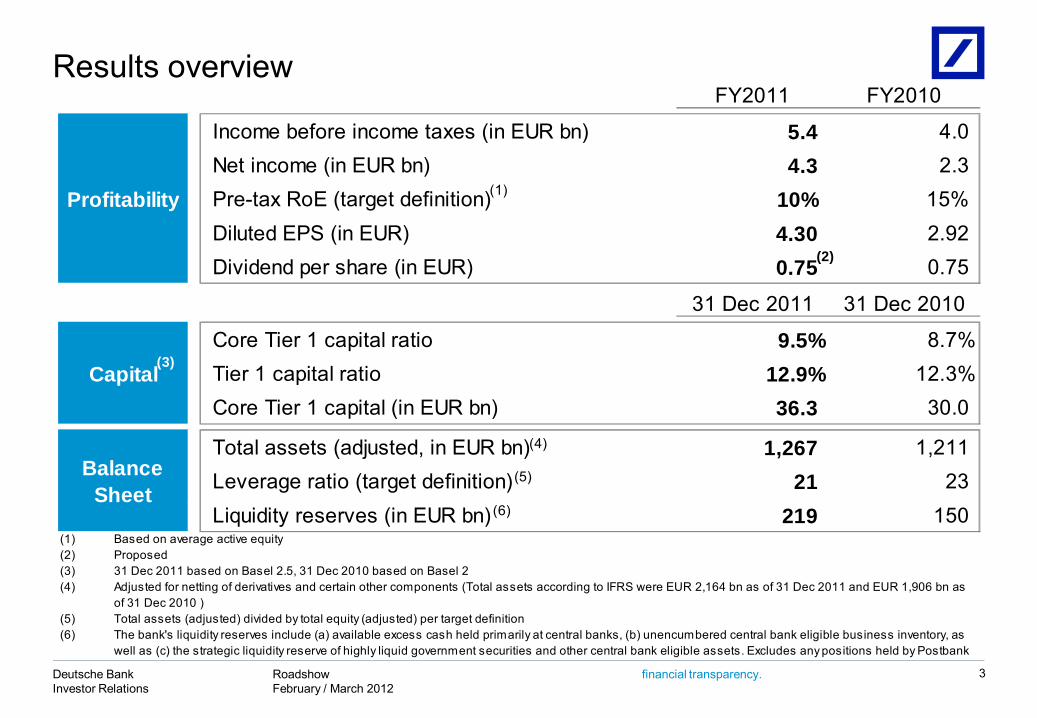
FY2011 FY2010
Income before income taxes (in EUR bn) 5.4 4.0Net income (in EUR bn) 4.3 2.3Pre-tax RoE (target definition) 10% 15%Diluted EPS (in EUR) 4.30 2.92Dividend per share (in EUR) 0.75 0.75
31 Dec 2011 31 Dec 2010
Core Tier 1 capital ratio 9.5% 8.7%Tier 1 capital ratio 12.9% 12.3%Core Tier 1 capital (in EUR bn) 36.3 30.0
Total assets (adjusted, in EUR bn) 1,267 1,211Leverage ratio (target definition) 21 23Liquidity reserves (in EUR bn) 219 150
(1)(2)(3)(4)
(5)(6) The bank's liquidity reserves include (a) available excess cash held primarily at central banks, (b) unencumbered central bank eligible business inventory, as
well as (c) the strategic liquidity reserve of highly liquid government securities and other central bank eligible assets. Excludes any positions held by Postbank
Capital
Profitability
Total assets (adjusted) divided by total equity (adjusted) per target definition
Balance Sheet
Proposed31 Dec 2011 based on Basel 2.5, 31 Dec 2010 based on Basel 2Adjusted for netting of derivatives and certain other components (Total assets according to IFRS were EUR 2,164 bn as of 31 Dec 2011 and EUR 1,906 bn as of 31 Dec 2010 )
Based on average active equity
(1)
(5)
(6)
(4)
(3)
(2)
Results overview
3
RoadshowFebruary / March 2012
Deutsche BankInvestor Relations
financial transparency.
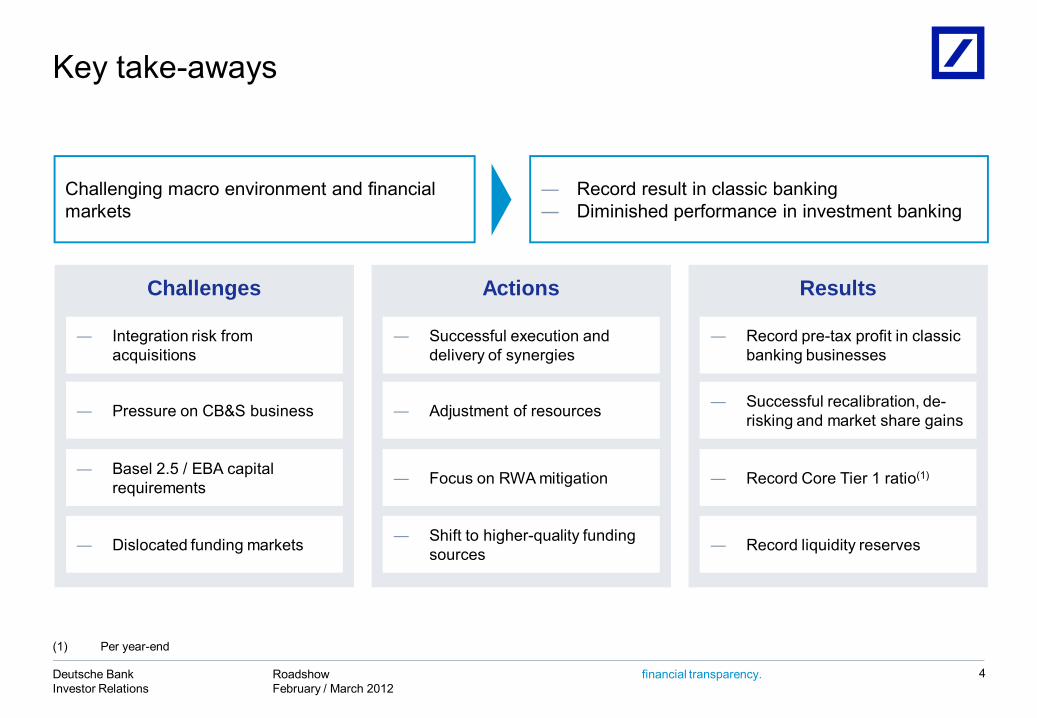
Key take-aways
4
Challenging macro environment and financial markets
― Record result in classic banking― Diminished performance in investment banking
Challenges
― Basel 2.5 / EBA capital requirements
― Dislocated funding markets
Actions
― Focus on RWA mitigation
― Shift to higher-quality funding sources
Results
― Integration risk from acquisitions
― Successful execution and delivery of synergies
― Record pre-tax profit in classic banking businesses
― Pressure on CB&S business ― Adjustment of resources ― Successful recalibration, de-risking and market share gains
― Record Core Tier 1 ratio(1)
― Record liquidity reserves
(1) Per year-end
RoadshowFebruary / March 2012
Deutsche BankInvestor Relations
financial transparency. 5
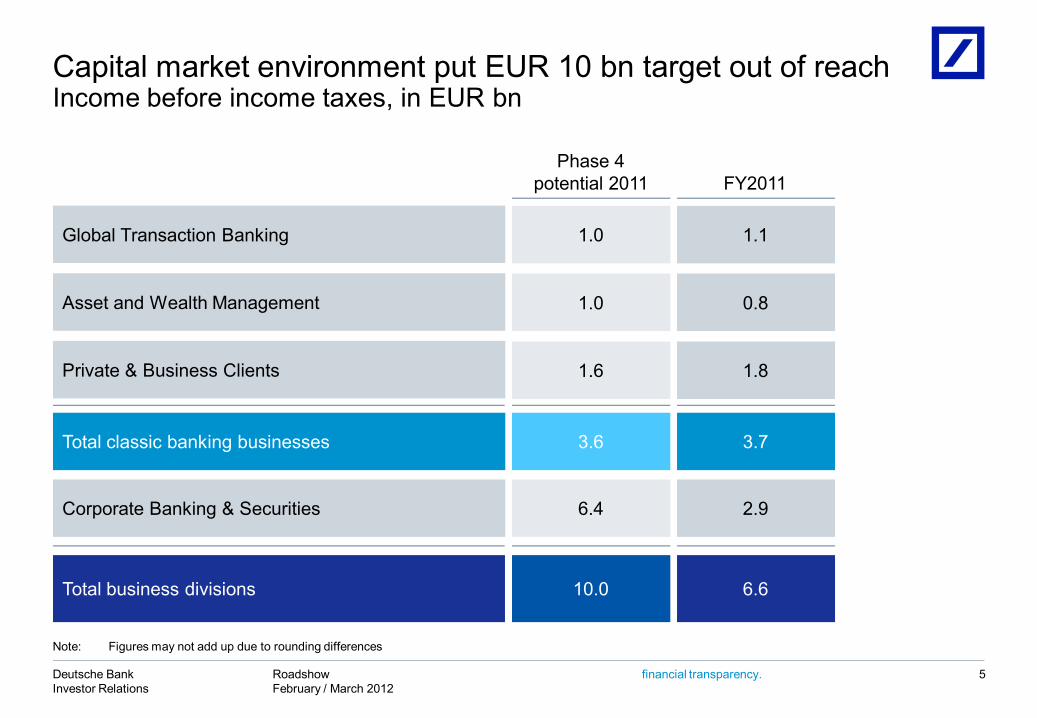
Note: Figures may not add up due to rounding differences
Phase 4potential 2011 FY2011
Private & Business Clients 1.6 1.8
Global Transaction Banking 1.0 1.1
Corporate Banking & Securities 6.4 2.9
Total business divisions 10.0 6.6
Asset and Wealth Management 1.0 0.8
Total classic banking businesses 3.6 3.7
Capital market environment put EUR 10 bn target out of reachIncome before income taxes, in EUR bn
RoadshowFebruary / March 2012
Deutsche BankInvestor Relations
financial transparency.
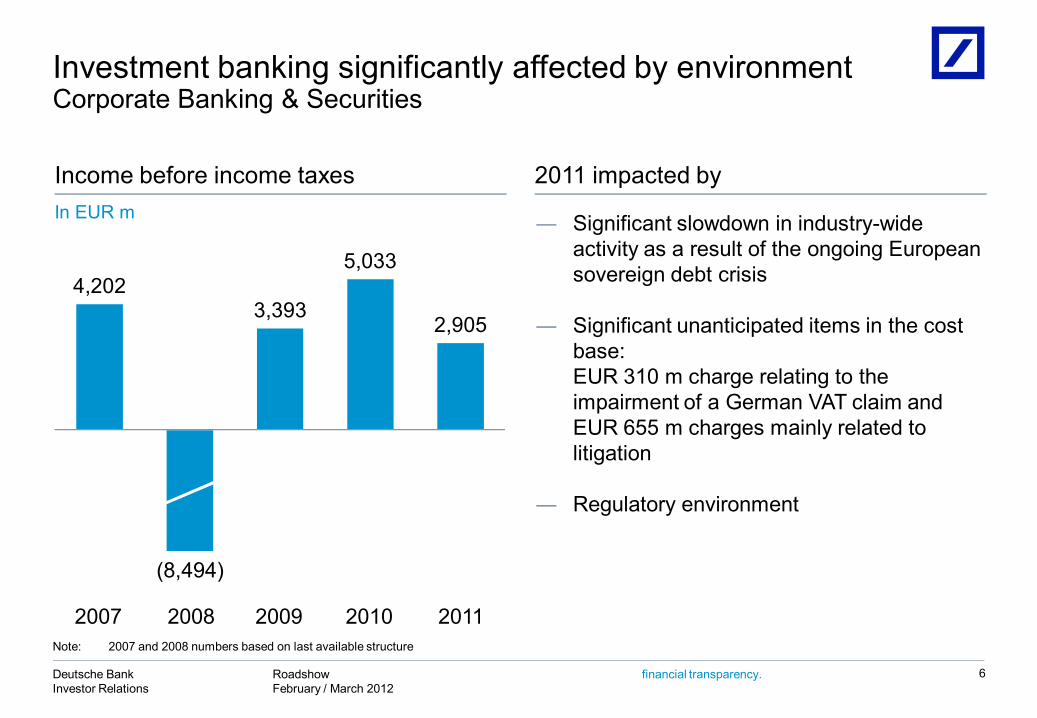
Investment banking significantly affected by environmentCorporate Banking & Securities
6
4,2023,393
5,033
2,905
Income before income taxesIn EUR m
2011 impacted by
― Significant slowdown in industry-wide activity as a result of the ongoing European sovereign debt crisis
― Significant unanticipated items in the cost base: EUR 310 m charge relating to the impairment of a German VAT claim and EUR 655 m charges mainly related to litigation
― Regulatory environment
(8,494)
2007 2008 2009 2010 2011Note: 2007 and 2008 numbers based on last available structure
RoadshowFebruary / March 2012
Deutsche BankInvestor Relations
financial transparency.
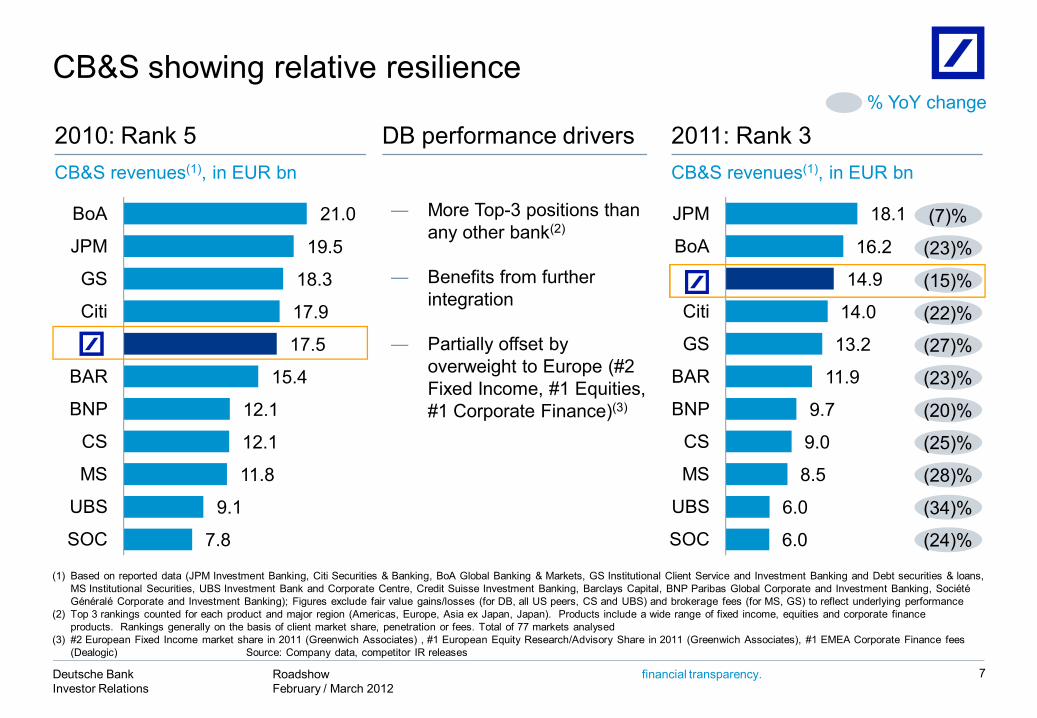
CB&S showing relative resilience
2010: Rank 5
(1) Based on reported data (JPM Investment Banking, Citi Securities & Banking, BoA Global Banking & Markets, GS Institutional Client Service and Investment Banking and Debt securities & loans, MS Institutional Securities, UBS Investment Bank and Corporate Centre, Credit Suisse Investment Banking, Barclays Capital, BNP Paribas Global Corporate and Investment Banking, SociétéGénéralé Corporate and Investment Banking); Figures exclude fair value gains/losses (for DB, all US peers, CS and UBS) and brokerage fees (for MS, GS) to reflect underlying performance
(2) Top 3 rankings counted for each product and major region (Americas, Europe, Asia ex Japan, Japan). Products include a wide range of fixed income, equities and corporate finance products. Rankings generally on the basis of client market share, penetration or fees. Total of 77 markets analysed
(3) #2 European Fixed Income market share in 2011 (Greenwich Associates) , #1 European Equity Research/Advisory Share in 2011 (Greenwich Associates), #1 EMEA Corporate Finance fees (Dealogic) Source: Company data, competitor IR releases
CB&S revenues(1), in EUR bn
21.0
19.5
18.3
17.9
17.5
15.4
12.1
12.1
11.8
9.1
7.8
BoA
JPM
GS
Citi
BAR
BNP
CS
MS
UBS
SOC
2011: Rank 3CB&S revenues(1), in EUR bn
18.1
16.2
14.9
14.0
13.2
11.9
9.7
9.0
8.5
6.0
6.0
JPM
BoA
Citi
GS
BAR
BNP
CS
MS
UBS
SOC
(7)%
% YoY change
(23)%
(15)%
(22)%
(27)%
(23)%
DB performance drivers
7
― More Top-3 positions than any other bank(2)
― Benefits from further integration
― Partially offset by overweight to Europe (#2 Fixed Income, #1 Equities, #1 Corporate Finance)(3) (20)%
(25)%
(28)%
(34)%
(24)%
RoadshowFebruary / March 2012
Deutsche BankInvestor Relations
financial transparency.
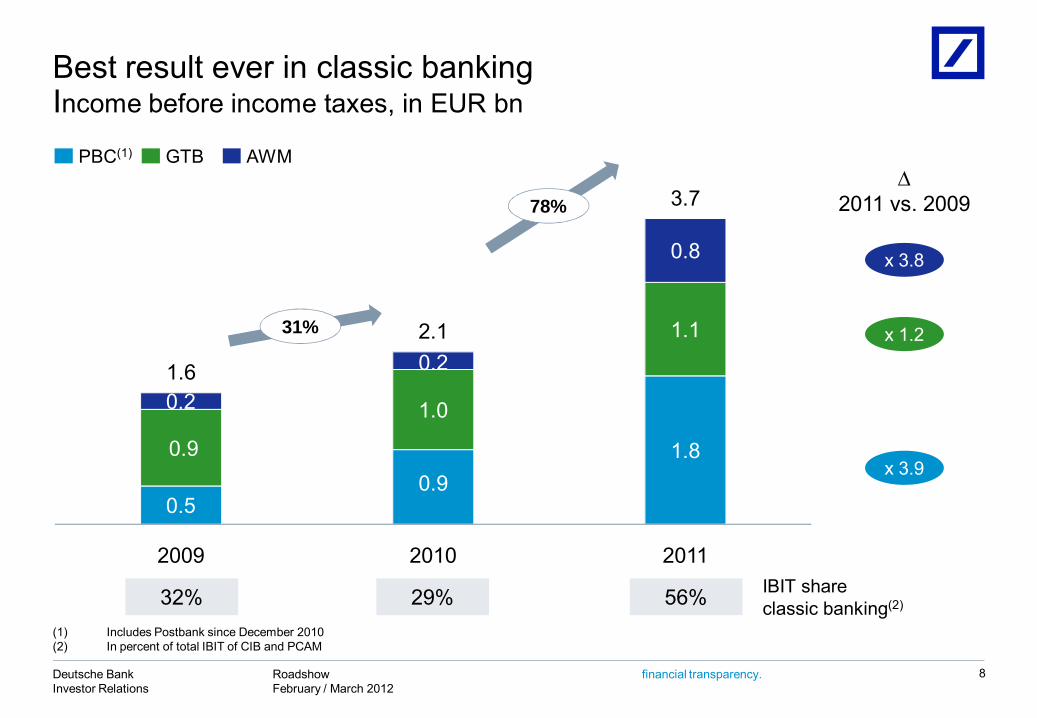
Best result ever in classic bankingIncome before income taxes, in EUR bn
AWMPBC(1) GTB
0.5 0.9
1.8 0.9
1.0
1.1
0.2
0.2
0.8
2009 2010 2011
1.6
2.1
3.7
(2)
(3)
31%
78%
2011 vs. 2009
x 3.8
x 1.2
x 3.9
32% 29% 56% IBIT shareclassic banking(2)
8
(1) Includes Postbank since December 2010(2) In percent of total IBIT of CIB and PCAM
RoadshowFebruary / March 2012
Deutsche BankInvestor Relations
financial transparency.
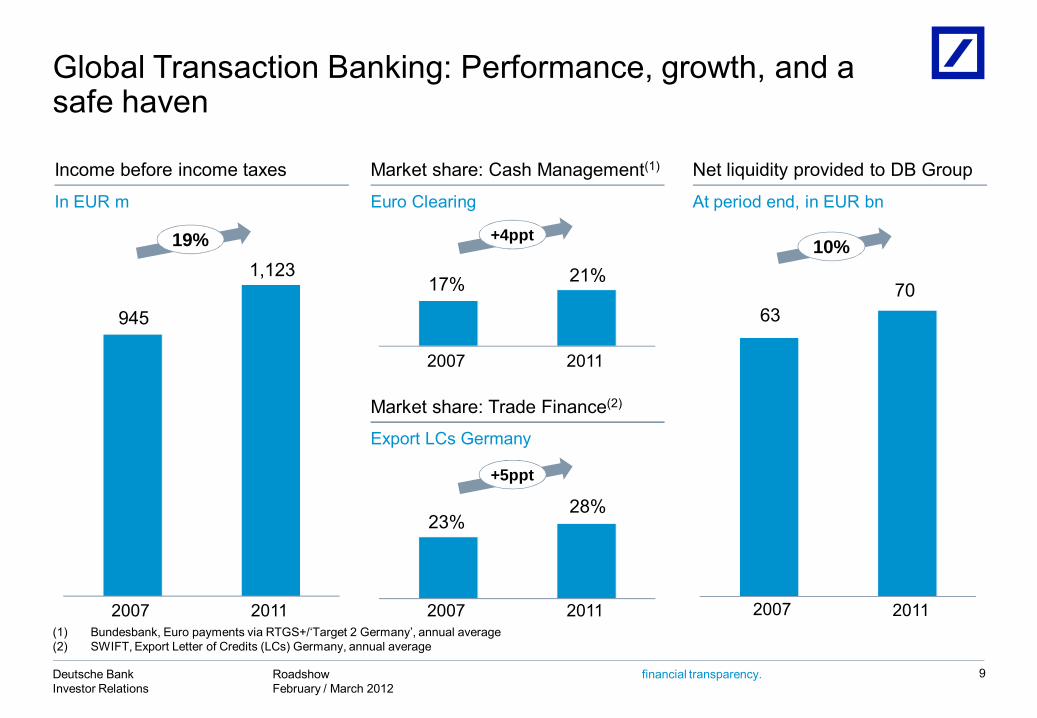
6370
945
1,123
Global Transaction Banking: Performance, growth, and a safe haven
9
Market share: Cash Management(1)
Euro Clearing
Income before income taxes
In EUR m
23%28%
20112007
19%
20112007
Net liquidity provided to DB Group
At period end, in EUR bn
20112007
10%
17% 21%
20112007
Market share: Trade Finance(2)
Export LCs Germany
+4ppt
+5ppt
(1) Bundesbank, Euro payments via RTGS+/‘Target 2 Germany’, annual average(2) SWIFT, Export Letter of Credits (LCs) Germany, annual average

RoadshowFebruary / March 2012
Deutsche BankInvestor Relations
financial transparency.
Asset Management: Under strategic review
10
646
446
2007 2011
Income before income taxesin EUR m
Invested assets
119
45
157
172
49
Deutsche Insurance Asset Management
DB Advisors Under strategic review
31 Dec 2011
in EUR bn
RoadshowFebruary / March 2012
Deutsche BankInvestor Relations
financial transparency.
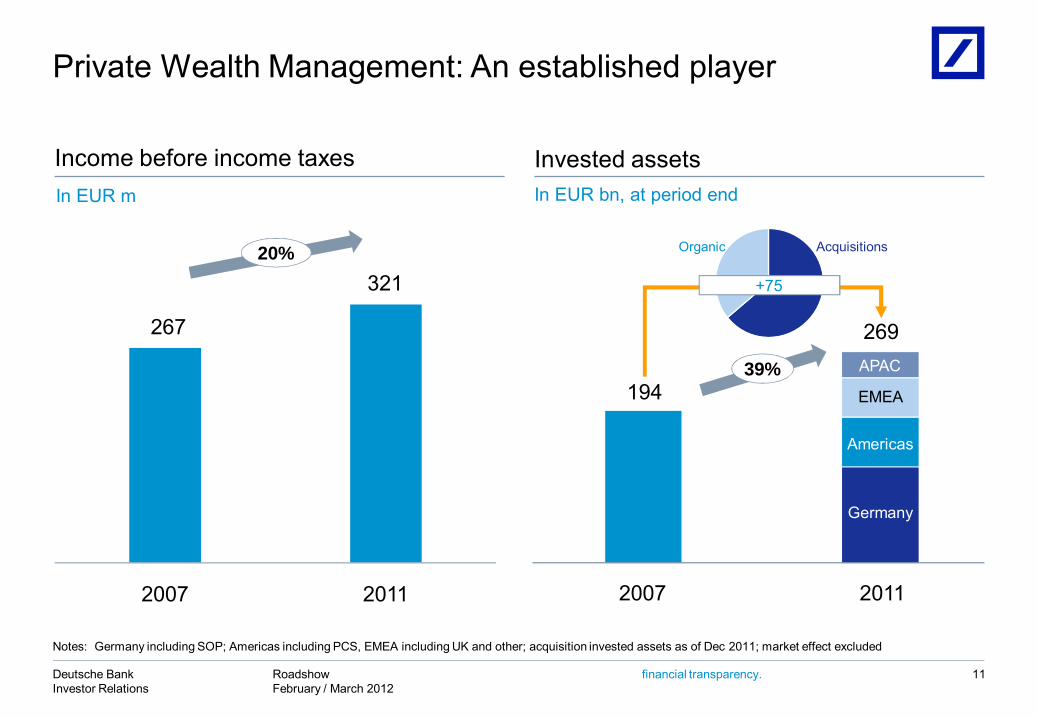
Private Wealth Management: An established player
11
Income before income taxes Invested assets
267
321
2007 2011
+75
194
269
Organic Acquisitions
39%
Germany
Americas
EMEA
APAC
20%
In EUR m In EUR bn, at period end
2007 2011
Notes: Germany including SOP; Americas including PCS, EMEA including UK and other; acquisition invested assets as of Dec 2011; market effect excluded
RoadshowFebruary / March 2012
Deutsche BankInvestor Relations
financial transparency.
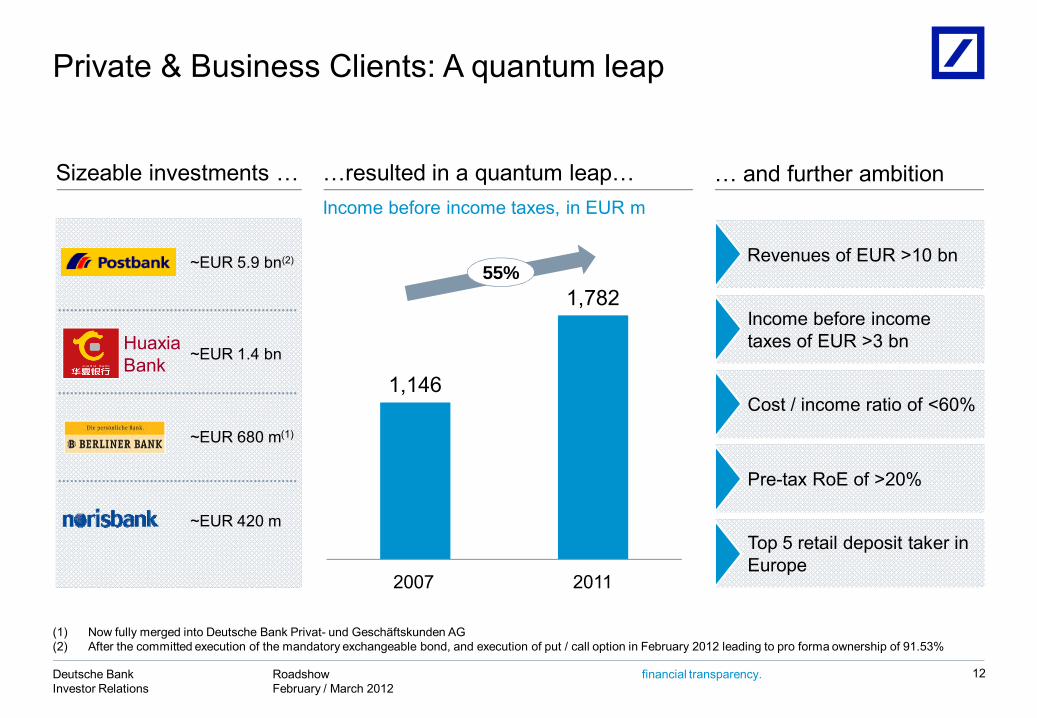
Private & Business Clients: A quantum leap
~EUR 1.4 bn
12
Sizeable investments … …resulted in a quantum leap… … and further ambition
HuaxiaBank
Revenues of EUR >10 bn
Income before income taxes of EUR >3 bn
Cost / income ratio of <60%
Pre-tax RoE of >20%
Top 5 retail deposit taker in Europe
Income before income taxes, in EUR m
~EUR 5.9 bn(2)
~EUR 420 m
~EUR 680 m(1)
1,146
1,78255%
2007 2011
(1) Now fully merged into Deutsche Bank Privat- und Geschäftskunden AG(2) After the committed execution of the mandatory exchangeable bond, and execution of put / call option in February 2012 leading to pro forma ownership of 91.53%
RoadshowFebruary / March 2012
Deutsche BankInvestor Relations
financial transparency.
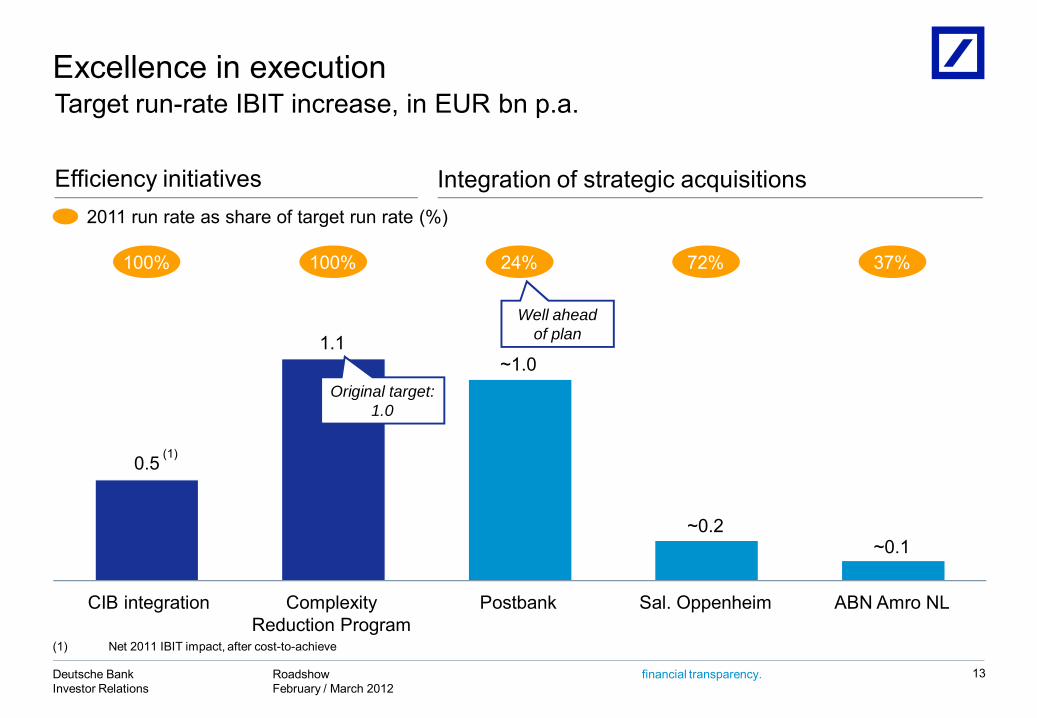
0.5
1.1
CIB integration Sal. OppenheimPostbank
~1.0
Complexity Reduction Program
~0.2
ABN Amro NL
~0.1
Excellence in execution
13
2011 run rate as share of target run rate (%)
100% 100% 24% 72% 37%
Original target:1.0
Integration of strategic acquisitionsEfficiency initiatives
Target run-rate IBIT increase, in EUR bn p.a.
(1) Net 2011 IBIT impact, after cost-to-achieve
(1)
Well aheadof plan

RoadshowFebruary / March 2012
Deutsche BankInvestor Relations
financial transparency.
1 Overview
2
Agenda
14
3 Capital, funding and liquidity
FY2011 / 4Q2011 results
RoadshowFebruary / March 2012
Deutsche BankInvestor Relations
financial transparency.
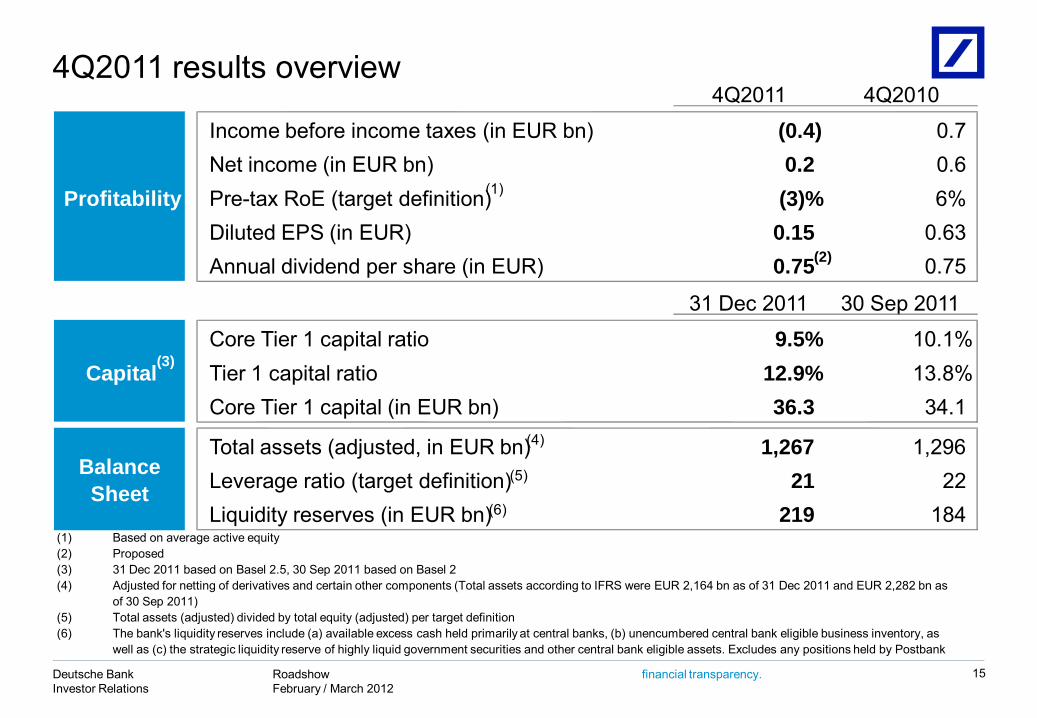
4Q2011 4Q2010
Income before income taxes (in EUR bn) (0.4) 0.7Net income (in EUR bn) 0.2 0.6Pre-tax RoE (target definition) (3)% 6%Diluted EPS (in EUR) 0.15 0.63Annual dividend per share (in EUR) 0.75 0.75
31 Dec 2011 30 Sep 2011
Core Tier 1 capital ratio 9.5% 10.1%Tier 1 capital ratio 12.9% 13.8%Core Tier 1 capital (in EUR bn) 36.3 34.1
Total assets (adjusted, in EUR bn) 1,267 1,296Leverage ratio (target definition) 21 22Liquidity reserves (in EUR bn) 219 184
(1)(2)(3)(4)
(5)(6)
Balance Sheet
Capital
Profitability
The bank's liquidity reserves include (a) available excess cash held primarily at central banks, (b) unencumbered central bank eligible business inventory, as well as (c) the strategic liquidity reserve of highly liquid government securities and other central bank eligible assets. Excludes any positions held by Postbank
Proposed31 Dec 2011 based on Basel 2.5, 30 Sep 2011 based on Basel 2Adjusted for netting of derivatives and certain other components (Total assets according to IFRS were EUR 2,164 bn as of 31 Dec 2011 and EUR 2,282 bn as of 30 Sep 2011)Total assets (adjusted) divided by total equity (adjusted) per target definition
Based on average active equity
(2)
(4)
(5)
(6)
(3)
(1)
4Q2011 results overview
15
RoadshowFebruary / March 2012
Deutsche BankInvestor Relations
financial transparency.
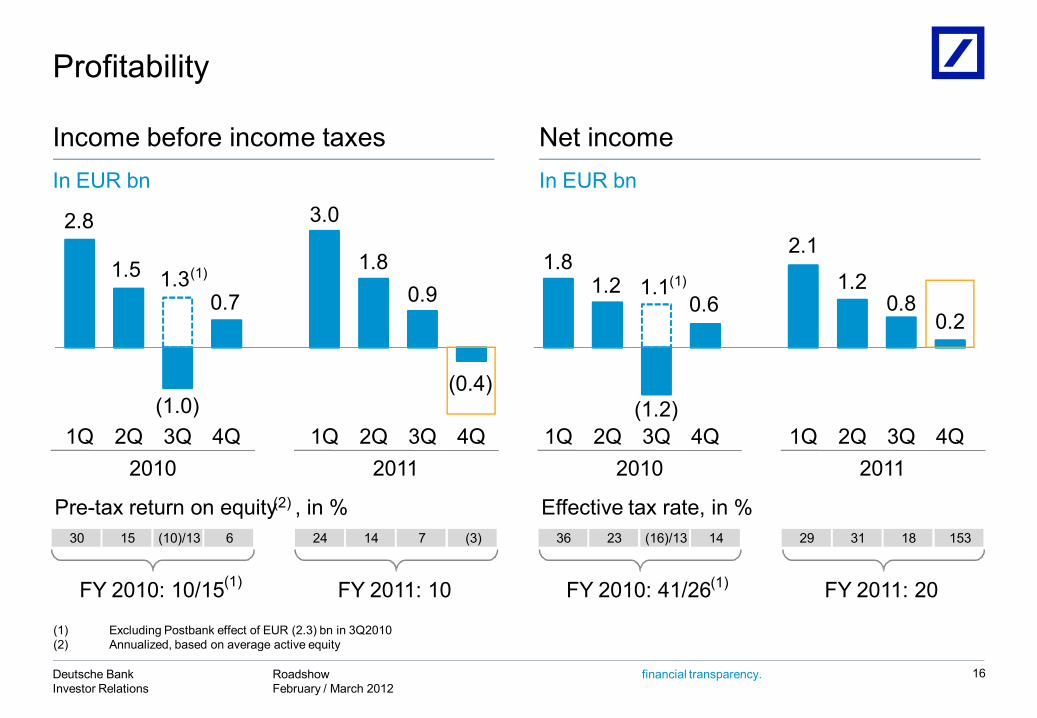
(1) 1.8 1.2
(1.2)
0.6
2.1
1.2 0.8
0.2 1.1
1Q 2Q 3Q 4Q 1Q 2Q 3Q 4Q
Profitability
16
2.8
1.5
(1.0)
0.7
3.0
1.8 0.9
(0.4)
1.3
1Q 2Q 3Q 4Q 1Q 2Q 3Q 4Q
Income before income taxes Net incomeIn EUR bn In EUR bn
(1)
(1) Excluding Postbank effect of EUR (2.3) bn in 3Q2010(2) Annualized, based on average active equity
(1) (1)30 15 (10)/13 6 24 14 7 (3) 36 23 (16)/13 14 29 31 18 153
2011
Effective tax rate, in %
FY 2010: 41/26 FY 2011: 20
2010 2011
Pre-tax return on equity , in %
FY 2010: 10/15 FY 2011: 10
2010
(1) (1)
(2)
RoadshowFebruary / March 2012
Deutsche BankInvestor Relations
financial transparency.
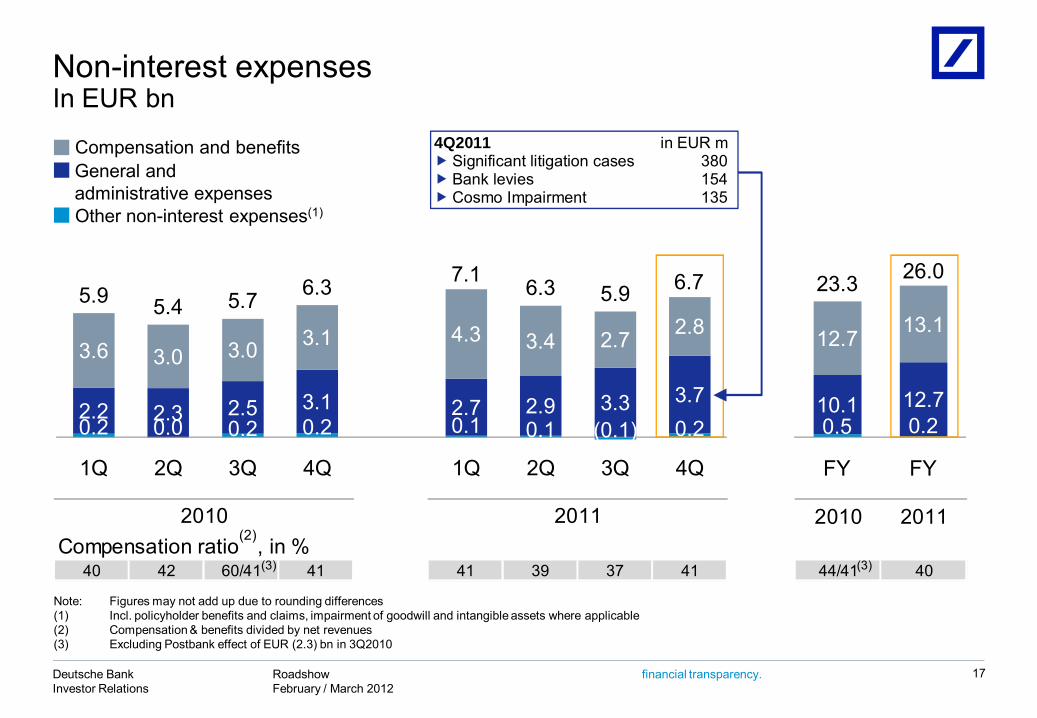
Note: Figures may not add up due to rounding differences(1) Incl. policyholder benefits and claims, impairment of goodwill and intangible assets where applicable(2) Compensation & benefits divided by net revenues(3) Excluding Postbank effect of EUR (2.3) bn in 3Q2010
Non-interest expenses In EUR bn
17
Compensation and benefits General andadministrative expensesOther non-interest expenses(1)
0.2 0.0 0.2 0.2 0.1 0.1 (0.1) 0.2 2.2 2.3 2.5 3.1 2.7 2.9 3.3 3.7
3.6 3.0 3.0 3.1 4.3 3.4 2.7 2.8 5.9 5.4 5.7 6.3 7.1 6.3 5.9 6.7
1Q 2Q 3Q 4Q 1Q 2Q 3Q 4Q
0.5 0.2 10.1 12.7
12.7 13.1
23.3 26.0
FY FY
2010 2011
40 42 60/41 41 41 39 37 41 44/41 40
2010 2011Compensation ratio , in %(2)
(3) (3)
4Q2011 in EUR m Significant litigation cases 380 Bank levies 154 Cosmo Impairment 135
RoadshowFebruary / March 2012
Deutsche BankInvestor Relations
financial transparency.
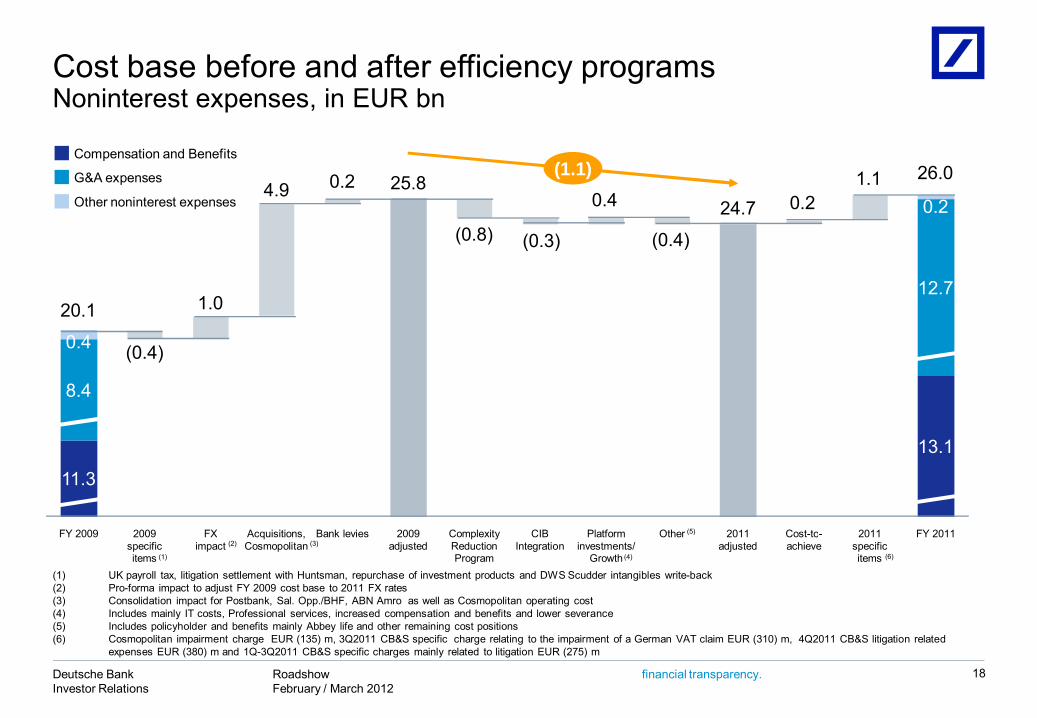
Cost base before and after efficiency programsNoninterest expenses, in EUR bn
18
(0.4)
1.0
4.9 0.2
(0.8) (0.3)
0.4
(0.4)
0.21.1
11.3
13.1
8.4
12.7
0.4
0.2
20.1
25.824.7
26.0
FY 2009 2009specificitems
FXimpact
Acquisitions, Cosmopolitan
Bank levies 2009adjusted
Complexity Reduction Program
CIBIntegration
Platforminvestments/
Growth
Other 2011 adjusted
Cost-to-achieve
2011specificitems
FY 2011
G&A expenses
(1)
(1) UK payroll tax, litigation settlement with Huntsman, repurchase of investment products and DWS Scudder intangibles write-back(2) Pro-forma impact to adjust FY 2009 cost base to 2011 FX rates (3) Consolidation impact for Postbank, Sal. Opp./BHF, ABN Amro as well as Cosmopolitan operating cost(4) Includes mainly IT costs, Professional services, increased compensation and benefits and lower severance(5) Includes policyholder and benefits mainly Abbey life and other remaining cost positions(6) Cosmopolitan impairment charge EUR (135) m, 3Q2011 CB&S specific charge relating to the impairment of a German VAT claim EUR (310) m, 4Q2011 CB&S litigation related
expenses EUR (380) m and 1Q-3Q2011 CB&S specific charges mainly related to litigation EUR (275) m
(2)
Compensation and Benefits
(3)
(1.1)
(4)
Other noninterest expenses
(5)
(6)
RoadshowFebruary / March 2012
Deutsche BankInvestor Relations
financial transparency.
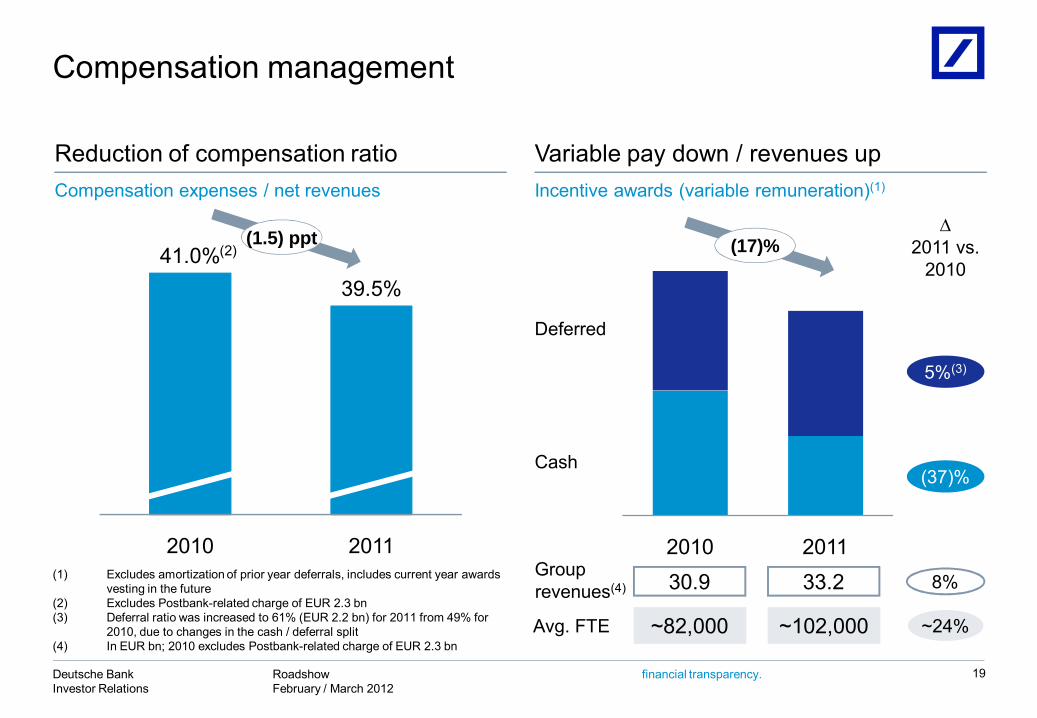
Compensation management
19
Reduction of compensation ratioCompensation expenses / net revenues
Variable pay down / revenues upIncentive awards (variable remuneration)(1)
41.0%39.5%
2010 2011 2010 2011
Cash
Deferred
∆ 2011 vs.
2010
Group revenues(4) 30.9 33.2(1) Excludes amortization of prior year deferrals, includes current year awards
vesting in the future(2) Excludes Postbank-related charge of EUR 2.3 bn(3) Deferral ratio was increased to 61% (EUR 2.2 bn) for 2011 from 49% for
2010, due to changes in the cash / deferral split(4) In EUR bn; 2010 excludes Postbank-related charge of EUR 2.3 bn
8%
(1.5) ppt (17)%
~24%Avg. FTE ~82,000 ~102,000
(2)
(37)%
5%(3)
RoadshowFebruary / March 2012
Deutsche BankInvestor Relations
financial transparency.
949
1,227
1,250
1,438
278
18847
402
1,274
1,839
Jan-DecJan-Dec
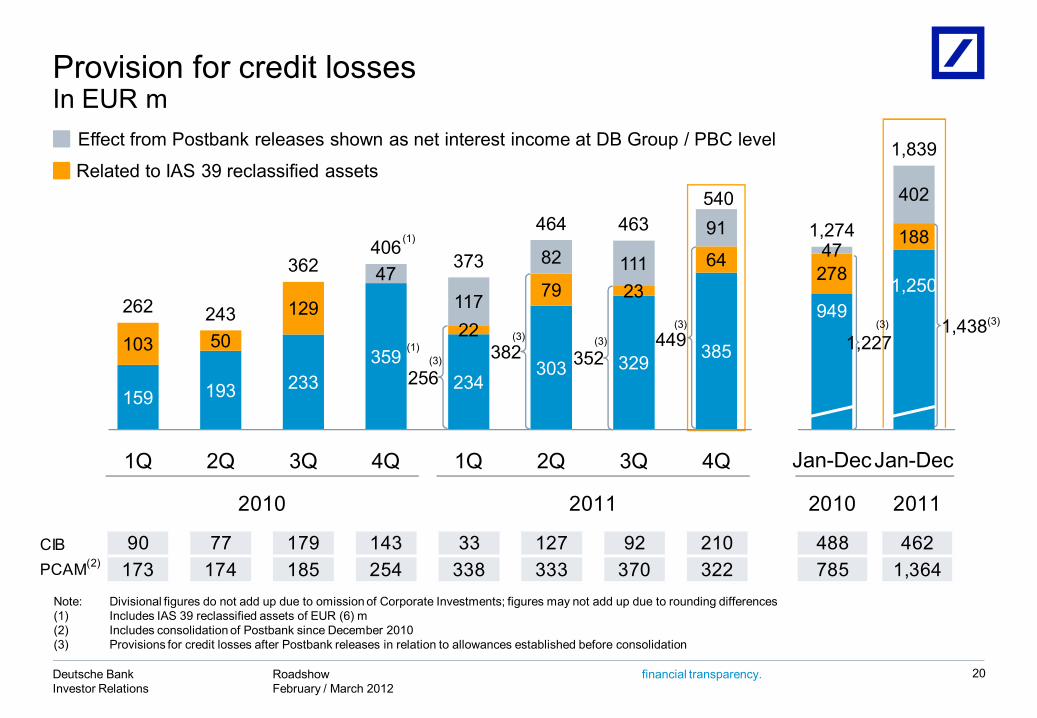
Provision for credit lossesIn EUR m
20
Note: Divisional figures do not add up due to omission of Corporate Investments; figures may not add up due to rounding differences(1) Includes IAS 39 reclassified assets of EUR (6) m(2) Includes consolidation of Postbank since December 2010(3) Provisions for credit losses after Postbank releases in relation to allowances established before consolidation
Related to IAS 39 reclassified assets
Effect from Postbank releases shown as net interest income at DB Group / PBC level
159 193 233359
256 234382
303 352 329449 385103 50
12922
79 23
6447
117
82 111
91
262 243
362406
373
464 463540
1Q 2Q 3Q 4Q 1Q 2Q 3Q 4Q
(3)
(3) (3)(3) (3)(3)
2010 2011
CIB 90 77 179 143 33 127 92 210 488 462PCAM(2) 173 174 185 254 338 333 370 322 785 1,364
2010 2011
(1)
(1)

RoadshowFebruary / March 2012
Deutsche BankInvestor Relations
financial transparency.
2,572
7721,087
603
2,287
969
70
(422)1Q 2Q 3Q 4Q 1Q 2Q 3Q 4Q
21
Corporate Banking & Securities
Performance in the Corporate and Investment BankIncome before income taxes, in EUR m
20112010
In EUR m 3Q2011 4Q2011
Specific charges (310) (380)(1)
(1) Material impacts including charge relating to the impairment of a German VAT claim as well as litigation charges(2) Negative goodwill (provisional at that time) from the commercial banking activities acquired from ABN AMRO in the Netherlands and consolidated since 2Q2010(3) Related to complexity reduction program and CIB integration; includes severance payments booked directly in GTB and allocations from infrastructure
277 116
130 137
485
227274 306
259 284
1Q 2Q 3Q 4Q 1Q 2Q 3Q 4Q
Global Transaction Banking
Negative goodwill(2)
4Q2010 efficiency measures(3)
20112010
RoadshowFebruary / March 2012
Deutsche BankInvestor Relations
financial transparency.
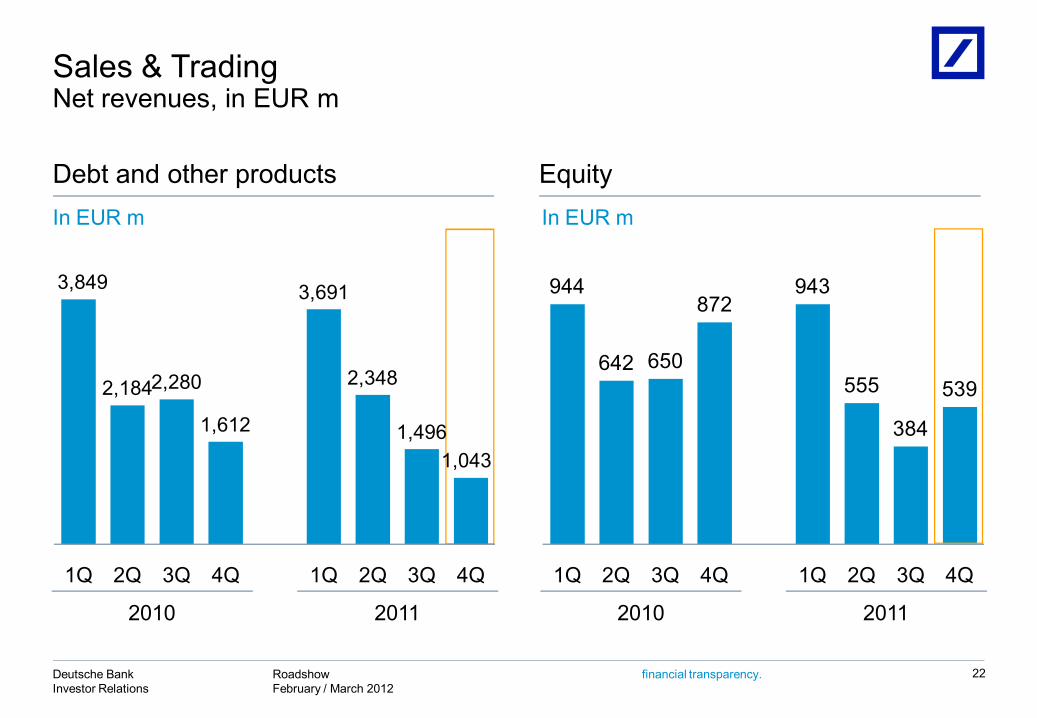
Debt and other products Equity
Sales & Trading Net revenues, in EUR m
22
In EUR m
3,849
2,1842,280
1,612
3,691
2,348
1,4961,043
1Q 2Q 3Q 4Q 1Q 2Q 3Q 4Q
20112010
In EUR m
944
642 650
872943
555
384
539
1Q 2Q 3Q 4Q 1Q 2Q 3Q 4Q
20112010
RoadshowFebruary / March 2012
Deutsche BankInvestor Relations
financial transparency.
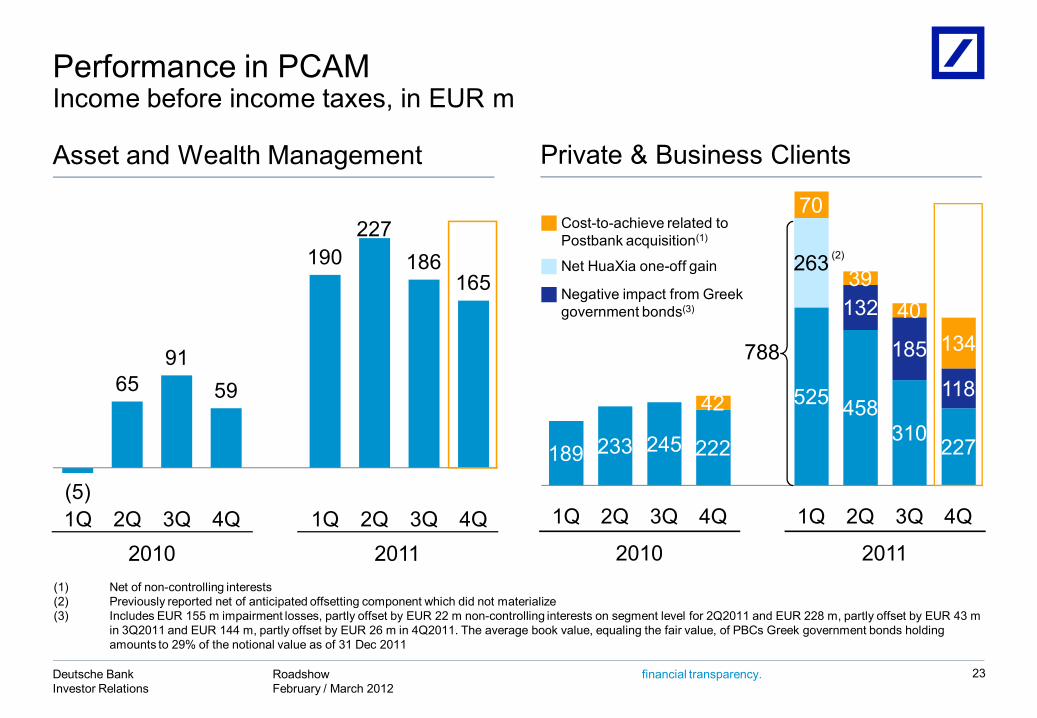
Performance in PCAMIncome before income taxes, in EUR m
23
(5)
6591
59
190227
186165
1Q 2Q 3Q 4Q 1Q 2Q 3Q 4Q
(1) Net of non-controlling interests(2) Previously reported net of anticipated offsetting component which did not materialize(3) Includes EUR 155 m impairment losses, partly offset by EUR 22 m non-controlling interests on segment level for 2Q2011 and EUR 228 m, partly offset by EUR 43 m
in 3Q2011 and EUR 144 m, partly offset by EUR 26 m in 4Q2011. The average book value, equaling the fair value, of PBCs Greek government bonds holding amounts to 29% of the notional value as of 31 Dec 2011
Asset and Wealth Management
20112010
189 233 245 222
788
525 458310 227
263
132
185
11842
70
3940
134
1Q 2Q 3Q 4Q 1Q 2Q 3Q 4Q
Private & Business Clients
Net HuaXia one-off gain
Negative impact from Greek government bonds(3)
Cost-to-achieve related to Postbank acquisition(1)
20112010
(2)

RoadshowFebruary / March 2012
Deutsche BankInvestor Relations
financial transparency.
ReportedIBIT
Impact from Greek
government bonds
Cost-to-achieve
related to Postbank
PPA Hua Xia AdjustedIBIT
1Q2011 231 (38) 2692Q2011 124 (42) (35) 2013Q2011 132 (11) (35) 1784Q2011 85 (9) (73) 167FY2011 572 (62) (180) 8141Q2011 298 263 352Q2011 105 1053Q2011 113 1134Q2011 51 51FY2011 567 263 3041Q2011 258 (32) 47 2442Q2011 229 (90) (4) 42 2813Q2011 65 (175) (5) 141 1044Q2011 90 (108) (62) 106 155FY2011 643 (373) (102) 335 7831Q2011 788 (70) 47 263 5472Q2011 458 (132) (39) 42 5873Q2011 310 (185) (40) 141 3944Q2011 227 (118) (134) 106 373FY2011 1,782 (435) (283) 335 263 1,901
Advisory Banking Germany
Advisory Banking International
Consumer Banking Germany
PBC
24
(1) Net regular FVA amortization
(1)
Private & Business Clients – business division performanceIn EUR m, post minorities
RoadshowFebruary / March 2012
Deutsche BankInvestor Relations
financial transparency.
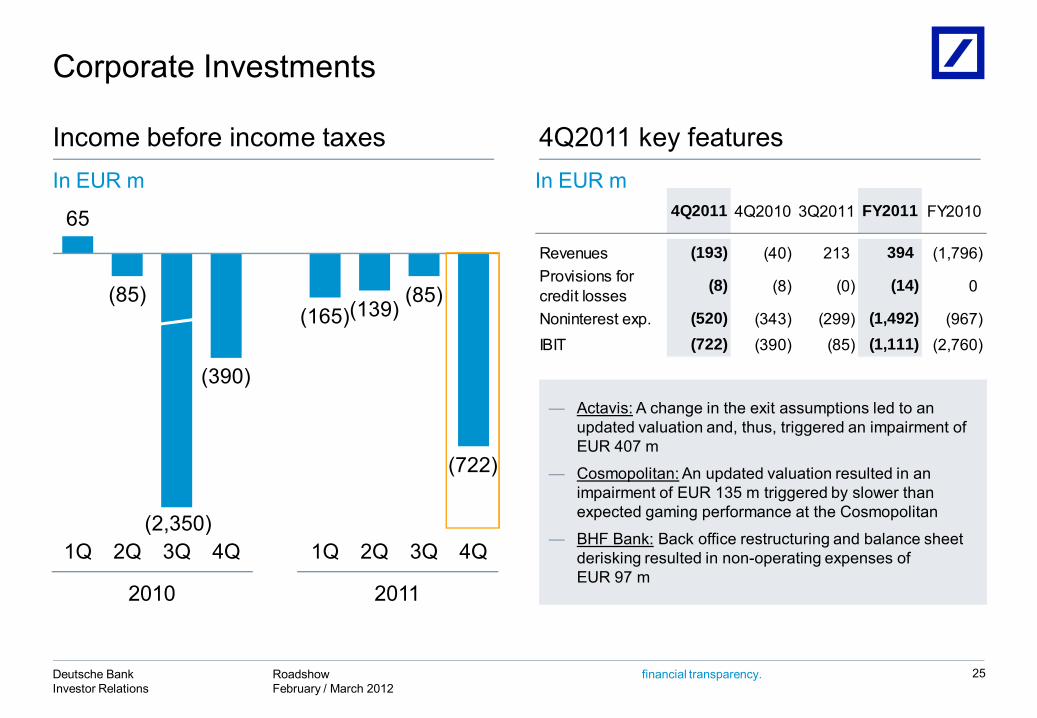
Corporate Investments
25
Income before income taxes 4Q2011 key featuresIn EUR m
20112010
65
(85)
(2,350)
(390)
(165)(139)(85)
(722)
1Q 2Q 3Q 4Q 1Q 2Q 3Q 4Q
4Q2011 4Q2010 3Q2011 FY2011 FY2010
Revenues (193) (40) 213 394 (1,796)Provisions for credit losses (8) (8) (0) (14) 0
Noninterest exp. (520) (343) (299) (1,492) (967)IBIT (722) (390) (85) (1,111) (2,760)
In EUR m
— Actavis: A change in the exit assumptions led to an updated valuation and, thus, triggered an impairment of EUR 407 m
— Cosmopolitan: An updated valuation resulted in an impairment of EUR 135 m triggered by slower thanexpected gaming performance at the Cosmopolitan
— BHF Bank: Back office restructuring and balance sheet derisking resulted in non-operating expenses ofEUR 97 m
RoadshowFebruary / March 2012
Deutsche BankInvestor Relations
financial transparency.
1 Overview
2
Agenda
26
3 Capital, funding and liquidity
FY2011 / 4Q2011 results
RoadshowFebruary / March 2012
Deutsche BankInvestor Relations
financial transparency.
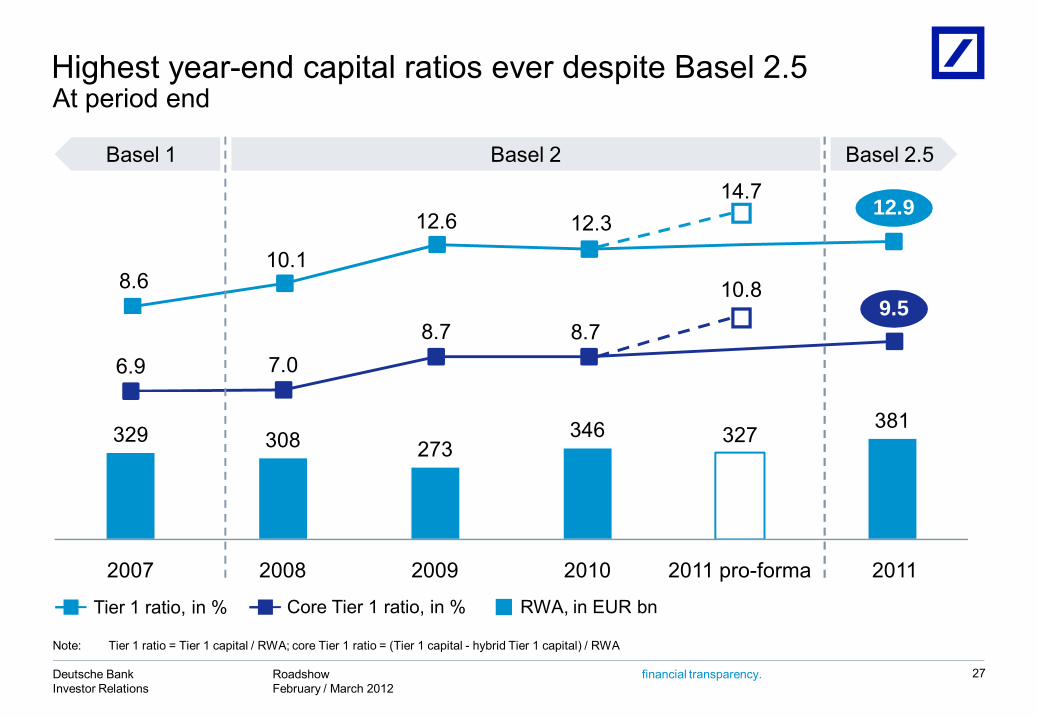
At period end
27
Note: Tier 1 ratio = Tier 1 capital / RWA; core Tier 1 ratio = (Tier 1 capital - hybrid Tier 1 capital) / RWA
Core Tier 1 ratio, in %Tier 1 ratio, in % RWA, in EUR bn
Highest year-end capital ratios ever despite Basel 2.5
Basel 2.5
8.610.1
12.6 12.3
6.9 7.08.7 8.7
329 308 273346 327
381
2007 2008 2009 2010 2011 pro-forma 2011
Basel 2Basel 1
12.9
9.5
14.7
10.8
RoadshowFebruary / March 2012
Deutsche BankInvestor Relations
financial transparency.
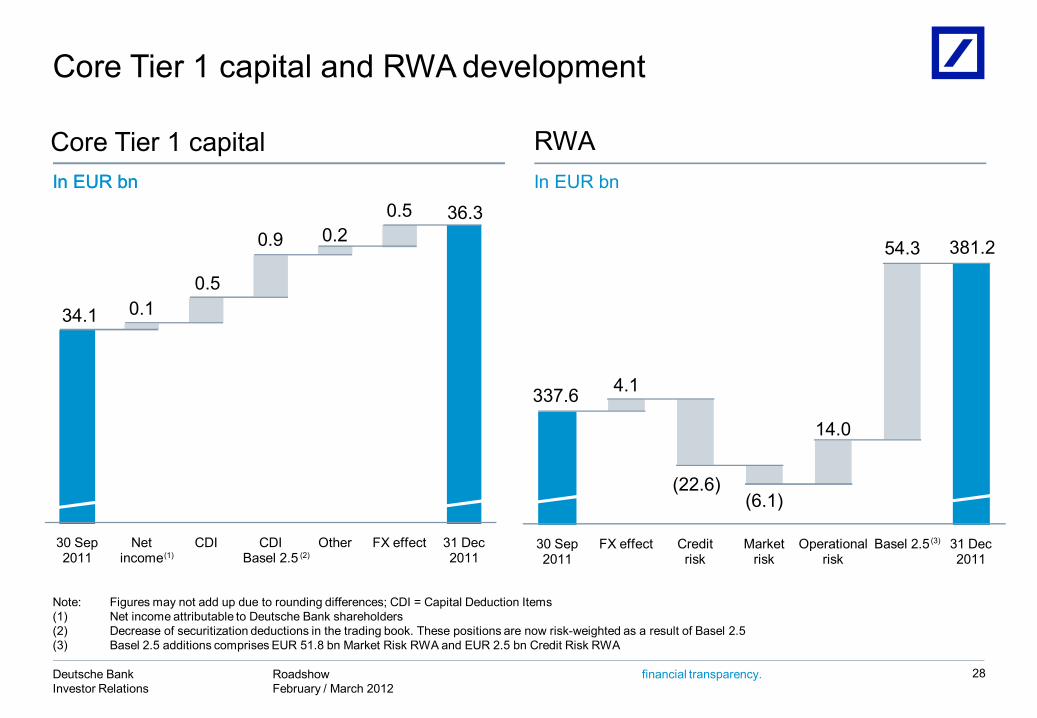
Core Tier 1 capital and RWA development
28
Core Tier 1 capitalIn EUR bn
RWAIn EUR bn
337.6 4.1
(22.6)(6.1)
14.0
54.3 381.2
30 Sep 2011
FX effect Creditrisk
Marketrisk
Operationalrisk
Basel 2.5 31 Dec 2011
(3)
In EUR bn
Note: Figures may not add up due to rounding differences; CDI = Capital Deduction Items(1) Net income attributable to Deutsche Bank shareholders(2) Decrease of securitization deductions in the trading book. These positions are now risk-weighted as a result of Basel 2.5(3) Basel 2.5 additions comprises EUR 51.8 bn Market Risk RWA and EUR 2.5 bn Credit Risk RWA
34.1 0.10.5
0.9 0.20.5 36.3
30 Sep 2011
Net income
CDI CDIBasel 2.5
Other FX effect 31 Dec 2011(1) (2)
RoadshowFebruary / March 2012
Deutsche BankInvestor Relations
financial transparency.
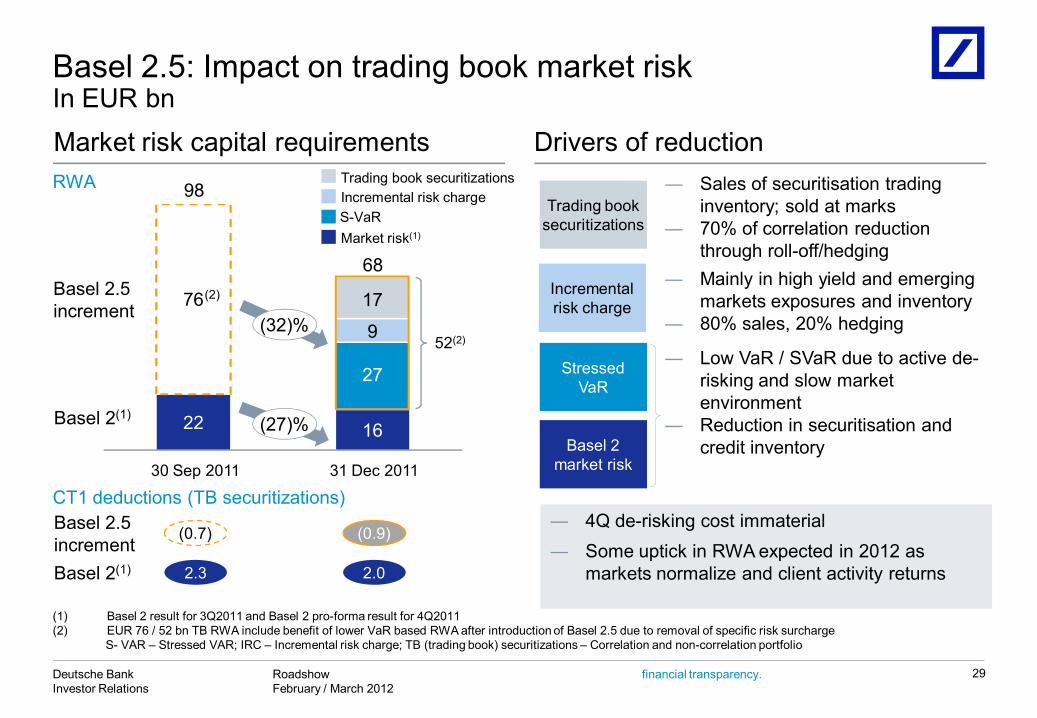
Basel 2.5: Impact on trading book market risk In EUR bn
(1) Basel 2 result for 3Q2011 and Basel 2 pro-forma result for 4Q2011(2) EUR 76 / 52 bn TB RWA include benefit of lower VaR based RWA after introduction of Basel 2.5 due to removal of specific risk surcharge
S- VAR – Stressed VAR; IRC – Incremental risk charge; TB (trading book) securitizations – Correlation and non-correlation portfolio
29
Market risk(1)
Trading book securitizationsIncremental risk chargeS-VaR
Basel 2(1) 22 16
76
31 Dec 2011
68
17
9
27
30 Sep 2011
98
Basel 2.5 increment
52(2)
― Sales of securitisation trading inventory; sold at marks
― 70% of correlation reduction through roll-off/hedging
Drivers of reductionMarket risk capital requirements
(32)%
(27)%
RWA
2.3 2.0
(0.9)(0.7)
Basel 2(1)
Basel 2.5 increment
CT1 deductions (TB securitizations)
(2)
Basel 2 market risk
Trading booksecuritizations
Incrementalrisk charge
Stressed VaR
― Mainly in high yield and emerging markets exposures and inventory
― 80% sales, 20% hedging
― Low VaR / SVaR due to active de-risking and slow market environment
― Reduction in securitisation and credit inventory
― 4Q de-risking cost immaterial― Some uptick in RWA expected in 2012 as
markets normalize and client activity returns
RoadshowFebruary / March 2012
Deutsche BankInvestor Relations
financial transparency.
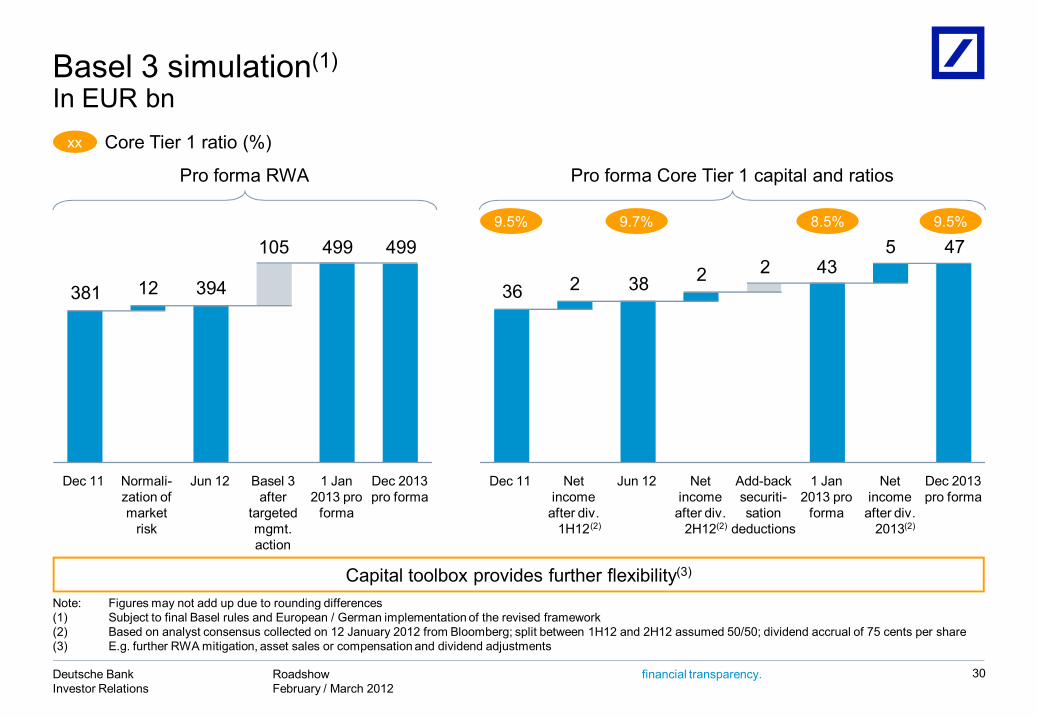
Basel 3 simulation(1)
In EUR bn
9.5% 8.5%
Note: Figures may not add up due to rounding differences(1) Subject to final Basel rules and European / German implementation of the revised framework(2) Based on analyst consensus collected on 12 January 2012 from Bloomberg; split between 1H12 and 2H12 assumed 50/50; dividend accrual of 75 cents per share(3) E.g. further RWA mitigation, asset sales or compensation and dividend adjustments
30
Pro forma Core Tier 1 capital and ratios
(2)
Pro forma RWA
381 12 394
105 499 499
Normali-zation of market
risk
Dec 11 Dec 2013 pro forma
1 Jan 2013 pro
forma
Basel 3 after
targeted mgmt. action
Jun 12
36 2 38 2 2 435 47
Dec 2013 pro forma
Net income
after div. 2013
1 Jan 2013 pro
forma
Add-back securiti-sation
deductions
Net income
after div. 2H12
Jun 12Net income
after div. 1H12
Dec 11
(2)
9.7%
Capital toolbox provides further flexibility(3)
9.5%
(2)
Core Tier 1 ratio (%)xx
RoadshowFebruary / March 2012
Deutsche BankInvestor Relations
financial transparency.
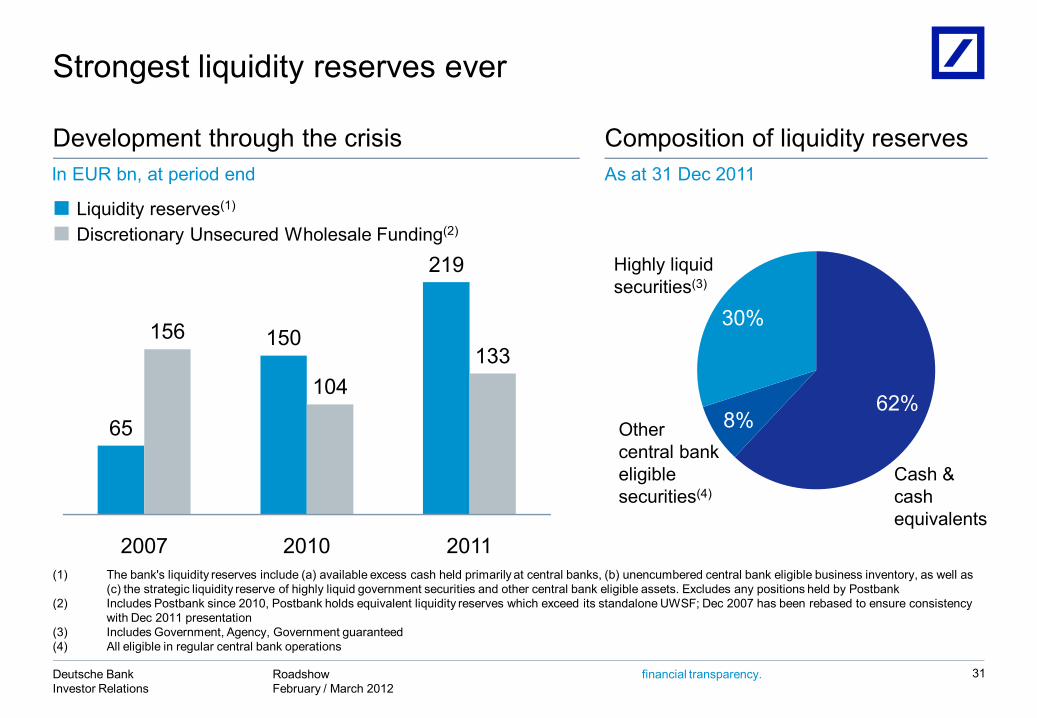
65
150
219
156
104133
2007 2010 2011
62%8%
30%
Strongest liquidity reserves ever
Development through the crisis Composition of liquidity reservesIn EUR bn, at period end
Liquidity reserves(1)
Discretionary Unsecured Wholesale Funding(2)
As at 31 Dec 2011
31
(1) The bank's liquidity reserves include (a) available excess cash held primarily at central banks, (b) unencumbered central bank eligible business inventory, as well as (c) the strategic liquidity reserve of highly liquid government securities and other central bank eligible assets. Excludes any positions held by Postbank
(2) Includes Postbank since 2010, Postbank holds equivalent liquidity reserves which exceed its standalone UWSF; Dec 2007 has been rebased to ensure consistency with Dec 2011 presentation
(3) Includes Government, Agency, Government guaranteed(4) All eligible in regular central bank operations
Cash & cash equivalents
Other central bank eligible securities(4)
Highly liquid securities(3)
RoadshowFebruary / March 2012
Deutsche BankInvestor Relations
financial transparency.
Prepared for challenges – prepared for performance
32
Transformed towards a more balanced, lower-risk business model
Strengthened footprints in PBC, PWM and GTB
Delivered execution excellence on acquisitions
Focused vigorously on high-quality liquidity and funding profile
Maintained high capital discipline
Deutsche Bank
Additional information
RoadshowFebruary / March 2012
Deutsche BankInvestor Relations
financial transparency.
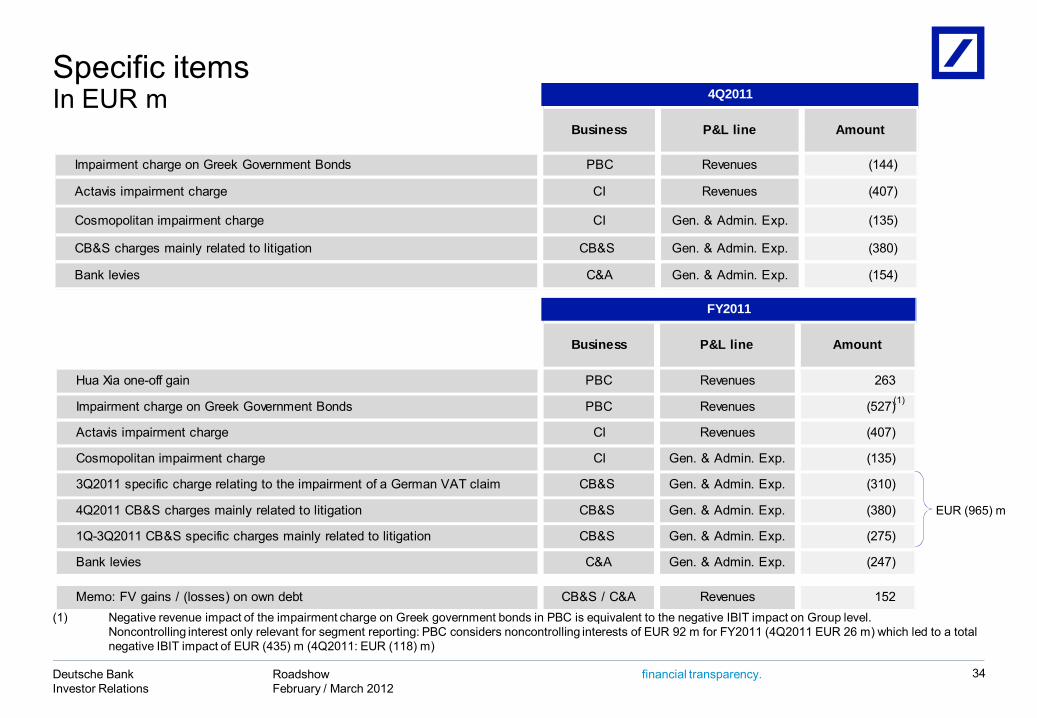
Hua Xia one-off gain PBC Revenues 263
Impairment charge on Greek Government Bonds PBC Revenues (527)
Actavis impairment charge CI Revenues (407)
Cosmopolitan impairment charge CI Gen. & Admin. Exp. (135)
3Q2011 specific charge relating to the impairment of a German VAT claim CB&S Gen. & Admin. Exp. (310)
4Q2011 CB&S charges mainly related to litigation CB&S Gen. & Admin. Exp. (380)
1Q-3Q2011 CB&S specific charges mainly related to litigation CB&S Gen. & Admin. Exp. (275)
Bank levies C&A Gen. & Admin. Exp. (247)
Memo: FV gains / (losses) on own debt CB&S / C&A Revenues 152
P&L line Amount
FY2011
Business
Impairment charge on Greek Government Bonds PBC Revenues (144)
Actavis impairment charge CI Revenues (407)
Cosmopolitan impairment charge CI Gen. & Admin. Exp. (135)
CB&S charges mainly related to litigation CB&S Gen. & Admin. Exp. (380)
Bank levies C&A Gen. & Admin. Exp. (154)
4Q2011
Business P&L line Amount
Specific itemsIn EUR m
34
(1)
EUR (965) m
(1) Negative revenue impact of the impairment charge on Greek government bonds in PBC is equivalent to the negative IBIT impact on Group level. Noncontrolling interest only relevant for segment reporting: PBC considers noncontrolling interests of EUR 92 m for FY2011 (4Q2011 EUR 26 m) which led to a total negative IBIT impact of EUR (435) m (4Q2011: EUR (118) m)

RoadshowFebruary / March 2012
Deutsche BankInvestor Relations
financial transparency.
Postbank PPA: Amortization outlook
35
CommentsFVA amortization pattern(1)
― Positive P&L mainly results from amortization of negative FVAs on investment securities and CRE portfolio potentially volatile amortization pattern
― Negative P&L mainly based on customer bank assets with long maturities mainly stable amortization pattern
Positive impact from amortization of negative FVAs
2011 2013 2014 2018(3)
Illustrative & simplified
Negative impact from amortization of positive FVAs
Net IBIT impact from amortization of FVAs(2)
1
2
3
1
2
― Net contribution turning negative due to differing timing of above mentioned amortization
Future one-off effects on Postbank level strongly affecting amortization pattern
Major part of PPA expected to be realized within ~7 years
3
[...]
~200
IBIT, in EUR m
~150~50 ~(50)
(1) Net regular FVA amortization(2) Based on current assumption, deviating pattern possible due to future one-off effects, post-minorities(3) Highest negative contribution of FVA amortization
2012
RoadshowFebruary / March 2012
Deutsche BankInvestor Relations
financial transparency.
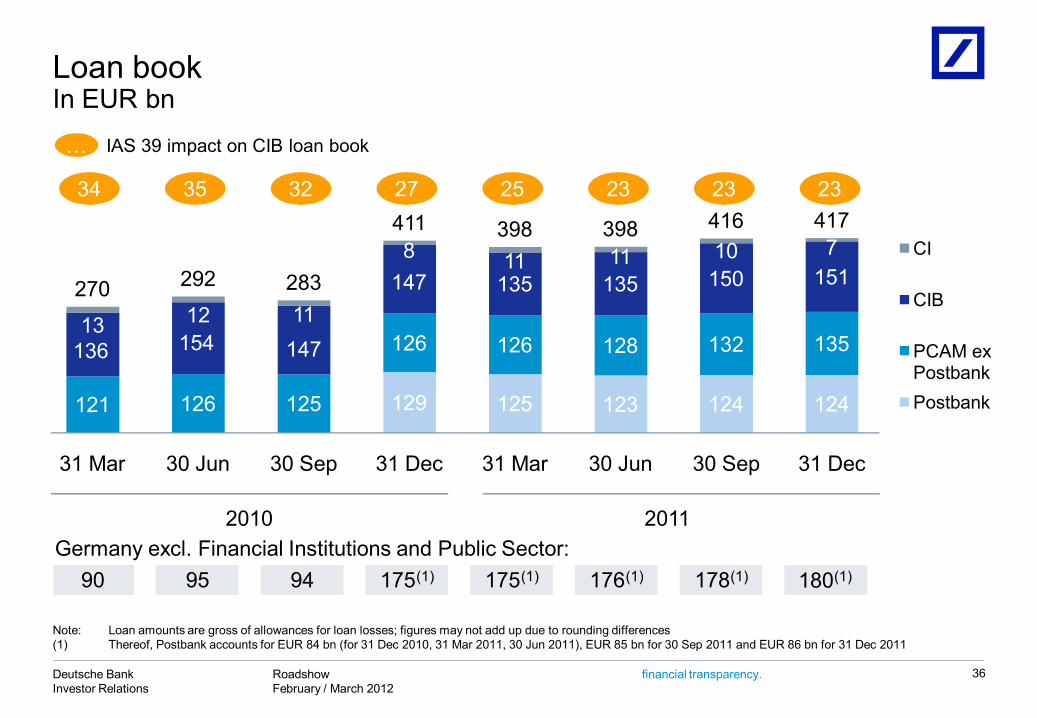
Loan bookIn EUR bn
36
IAS 39 impact on CIB loan book…
129 125 123 124 124121 126 125
126 126 128 132 135136 154 147
147 135 135 150 151
13 12 11
8 11 11 10 7
270 292 283
411 398 398 416 417
31 Mar 30 Jun 30 Sep 31 Dec 31 Mar 30 Jun 30 Sep 31 Dec
CI
CIB
PCAM ex PostbankPostbank
34
Note: Loan amounts are gross of allowances for loan losses; figures may not add up due to rounding differences(1) Thereof, Postbank accounts for EUR 84 bn (for 31 Dec 2010, 31 Mar 2011, 30 Jun 2011), EUR 85 bn for 30 Sep 2011 and EUR 86 bn for 31 Dec 2011
35 32 27 25 23 23 23
Germany excl. Financial Institutions and Public Sector:90 95 94 175(1) 175(1) 176(1) 178(1)
2010 2011
180(1)

RoadshowFebruary / March 2012
Deutsche BankInvestor Relations
financial transparency.
(70)
(30)
(3)
(4)(16) (1)
393
23
(6)(4)
(1) (7)(4)
Composition of loan book and provisions by categoryIn EUR bn, as of 31 December 2011
37
Postbank (PB) 4Q2011 provision for credit losses(1)(2), in EUR m...DB 4Q2011 provision for credit losses(1) ex. PB, in EUR m...
IAS 39 reclassified assets Postbank
Note: Loan amounts are gross of allowances for loan losses; figures may not add up due to rounding diff.(1) Includes provision for off-balance sheet positions; releases shown as negative number (2) Postbank LLPs gross (does not reflect releases booked as Other Interest Income)(3) Includes loans of EUR 3.8 bn in relation to one non-investment grade counterparty relationship (4) Includes loans from Corporate Finance (EUR 1.2 bn) and LEMG (EUR 3.7 bn)(5) Includes loans from CMBS securitizations
Moderate risk bucketLower risk bucket
89%75%
Higher risk bucket
PBC mort-gages
Inv grade / German mid-
cap
GTB PWM PBCsmall
corporates/others
Corporate Invest-ments(3)
Total loan
book, gross
Structured transactions collateralised
by Govts, cash and own debt
Asset Finance
(DB sponsored conduits)
PBC consumer
finance
Financing of pipeline
assets
Collatera-lised /
hedged structured
transactions
Leveraged Finance(4)
OtherCommercialReal
Estate(5)
417
Substantial collateral / hedging
Partiallyhedged
High margin business
Strong underlying asset quality
Low loan to value
Partially hedged
Mostlysenior secured
Diversified assetpools
Predominantly mortgage secured
Diversified by asset type and location
Highly diversified
Short term Credit
umbrella Mostly collateralised
Liquid collateral Substantial
collateral Partially
Gov’tg’teed
Subst-antiallycollater-alised by Gov’tsecurities
Additional hedging mitigants
71 99192362178 540
(146)
(48)
(58)(29)
(19) (7)(5) (17)
(19) (17) (7) (5) (28) (12)
RoadshowFebruary / March 2012
Deutsche BankInvestor Relations
financial transparency. 38
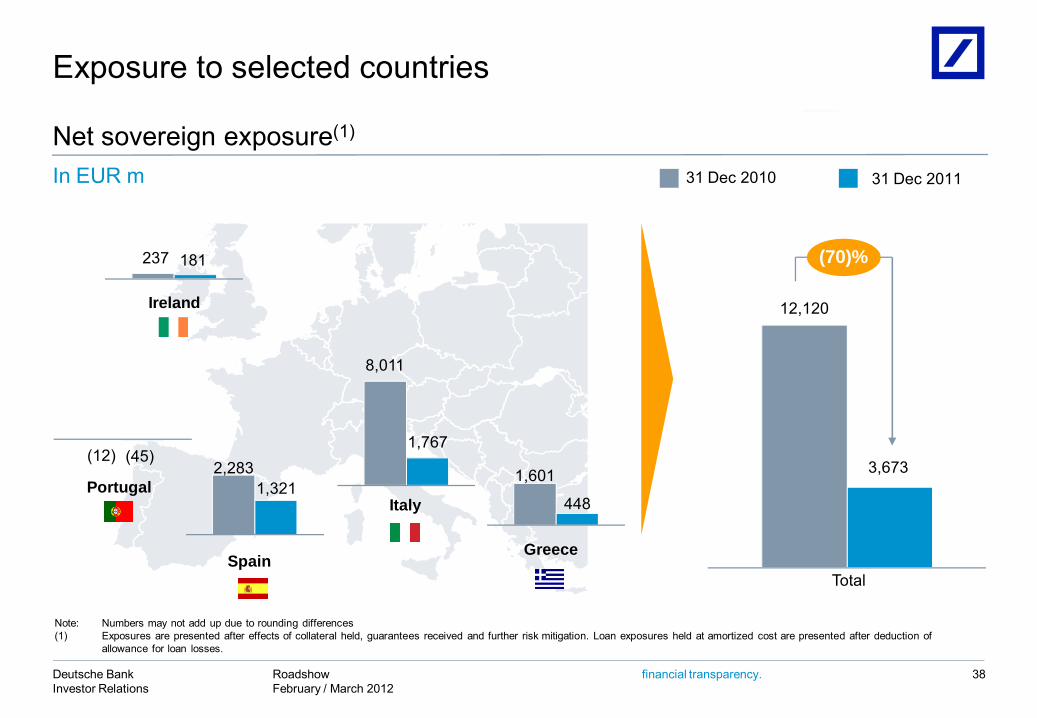
Spain
Portugal
Greece
Italy
Ireland
Net sovereign exposure(1)
31 Dec 201131 Dec 2010
Total
3,673
12,120
1,3212,283
1,767
8,011
448
1,601
181237
(12)
(70)%
Exposure to selected countries
In EUR m
(45)
Note: Numbers may not add up due to rounding differences(1) Exposures are presented after effects of collateral held, guarantees received and further risk mitigation. Loan exposures held at amortized cost are presented after deduction of
allowance for loan losses.
RoadshowFebruary / March 2012
Deutsche BankInvestor Relations
financial transparency.
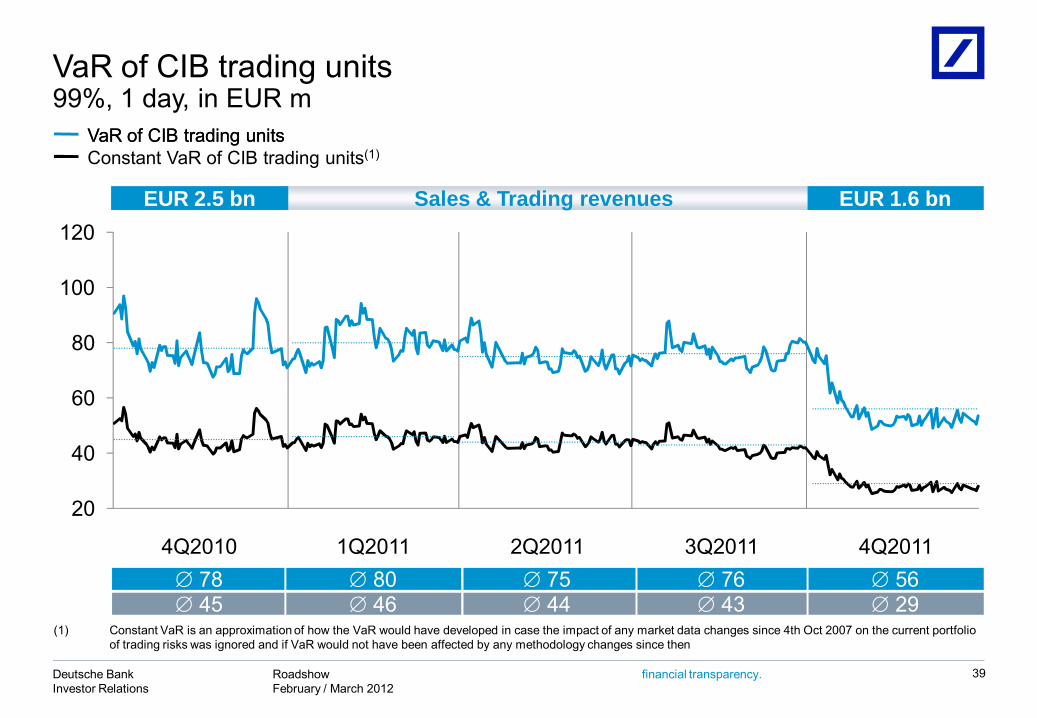
VaR of CIB trading units99%, 1 day, in EUR m
39
VaR of CIB trading units
Sales & Trading revenues EUR 1.6 bnEUR 2.5 bn
VaR of CIB trading unitsConstant VaR of CIB trading units(1)
(1) Constant VaR is an approximation of how the VaR would have developed in case the impact of any market data changes since 4th Oct 2007 on the current portfolio of trading risks was ignored and if VaR would not have been affected by any methodology changes since then
20
40
60
80
100
120
3Q20112Q20114Q2010 1Q2011 4Q2011 76 43
75 44
78 45
80 46
56 29

RoadshowFebruary / March 2012
Deutsche BankInvestor Relations
financial transparency.
Liquidity reserves
Funding profile
40
Recalibrating of our funding profile is paying off: We maintain excellent access to broad range of funding sources
(1) Dec 2007 has been rebased to ensure consistency with Dec 2011 presentation(2) Includes Postbank
EUR 219 bnEUR 65 bn
Capital Markets and
Equity19%
Retail25%
Transaction Banking
15%
Other Customers
9%
Discretionary Wholesale
12%
Secured Funding and
Shorts18%
Financing Vehicles
2%
As at 31 Dec 200759% (EUR 664 bn) of overall funding from
stable funding sources
As at 31 Dec 201130% (EUR 361 bn) of overall funding from
stable funding sources(1)
Capital Markets and
Equity12%
Retail11%
Transaction Banking
7%
Other Customers
13%Discretionary
Wholesale13%
Secured Funding and
Shorts39%
Financing Vehicles
5%
Total: EUR 1,206 bn Total: EUR 1,133 bn(2)
RoadshowFebruary / March 2012
Deutsche BankInvestor Relations
financial transparency. 41
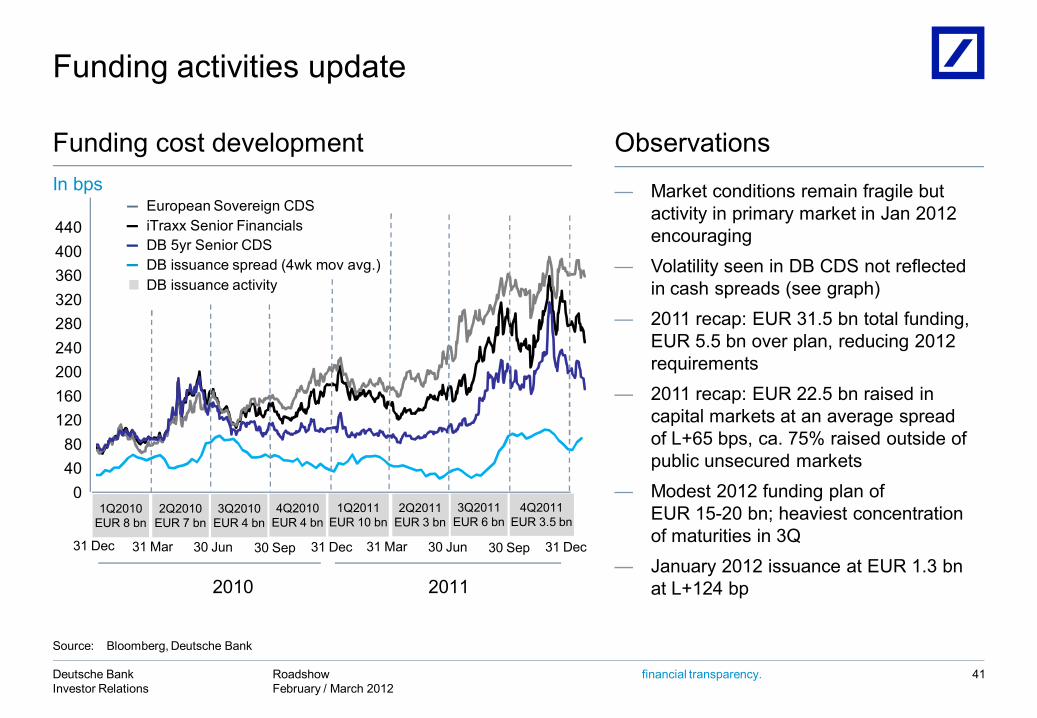
Observations
— Market conditions remain fragile but activity in primary market in Jan 2012 encouraging
— Volatility seen in DB CDS not reflected in cash spreads (see graph)
— 2011 recap: EUR 31.5 bn total funding, EUR 5.5 bn over plan, reducing 2012 requirements
— 2011 recap: EUR 22.5 bn raised in capital markets at an average spread of L+65 bps, ca. 75% raised outside of public unsecured markets
— Modest 2012 funding plan ofEUR 15-20 bn; heaviest concentration of maturities in 3Q
— January 2012 issuance at EUR 1.3 bnat L+124 bp
Funding cost development
Funding activities update
In bps
European Sovereign CDSiTraxx Senior FinancialsDB 5yr Senior CDSDB issuance spread (4wk mov avg.)DB issuance activity
04080
120160200240280320360400440
1Q2010EUR 8 bn
2Q2010EUR 7 bn
1Q2011EUR 10 bn
4Q2010EUR 4 bn
2Q2011EUR 3 bn
31 Dec 31 Mar 30 Jun 30 Sep 31 Dec
20112010
3Q2011EUR 6 bn
European Sovereign CDSiTraxx Senior FinancialsDB 5yr Senior CDSDB issuance spread (4wk mov avg.)DB issuance activity
4Q2011EUR 3.5 bn
31 Mar 30 Jun 30 Sep 31 Dec
3Q2010EUR 4 bn
Source: Bloomberg, Deutsche Bank
RoadshowFebruary / March 2012
Deutsche BankInvestor Relations
financial transparency.
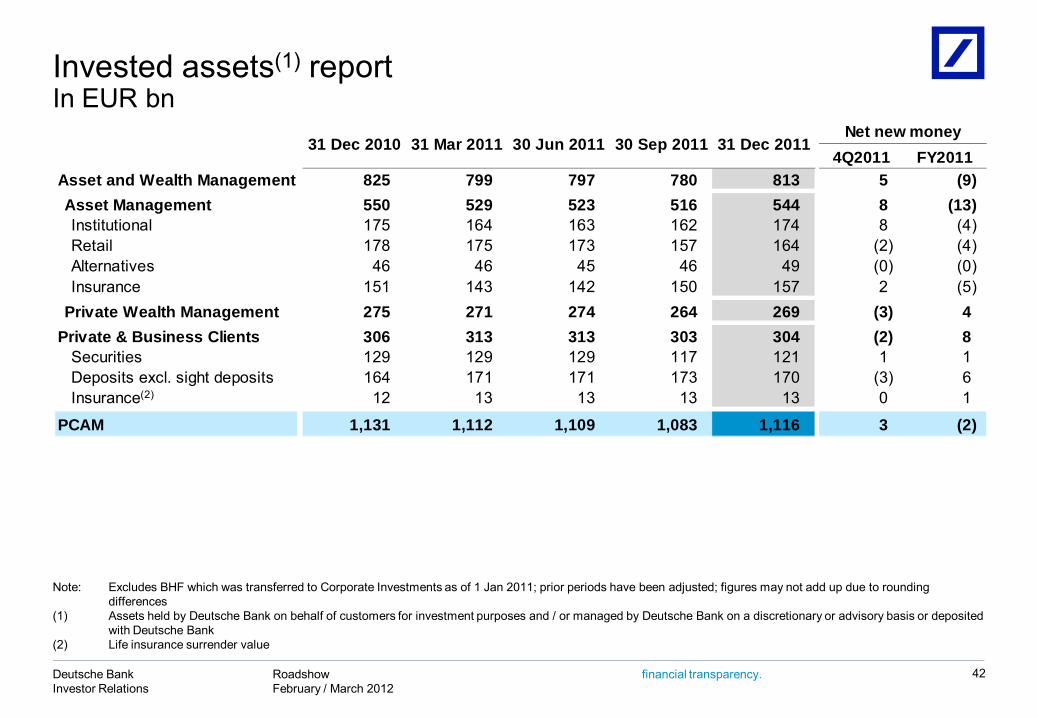
Invested assets(1) reportIn EUR bn
42
Note: Excludes BHF which was transferred to Corporate Investments as of 1 Jan 2011; prior periods have been adjusted; figures may not add up due to rounding differences
(1) Assets held by Deutsche Bank on behalf of customers for investment purposes and / or managed by Deutsche Bank on a discretionary or advisory basis or deposited with Deutsche Bank
(2) Life insurance surrender value
4Q2011 FY2011Asset and Wealth Management 825 799 797 780 813 5 (9)Asset Management 550 529 523 516 544 8 (13)Institutional 175 164 163 162 174 8 (4)Retail 178 175 173 157 164 (2) (4)Alternatives 46 46 45 46 49 (0) (0)Insurance 151 143 142 150 157 2 (5)
Private Wealth Management 275 271 274 264 269 (3) 4Private & Business Clients 306 313 313 303 304 (2) 8
Securities 129 129 129 117 121 1 1Deposits excl. sight deposits 164 171 171 173 170 (3) 6Insurance 12 13 13 13 13 0 1
PCAM 1,131 1,112 1,109 1,083 1,116 3 (2)
31 Dec 201130 Sep 201130 Jun 2011Net new money
31 Dec 2010 31 Mar 2011
(2)
RoadshowFebruary / March 2012
Deutsche BankInvestor Relations
financial transparency.
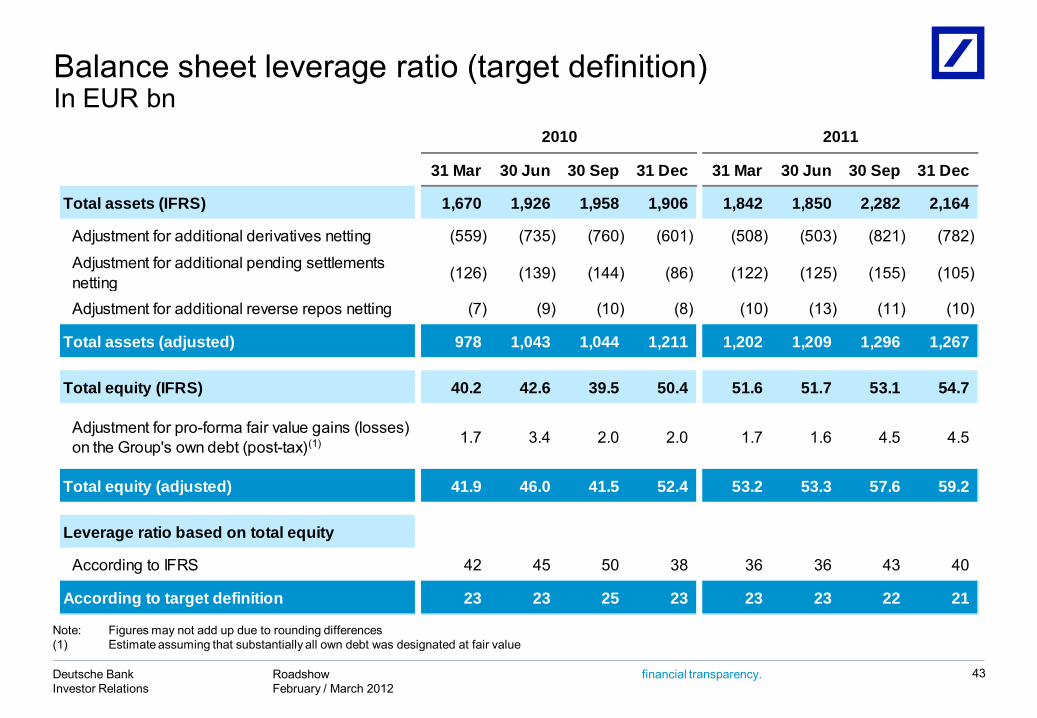
31 Mar 30 Jun 30 Sep 31 Dec 31 Mar 30 Jun 30 Sep 31 Dec
Total assets (IFRS) 1,670 1,926 1,958 1,906 1,842 1,850 2,282 2,164
Adjustment for additional derivatives netting (559) (735) (760) (601) (508) (503) (821) (782)
Adjustment for additional pending settlements netting (126) (139) (144) (86) (122) (125) (155) (105)
Adjustment for additional reverse repos netting (7) (9) (10) (8) (10) (13) (11) (10)
Total assets (adjusted) 978 1,043 1,044 1,211 1,202 1,209 1,296 1,267
Total equity (IFRS) 40.2 42.6 39.5 50.4 51.6 51.7 53.1 54.7
Adjustment for pro-forma fair value gains (losses) on the Group's own debt (post-tax) 1.7 3.4 2.0 2.0 1.7 1.6 4.5 4.5
Total equity (adjusted) 41.9 46.0 41.5 52.4 53.2 53.3 57.6 59.2
Leverage ratio based on total equity
According to IFRS 42 45 50 38 36 36 43 40
According to target definition 23 23 25 23 23 23 22 21
2010 2011
43
Note: Figures may not add up due to rounding differences(1) Estimate assuming that substantially all own debt was designated at fair value
Balance sheet leverage ratio (target definition)In EUR bn
(1)
RoadshowFebruary / March 2012
Deutsche BankInvestor Relations
financial transparency.
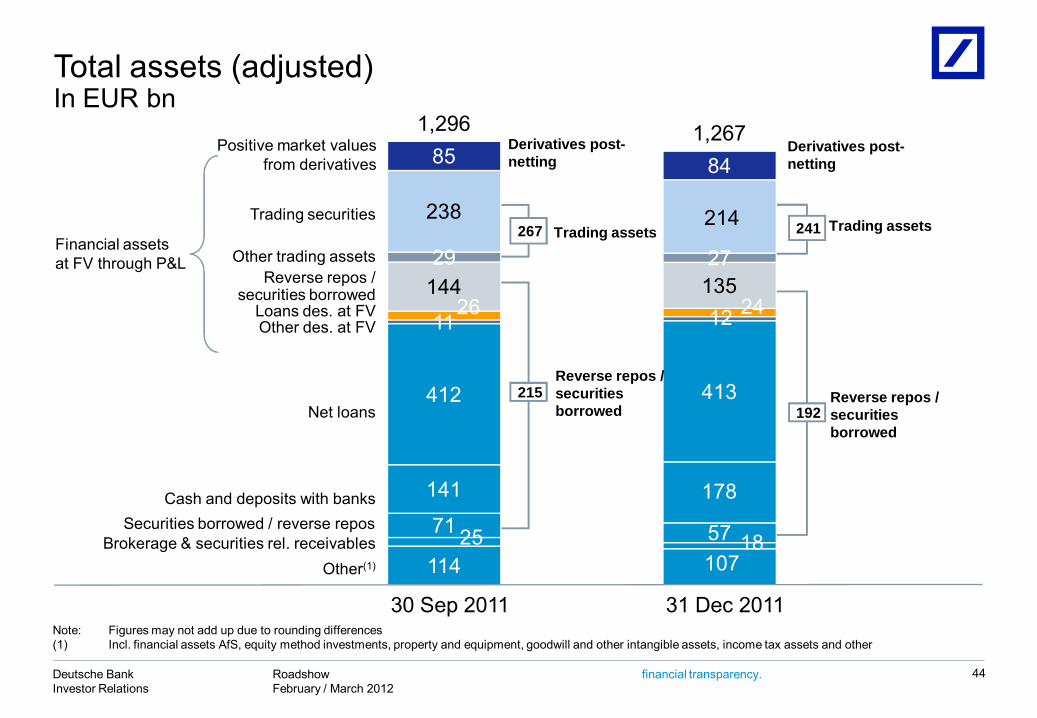
Trading assets241
Reverse repos / securitiesborrowed
192
114 10725 18
71 57
141 178
412 413
11 1226 24144 135 29 27
238 214
85 84
1,296 1,267
Trading assets267
Derivatives post-netting
Reverse repos / securitiesborrowed
215
44
Total assets (adjusted)In EUR bn
Note: Figures may not add up due to rounding differences(1) Incl. financial assets AfS, equity method investments, property and equipment, goodwill and other intangible assets, income tax assets and other
Securities borrowed / reverse repos
Other(1)
Cash and deposits with banks
Net loans
Positive market valuesfrom derivatives
Trading securities
Reverse repos / securities borrowed
Other des. at FV
Financial assets at FV through P&L
Brokerage & securities rel. receivables
Loans des. at FV
Other trading assets
30 Sep 2011 31 Dec 2011
Derivatives post-netting

RoadshowFebruary / March 2012
Deutsche BankInvestor Relations
financial transparency.
This presentation contains forward-looking statements. Forward-looking statements are statements that are not historicalfacts; they include statements about our beliefs and expectations and the assumptions underlying them. Thesestatements are based on plans, estimates and projections as they are currently available to the management of DeutscheBank. Forward-looking statements therefore speak only as of the date they are made, and we undertake no obligation toupdate publicly any of them in light of new information or future events.
By their very nature, forward-looking statements involve risks and uncertainties. A number of important factors couldtherefore cause actual results to differ materially from those contained in any forward-looking statement. Such factorsinclude the conditions in the financial markets in Germany, in Europe, in the United States and elsewhere from which wederive a substantial portion of our revenues and in which we hold a substantial portion of our assets, the development ofasset prices and market volatility, potential defaults of borrowers or trading counterparties, the implementation of ourstrategic initiatives, the reliability of our risk management policies, procedures and methods, and other risks referenced inour filings with the U.S. Securities and Exchange Commission. Such factors are described in detail in our SEC Form20-F of 15 March 2011 under the heading “Risk Factors.” Copies of this document are readily available upon request orcan be downloaded from www.deutsche-bank.com/ir.
This presentation also contains non-IFRS financial measures. For a reconciliation to directly comparable figures reportedunder IFRS, to the extent such reconciliation is not provided in this presentation, refer to the 4Q2011 Financial DataSupplement, which is accompanying this presentation and available at www.deutsche-bank.com/ir.
Cautionary statements
45