
Deutsche Bank Auto Conferences22.q4cdn.com/191330061/files/doc_presentations/173354.pdf ·...
26
Deutsche Bank Auto Conference January 16, 2018
Transcript of Deutsche Bank Auto Conferences22.q4cdn.com/191330061/files/doc_presentations/173354.pdf ·...

Deutsche Bank Auto Conference
January 16, 2018

2
Forward-Looking Statements
Statements in this presentation that are not historical facts are forward-looking statements, which involve risks and uncertainties that could cause actual events or results to differ materially from those expressed or implied by the statements. Important factors that may cause actual results to differ materially from those in the forward-looking statements include, among other factors, the loss or bankruptcy of a major customer; the costs and timing of facility closures, business realignment or similar actions; a significant change in medium- and heavy-duty truck, automotive or agricultural and off-highway vehicle production; our ability to achieve cost reductions that offset or exceed customer-mandated selling price reductions; a significant change in general economic conditions in any of the various countries in which Stoneridge operates; labor disruptions at Stoneridge’s facilities or at any of Stoneridge’s significant customers or suppliers; the ability of suppliers to supply Stoneridge with parts and components at competitive prices on a timely basis; the amount of Stoneridge’s indebtedness and the restrictive covenants contained in the agreements governing its indebtedness, including its asset-based credit facility and senior secured notes; customer acceptance of new products; capital availability or costs, including changes in interest rates or market perceptions; the failure to achieve successful integration of any acquired company or business; the occurrence or non-occurrence of circumstances beyond Stoneridge’s control; and the items described in “Risk Factors” and other uncertainties or risks discussed in Stoneridge’s periodic and current reports filed with the Securities and Exchange Commission.
Important factors that could cause the performance of the commercial vehicle and automotive industry to differ materially from those in the forward-looking statements include factors such as (1) continued economic instability or poor economic conditions in the United States and global markets, (2) changes in economic conditions, housing prices, foreign currency exchange rates, commodity prices, including shortages of and increases or volatility in the price of oil, (3) changes in laws and regulations, (4) the state of the credit markets, (5) political stability, (6) international conflicts and (7) the occurrence of force majeure events.
These factors should not be construed as exhaustive and should be considered with the other cautionary statements in Stoneridge’s filings with the Securities and Exchange Commission.
Forward-looking statements are not guarantees of future performance; Stoneridge’s actual results of operations, financial condition and liquidity, and the development of the industry in which Stoneridge operates may differ materially from those described in or suggested by the forward-looking statements contained in this presentation. In addition, even if Stoneridge’s results of operations, financial condition and liquidity, and the development of the industry in which Stoneridge operates are consistent with the forward-looking statements contained in this presentation, those results or developments may not be indicative of results or developments in subsequent periods.
This presentation contains time-sensitive information that reflects management’s best analysis only as of the date of this presentation. Any forward-looking statements in this presentation speak only as of the date of this presentation, and Stoneridge undertakes no obligation to update such statements. Comparisons of results for current and any prior periods are not intended to express any future trends or indications of future performance, unless expressed as such, and should only be viewed as historical data.
Stoneridge does not undertake any obligation to publicly update or revise any forward-looking statement as a result of new information, future events or otherwise, except as otherwise required by law.
Rounding Disclosure: There may be slight immaterial differences between figures represented in our public filings compared to what is shown in this presentation. The differences are the a result of rounding due to the representation of values in millions rather than thousands in public filings.
3
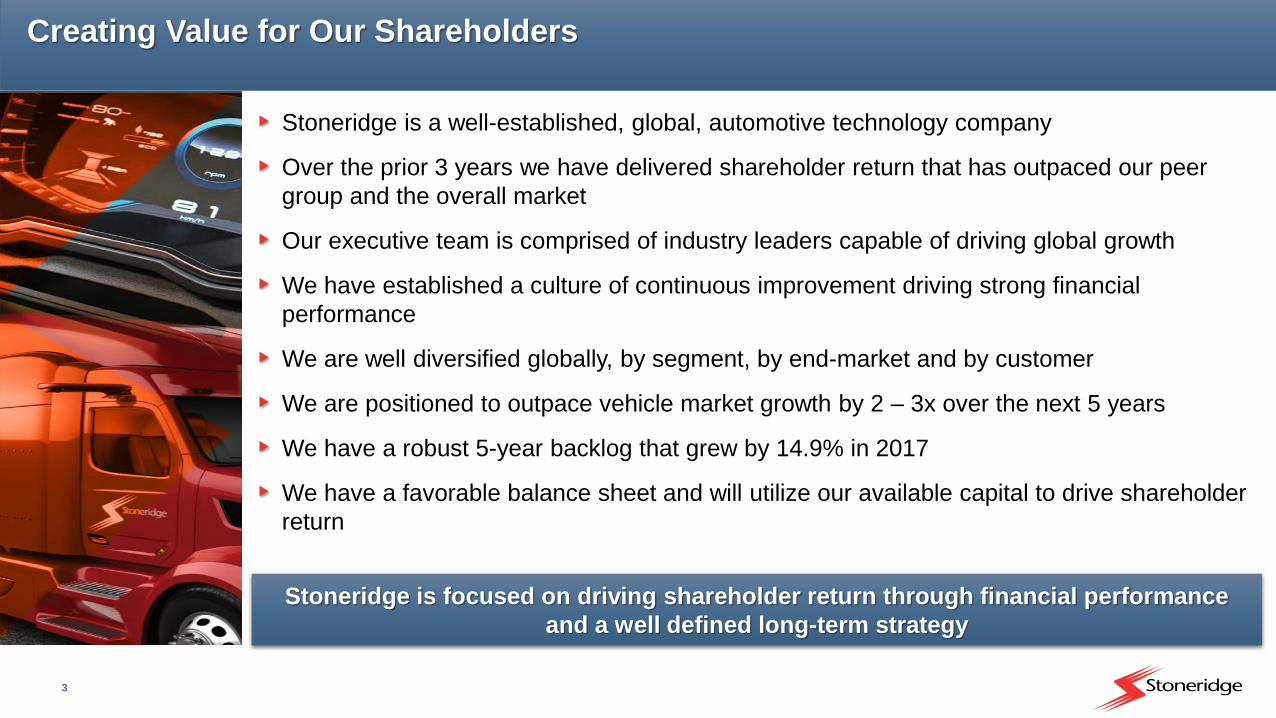
Creating Value for Our Shareholders
Stoneridge is a well-established, global, automotive technology company
Over the prior 3 years we have delivered shareholder return that has outpaced our peer
group and the overall market
Our executive team is comprised of industry leaders capable of driving global growth
We have established a culture of continuous improvement driving strong financial
performance
We are well diversified globally, by segment, by end-market and by customer
We are positioned to outpace vehicle market growth by 2 – 3x over the next 5 years
We have a robust 5-year backlog that grew by 14.9% in 2017
We have a favorable balance sheet and will utilize our available capital to drive shareholder
return
Stoneridge is focused on driving shareholder return through financial performance
and a well defined long-term strategy
4
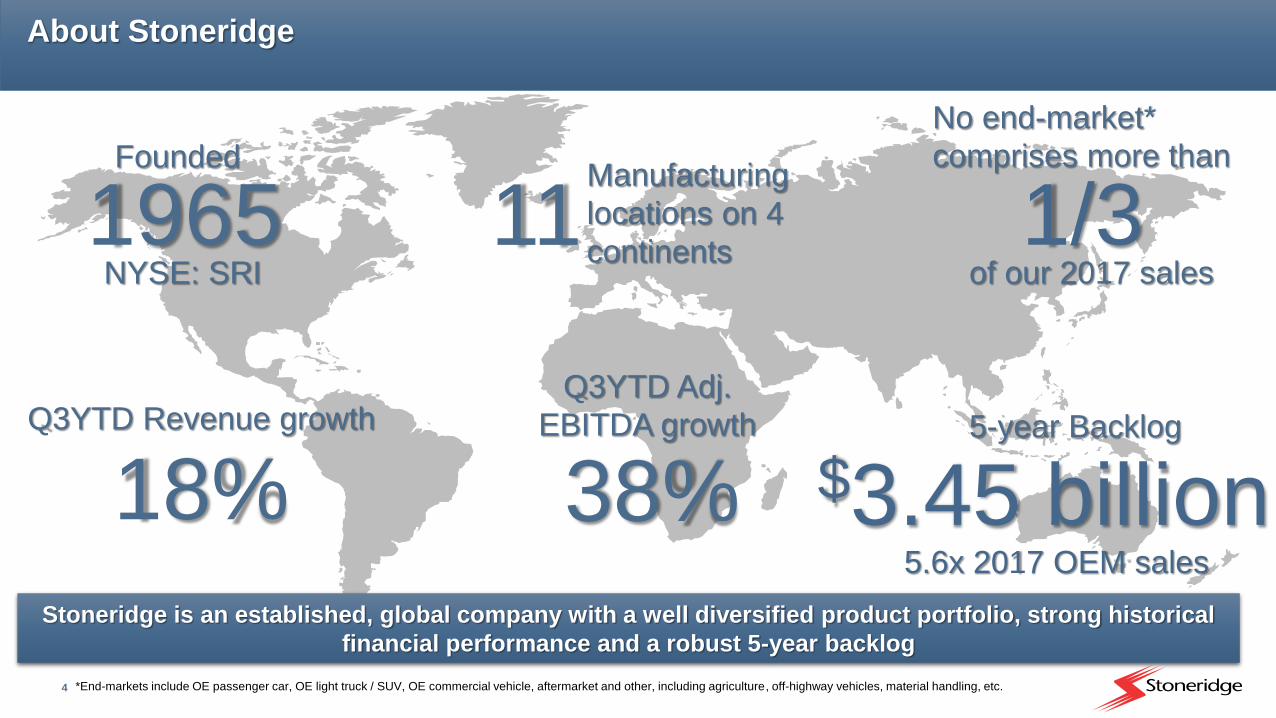
About Stoneridge
11Manufacturing
locations on 4
continents
18%
1965NYSE: SRI
$3.45 billion5-year BacklogQ3YTD Revenue growth
Stoneridge is an established, global company with a well diversified product portfolio, strong historical
financial performance and a robust 5-year backlog
Q3YTD Adj.
EBITDA growth
38%
1/3of our 2017 sales
No end-market*
comprises more than
*End-markets include OE passenger car, OE light truck / SUV, OE commercial vehicle, aftermarket and other, including agriculture, off-highway vehicles, material handling, etc.
5.6x 2017 OEM sales
Founded

5
Robust Financial Performance
*2017 based on midpoint of guidance provided on January 16, 2018
**Peer Group includes the comparator group from most recent proxy statement
3-year sales CAGR of 12.9%*
3-year adjusted gross margin improvement from 27.4% to 30.5%*
3-year adjusted EBITDA CAGR of 41.9% and margin improvement from 7.6% to 12.0%*
3-year adjusted EPS CAGR 28.1%*
Stoneridge has delivered strong financial performance and market-leading shareholder return relative to
our peers over the last 3 years
Stoneridge
78%
S&P 500
30%
Peer Group**
47%

6
Our Current Leadership
Thomas A. Beaver
VP & President
Global Sales
Alisa A. Nagle
Chief Human Resources
Officer
Tony L. Moore
Vice President
Operations
Dan Kusiak
Vice President
Global Procurement
Stephen Fox
Vice President
Business Development
Jonathan B. DeGaynor
CEO & President
Stoneridge Inc.
President
Electronics
Caetano Ferraiolo
President
PST Eletrônica Ltda.
Robert R. Krakowiak
CFO & Treasurer
New Hire or New Position
since 2015
Tom Dono
Chief Legal Officer
Robert Willig
President
Control Devices
Michael D. Sloan (Retiring)
VP & President
Control Devices
Theresa Mitchell
Chief Information
Technology Officer
In-Process

7
Leadership Team Capable of Driving Global Growth
March 2015: Jon
DeGaynor joined
Stoneridge as President
and CEO December 2015: Dan Kusiak
joined Stoneridge as the Vice
President of Global Procurement
January 2017: Stoneridge
completed the acquisition of Orlaco,
a leading supplier of vehicle camera
solutions
November 2015: Alisa Nagle
joined Stoneridge as Chief
Human Resources Officer
May 2016 : Tony Moore
joined Stoneridge as the Vice
President of Operations
August 2016: Bob Krakowiak
joined Stoneridge as CFO
Stoneridge has systematically assembled an executive team comprised of industry leaders capable of
driving global, sustainable performance and growth
July 2017 :
Caetano Ferraiolo
appointed as the
President of PST
May 2017 : Stoneridge
completed the acquisition of
the remaining minority
interest of PST
November 2017:
Bob Willig joined
Stoneridge as the
President of
Control Devices
December 2017:
Transition to new
Electronics President
October 2016: Headquarters
relocated to Novi, MI to facilitate
stronger customer relationships
and attract and retain talent
*2017 revenue and EBITDA margin based on midpoint of guidance provided on January 16, 2018
*
8
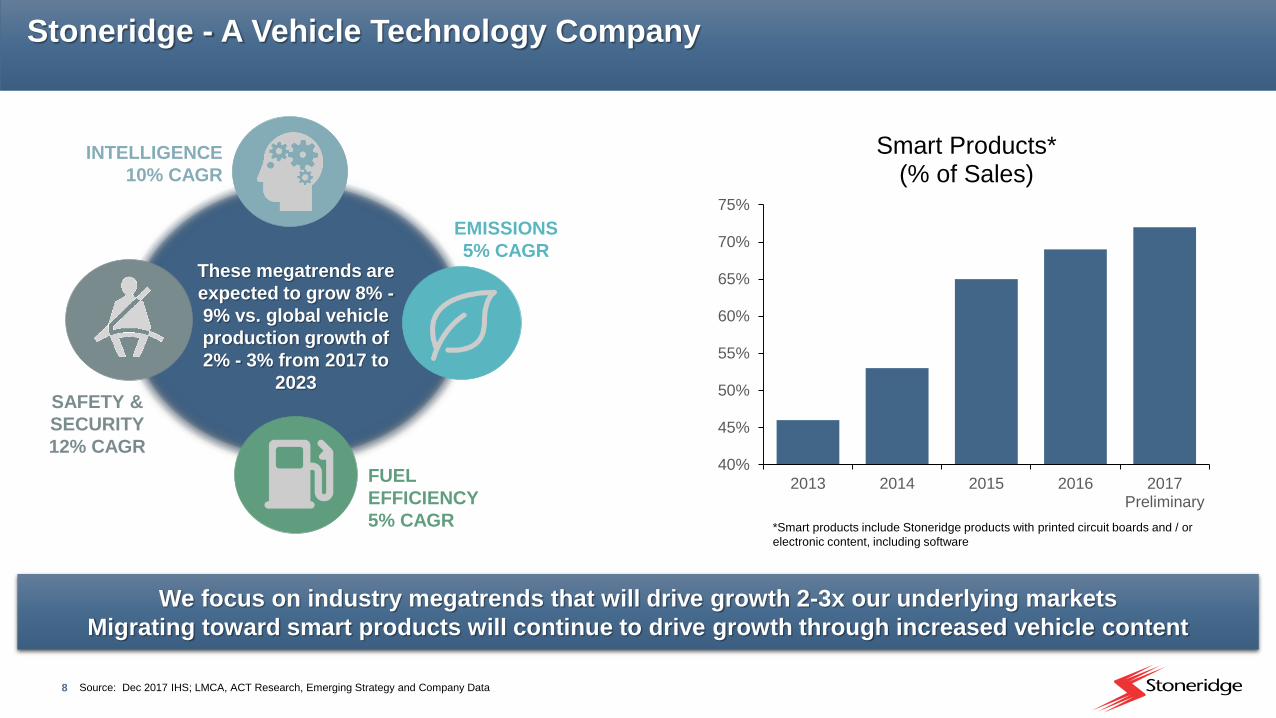
Stoneridge - A Vehicle Technology Company
We focus on industry megatrends that will drive growth 2-3x our underlying markets
Migrating toward smart products will continue to drive growth through increased vehicle content
40%
45%
50%
55%
60%
65%
70%
75%
2013 2014 2015 2016 2017Preliminary
Smart Products* (% of Sales)
*Smart products include Stoneridge products with printed circuit boards and / or
electronic content, including software
INTELLIGENCE
10% CAGR
SAFETY &
SECURITY
12% CAGR
EMISSIONS
5% CAGR
FUEL
EFFICIENCY
5% CAGR
These megatrends are
expected to grow 8% -
9% vs. global vehicle
production growth of
2% - 3% from 2017 to
2023
Source: Dec 2017 IHS; LMCA, ACT Research, Emerging Strategy and Company Data

9
Stoneridge - A Vehicle Technology CompanyDriver Information Systems
Commercial vehicle instrument clusters are
following passenger car trends and
becoming fully configurable, display-based
driver information systems
Stoneridge is one of the global leaders in
commercial vehicle driver information
systems
Delivering commercial vehicle driver
information systems solutions for 25+ years
2005 First color TFT diplay
commercial vehicle
instruement cluster
award
2008Launched first “hybrid”
color display driver
information system
2017Awarded fully-
configurable driver
information system
global program
2020Launch fully-
configurable
driver information
system
Additional functionality development
and sub-system integration (data,
infotainment, etc.)
*Peak annual revenue
Awards
Recently announced $38
million annual* global award
for hybrid and fully
configurable systems
Driver information systems are driving increased content per vehicle and future growth opportunities
through additional functionality and sub-system integration

10
Stoneridge - A Vehicle Technology CompanyActuation Systems
Our actuation technologies will drive growth in traditional drivetrains and the electrified drivetrains of the future
Park-by-wire developed for hybrid and fully electric drivetrains as an extension of our shift-by-wire actuator that is in production on traditional drivetrains today
Awarded contracts for our actuation technology on electrified axle (E-Axle) systems. Extension of our axle-based actuation technologies currently in production.
Our actuation technologies will drive growth on traditional, hybrid and fully electric drivetrains today and
in the future
2015Launch shift-by-wire
with multiple global
OEMs
2016Launch shift-by-
wire with park-
by-wire
functionality on
Chevrolet Bolt
2017Awarded $31
million* of
park-by-wire
global
programs
2017Awarded E-Axle
development
platform
2021E-Axle platform
launch in North
America
2019Park-by-wire
platform
launches in
North America
and Europe
Exploration of complimentary actuation
technologies (expand customers and capabilites)
*Peak annual revenue
2020Park-by-wire
platform
launches in Asia
Geographic expansion of actuation capabilities
Awards
Announced in Q2 – $31 million annual* park-by-
wire programs awarded in North America,
Europe and Asia
Announced in Q3 – E-Axle development award
on high-performance platform in North America

11
Stoneridge - A Vehicle Technology CompanyMirrorEyeTM
Commercialization – OEMs
$250 Million annual OEM market opportunity through our
traditional sales channels
Commercialization – Fleets / Retrofit
Fleets trials on-going with 18 fleets globally (350,000+
miles driven in US with MirrorEyeTM)
Regulatory Environment
Working with NHTSA and FMCSA to enact legislation that
would benefit MirrorEye adoption rates
MirrorEyeTM will change the commercial vehicle safety environment
Expected retrofit launches in late 2018 with OEM start-of-production in 2020
Awards
Awarded pre-development OEM contract
Global opportunity focused on Europe and US
development
2015Orlaco Partnership
Established to
Develop MirrorEye
2017SRI Acquires
Orlaco
2017North
American Fleet
Trials Begin
2017Awarded First
Pre-Development
OEM Contract
Late 2018Expected Retrofit
Launches
2020+Expected OEM
Launches
Continue to explore adjacent end-markets and
geographies as well as complimentary technology
development / integration

12
Stoneridge Passenger Car / Light Truck Content
Ford F-Series
Trailer Tow Connector, Canister Vent Valve, Rotary 4x4
Control Switch, Seat Track Position Sensor
Exhaust Gas, Cylinder Head, Engine Coolant & Exhaust
Gas Recirculation Temperature Sensors
Buick LaCrosse
Shift by Wire / Transmission Range Control Module,
Canister Vent Solenoid
Ram Trucks
Front Axle Disconnect Actuator, Trailer Tow Connector,
Ram Box and Tailgate Actuators, Under Hood Switch,
Coolant & Oil Temperature Sensors, Smart Bar Actuator
Cadillac XT5
Shift by Wire / Transmission Range Control Module,
Canister Vent Solenoid, Trailer Tow Connector
Jeep Cherokee
Under Hood Security Switch, Coolant & Oil Temperature
Sensors, Tailgate Release Switch, Exhaust Gas,
Temperature Sensor, Trailer Tow Connector
Chevrolet Bolt
Shift by Wire / Transmission Range Control Module,
Park Lock
Chevy / GMC Silverado / Sierra
Front Axle Disconnect Actuator, Trailer Tow Connector,
Canister Vent Solenoid
Lincoln Continental
Shift by Wire / Transmission Range Control Module,
Capacitive Keypad, Seat Track Position Sensor, Vapor,
Bypass Valve, Canister Vent Valve
Ford Fusion
Shift by Wire / Transmission Range Control Module,
Capacitive Keypad, Seat Track Position Sensor, Release
Switches, Canister Vent Solenoid, Vapor Blocking Valve,
Cylinder Head & Engine coolant Temperature Sensors

13
Stoneridge Commercial Vehicle Content
PACCAR
Tachograph, High Temperature Sensor, Power & Switch
Module
Daimler
Instrument Cluster, Tachograph, High Temperature
Sensor, Power & Switch Module, Telematics
MAN
Instrument Cluster, Telematics, Tachograph, Power &
Switch Module, ECU
Navistar
Instrument Cluster, High Temperature Sensor, Switches,
Power & Switch Module
Scania
Instrument Cluster, Tachograph, Power & Switch Modules,
Telematics
Volvo
Instrument Cluster, Power & Switch Modules, ECU, Soot
Sensor, Switches
Crown Equipment Corporation
Vision Systems
Caterpillar
Vision Systems
John Deere
Vision Systems

14
Financial Summary

15
Year to Date
(through Q3)
2017 Guidance
(As of Q3)
2017 Guidance
(Updated)
Sales $810 - $825 Million $820 - $825 Million
Adjusted Gross
Profit and %
Margin30.0% - 31.0% 30.0% - 31.0%
Adjusted
Operating Income
and % Margin8.0% - 9.0% 8.0% - 9.0%
Adjusted EBITDA
and % Margin11.5% - 12.5% 11.5% - 12.5%
Adjusted EPS $1.14 $1.48 - $1.54 $1.51 - $1.54
$523.4
$617.0
YTD 2016 YTD 2017
$52.4
$72.3
10.0%
11.7%
$45.0
$55.0
$65.0
$75.0
YTD 2016 YTD 2017
9.0%
11.0%
13.0%
$33.9
$51.6
6.5%8.4%
$25.0
$35.0
$45.0
$55.0
YTD 2016 YTD 2017
4.5%
9.5%
14.5%
$147.7
$188.8
28.2%30.6%
$130.0
$150.0
$170.0
$190.0
$210.0
YTD 2016 YTD 2017
25.0%
30.0%
35.0%
40.0%
Financial Performance and Guidance
$’s in USD Millions
+28%
+52%
+38%
+18%
(Year-to-date increase not comparable due
reversal of valuation allowances in 2016)

16
Business Share by Segment and Region
We continue to diversify our product portfolio and geographic exposure through organic and inorganic
growth opportunities
Business Segments (2017 Preliminary) Regions (2017 Preliminary)*
*Regional sales based on manufactured location.
Based on preliminary 2017 estimates. Actual results may differ.
North America 57%
Asia4%
Europe 28%
South America 11%
Control Devices 54%
Electronics 34%
PST 11%

17
Business Share by Customer
2017 Preliminary
We are well diversified in our customer exposure. Approximately 75% of sales are attributable to OEM
customers which comprise forecasted backlog.
*Does not include revenue from Minda-Stoneridge JV,
Based on preliminary 2017 estimates. Actual results may differ.
Ford 14%
GM 7%
Volvo 6%
Daimler Freightliner 6%
Scania 5%
SAIC 3%
MAN 3%
FCA 2%PACCAR 2%
Navistar 1%Deere 1%
Cummins 1%
Tier 1 11%
Other OE 13%
Orlaco, PST and Aftermarket 25%
18
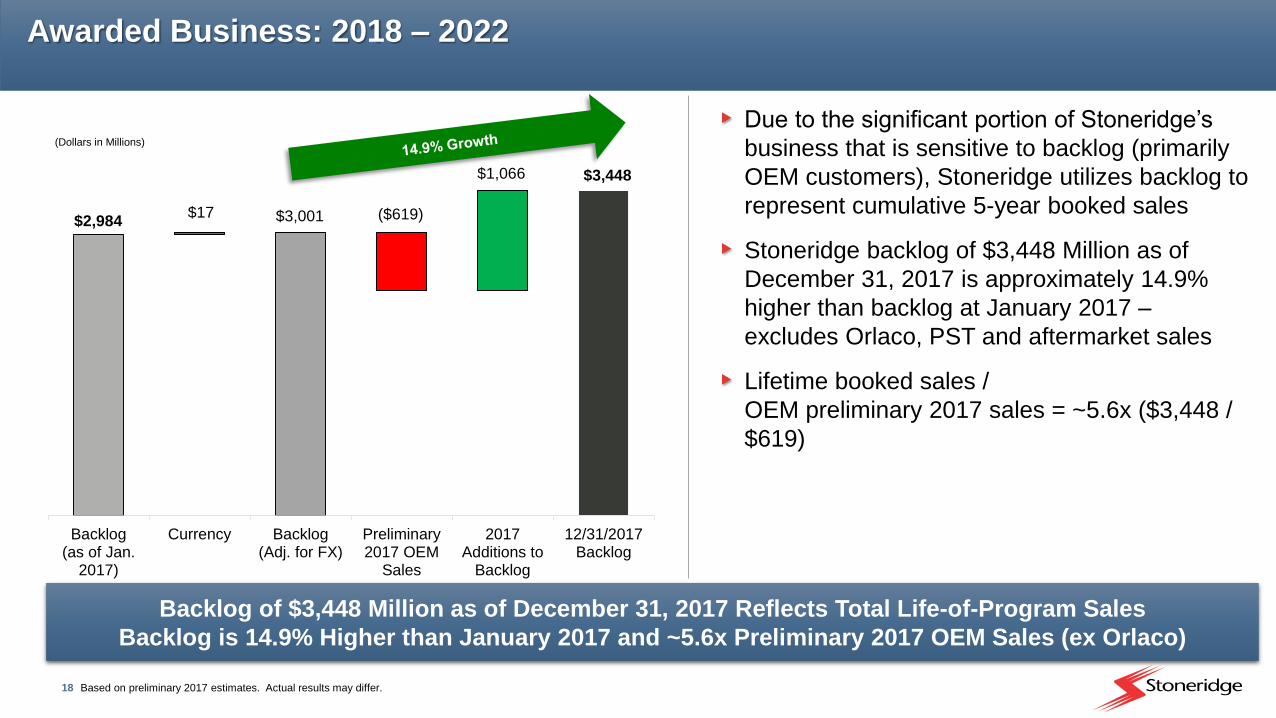
Awarded Business: 2018 – 2022
$2,984
$3,448
$17 $3,001 ($619)
$1,066
Backlog(as of Jan.
2017)
Currency Backlog(Adj. for FX)
Preliminary2017 OEM
Sales
2017Additions to
Backlog
12/31/2017Backlog
(Dollars in Millions)
Based on preliminary 2017 estimates. Actual results may differ.
Backlog of $3,448 Million as of December 31, 2017 Reflects Total Life-of-Program Sales
Backlog is 14.9% Higher than January 2017 and ~5.6x Preliminary 2017 OEM Sales (ex Orlaco)
Due to the significant portion of Stoneridge’s
business that is sensitive to backlog (primarily
OEM customers), Stoneridge utilizes backlog to
represent cumulative 5-year booked sales
Stoneridge backlog of $3,448 Million as of
December 31, 2017 is approximately 14.9%
higher than backlog at January 2017 –
excludes Orlaco, PST and aftermarket sales
Lifetime booked sales /
OEM preliminary 2017 sales = ~5.6x ($3,448 /
$619)

19*Excluding Orlaco and PST
** Regional sales based on manufactured location
SOURCE: Dec 2017 IHS; Q4 2017 LMC, Company Data
2018 Full Year Volume Outlook
Stoneridge is well positioned to take advantage of strong performing regions and end markets
Passenger Car*Sales by End Market (2017 Preliminary)
Commercial Vehicle*
Passenger Car / Light Truck OE
46%
Commercial Vehicle OE25%
Aftermarket / Non-OE / Other
27%
Agriculture 2%
(Units in Millions) Stoneridge 2018
2017E Sales** 2017E 2018E B/(W) 2017
Europe 5.0% 22.3 22.8 2.0%
Asia 20.9% 50.0 50.4 0.9%
North America 73.8% 17.1 17.4 1.6%
South America 0.1% 3.3 3.7 13.1%
Other 0.2% 2.6 2.8 9.0%
Total 100.0% 95.3 97.1 1.9%
Vehicle Production
(Units in Millions) Stoneridge 2018
2017E Sales** 2017E 2018E B/(W) 2017
Europe 64.5% 0.6 0.6 3.2%
Asia 4.9% 2.0 1.9 -7.8%
North America 30.3% 0.5 0.6 13.9%
South America 0.2% 0.1 0.1 15.5%
Other 0.1% 0.0 0.0 -5.4%
Total 100.0% 3.2 3.2 -1.8%
Vehicle Production

20
Expected Impact of Tax Reform in 2018
2017
Guided Effective Tax Rate
Expected Impact of Tax Reform
Immediate
Expensing of
Capital
Expenditures
2018 Preliminary
Outlook
30% – 35%
Given our geographic earnings profile, a reduction to the corporate tax rate in the US is beneficial in reducing our
expected blended tax rate going forward
Benefit due to the reduction in the US corporate tax rate will be in-part mitigated by the change in tax treatment of
executive compensation
Changes to the international tax structure should benefit us through the availability of foreign cash for broader use
We expect tax reform to have a long-term positive impact on our earnings
Reduction in
US
Corporate
Tax Rate
Interest
Expense
Limitation
Limitation on
Executive
Compensation
Deductibility
International
Tax Changes
20% – 25%

21
Strong Capital Structure
Current Cap Structure Debt and Leverage Levels
Debt / EBITDA
We will continue to review the best use of our capital structure in order to maximize shareholder value
*Net availability does not consider approximately $3 million related to letters of credit
1.9x 1.6x 1.3x 0.5x 1.4x 1.3x 1.0x
As of September 30, 2017
US Debt
Revolver Capacity 300$
Amount Drawn (126)
Net Availability* 174$
Brazil Debt
Gov't Incentive (4)$
Other Debt (5)$
Total Brazil Debt (10)$
US Debt (126)$
Brazil Debt (10)
Total Debt (136)
Total Cash 51$
Net Debt (85)$
*Includes Orlaco, excludes LCs

22
FY 2018 Preliminary Guidance Does not include the impact of tax reform
> $1.65
2017
Guidance
Sales
Adjusted Earnings Per Share
New
Business
Launches
Pricing
2018 Preliminary
Outlook
Wage /
Benefit
Inflation
Production
Volumes
Currency Production
Volumes
$840m – $860m
Aftermarket /
Retrofit
Currency Gross Margin
Improvements
2017
Guidance
2018 Preliminary
Outlook
Operating
Leverage
Tax
Reform$1.51 – $1.54
$820m – $825m
Expected positive impact of
tax reform not considered in
> $1.65 guidance
23
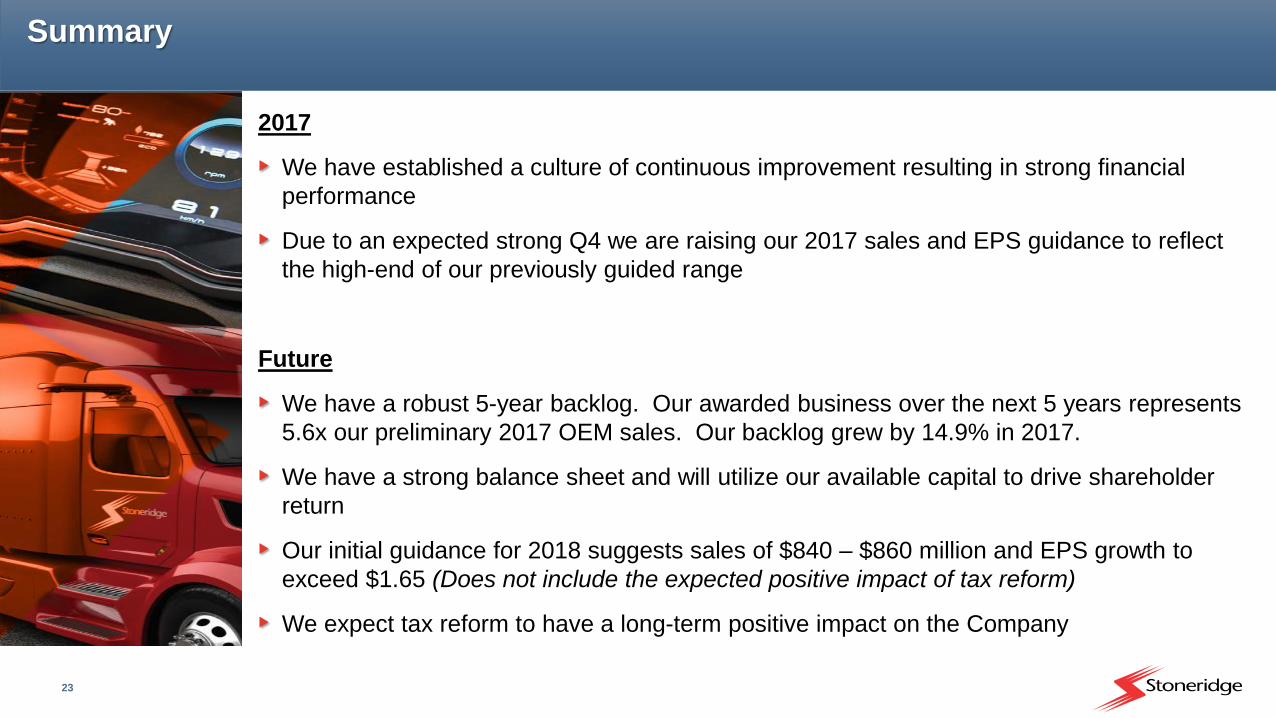
Summary
2017
We have established a culture of continuous improvement resulting in strong financial
performance
Due to an expected strong Q4 we are raising our 2017 sales and EPS guidance to reflect
the high-end of our previously guided range
Future
We have a robust 5-year backlog. Our awarded business over the next 5 years represents
5.6x our preliminary 2017 OEM sales. Our backlog grew by 14.9% in 2017.
We have a strong balance sheet and will utilize our available capital to drive shareholder
return
Our initial guidance for 2018 suggests sales of $840 – $860 million and EPS growth to
exceed $1.65 (Does not include the expected positive impact of tax reform)
We expect tax reform to have a long-term positive impact on the Company

24
Reconciliations to US GAAP

25
Reconciliations to US GAAP
This document contains information about Stoneridge's financial results which is not presented in accordance with accounting principles generally accepted in the United States ("GAAP"). Such non-GAAP financial measures are reconciled to their closest GAAP financial measures in the appendix of this document. The provision of these non-GAAP financial measures for 2017 is not intended to indicate that Stoneridge is explicitly or implicitly providing projections on those non-GAAP financial measures, and actual results for such measures are likely to vary from those presented. The reconciliations include all information reasonably available to the Company at the date of this document and the adjustments that management can reasonably predict.

26
Reconciliations to US GAAP
Reconciliation of Stoneridge Adjusted Operating Income
(USD in millions) Q3 2017 Q3 YTD 2017
Operating Income $13.3 $44.1
Add: Pre-Tax Step-Up in Acquired Inventory from Orlaco - 1.6
Add: Pre-Tax Step-Up in Fair Value of Earn-Out (Orlaco) 1.8 3.9
Add: Pre-Tax Step-Up in Fair Value of Earn-Out (PST) 0.5 0.7
Add: Pre-Tax Transaction Costs Adjustment (Orlaco) - 1.2
Adjusted Operating Income $15.6 $51.6
Reconciliation of Stoneridge Adjusted Gross Profit
(USD in millions) Q3 2017 Q3 YTD 2017
Gross Profit $62.6 $187.1
Add: Pre-Tax Step-Up in Acquired Inventory from Orlaco - 1.6
Adjusted Gross Profit $62.6 $188.8
Reconciliation of Q3 Adjusted EBITDA
(USD in millions) Q3 2017 Q3 YTD 2017 Q3 2016 Q3 YTD 2016
Income before tax $11.9 $39.7 $10.9 $30.2
Interest expense, net 1.5 4.4 1.7 5.0
Depreciation and amortization 7.1 20.7 6.0 17.1
EBITDA $20.5 $64.8 $18.6 $52.4
Add: Pre-Tax Step-Up in Acquired Inventory from Orlaco - 1.6 - -
Add: Pre-Tax Step-Up in Fair Value of Earn-Out (Orlaco) 1.8 3.9 - -
Add: Pre-Tax Step-Up in Fair Value of Earn-Out (PST) 0.5 0.7 - -
Add: Pre-Tax Transaction Costs Adjustment (Orlaco) - 1.2 - -
Adjusted EBITDA $22.8 $72.3 $18.6 $52.4
Reconciliation of 2015 Adjusted EPS
2015 Adjusted EPS $0.82
Add: Non-Cash CEO Retirement Expense 0.08
Add: PST Deferred Tax Valuation Allowance 0.03
2015 Adjusted EPS $0.93
Reconciliation of Q3 YTD 2017 Adjusted EPS
(USD in millions) Q3 YTD 2017 Q3 YTD 2017 EPS
Net Income Attributable to Stoneridge $26.1 $0.91
Add: After-Tax Step-Up in Acquired Inventory from Orlaco 1.2 0.04
Add: After-Tax Step-Up in Fair Value of Earn-Out (Orlaco) 3.9 0.14
Add: After-Tax Step-Up in Fair Value of Earn-Out (PST) 0.7 0.02
Add: After-Tax Transaction Costs Adjustment (Orlaco) 0.8 0.03
Adjusted Net Income $32.8 $1.14
Reconciliation of 2015 EBITDA
(USD in millions) 2015
Income before tax $20.2
Interest expense, net 6.4
Depreciation and amortization 22.4
EBITDA $49.0


![William Blair 40th Annual Growth Stock Conferences22.q4cdn.com/365241770/files/doc_presentations/2020/06/Vapothe… · [ 1 ] Certain statements in this presentation, including responses](https://static.fdocuments.net/doc/165x107/6043eefb201dbe61bc4719ed/william-blair-40th-annual-growth-stock-conferences22q4cdncom365241770filesdocpresentations202006vapothe.jpg)


