Deutsche Bank Annual Electric Power...
57
John Wilder Chief Executive Officer June 16, 2004 Deutsche Bank Annual Electric Power Conference
Transcript of Deutsche Bank Annual Electric Power...

John WilderChief Executive Officer
June 16, 2004
Deutsche Bank Annual Electric Power Conference

1
This presentation contains forward-looking statements, which are subject to various risks and uncertainties. Discussion of risks and uncertainties that could cause actual results to differ materially from management's current projections, forecasts, estimates and expectations is contained in the company's SEC filings. In addition to the risks and uncertainties set forth in the company's SEC filings, the forward-looking statements in this presentation could be affected by the ability of purchasers to obtain all necessary governmental and other approvals and consents for the acquisition of TXU Australia and TXU Fuel and the ability of the company to exit the business of TXU Gas, finalize the energy marketing and trading joint venture, achieve the cost reductions from the Capgemini Energy partnership and to implement the other initiatives that are part of the 90-day business review, and the terms under which the company executes those transaction or initiatives.
Regulation GThis presentation includes certain non-GAAP financial measures. A reconciliation of these measures to the most directly comparable GAAP measure is included in the appendix of the printed version of the slides and the version included on the company’s website at www.txucorp.com under Investor Resources/Presentations.
Safe Harbor Statement & Regulation G

2
TXU Has Four Core Businesses; in Two Sectors…
Assets Operating Net Income
1.3 2.2
TXU Power TXU EnergyTradeCo
TXU Electric Delivery
• Achieve top decileproduction levels
• Redefine cost benchmarks• Deliver superior customer
service• Retain and grow profitable
customers• Build industry leading
trading company
• Achieve top decile costs• Invest and improve reliability
to top decile• Achieve industry leading
safety performance• Earn allowable return
Core Businesses Objectives
OCF
23.2100%=
57% 75% 66%
25%43% 34%
Business metrics05E; $ billions
3
.. That Have Advantaged Scope and Scale…
Generation
TXU Power
Wholesale
TradeCo
Retail
TXU Energy
Competitive Integrated Energy
“High performance industrial company”
Distribution
TXU Electric Delivery
Transmission
TXU Electric Delivery
Regulated Utility
“High performance utility”
Number of Customers02; Millions
Miles of Distribution Lines02; Thousands
Deregulated Generation03; TWh
Deregulated Retail Load02; TWh

4
…And Are Guided By a Set of Core Principles
• Sustained earnings in commodity businesses require– Low cost, efficient operations– Conservative financial strategies– The leverage of an integrated business model
• The right to grow is earned through rigorous cash stewardship and enhanced financial flexibility
• Disciplined, execution focused cultures lead to consistent performance improvement
• Superior customer service and reliability drive long-term success

TXU Electric Delivery
6
TXU Electric Delivery Is Well-Positioned…Large Territory03; millions of customers
TXU U.S. Average
2.9
1.5
High Growth: Market Growth03; Percent
TXU
2.0
TXU has a strong market position with a regulatory environment that allows for efficient recovery of capital
TXU has a strong market position with a regulatory environment that allows for efficient recovery of capital
U.S. Average
1.1
High Load03; Cooling Degree Days
TXU
2,648
U.S. Average
1,215
Authorized ROE is solid03; Percent
TXU U.S. Average
11.25 11.85

7
…With Cost Performance Evidenced By Its Competitive Rates
T&D O&M Expense / Distribution Customer03; $/Customer
TXU Current Performance
Benchmark Average
Performance
Top Quartile Performance
Top Decile Performance
3.972.82 2.33
TXU Current Performance
Benchmark Average
Performance
Top Quartile Performance
80101
84 70
Top Decile Performance
T&D O&M Expense per MWh Delivered03; $/MWh Delivered
2.33
$24.01
$24.27
$34.03
$25.89
TXU
Center-point
AEPCentral
AEP North
TNMP
$27.97
Monthly Wires ChargesMar 04; Dollars1
1 Assumes 1000 KWH monthly customer; Electric Delivery’s average residential consumption for 2003 was about 1300 kWh. Other non-operating charges, including system benefit fund, nuclear decommissioning charge, excess mitigation credit, retail clawback credit, transition charge on securitized regulatory assets and merger savings/rate reduction riders have not been included.

8
TXU Is Investing to Achieve Excellence in Reliability
59%59%
Vegetation Management Investment03-06; $ Millions
22
35 35
Incremental T&D Maintenance Investment03-06; $ Millions
2633 34
20%20%
SAIDI Benchmarks (non-storm)98-06E; Minutes
IndustryAverage
Performance
TXU 5-Yr System Average
Performance
129
85 81 68
06 Commitment
TopQuartile
Performance
SAIFI Benchmarks (non-storm)98-06E; Frequency
1.361.08
0.89
18%18%
0.90
IndustryAverage
Performance
06 Commitment
TXU 5-Yr System Average
Performance
TopQuartile
Performance
06E05E0306E05E03
31%31%
9
Storm Restoration: Our Commitment to Customer Service
June 1, 2004 storm� Worst storm in 100 year history of TXU (Category 1 hurricane winds)� 500,000 lightning strikes across TXU Electric Delivery system� More than 11,000 device outages affecting approximately 1.3 million customers� 90% of customer power restored within 60 hours
TXU Energyand
TradeCo

11
95 109 118
8088 103
8176
85
99 03 08E
Largest and Highest Growth Deregulated Market…
Industrial
Commercial
Residential
ERCOT Is Growing Rapidly: ERCOT Demand99-08; TWh
100% = 256 273 306
99-03CAGR1.6%
03-08ECAGR2.2%
Source: EIA
Significant electricity demand growth in TXU’s core marketSignificant electricity demand growth in TXU’s core market

12
…With Expectations For Competitive Margins…
0
5
10
15
20
25
30
35
0
1
2
3
4
5
6
7
NYMEX 12-month strip
TXU retail headroom
NYMEX Gas$/MMBtu
Retail Headroom1
Percent
1 Headroom = (PTB – Generation – Wires)/PTB; based on average of forward looking 12 months; forward curve as of June 9, 2004
01 04E03 05E02 06EEOY
Margin History and Outlook01-06; Mixed Measures

13
…And Profitable Retention Through Customer Service
Improved Call Answer Time: Average Speed of Answer03-04; Seconds250
150
01/03 04/0401/0404/03 07/03 10/03
Reduced PUC Complaints03-04; Number
800
400
Stabilizing Residential Market Share02-04; Millions of Customers
2100
2000
215050
600
200
0
200
100
0
2200
2050
04/0401/0401/03 10/0307/0304/03
01/03 04/0401/0404/03 07/03 10/03

14
Partnership with a Global Financial Firm
Distinctive Physical/Financial Merchant Energy
Business
Strong physical
capabilities
Strong merchant business
ERCOT and ex-ERCOT platform
TXU Corp
Capital/Credit
Structuring and risk
management
New deal flow
Credit Suisse First Boston
TradeCo JV

TXU Power

16
A Solid Advantage: ERCOT Full Load Average Implied Heat Rate04; MMBtu/MWh
Well Positioned Generation in the ERCOT Market
TXU units3
6
9
12
15
18
21
24
10 20 30 40 50 60 70 80Cumulative GWs
Nuclear(2.3 GW)
Lignite(5.8 GW)
Gas(10.9 GW)
Solid fuel capacity provides low cost baseload power
Gas fleet provides necessary shaping and ancillary services

17
TXU Is a Good Operator and Becoming a Great Operator
Lignite Capacity Factors02-05; Percent
78
85
Nuclear Capacity Factors2
02-05; Percent
82
88
8587
89
Top Decile 87
Top Decile 94 93
90
02 03 04E 05E Aspir-ation
94
02 03 04E 05E Aspir-ation
1 Includes outage costs, O&M projects, and capital expenditures2 Both nuclear units were refueled in 2002 and are expected to be refueled again in 2005, as opposed to refueling one each year
Lignite Investment1
03-06; $ Million
Nuclear Investment1
03-06; $ Million
04E-06EAverage
03
51
7751%51%
04E-06EAverage
03
144
21046%46%

18
TXU Will Focus On Achieving Strong Operating Performance
632
155
1,020
03OBIT3
2,087
783
1,919
03Contribution Margin1
2,367
1,118
2,238
05E
13%
43%
17%
Change
1,455
628
899
03Operating Costs2
1,649
505
1,004
05E
13%
20%
12%
Change
718
613
1,234
05E
14%
390%
21%
Change
TXU Power
TXU Electric Delivery
TXU Energy4
TXU Businesses
1 Contribution margin = Operating revenues less cost of energy sold and delivery fees2 Operating costs = Operating costs, depreciation and amortization, SG&A, franchise and revenue based taxes, and other income and other deductions3 OBIT = Operational earnings before gross interest and income tax expense4 TXU Energy includes TradeCo and excludes hedging losses of $138 million in 2003 and $112 million in 2005
Core Business Financial Profile03-05; $ Millions

Key Questions

20
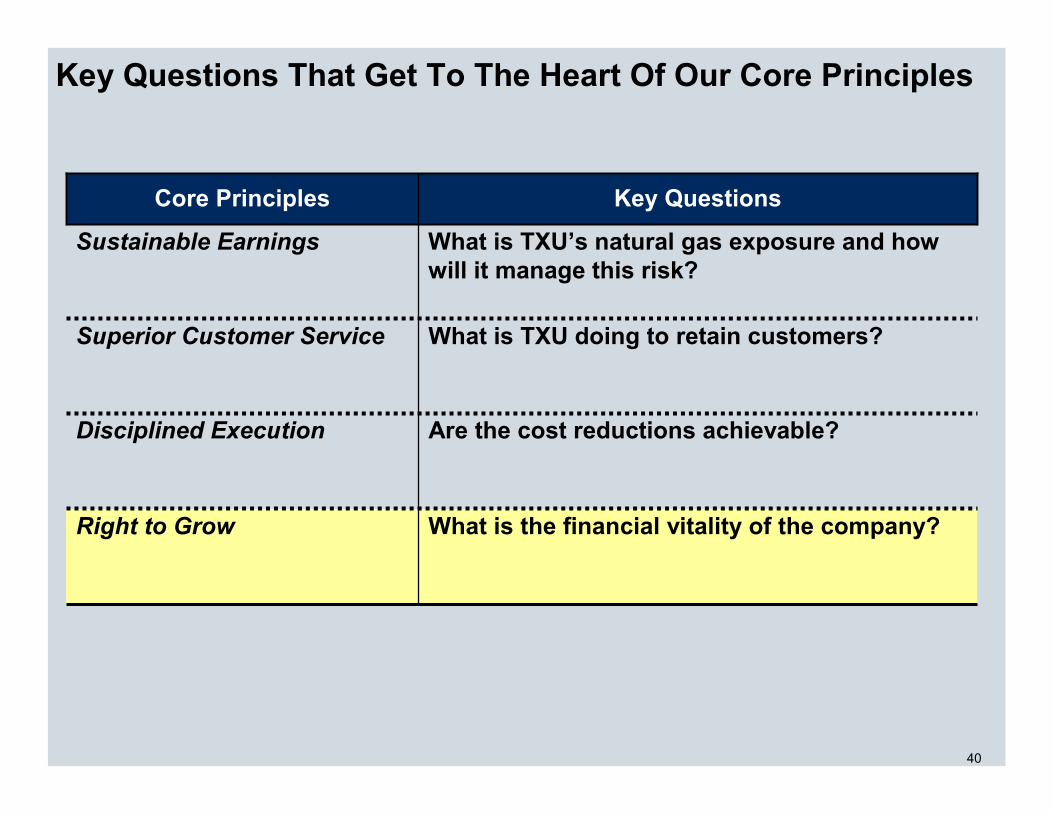
Key Questions That Get To The Heart Of Our Core Principles
What is TXU’s natural gas exposure and how will it manage this risk?
Sustainable Earnings
What is TXU doing to retain customers?Superior Customer Service
What is the financial vitality of the company?Right to Grow
Disciplined Execution
Core Principles
Are the cost reductions achievable?
Key Questions

21
Integrated Industrial Companies: Less Volatility…
0.9
1.3
3.2
13.6
16.6
Oil and Gas Industry94-04; Earnings Volatility1
1 Earnings volatility measured as standard deviation in quarterly earnings from 94-04, indexed to 94 1Q earnings
Royal Dutch/ Shell
BP
Exxon Mobil
Burlington
Anadarko
Apache
1.2
0.4
1.9
3.7
3.7
5.0
Pulp and Paper Industry94-04; Earnings Volatility1
Weyerhaeuser
Georgia Pacific
InternationalPaper
Abitibi
Aracruz
Sappi
1.6Integrated Integrated

22
…And TXU Sees These Same Benefits of Integration
1 Includes energy and production solid fuel costs, wires costs, marketing and generation G&A and marketing expenses
Economics of Energy and Production02-05; $/MWh (illustrative)
02 03 04 05E
Wholesale 7X24 power prices
Fixed costs1
Energy Energy MarginMargin Production
Margin
Energy gross margins are driven by PTB actions and/or gas pricesand are counter-cyclical to TXU Power margins
Energy gross margins are driven by PTB actions and/or gas pricesand are counter-cyclical to TXU Power margins
Price-to-Beat (PTB)
Supply, trading & shaping costs

23
Our New View Of Our Underlying Exposure…
New ViewOld View
• Long-term/value• Short-term earnings/ financial viability
• Capture the upside from commodity moves
• Leverage balance sheet and strong earnings to hedge downside
• Willing to sacrifice the upside at significant cost to protect against lost customers
• Sustainable headroom margins of 20-30%
• No view
• Retain profitable customers willing to pay for the risk and costs to serve
• Retain customers at all costs
• Strike PTB mechanically with gas prices
Customer Retention
Sustainable and adjusted
margins
Risk Management
Strategy
Risk Horizon
24
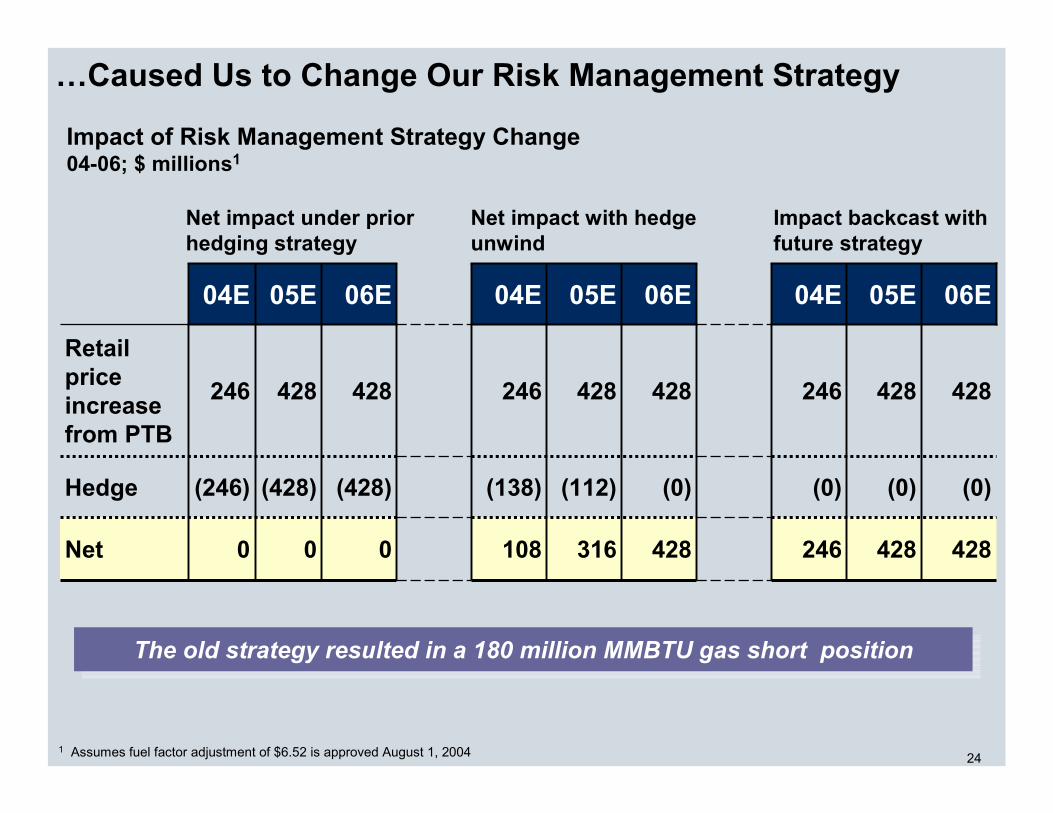
…Caused Us to Change Our Risk Management Strategy
Net impact under prior hedging strategy
Impact backcast with future strategy
Net impact with hedge unwind
0
(428)
428
06E
428
(0)
428
06E
316
(112)
428
05E
108
(138)
246
04E
246
(0)
246
04E
428
(0)
428
05E
42800Net
Hedge
Retail price increase from PTB
(0)(428)(246)
428428246
06E05E04E
The old strategy resulted in a 180 million MMBTU gas short positionThe old strategy resulted in a 180 million MMBTU gas short position
Impact of Risk Management Strategy Change04-06; $ millions1
1 Assumes fuel factor adjustment of $6.52 is approved August 1, 2004

25
We Adapted Our Strategy to Make the Company Neutral to Downside Gas Price and Long To Upside Gas Price
307
(52)
+359
(100)+4591
05 at $7.10 Fuel Factor3
+39Net underlying position
(52)Fixed price wholesale contractsNet position
Retail PTBGeneration
Position Type
(13)
(420)2
+4591
05 at $6.52 Fuel Factor Long Term
1 58.8 TWh of solid fuel generation at a marginal heat rate of 7.3 MMBtu/MWh2 47.3 TWh of retail load at a marginal heat rate of 7.9 MMBtu/MWh and 12.5 adder3 Position prior to a strike up; assumes strike effective March 1st 2005
Natural gas equivalent positions05; Million MMBTU

26
Integrated Position: Gas Upside and Mitigated Gas Downside
5.10 5.60 6.10 6.60 7.102
24
19
14
9
4
PTB full year volume churn1
Percent
EPS Change (relative to May 18th)05E; Dollars per share
$6.52 fuel factor$7.10
fuel factor
Average 2005 Henry Hub Gas price$/MMBtu
1 SMB churn assumed to be 0.5% higher; assumes SMB margin changes consistent with residential margin changes; Retail position based on a heat rate of 7.7 MMBTU/MWH, 12.5% adder and fixed adder of $6.6/MWH; Generation heat rate = 7.3 MMBTU/MWH (takes into account coal on the margin)
2 Assumes strike effective March 1st, 2005
$6.24 fuel factor
-0.34
-0.26
-0.17
-0.09
0.00
-0.29
-0.15
-0.02
0.13
0.25
-0.21
-0.10
0.02
0.13
0.24
-0.13
-0.04
0.05
0.14
0.23
-0.06
0.01
0.08
0.15
0.22
0.32
0.39
0.46
0.52
0.59
5.94
May 18th
view
UpsideSensitivity
DownsideSensitivity
06/10/04curve

27
Our Future Position Will Become Long Due to Retail Churn…
1 58.8 TWh of solid fuel generation at a marginal heat rate of 7.3 MMBtu/MWh2 Future volumes estimated at 79%-86% of 05 volumes; assumes no PTB fuel factor change3 LBM position not a short in the long-term scenario since prices are re-adjusted at renewal4 Position prior to a strike up; assumes strike effective March 1st 2005
307
(52)
+359
(100)+4591
05 at $7.10 Fuel Factor4
+99-129+39Net underlying position
03(52)Fixed price wholesale contractsNet position
Retail PTBGeneration
Position Type
(13)
(420)+4591
05 at $6.52 Fuel Factor
+99-129
(330-360)2
+4591
Long Term
Natural gas equivalent positionsMillion MMBTU

28
…But Our Integrated Business Can Mitigate Exposure
4.50 5.00 5.50 6.00
50
60
70
80
90
Total PTB load relative to 05 volumes Percent
Illustrative EPS1 Change relative to 2005 (May 18th view)Long-term; Dollars per share
Average Forward Curve$/MMBTU
1 Matrix represents change in EPS relative to 2005 with similar assumptions with the following exceptions: fixed price wholesale contracts = 0; Retail SG&A costs ($280 MM) decrease linearly on a percentage basis with retail load
4.00
-1.41
-1.11
-0.82
-0.52
-0.22
-1.16
-0.90
-0.65
-0.39
-0.14
-0.90
-0.69
-0.48
-0.27
-0.05
-0.64
-0.48
-0.31
-0.14
0.03
-0.39
-0.26
-0.14
-0.01
0.11
Management actions to mitigate exposure:
• Tactical marketing and pricing
• New product offerings
• Cost reductions
Management actions to mitigate exposure:
• Tactical marketing and pricing
• New product offerings
• Cost reductions

29
0%
5%
10%
15%
20%
25%
30%
35%
40%
45%
1.0 2.0 3.0 4.0 5.0 6.0 7.0
The Best Medicine: Healthier Balance Sheet
03
05
Interest expensereduction from debt repurchase
1.9X .9X
EBIT improvement from performance
initiatives
EBIT/gross interest distribution frequency03-05; Percent of trials
EBIT/gross interest; Ratio

30
Key Questions That Get To The Heart Of Our Core Principles
What is TXU’s natural gas exposure and how will it manage this risk?
Sustainable Earnings
What is TXU doing to retain customers?Superior Customer Service
What is the financial vitality of the company?Right to Grow
Disciplined Execution
Core Principles
Are the cost reductions achievable?
Key Questions

31
Significant Improvements in Customer Service…
Call waiting time03-04; seconds 94%
First call resolution03-04; percent
Average monthly PUC complaints03-04; number
Customer satisfaction with agent03-04; percent
31%
12%
31%
268
15
6180
51
57
437
300
03 Target04 YTD
3931
03 Target04 YTD
65
03 Target04 YTD
52
03 Target04 YTD
88

32
…Has Had Positive Impact on Our Churn
Residential2
02-04; Percent1
SMB2
60
100
70
100
80
01/03 01/05
8090
1 Market share based on customer count2 Assumed no market size growth between March 2004 and May 2004
4.26.6
1.87.2
Annualized 04 customer
churnPercent
Annualized 02-03 customer
churnPercent
01/0401/02
01/02 01/03 01/0501/04

33
70%
80%
90%
100%
This Is Consistent With Evolution in Other Industries
Incumbent Wireline Market Share96-02; Percent
96 97 98 99 00 01 02 03
Wireline deregulation is very analogous to energy deregulation:
• Incumbent with a long history of operation
• Incumbent with infra-structure assets controlling access
• De-regulation forced opening access to other players
• Regulated pricing structure
2.3%annual churn

34
Retail Headroom Should Rise Over the Next Two Years…
NYMEX Gas$/MMBtu
Retail Headroom1
Percent
1 Headroom = (PTB – Generation – Wires)/PTB; based on average of forward looking 12 months; forward curve as of June 9, 2004
0
5
10
15
20
25
30
35
0
1
2
3
4
5
6
7
NYMEX 12-month strip
TXU retail headroom
02 05E04E 06E03 07E
Margin History and Outlook01-06; Mixed Measures

35
0%
10%
20%
30%
40%
…Staying in Line With Others in The ERCOT Market…
Reliant2
TXU
1 Headroom = PTB – Wholesale price *1.3 – Wire charges2 Reliant costs assumed to be 102% of TXU costs based on North-Houston zone differentials
Headroom1
03-06; Percent
Actual Estimate
05/03 05/05 05/0605/04
Assumes TXU fuel factor adjustment of $6.52/MMBTU is approved in August

36
… and Lower Than Others When Normalized for Volatility
Volatility1 of Gross Margin99-04 (except TXU=02-04); Percent
Gross Margin Per Volatility99-04; no units
Gross Margin99-04 (except TXU=02-04); Percent
Specialty apparel
Depart-mentstores
Grocery stores
Super-center stores
Drug stores
TXU retail
55
3830 28 26
16
Specialty apparel
Depart-mentstores
Grocery stores
Super-center stores
Drug stores
TXUretail
8.9 6.0 3.0 3.5 3.7
49.9Specialty apparel
Depart-mentstores
Grocery stores
Super-center stores
Drug stores
TXUretail
6.1 6.3
9.98.1
7.0
0.3
1 Defined as standard deviation of quarterly gross margin normalized by initial gross margin

37
Key Questions That Get To The Heart Of Our Core Principles
What is TXU’s natural gas exposure and how will it manage this risk?
Sustainable Earnings
What is TXU doing to retain customers?Superior Customer Service
What is the financial vitality of the company?Right to Grow
Disciplined Execution
Core Principles
Are the cost reductions achievable?
Key Questions

38
05 Cost Focus: Reducing SG&A While Improving Reliability…
2003O&M
2005 PlanO&M
Less:Gas,
Australia
2003Continuing
Increase
1,6651,395
27050 1,445
4%4%
2003O&M +SG&A
2005 PlanO&M + SG&A
Less:TXU Gas,Australia
2003Continuing
O&M +SG&A
Reduction
2,773
2,246
527
71 2,175
3%3%
2003SG&A
2005 Plan
SG&A
Less:Gas,
Australia
2003Continuing
Decrease
1,108851
257121
730
14%14%
O&M Costs03-05; $ Millions
SG&A Costs03-05; $ Millions
O&M and SG&A Costs03-05; $ Millions

39
… Leaving Room for Significant Cost Savings Opportunities In the Future SG&A Continuing Operations98-05E; $ million
597 647 701852
1,035851
730
98 99 00 01 02 03 05E
Achieving 98 SG&A cost levels would save $130 million
Achieving 98 SG&A cost levels would save $130 million
Operating Cost1 Per Dollar of Contribution Margin2
03; Percent48
40 3732
42
Utility Average
Top Quartile
Top Decile
Best-in-Class
TXU
1 Operating cost is the sum of O&M and SG&A costs2 Contribution Margin: Operating Revenues less Cost of Energy Sold and Delivery Fees
Based on 03 operating cost, TXU could save $582 million with best-in-class performance
Based on 03 operating cost, TXU could save $582 million with best-in-class performance
40
Key Questions That Get To The Heart Of Our Core Principles
What is TXU’s natural gas exposure and how will it manage this risk?
Sustainable Earnings
What is TXU doing to retain customers?Superior Customer Service
What is the financial vitality of the company?Right to Grow
Disciplined Execution
Core Principles
Are the cost reductions achievable?
Key Questions
41
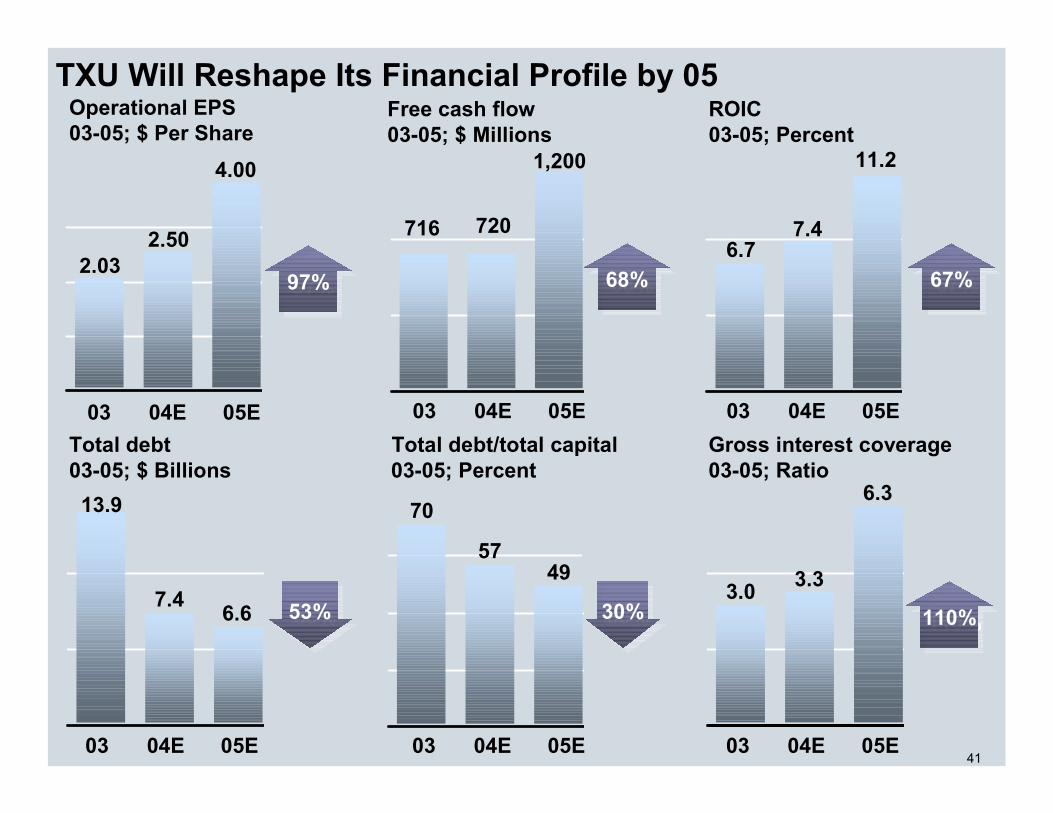
TXU Will Reshape Its Financial Profile by 05Operational EPS03-05; $ Per Share
04E 05E03
2.03
4.00
2.50
97%97%
ROIC03-05; Percent
6.7
11.2
7.4
67%67%
04E 05E03
Free cash flow03-05; $ Millions
716
1,200
720
68%68%
04E 05E03Total debt03-05; $ Billions
13.9
6.67.453%53%
04E 05E03
Gross interest coverage03-05; Ratio
3.0
6.3
3.3
110%110%
04E 05E03
Total debt/total capital 03-05; Percent
30%30%
70
4957
04E 05E03

42
TXU Will Follow a Strict Capital Allocation Philosophy…TX
UB
usin
ess
Uni
ts
Oper/Divestcashflow
ExcessReinvest
-ment
Yes, If
Investments have high
returns and short payback
Yes
“Customer”capital
Ensure quality service and reliability
Debtholders
Debtreduction
Yes, until
Financially flexible and
strong
Excess
Yes
100% TXU Delivery payout
Excess
Equityholders
Dividendpayout
Repurchases or distributions
Retained forinvestment
Excess
20%
80%

43
…Managing Execution Risk of Our Key Value Drivers…Lo
wM
ediu
mH
igh
Repurchaseof securities(16%)
Cumulative Risk of Operational EPS Improvements03-06
Divested businessesnet of debt reduction(4%)
1st PTB strikenet of share loss(21%)
Strategicsourcing(6%)
CapgeminiEnergy(16%)Hedge
roll-off(12%)
2nd PTB strike net of share loss(12%)
Electric Deliveryimprovement(6%)
Other(11%)
0%(~$2.03)
25% 50% 75% 100%(~$4.50)
Percent of Cumulative 03-06 Operational EPS Improvement

44
LeadingIndustrialCompany
…And Creating a Compelling Investment Thesis
Strategy
1. Focus on four solid core businesses: Power, Electric Delivery, TradeCo, and Energy
Execution
1. Aggressive, yet achievable, phased approach
2. Rigorous focus on customer service, reliability, value drivers, and risks
People
1. Highly visible and transparent P&L
2. Performance culture with alignment of incentives
Finance
1. Doubled earnings power2. Increased free cash flow
by 70%3. Increased returns by 65%4. Cut debt in half5. Increased interest
coverage by 100%6. Positioned 06 for double
digit growth

45
Appendix

46
Description of Special Items$ Millions after tax
75Mine and gas plant closures
75Debt reacquisition costs
90Software write-offs
360
50
70
04E
0
05E
Total
Inventory write down – spare parts
Severance and other compensation costs
Special Items

47
Financial Measures
Cash provided by operating activities (GAAP) before changes in assets and liabilitiesOperating cash flow (OCF)
Operation and maintenance expenses are shown as “operating costs” on TXU Corp and segment income statements.O&M
Net income before gross interest and income tax expenseEBIT
Operating revenues – cost of energy sold and delivery feesContribution margin
Operational earnings before gross interest and income tax expenseOBIT
(Operational earnings + preference stock dividends + after-tax gross interest expense) / average total capitalizationReturn on invested capital (non-GAAP)
Interest and related charges from the income statementGross interest
Unusual non-recurring charges or gains, primarily related to implementation of the 4+4 performance improvement program. Management excludes these in determining operational earnings for budget and performance management purposes
Special items
Income from continuing operations before extraordinary items and cumulative effect of changes in accounting principles from the income statement
Income fromcontinuing operations
Shareholders’ equity – preference stockCommon equity
Long-term debt (including current portion) + bank loans and commercial paper + long term debt held by subsidiary trusts + preferred securities of subsidiaries & exchangeable preferred member interests – securitization bonds
Total debt(non-GAAP)
Total debt + shareholders’ equityTotal capitalization(non-GAAP)
From balance sheetShareholders’ equity
(Income from continuing operations before gross interest and income tax expense + depreciation and amortization) / Gross InterestGross Interest Coverage
Operational earnings / average common equityReturn on equity(non-GAAP)
Cash provided by operating activities – changes in assets and liabilities – capital expenditures (including nuclear fuel)Free cash flow(non-GAAP)
Income from continuing operations less preference share dividends and excluding special items / weighted average diluted common shares outstanding
Operational earnings per share (non-GAAP)
DefinitionMeasure

Appendix
Regulation G Reconciliations
TXU management is currently unable to accurately estimate the impact of special items or changes in accounting principles or policies on free cash flow, return on invested capital, total debt to total capitalization or gross interest coverage. TXU is therefore currently unable to provide the most directly comparable GAAP measure to these items.

49
Reconciliation 1 - TXU Energy Company LLCContribution margin, Operating costs and OBITFor the year ended December 31, 2003; $ Millions
Operating revenues 7,995$ Cost of energy sold and delivery fees (5,124) Contribution margin 2,871$
Contribution margin - Power 1,919$ Contribution margin - Energy 783 Reclassification of trading to net margin in SG&A 307 Hedge loss (138) Total Contribution margin 2,871$
Operating costs 691$ Depreciation and amortization 409 Selling, general and administrative expense 636 Franchise and revenue-based taxes 124 Other income (48) Other deductions 22 Operating costs 1,834$
Operating costs - Power 899$ Operating costs - Energy 628 Reclassification of trading to net margin in SG&A 307 Total operating costs 1,834$
Income from continuing operations before income taxes, extraordinary loss and cumulative effect of changes in accounting principles 722$ Interest expense and related charges 323 Interest income (8) OBIT 1,037$
OBIT - Power 1,020$ OBIT - Energy 155 Hedge loss (138) Total operating costs 1,037$

50
Reconciliation 2 - TXU Energy Delivery (formerly Oncor Electric Delivery Company)Contribution margin, Operating costs and OBITFor the year ended December 31, 2003; $ Millions
Operating revenues Affiliated 1,489$ Nonaffiliated 598 Contribution margin 2,087$
Operation and maintenance 786$ Depreciation and amortization 297 Taxes other than income 376 Other income (8) Other deductions 4 Operating costs 1,455$
Income before extraordinary loss 258$ Income taxes 106 Nonoperating income taxes 20 Interest income (52) Interest expense and related charges 300 OBIT 632$

51
Reconciliation 3 - TXU CorpOperating Cost Per Dollar of Contribution MarginFor the year ended December 31, 2003 $ Millions
Revenue 11,008$ Cost of Energy 4,947
Contribution Margin 6,061$
Operating Costs 1,665 SG&A 1,108 Less payroll and property taxes (257)
Total operating expenses 2,516$
Operating cost per dollar of contribution margin 42%

52
Reconciliation 4 - TXU CorpOperational earnings per share (EPS)For the year ended December 31, 2003 $ Millions except per share amounts
Income from continuing operations before extraordinary lossand cumulative effect of changes in accounting principles 737$
Less Preference stock dividends (22)
Operational earnings 715
After-tax interest on preferred membership interests in TXU Energy 53
Adjusted operational earnings for diluted EPS calculation 768
Average shares of common stock outstanding - diluted (millions) 379
Operational earnings per share - diluted 2.03$
53
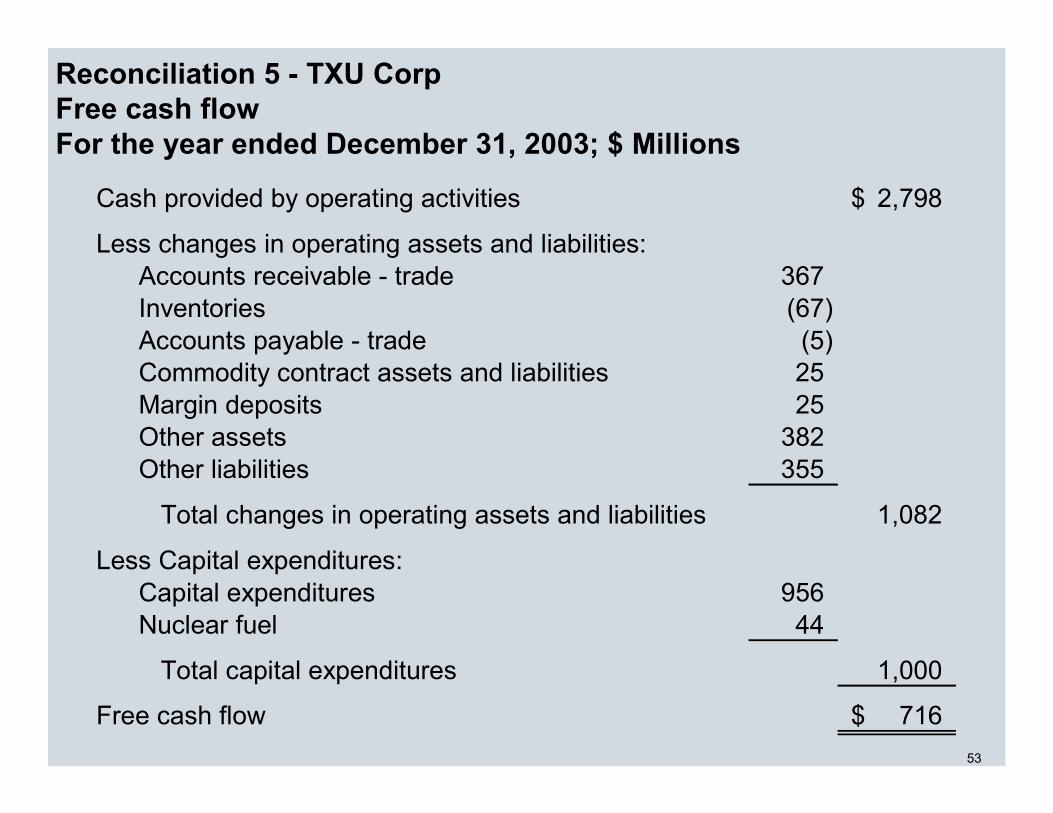
Reconciliation 5 - TXU CorpFree cash flowFor the year ended December 31, 2003; $ Millions
Cash provided by operating activities 2,798$
Less changes in operating assets and liabilities:Accounts receivable - trade 367 Inventories (67) Accounts payable - trade (5) Commodity contract assets and liabilities 25 Margin deposits 25 Other assets 382 Other liabilities 355
Total changes in operating assets and liabilities 1,082
Less Capital expenditures:Capital expenditures 956 Nuclear fuel 44
Total capital expenditures 1,000
Free cash flow 716$

54
Reconciliation 6 - TXU CorpReturn on invested capital (ROIC)For the year ended December 31, 2003$ Millions
Operational Earnings 715 Preference dividends 22 After-tax gross interest expense 634
Total Return 1,371
Shareholders' equity 5,919 Total debt 13,903 Securitization bonds 500
Total invested capital 20,322
Return on invested capital 6.7%

55
Reconciliation 7 - TXU CorpTotal debt/total capital calculation at December 31, 2003 $ Millions
Notes PayableCommercial paper 39$ Banks 58
Long-term debt due currently 677 Long-term debt held by subsidiary trusts 546 All other long-term debt, less amounts due currently 12,324
Less securitization bonds (500) Preferred securities of subsidiaries 759
Total debt 13,903
Shareholders' equity 5,919
Total capital 19,822$
Total debt/total capital percent 70%

56
Reconciliation 8 - TXU CorpGross interest coverageFor the year ended December 31, 2003$ Millions
Income before income taxes, extraordinary loss and cumulative effect of change in accounting principles 1,051$
Interest expense and related charges 975
Depreciation and amortization, other than goodwill 886
Income from continuing operations before interest, tax and D&A 2,912$
Gross interest 975
Gross interest coverage 3.0


![Analyst Day Consolidated Book - RRD.ppt [Read-Only]media.corporate-ir.net/media_files/irol/19/196053/AnalystDay_TDG.pdfCDA InterCorp. Avtech ADS ... Organizational Philosophy Corporate](https://static.fdocuments.net/doc/165x107/5b093fcd7f8b9a51508d07f8/analyst-day-consolidated-book-rrdppt-read-onlymediacorporate-irnetmediafilesirol19196053analystdaytdgpdfcda.jpg)