Deutsche Bank AGDeutsche Bank AG Strategy 2015+: Progress ... · Morgan Stanley European Financials...
21
Deutsche Bank Deutsche Bank AG Deutsche Bank AG Strategy 2015+: Progress update Anshu Jain, Co-Chairman of the Management Board and the Group Executive Committee Morgan Stanley European Financials Conference London 21 March 2013 London, 21 March 2013
Transcript of Deutsche Bank AGDeutsche Bank AG Strategy 2015+: Progress ... · Morgan Stanley European Financials...

Deutsche Bank
Deutsche Bank AGDeutsche Bank AGStrategy 2015+: Progress update Anshu Jain, Co-Chairman of the Management Board and the Group Executive Committee
Morgan Stanley European Financials Conference London 21 March 2013London, 21 March 2013
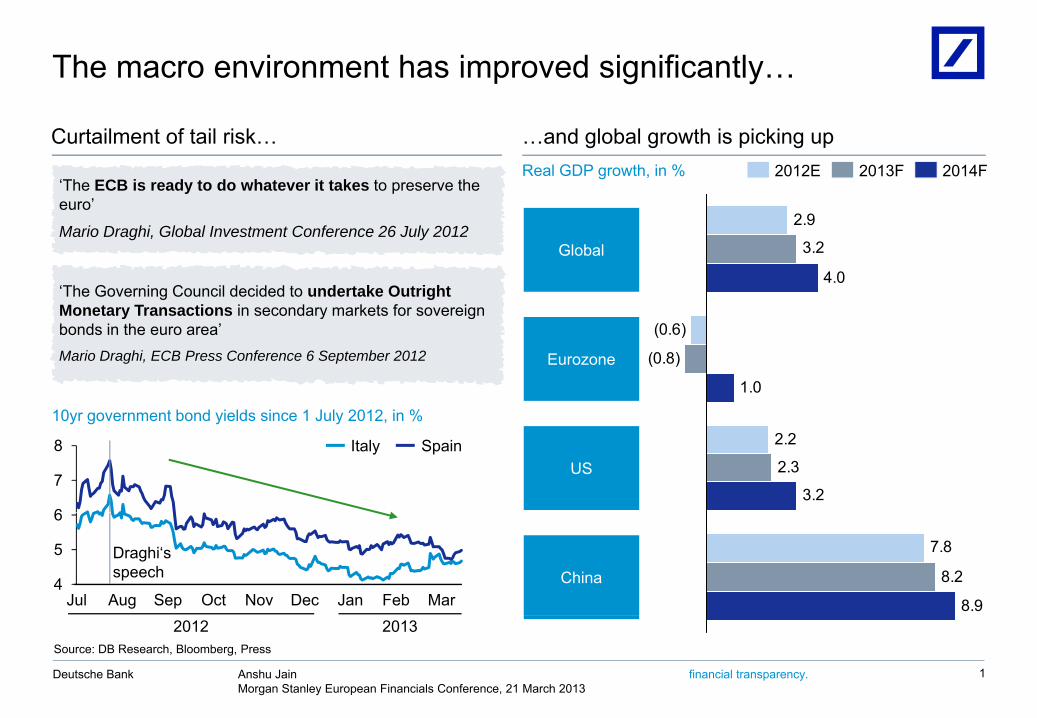
The macro environment has improved significantly…
Curtailment of tail risk… …and global growth is picking up
‘The ECB is ready to do whatever it takes to preserve the euro’
Real GDP growth, in % 2014F2012E 2013F
euro
Mario Draghi, Global Investment Conference 26 July 2012
‘The Governing Council decided to undertake Outright Monetary Transactions in secondary markets for sovereign
2.9
3.2
4.0
Global
Monetary Transactions in secondary markets for sovereign bonds in the euro area’Mario Draghi, ECB Press Conference 6 September 2012
(0.6)
(0.8)
1.0
10 t b d i ld i 1 J l 2012 i %
Eurozone
2.2
2.3
3.2
10yr government bond yields since 1 July 2012, in %
6
7
8 SpainItalyUS
7.8
8.2
8.9Jul Aug Sep Oct Nov Dec Jan Feb Mar4
5
6
Draghi‘sspeech China
Anshu JainMorgan Stanley European Financials Conference, 21 March 2013
Deutsche Bank financial transparency. 1
Source: DB Research, Bloomberg, Press
2012 2013
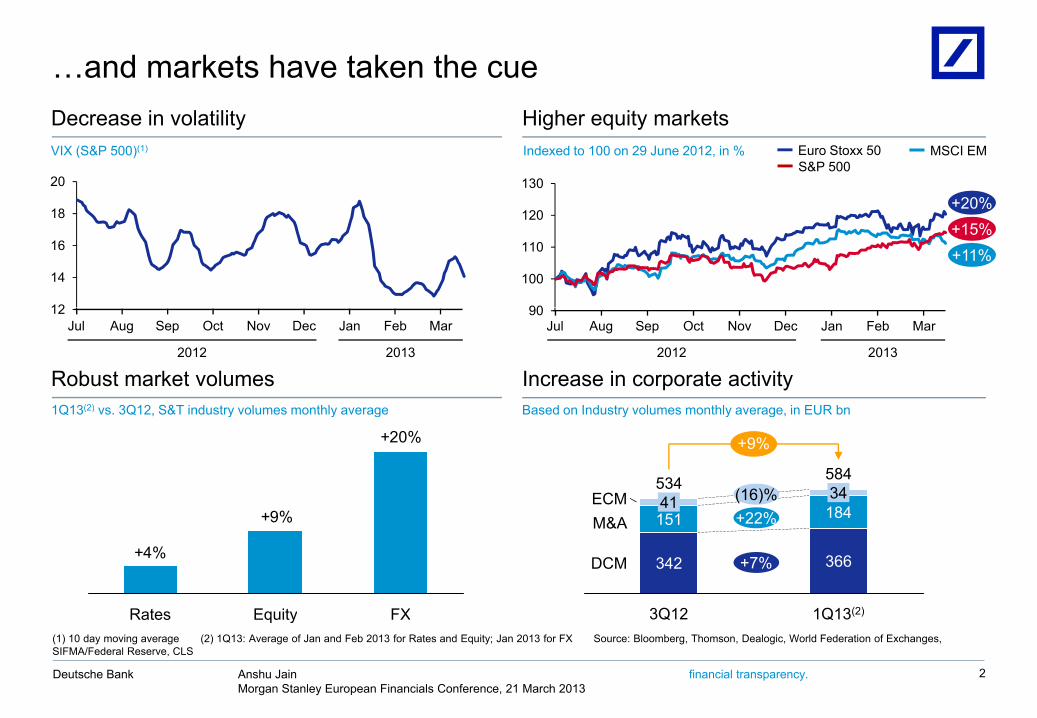
…and markets have taken the cueDecrease in volatility Higher equity markets
130
Indexed to 100 on 29 June 2012, in % Euro Stoxx 50 MSCI EMS&P 500
VIX (S&P 500)(1)
20
+20%
90
100
110
120
12
14
16
18+20%+15%+11%
Robust market volumes Increase in corporate activity
90Jul Aug Sep Oct Nov Dec Jan Feb Mar
Based on Industry volumes monthly average in EUR bn1Q13(2) vs 3Q12 S&T industry volumes monthly average
Jul Aug Sep Oct Nov Dec Jan Feb Mar12
2012 2013 2012 2013
+20%
9%
+9%
ECM584
18434534
41 (16)%22%
Based on Industry volumes monthly average, in EUR bn1Q13(2) vs. 3Q12, S&T industry volumes monthly average
+9%
+4%
FXEquityRates
DCM
M&A
1Q13(2)
366
184
3Q12
342
151 +22%
+7%
Anshu JainMorgan Stanley European Financials Conference, 21 March 2013
Deutsche Bank financial transparency.
FXEquityRates
2
(1) 10 day moving average (2) 1Q13: Average of Jan and Feb 2013 for Rates and Equity; Jan 2013 for FX Source: Bloomberg, Thomson, Dealogic, World Federation of Exchanges, SIFMA/Federal Reserve, CLS
1Q13( )3Q12

Industry consolidation validates our strategic view
Changing competitive landscape… …and share gains for global leadersCumulative market share of top-5 players
FICC Equities
Pro-forma B3 RWA-equivalent in investment bank, in EURbn
2011 2014/2015
504644 444341
FICC Equities
<200~240(1)
2011 2014/2015
European bank A(2)
41
~140>210
European bank B(3) <60
>170
European bank C(4)
2013E20122011 2013E20122011
>160 <100
Anshu JainMorgan Stanley European Financials Conference, 21 March 2013
Deutsche Bank financial transparency. 3
(1)CB&S excluding NCOU in 2011; December 2015 target (2) Investment Bank; 2011 as of September; December 2014 target (3) Investment Bank; 2011 including non-core; December 2015 target excl. non-core (which together with legacy portfolio is expected to decrease by ~EUR 40bn from 2013-2015 to ~EUR 45bn by YE2015) (4) Markets division; December 2014 target Source: DB Research, company information

Strategy 2015+: Progress against our published goals
We aspire to be the leading client-centric global universal bank
Capital
Costs
Competencies
ClientsClients
Culture
Anshu JainMorgan Stanley European Financials Conference, 21 March 2013
Deutsche Bank financial transparency. 4

Revised 4Q / FY 2012 results at a glanceIn EUR bn, unless otherwise statedIn EUR bn, unless otherwise stated
P fNet revenues
2012 old
7.9
2012 old
33.7
2012 new
33.7
2012 new
7.9
4Q FY
Performance highlights Core Tier 1 ratio, Basel 3 fully loaded, in %(1)
Dividend per share(2), EUR
Reported Group IBIT
8.0-
(2 6)
8.00.75
1 4
7.80.75
0 8
7.8-
(3 2)
Impact on profitability Core Bank impairments(3)
Core Bank significant litigation(4)
Non-Core Operations Unit Reported Group IBIT
(1.5)(1 0)
(1.1)(2.6)
(1.5)(1 3)
(2.4)1.4
(1.5)(1 4)
(2.9)0.8
(1.5)(1 1)
(1.6)(3.2)
Core Bank significant litigation( )
Core Bank adjusted IBIT(1.0)
1.0(1.3)
6.5(1.4)
6.5(1.1)
1.0
— IFRS requires the reflection of significant adjusting events emerging after the balance sheet date in the financial statements if they become known before the release and publication of those
— Based on these IFRS requirements, the Bank has increased its provisions for litigation by EUR 0.6 bn to EUR 2.4 bn. Contingent liabilities in respect of significant legal and regulatory matters declined by approximately EUR 0.5 bn to EUR 1.5 bn
Anshu JainMorgan Stanley European Financials Conference, 21 March 2013
Deutsche Bank financial transparency. 5
Note: Core Bank includes CB&S, GTB, AWM, PBC, and C&A; numbers may not add up due to rounding (1) Pro-forma (2) Proposed (3) Impairment of intangible assets (4) >EUR 100m
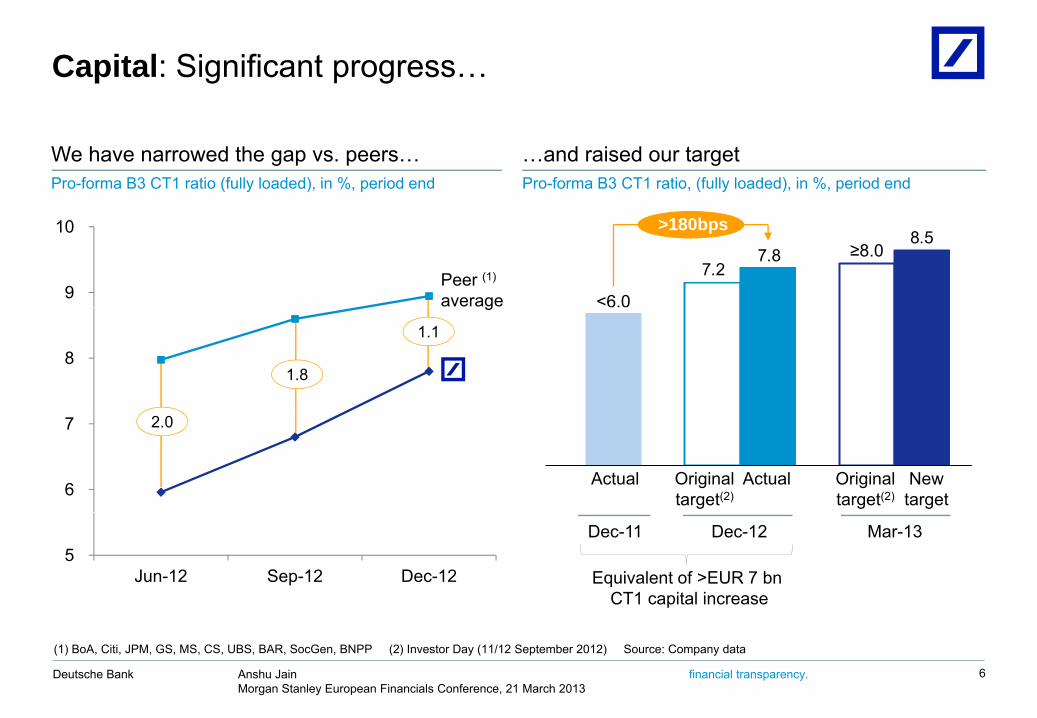
Capital: Significant progress…
We have narrowed the gap vs. peers…Pro-forma B3 CT1 ratio (fully loaded), in %, period end
…and raised our targetPro-forma B3 CT1 ratio, (fully loaded), in %, period end
7.2
8.57.8
<6.0
>180bps≥8.0
9
10
Peer (1)
average
1.1
1.88
g
Actual Actual Originaltarget(2)
Originaltarget(2)
Newtarget
2.0
6
7
Equivalent of >EUR 7 bnCT1 capital increase
Dec-11 Dec-12 Mar-135
Jun-12 Sep-12 Dec-12
Anshu JainMorgan Stanley European Financials Conference, 21 March 2013
Deutsche Bank financial transparency. 6
(1) BoA, Citi, JPM, GS, MS, CS, UBS, BAR, SocGen, BNPP (2) Investor Day (11/12 September 2012) Source: Company data
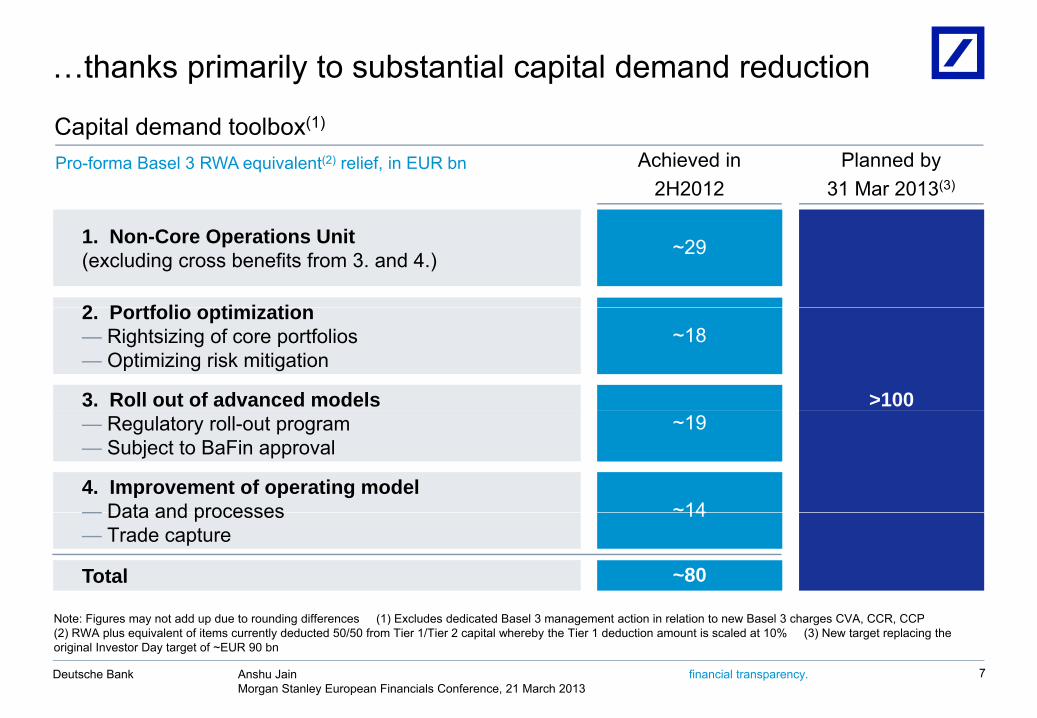
…thanks primarily to substantial capital demand reduction
Capital demand toolbox(1)
Pro-forma Basel 3 RWA equivalent(2) relief, in EUR bn Achieved in 2H2012
Planned by 31 Mar 2013(3)
2 P tf li ti i ti
1. Non-Core Operations Unit(excluding cross benefits from 3. and 4.) ~29
2. Portfolio optimization— Rightsizing of core portfolios— Optimizing risk mitigation
3. Roll out of advanced models
~18
>100— Regulatory roll-out program— Subject to BaFin approval
4. Improvement of operating model— Data and processes
~19
~14
N t Fi t dd d t di diff (1) E l d d di t d B l 3 t ti i l ti t B l 3 h CVA CCR CCP
— Data and processes— Trade capture
Total ~80
14
Anshu JainMorgan Stanley European Financials Conference, 21 March 2013
Deutsche Bank financial transparency. 7
Note: Figures may not add up due to rounding differences (1) Excludes dedicated Basel 3 management action in relation to new Basel 3 charges CVA, CCR, CCP(2) RWA plus equivalent of items currently deducted 50/50 from Tier 1/Tier 2 capital whereby the Tier 1 deduction amount is scaled at 10% (3) New target replacing the original Investor Day target of ~EUR 90 bn
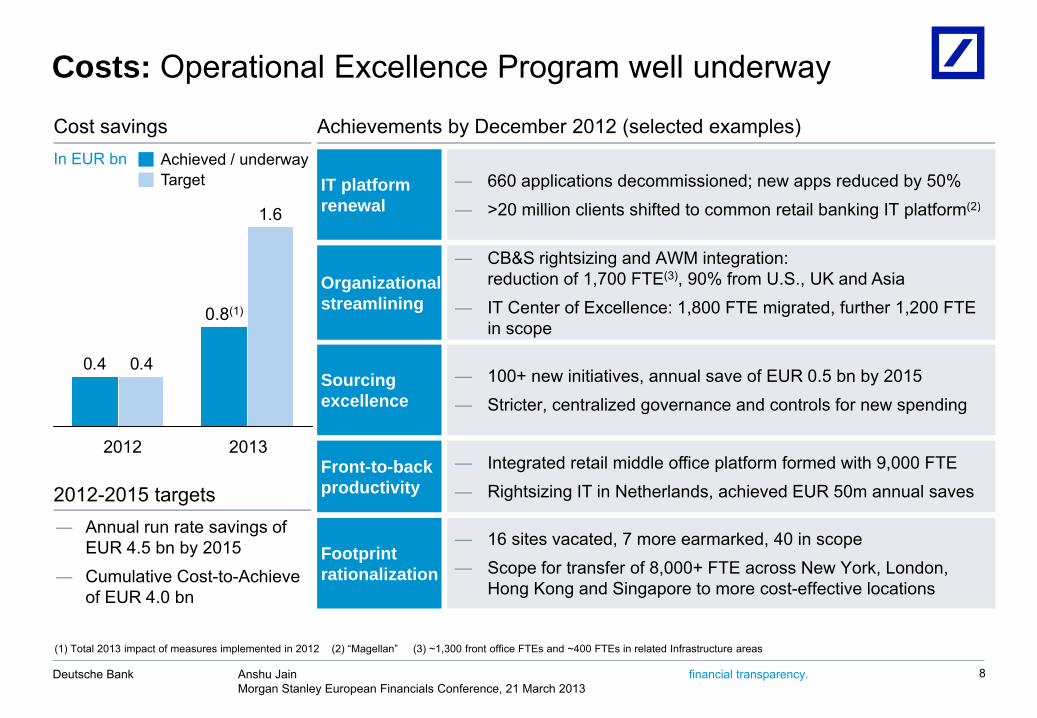
Costs: Operational Excellence Program well underway
IT platform renewal
Cost savings Achievements by December 2012 (selected examples)
— 660 applications decommissioned; new apps reduced by 50%>20 illi li t hift d t t il b ki IT l tf (2)
In EUR bnTargetAchieved / underway
Organizational streamlining
renewal
— CB&S rightsizing and AWM integration: reduction of 1,700 FTE(3), 90% from U.S., UK and AsiaIT Center of Excellence: 1 800 FTE migrated further 1 200 FTE
— >20 million clients shifted to common retail banking IT platform(2)1.6
0 8(1)
Sourcing excellence
streamlining
— 100+ new initiatives, annual save of EUR 0.5 bn by 2015— Stricter, centralized governance and controls for new spending
— IT Center of Excellence: 1,800 FTE migrated, further 1,200 FTE in scope
0.4 0.4
0.8(1)
Front-to-back productivity2012-2015 targets
Stricter, centralized governance and controls for new spending
— Integrated retail middle office platform formed with 9,000 FTE— Rightsizing IT in Netherlands, achieved EUR 50m annual saves
2012 2013
Footprint rationalization
— 16 sites vacated, 7 more earmarked, 40 in scope— Scope for transfer of 8,000+ FTE across New York, London,
Hong Kong and Singapore to more cost-effective locations
― Annual run rate savings of EUR 4.5 bn by 2015
― Cumulative Cost-to-Achieveof EUR 4.0 bn
Anshu JainMorgan Stanley European Financials Conference, 21 March 2013
Deutsche Bank financial transparency. 8
(1) Total 2013 impact of measures implemented in 2012 (2) “Magellan” (3) ~1,300 front office FTEs and ~400 FTEs in related Infrastructure areas

PBC: Solid performance, progress on Postbank integration
Example challenges Business response
Market share
FY12 vs. FY11, mortgages in Adv. Banking Germany+8% +~30bpsMarket share
growth in lending business Mortgage
volume growth(1)
30bpsPersistently low interest rate environment
AB I t ti l IBIT ( dj t d)(3) i EUR
Market share gain(2)
Resilience in Advisory Banking International
Challenged peripheral European economies
561363
AB International IBIT (adjusted)(3), in EUR m
54%
te at o a
Complex, large-scale Postbankintegration
FY12FY11FY 2012 synergies(4), in EUR m
44940910%
p , gintegration integration
well on track
AchievedPlan
Anshu JainMorgan Stanley European Financials Conference, 21 March 2013
Deutsche Bank financial transparency. 9
(1) Includes housing loans to employees and other individuals excluding home loan savings (2) Includes housing loans to employees and other individuals excluding HLS based on latest Bundesbank statistics per November 2012 (3) Advisory Banking International: FY2011 adjusted for net HuaXia one-off gain of EUR 263 m; FY2012 adjusted for cost-to-achieve related to OpEx of EUR 19 m (4) Includes revenue & cost synergies

CB&S: Strengthening our leading franchise despite a challenging environmentchallenging environmentExample challenges Business response
Macroeconomic concernsGlobal rankings 2012
Macroeconomic concerns and market volatility
Lower industry volumes
Global leader inFixed Income (FI)
#1 #2#1 #2#1
Overall FI(3rd con-secutive
year)
Asia FIUS FI EU FIFX (8th con-secutive
year)Lower industry volumes
Continued regulatory uncertainty
Strong marketshare gains in
US Cash Equitiesmarket share
7.4%3.8%
year) year)
#1 #1
Global prime brokerage rankings
uncertainty
Increased public scrutiny
gEquities
Global rankings
2008 2012(5th conse-cutive year)
2008 2012
European rankings
Resource reduction
Highest ranked European bank in CorporateFinance
#8 #5 #4 #1
2008 20122008 2012(highest
share ever)
Anshu JainMorgan Stanley European Financials Conference, 21 March 2013
Deutsche Bank financial transparency. 10
Source: Greenwich Associates; Euromoney; Dealogic; Global Custodian
share ever)

CB&S: A transformed business modelILLUSTRATIVE
We completely changed business mix... ... and de-risked in a lower return environmentShare of Markets revenues
Client solutionsDedicated prop tradingCB&S, in EUR bn(2)
Pre-C i i (3) 2012 Ch
ILLUSTRATIVE
Most liquid flowIlliquid markets
~40%
~5%
~15%
<5%
Crisis(3) 2012 Change
Capital requirements (Average Active Equity)(4) <17 >26 >65%
Pre-tax RoE(4) >30% <15% ~(20)ppt~30%
~5%~10%
<5%
~40%
~45%
RWA (Basel 2.5 pro-forma)(5) ~275 ~200 ~(30)%
Balance Sheet (adjusted assets) (5) >1,200 ~800 ~(35)%
Value at Risk (average yearly)(6) >0.12 ~0.06 ~(50)%
~40%
~35%
~55%Leveraged Finance pipeline >36 <2.5 >(90)%
Commercial Real Estate pipeline >17 <2.5 >(85)%
Stress loss(6)(7) ~5 <2 ~(60)%
Value at Risk (average yearly) 0.12 0.06 (50)%
[ ]
~45%
~65%
(1) Includes revenues for businesses transferred to AWM and NCOU in 2012 (2) Unless stated differently (3) 2007/2008 except stress loss which is as of 1Q2009 (4) Pre-crisis based on FY 2006 reported figures, 2012 based on 9M12 annualized non-restated figures due to structural changes affecting FY2012 reporting (5) I t l RWA d B l 2 5 (CRD 3) f EUR 54b dd d t t d 2007 RWA 2012 RWA d b l h t b d 9M12 i t t f f t t NCOU
[ ][ ]
Credit correlation gross present value ~6.0 ~0.2 ~(95)%[ ]2006 – 2007
average(1)Today
[ ]
Anshu JainMorgan Stanley European Financials Conference, 21 March 2013
Deutsche Bank financial transparency. 11
(5) Incremental RWA under Basel 2.5 (CRD 3) of EUR 54bn added to reported 2007 RWA; 2012 RWA and balance sheet based on 9M12 prior to transfer of assets to NCOU (6) Differences vs. previously shown figures due to changes of calculation methodology (7) Estimated maximum traded market risk loss on a return to 1Q2009 conditions over a quarter, including offsetting revenues across businesses

AWM: Laying foundations for future performance
Example challenges Business response
AWM FTE(10)%
Efficiency measures underway
Short-term consequences of strategic review
~6,500~7,100( )
y
Complex five-way business integration
31 Dec 2012Peak(June 2012)
g— Integrated organization with clear leadership
and stabilized management team— Development of the integrated AWM Global
Client GroupUnified investment platform across styles
Reshaping of the businessStreamlining of platform
duplication— Unified investment platform across styles,
vehicles, asset classes and solutions— Rationalization of platforms and processes
well underway
the business
Anshu JainMorgan Stanley European Financials Conference, 21 March 2013
Deutsche Bank financial transparency. 12

GTB: Continued strong operating performance
Example challenges Business response
GTB fee income, in EUR bn(1)
31%Higher fee income
Persistent low interest rates
FY07
1.5
FY12
1.931%
Above market revenue growth
Competitive pressure increasing
Revenue growth, FY2012 vs. FY2011(1)
23%19%9%14%
FY07 FY12
gg
— Charges in 4Q2012
AmericasAPACEuropeTotal GTB
Challenging environment in Netherlands
Decisive action on turnaround
— Turnaround measures on schedule— Further costs related to turnaround to
come in 2013
Anshu JainMorgan Stanley European Financials Conference, 21 March 2013
Deutsche Bank financial transparency. 13
(1) Excluding the commercial banking activities acquired from ABN AMRO in the Netherlands; 2007 based on structure as of 2009

Culture: Deutsche Bank is at the forefront of cultural change
Existing cultural strengths
Further emphasis required Focus areas
Performance culture
Long term orientation and sustainability
Creating sustainable and respected compensation practices
Nearterm
Entrepreneurial Cli t f
Tightening the control environment
E h i i t it f li t l ti hiTime Entrepreneurial spirit Client focus Enhancing integrity of client relationships
Improving operational discipline
horizon
Cultural diversity Teamwork and partnership
p g p p
Strengthening teamwork across businesses and functions
Longerterm
Anshu JainMorgan Stanley European Financials Conference, 21 March 2013
Deutsche Bank financial transparency. 1414
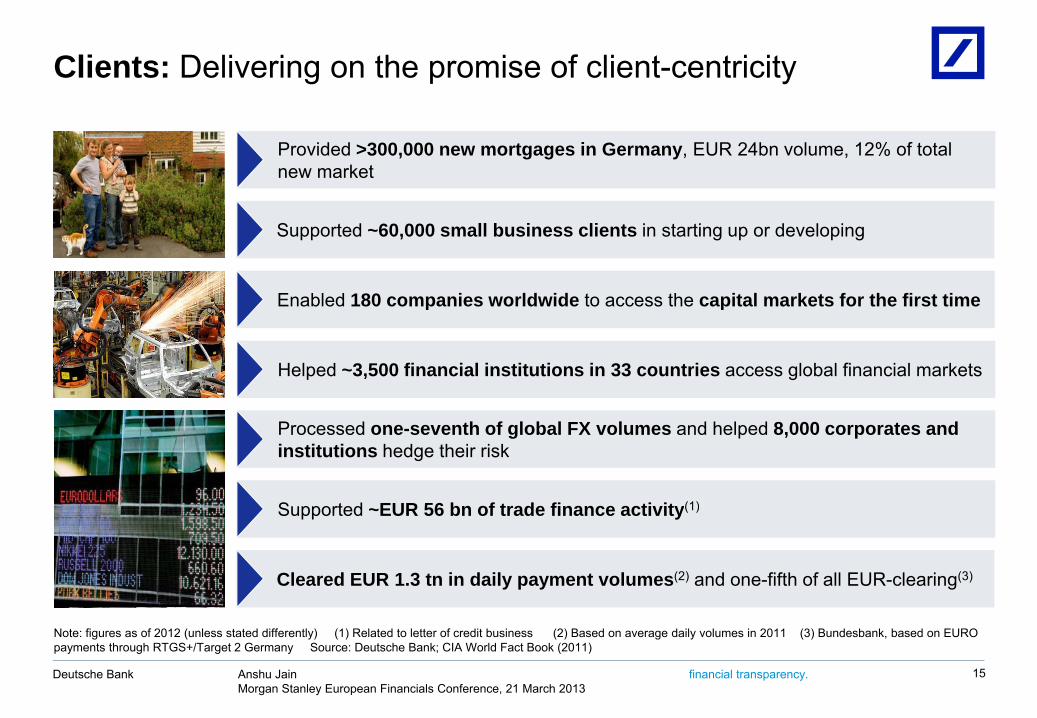
Clients: Delivering on the promise of client-centricity
Provided >300,000 new mortgages in Germany, EUR 24bn volume, 12% of total new market
Enabled 180 companies worldwide to access the capital markets for the first time
Supported ~60,000 small business clients in starting up or developing
p p
Helped ~3,500 financial institutions in 33 countries access global financial markets
Supported ~EUR 56 bn of trade finance activity(1)
Processed one-seventh of global FX volumes and helped 8,000 corporates and institutions hedge their risk
Supported EUR 56 bn of trade finance activity( )
Cleared EUR 1.3 tn in daily payment volumes(2) and one-fifth of all EUR-clearing(3)
Anshu JainMorgan Stanley European Financials Conference, 21 March 2013
Deutsche Bank financial transparency. 15
Note: figures as of 2012 (unless stated differently) (1) Related to letter of credit business (2) Based on average daily volumes in 2011 (3) Bundesbank, based on EURO payments through RTGS+/Target 2 Germany Source: Deutsche Bank; CIA World Fact Book (2011)
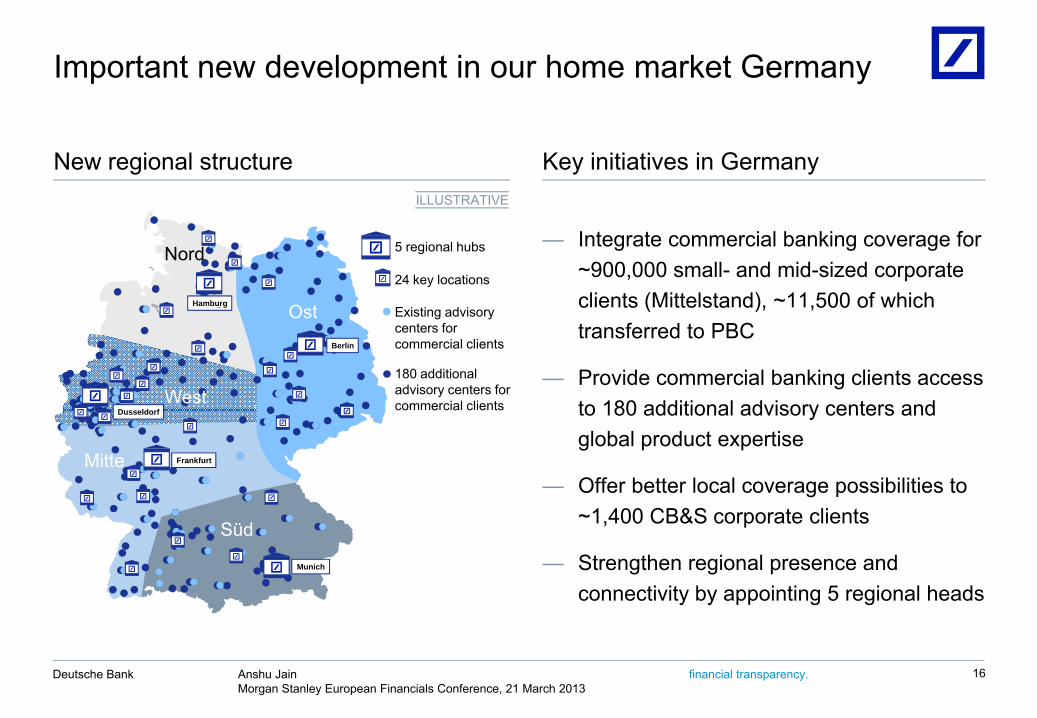
Important new development in our home market Germany
New regional structure Key initiatives in GermanyILLUSTRATIVE
— Integrate commercial banking coverage for ~900,000 small- and mid-sized corporate clients (Mittelstand), ~11,500 of which
5 regional hubs
24 key locations
E i ti d iO tHamburg
Nord
c e ts ( tte sta d), ,500 o ctransferred to PBC
— Provide commercial banking clients access to 180 additional advisory centers and
180 additional advisory centers for commercial clients
Existing advisory centers for commercial clients
OstBerlin
D ld f
g
West to 180 additional advisory centers and global product expertise
— Offer better local coverage possibilities to 1 400 CB&S corporate clients
co e c a c e tsDusseldorf
FrankfurtMitte
~1,400 CB&S corporate clients
— Strengthen regional presence and connectivity by appointing 5 regional heads
Süd
Munich
Anshu JainMorgan Stanley European Financials Conference, 21 March 2013
Deutsche Bank financial transparency. 16

The regulatory environment: new challenges emerge…
A challenging regulatory environment……and may become more complex, especially for European players
Selected examples as of September 2012 Major developments since September 2012
Liikanen and German bank separation proposalsCapital, funding and liquidity
— Basel 3 (Core)-Tier 1 ratio— LCR / NSFR— Leverage
Fed Notice of Proposed Rulemaking for Foreign Bank Organizations (FBO) in the US
Bank structure and systemic risk
— Volcker— Vickers— Living wills
— Subsidiari-sation
— SIFI
EU agreement on CRD IV –additional restrictions on remuneration
Governance and supervision
— Board composition— Compensation— Banking union
Enhanced cooperation to adopt financial transactiontax (FTT) in several EU member statesTaxes
— Bank levies— FATCA— Financial transaction taxes
Anshu JainMorgan Stanley European Financials Conference, 21 March 2013
Deutsche Bank financial transparency. 17
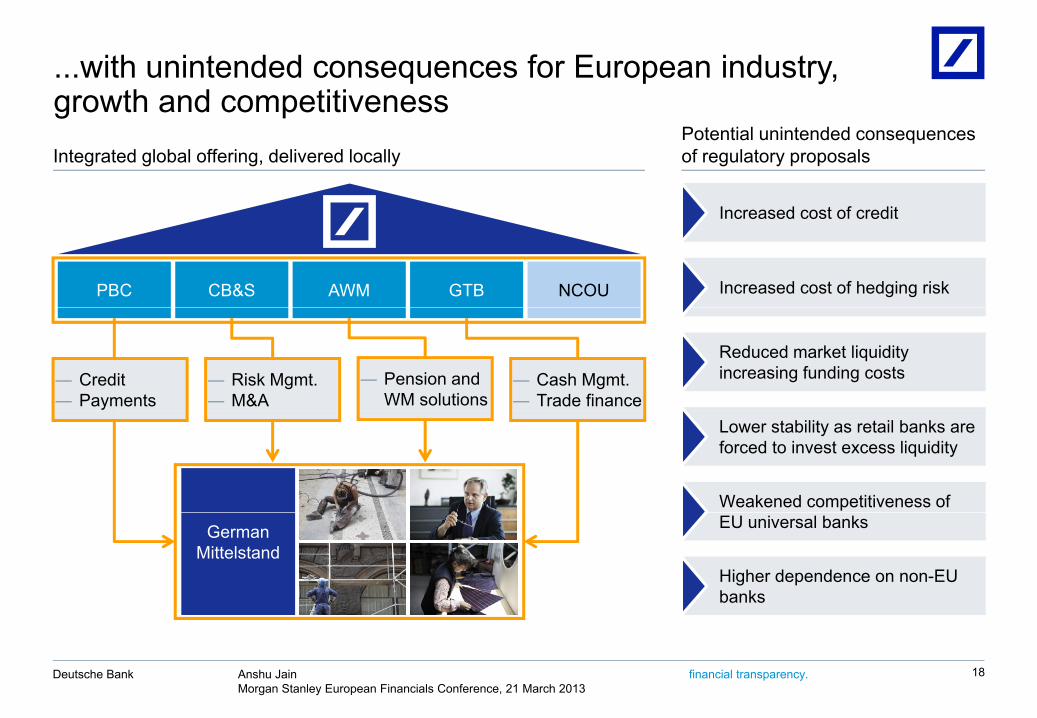
...with unintended consequences for European industry, growth and competitivenessgrowth and competitiveness
Potential unintended consequences of regulatory proposalsIntegrated global offering, delivered locally
Increased cost of credit
Increased cost of hedging riskNCOUPBC AWM GTBCB&S
Reduced market liquidity increasing funding costs― Risk Mgmt.
― M&A― Cash Mgmt.― Trade finance
― Credit― Payments
― Pension and WM solutions
Weakened competitiveness of
Lower stability as retail banks are forced to invest excess liquidity
EU universal banks
Higher dependence on non-EU banks
German Mittelstand
Anshu JainMorgan Stanley European Financials Conference, 21 March 2013
Deutsche Bank financial transparency. 18
Strategy 2015+: Key takeaways of progress update
Since last summer the business environment has improved
We are making good progress against our strategic objectivesWe are making good progress against our strategic objectives
The regulatory environment has become even more complex, particularly for g y p p yEuropean-based global universal banks
We are nonetheless on track to deliver our Strategy 2015+ aspirations
Anshu JainMorgan Stanley European Financials Conference, 21 March 2013
Deutsche Bank financial transparency. 19
Cautionary statements
This presentation contains forward-looking statements. Forward-looking statements are statements that are not historicalfacts; they include statements about our beliefs and expectations and the assumptions underlying them. These; y p p y gstatements are based on plans, estimates and projections as they are currently available to the management of DeutscheBank. Forward-looking statements therefore speak only as of the date they are made, and we undertake no obligation toupdate publicly any of them in light of new information or future events.
By their very nature forward-looking statements involve risks and uncertainties A number of important factors couldBy their very nature, forward-looking statements involve risks and uncertainties. A number of important factors couldtherefore cause actual results to differ materially from those contained in any forward-looking statement. Such factorsinclude the conditions in the financial markets in Germany, in Europe, in the United States and elsewhere from which wederive a substantial portion of our revenues and in which we hold a substantial portion of our assets, the development ofasset prices and market volatility, potential defaults of borrowers or trading counterparties, the implementation of ourp y p g p pstrategic initiatives, the reliability of our risk management policies, procedures and methods, and other risks referenced inour filings with the U.S. Securities and Exchange Commission. Such factors are described in detail in our SEC Form20-F of 20 March 2012 under the heading “Risk Factors.” Copies of this document are readily available upon request orcan be downloaded from www.db.com/ir.
This presentation also contains non-IFRS financial measures. For a reconciliation to directly comparable figures reportedunder IFRS, to the extent such reconciliation is not provided in this presentation, refer to the 4Q2012 Financial DataSupplement of 20 March 2013, which is accompanying this presentation and available at www.db.com/ir.
Anshu JainMorgan Stanley European Financials Conference, 21 March 2013
Deutsche Bank financial transparency. 20