Deutsche Bank – 2Q2016 results...2Q2016 results 27 July 2016 Deutsche Bank Investor Relations 4...
47
Deutsche Bank Deutsche Bank – 2Q2016 results 27 July 2016
Transcript of Deutsche Bank – 2Q2016 results...2Q2016 results 27 July 2016 Deutsche Bank Investor Relations 4...

Deutsche Bank
Deutsche Bank – 2Q2016 results
27 July 2016

2Q2016 results 27 July 2016
Deutsche BankInvestor Relations
2Q2016 – Further progress on restructuring
Current macroeconomic and geo-political outlook uncertain
Remain committed to substantial restructuring in 2016
Making early progress across all businesses and infrastructure areas, but more to do
Continued investment in strengthening control infrastructure
Progress on litigation but major cases remain outstanding
Bank remains strongalready in compliance with TLAC and liquidity requirementslow risk levels in credit portfolio and markets business10.8% CET1 ratio, 11.2% pro forma for Hua Xia Bank sale
Strategy remains in place
2

2Q2016 results 27 July 2016
Deutsche BankInvestor Relations
In EUR bn, unless otherwise statedGroup financial highlights
3
Note: Figures may not add up due to rounding differences2Q2016 Common Equity Tier 1 ratio (phase-in) is 12.2%; Leverage ratio (phase-in) is 4.0%
(1) Total noninterest expense excluding restructuring & severance, litigation, impairment of goodwill and other intangibles and policyholder benefits and claims
2Q2016 2Q2015 1H2016 1H2015 2Q2016 vs. 2Q2015
1H2016 vs. 1H2015
Net revenues 7.4 9.2 15.5 19.6 (20)% (21)%Provision for credit losses (0.3) (0.2) (0.6) (0.4) 72% 53%Noninterest expenses (6.7) (7.8) (13.9) (16.5) (14)% (16)%
therein: Adjusted Costs (1) (6.0) (6.5) (12.7) (13.4) (7)% (5)%Restructuring and severance (0.2) (0.0) (0.5) (0.1) n.m. n.m.Litigation (0.1) (1.2) (0.3) (2.8) (90)% (89)%
Income before income taxes 0.4 1.2 1.0 2.7 (67)% (64)%Net income 0.0 0.8 0.3 1.4 (98)% (81)%
2Q2016 2Q2015 1H2016 1H2015 2Q2016 vs. 2Q2015
1H2016 vs. 1H2015
Post-tax return on average tangible shareholders’ equity 0.1% 5.7% 0.9% 4.8% (5.5) ppt (3.9) ppt
Post-tax return on average shareholders’ equity 0.1% 4.4% 0.7% 3.8% (4.3) ppt (3.0) ppt
Cost / income ratio 91.0% 85.0% 90.0% 84.3% 6.0 ppt 5.7 ppt
30 Jun 2016 30 Jun 2015 31 Mar 2016 30 Jun 2016 vs. 30 Jun 2015
30 Jun 2016 vs. 31 Mar 2016
Risk-weighted assets (CRD4, fully loaded) 402 416 401 (3)% 0%Common Equity Tier 1 capital 44 47 43 (8)% 2%Leverage exposure (CRD4) 1,415 1,461 1,390 (3)% 2%Total assets IFRS 1,803 1,694 1,741 6% 4%Tangible book value per share (in EUR) 37.40 39.42 37.29 (5)% 0%Common Equity Tier 1 ratio (fully loaded) 10.8% 11.4% 10.7% (0.6) ppt 0.2 pptLeverage ratio (fully loaded) 3.4% 3.6% 3.4% (0.2) ppt (0.0) ppt
Profit & Loss
Metrics
Resources

2Q2016 results 27 July 2016
Deutsche BankInvestor Relations
4
Quarterly net income 2Q2016 vs. 2Q2015In EUR m
— Revenuesdeclined by EUR 1.7bn as a result of a challenging market environment and the implementation of strategic decisions
— LLP increased mainly from deterioration of shipping andmetals & mining portfolios
— Adjusted Costs declined mainly from lower cash bonus and retention expense
— 2Q2016 resolution of litigation matters materially covered by existing accruals
— 2Q2016 includes a goodwill impairment of EUR 285m followingthe transfer of businesses from AM to GM
Note: Comments refer to numbers excl. FX effects
Note: Figures may not add up due to rounding differences(1) To exclude the FX effects the prior year figures were recalculated using the corresponding current year’s monthly FX rates (2) Includes Hua Xia impact of EUR (138)m mainly reflecting the absence of equity pick-ups reported in 2Q2015
FX-adjusted deltas(1):
(924) (265) (230) (63) 101 (572) 161 484 (161)(108) Total delta incl. FX effects
(41) (30) (14) (5) (0) (5) (8) 149 20
1,106
(43)
(350)
(1)
23
12 FX effects
20
16
818
(64)
Policyh./Impair.
(285)
Liti-gation
1,149
PWCC
(138)
(79)
CIB
(235)
GM
(883)
2Q15 Restr.& sev.
2Q16Net FX
effect
Tax
10
(164)
Adj.Costs
335
LLP
(109)
C&A
170
NCOU
(567)
PB
101
AM
(58)
Excluding FX effects
(2)
Net revenues
Hua Xia
Impairments

2Q2016 results 27 July 2016
Deutsche BankInvestor Relations
Net revenues developmentIn EUR m
5
Note: Figures may not add up due to rounding differences(1) Excluding Hua Xia
(1)
2Q16 2Q15 2Q16 vs. 2Q15,in % 1H16 1H15 1H16 vs. 1H15,
in %
Global Markets 2,420 3,344 (28)% 5,238 7,011 (25)%
Corporate & Investment Bank 1,888 2,154 (12)% 3,713 4,290 (13)%
Private Wealth &Commercial Clients 1,855 1,948 (5)% 3,715 3,916 (5)%
Postbank 903 803 13% 1,764 1,660 6%
Asset Management 706 769 (8)% 1,397 1,518 (8)%
C&A (45) (206) 78 273
Subtotal 7,729 8,812 (12)% 15,905 18,668 (15)%
NCOU (349) 223 (333) 618
Hua Xia 6 143 (118) 267
Total 7,386 9,177 (20)% 15,454 19,553 (21)%

2Q2016 results 27 July 2016
Deutsche BankInvestor Relations
CostsIn EUR bn
6
Note: Figures may not add up due to rounding differences(1) Impairments refer to Impairments of goodwill and other intangibles(2) Total noninterest expense excluding restructuring & severance, litigation, impairment of goodwill and other intangibles and policyholder benefits and claims(3) To exclude the FX effects the prior year figures were recalculated using the corresponding current year's monthly FX rates(4) Commentary on basis of constant FX rates
— Noninterest expenses in 2Q2016 were EUR 1.0bn lower than 2Q2015
— Impairments / policyholder benefits and claims are upby EUR 0.3bn mainly attributable to goodwillimpairment following the transfer of businesses fromfrom AM to GM
— Litigation down EUR 1.1bn. 2Q2016 includesinsurance recoveries related to the Kirch settlementagreements
— Restructuring and severance increased in total by EUR 0.2bn, primarily driven by provisions related to Infrastructure optimization
— Adjusted Costs decreased by EUR 0.3bn mainly due to lower cash bonus and retention expense
Noninterest expenses Key facts(4)
<0.1
<0.1Litigation
0.4Restructuring / Severance
7.7
1.3
2Q16
6.7
2Q15 FX(3)
6.06.4
0.10.2
AdjustedCosts(2) 6.5
2Q15
7.8<0.11.2
<0.1
Impairments/Policyholder
Benefits and Claims (1)

2Q2016 results 27 July 2016
Deutsche BankInvestor Relations
Adjusted CostsIn EUR m
7
Note: Figures may not add up due to rounding differences(1) Total noninterest expense excluding restructuring & severance, litigation, impairment of goodwill and other intangibles and policyholder benefits and claims(2) To exclude the FX effects the prior year figures were recalculated using the corresponding current year's monthly FX rates(3) Including furniture and equipment(4) Full time equivalents at period end(5) Internalisation as announced in October 2015 as part of Strategy 2020
— Compensation and benefits down EUR 413m driven by lower cash bonus and retention expense
— IT cost increase of EUR 154m. Main components are higher depreciation for self-developed software and increase of external IT services
— Professional service fees up EUR 35m with consulting related to regulatory programs (e.g. CCAR, KYC) and strategy implementation being a major driver
— Occupancy down by EUR 51m of which EUR 30m isdue to one-time real-estate transfer tax liability in 2Q2015
— Cost for Bank Levy and Deposit protection are down by EUR 28m due to phasing of charges
— “Other” reduction of EUR 32m includes EUR 25m in consolidated investments linked to disposal activities in NCOU (Maher Prince Rupert port sale completed in 2015)
Adjusted Costs(1) Key facts 2Q16 vs. 2Q15 FX
2Q15 2Q15 FX(2) 1Q16 2Q16
Compensation and benefits 3,407 3,344 3,119 2,931
IT cost 858 831 936 985
Professional service fees 549 531 556 566
Occupancy(3) 515 505 454 453
Bank Levy / Deposit Protection Guarantee Schemes 93 74 598 47
Other 1,095 1,082 1,005 1,050
Adjusted Costs 6,516 6,367 6,668 6,032
Headcount(4) 98,647 101,445 101,307
Therein: Internalisation(5) 299 931

2Q2016 results 27 July 2016
Deutsche BankInvestor Relations
Litigation updateIn EUR bn
8
2.4 2.4
0.3 0.3
31 Mar 2016 30 Jun 2016
Litigation reserves Contingent liabilitiesMortgage repurchase demands/reserves(1)
DemandsReserves
In USD bn
— Settlements and resolutions have been achieved in 2Q2016, in particular:
Several civil litigations in the US related to Deutsche Bank’s pre-financial crisis RMBS-business
— Includes possible obligations where an estimate can be made and outflow is more than remote but less than probable for significant matters
— Decrease from 1Q2016 to 2Q2016 primarily driven by reductions where the risk is now deemed to be remote and by provisions taken in certain matters
— Reserves treated as negative revenues in NCOU and remained stable from 1Q2016 to 2Q2016
5.4 5.5
31 Mar 2016 30 Jun 2016
2.21.7
31 Mar 2016 30 Jun 2016
(1) Reserves for mortgage repurchase demands are shown net of receivables in respect of indemnity agreements from the originators or sellers of certain of the mortgage loans of USD109m (EUR 96m) and USD 110m (EUR 99m) as of March 31, 2016 and June 30, 2016, respectively. Gross reserves were USD 445 million (EUR 390m) and USD 445m (EUR 400m)as of March 31, 2016 and June 30, 2016, respectively.

2Q2016 results 27 July 2016
Deutsche BankInvestor Relations
Tier 1 capitalCRD4, fully loaded, in EUR bn
9
Events in the quarter Tier 1 capital
Note: Figures may not add up due to rounding differences
— CET1 capital up by EUR 0.8bn q-o-q— EUR 0.2bn FX effect, principally USD
strengthening— EUR 0.2bn positive impact from equity
compensation, mirroring corresponding P&L expense
— EUR 0.3bn other, primarily lower capital deductions following EUR 0.3bn goodwill impairment after the transfer of businesses from AM to GM
Common Equity Tier 1Additional Tier 1 capital
AT1 Coupon Accrual
(0.1)
Net Income
0.0
Mar 16 Jun 16
43.5
FX Effect
0.2
Other
0.3
Equity Comp.
0.242.8
4.6 4.6
2Q2016 results 27 July 2016
Deutsche BankInvestor Relations
RWA CRD4, fully loaded, in EUR bn
10
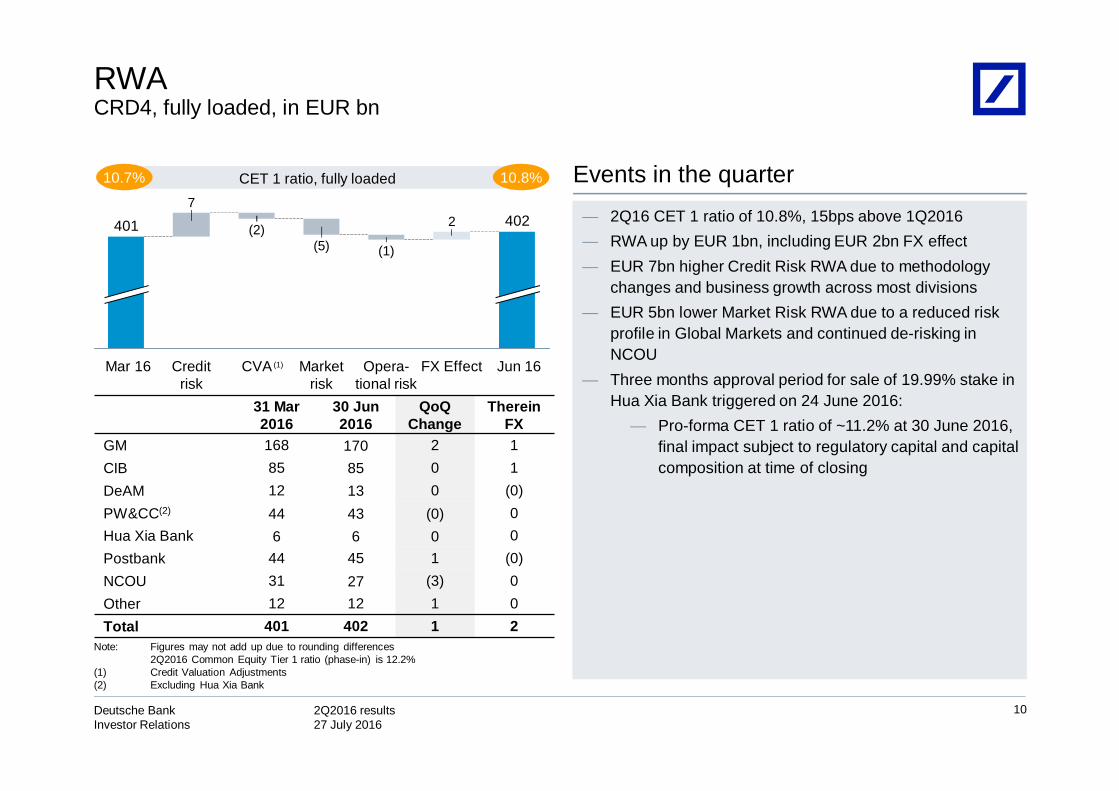
Events in the quarter — 2Q16 CET 1 ratio of 10.8%, 15bps above 1Q2016— RWA up by EUR 1bn, including EUR 2bn FX effect— EUR 7bn higher Credit Risk RWA due to methodology
changes and business growth across most divisions— EUR 5bn lower Market Risk RWA due to a reduced risk
profile in Global Markets and continued de-risking in NCOU
— Three months approval period for sale of 19.99% stake in Hua Xia Bank triggered on 24 June 2016:
— Pro-forma CET 1 ratio of ~11.2% at 30 June 2016, final impact subject to regulatory capital and capital composition at time of closing
10.7% 10.8%CET 1 ratio, fully loaded
Note: Figures may not add up due to rounding differences2Q2016 Common Equity Tier 1 ratio (phase-in) is 12.2%
(1) Credit Valuation Adjustments(2) Excluding Hua Xia Bank
7
Jun 16
402
FX Effect
2
Opera-tional risk
(1)
Market risk
(5)
CVA
(2)
Credit risk
Mar 16
401
(1)
31 Mar 2016
30 Jun 2016
QoQChange
ThereinFX
GM 168 170 2 1CIB 85 85 0 1DeAM 12 13 0 (0)PW&CC(2) 44 43 (0) 0Hua Xia Bank 6 6 0 0Postbank 44 45 1 (0)NCOU 31 27 (3) 0Other 12 12 1 0Total 401 402 1 2

2Q2016 results 27 July 2016
Deutsche BankInvestor Relations
Leverage exposure CRD4 Leverage exposure development, in EUR bn
11
Events in the quarter
31 Mar 2016
30 Jun 2016
QoQChange
Therein FX
GM 750 733 (17) 14CIB 263 284 21 3DeAM 5 5 (0) (0)PW&CC(1) 181 199 18 1Hua Xia Bank 2 3 0 (0)Postbank 145 147 2 (0)NCOU 31 19 (12) 0Other 13 25 12 1Total 1,390 1,415 24 19
3.4% 3.4%CRD4 Leverage ratio, fully loaded
Note: Figures may not add up due to rounding differences2Q2016 leverage ratio (phase-in) is 4.0%
(1) Excluding Hua Xia Bank
— 2Q2016 leverage ratio of 3.4%, unchanged from 1Q2016— Leverage exposure up EUR 24bn, including FX effect of
EUR 19bn— Continued NCOU de-risking (EUR12bn) is offset by an
increase in Cash balances, principally from client led deposit growth (EUR 11bn) and SFT (EUR 5bn)
— Other q-o-q movements by segment principally reflect a change in Central Liquidity Reserves (CLR) allocation which is now fully based on segment specific stress liquidity needs
— Three months approval period for sale of 19.99% stake in Hua Xia Bank triggered on 24 June 2016:
— Pro-forma Leverage ratio of ~3.5% at 30 June 2016, final impact subject to regulatory capital and capital composition at time of closing
19115
1.415
FX Effect
Jun 16Trading Inventory
(2)
SFTDeriva-tives
(8)
Off B/S
(1)
Mar 16
1.390
Cash, Coll. & Other
2Q2016 results 27 July 2016
Deutsche BankInvestor Relations
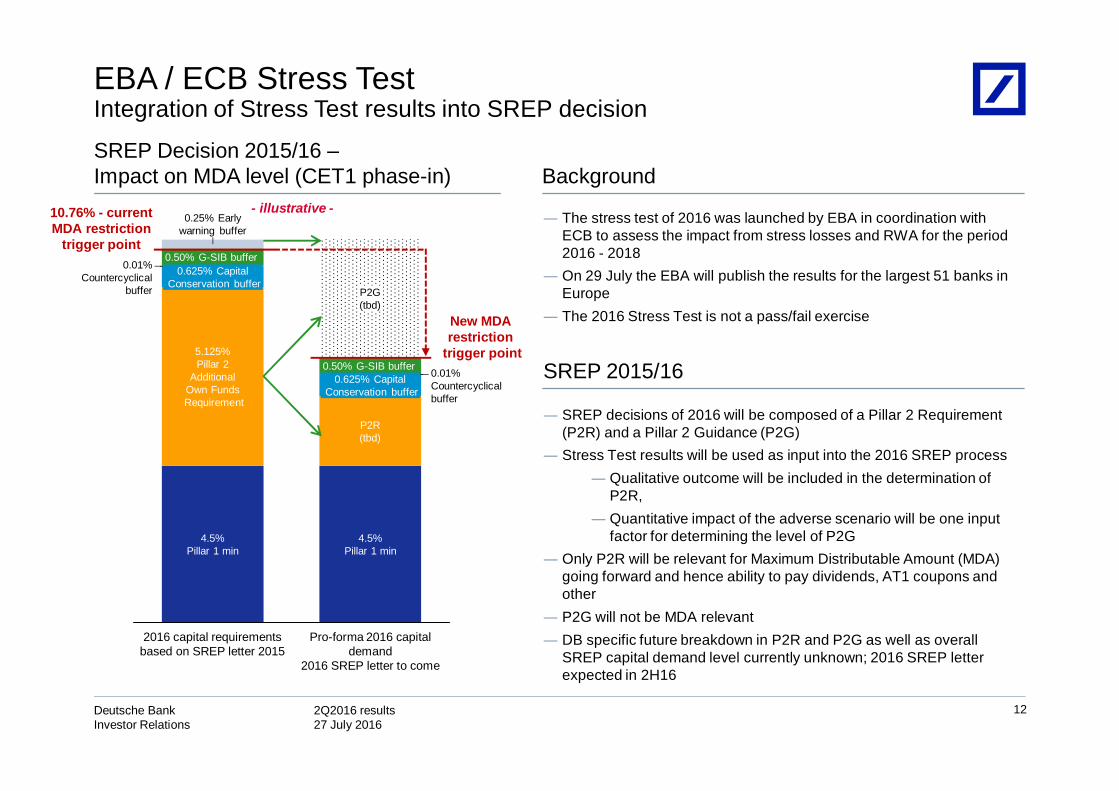
New MDA restriction
trigger point0.50% G-SIB buffer
4.5%Pillar 1 min
5.125%Pillar 2
AdditionalOwn FundsRequirement
0.25% Earlywarning buffer
0.625% CapitalConservation buffer
0.01%Countercyclical
buffer
0.50% G-SIB buffer
0.625% CapitalConservation buffer
Pro-forma 2016 capital demand
2016 SREP letter to come
4.5%Pillar 1 min
P2R(tbd)
0.01%Countercyclicalbuffer
P2G(tbd)
2016 capital requirements based on SREP letter 2015
EBA / ECB Stress TestIntegration of Stress Test results into SREP decision
12
SREP Decision 2015/16 –Impact on MDA level (CET1 phase-in)
- illustrative -10.76% - current MDA restriction
trigger point
Background
SREP decisions of 2016 will be composed of a Pillar 2 Requirement (P2R) and a Pillar 2 Guidance (P2G)Stress Test results will be used as input into the 2016 SREP process
Qualitative outcome will be included in the determination of P2R,Quantitative impact of the adverse scenario will be one input factor for determining the level of P2G
Only P2R will be relevant for Maximum Distributable Amount (MDA) going forward and hence ability to pay dividends, AT1 coupons and otherP2G will not be MDA relevantDB specific future breakdown in P2R and P2G as well as overall SREP capital demand level currently unknown; 2016 SREP letter expected in 2H16
The stress test of 2016 was launched by EBA in coordination with ECB to assess the impact from stress losses and RWA for the period 2016 - 2018On 29 July the EBA will publish the results for the largest 51 banks in EuropeThe 2016 Stress Test is not a pass/fail exercise
SREP 2015/16

2Q2016 results 27 July 2016
Deutsche BankInvestor Relations
Equity, 6% (1)
Capital Markets(1,2),
15%
Retail, 31% (3)Transaction
Banking, 20%
Other Customers,
7%
Unsecured Wholesale,
6%
Secured Funding and Shorts, 15%
Financing Vehicles, 0%
11
7
17
6
10
6
9
11
3Q2014 4Q2014 1Q2015 2Q2015 3Q2015 4Q2015 1Q2016 2Q20160
50
100
150
200
250
300
Robust external funding profileAs of 30 June 2016, in EUR bn
Funding profile well diversified
72% from most stable
funding sources
Total: EUR 992bn
— Total external funding increased by EUR 15bn to EUR 992bn (vs. EUR 978bn as of Mar 2016)
— 72% of total funding from most stable sources (71% as of 31 Mar 2016)
— As per 30 June 2016 ytd issuance of EUR 20 bn at average spread of Euribor+109 bps (ca. 85 bps inside interpolated CDS) and average tenor of 6.7 years
Funding cost and volume development
13
DB issuance spread, 4 week moving average, in bps(4)
DB 5yr EUR-CDS in bps
Note: Figures may not add up due to rounding differences. (1) AT1 instruments are included in Capital Markets, excluded from Equity(2) Capital markets issuance differs from Long Term debt as reported in our Group IFRS accounts primarily due to issuance under our x-markets programme which we do not consider term
liquidity and differences between fair value and carrying value of debt instruments as reported in Consolidation and Adjustments.(3) Including Wealth Management deposits(4) As of January 2016, all non-Euro funding spreads rebased to a spread vs. 3 month Euribor and reported accordingly. 3Q15 and 4Q15 spreads would have been on average ~10bps
lower if reported on that basis. AT1 instruments excluded from spread calculation

2Q2016 results 27 July 2016
Deutsche BankInvestor Relations
14
Segment results

2Q2016 results 27 July 2016
Deutsche BankInvestor Relations
Income before income taxes Key featuresIn EUR m In EUR m
2Q16 2Q15 2Q16 vs. 2Q15 1H16 1H15 1H16 vs.
1H15
Net revenues 2,420 3,344 (28)% 5,238 7,011 (25)%
Prov. for credit losses (39) (5) n.m. (54) (6) n.m.
Noninterest exp. (2,351) (2,231) 5% (4,736) (5,836) (19)%
IBIT 28 1,086 (97)% 423 1,131 (63)%
CIR 97% 67% 30 ppt 90 83 7 ppt
RWA 170 168 1% 170 168 1%
Post-tax RoE 0.3% 10.8% (11) ppt 2.3% 5.9% (4) ppt
Post-tax RoTE 0.3% 11.9% (12) ppt 2.5% 6.5% (4) ppt2015 2016
CVA/DVA/FVA(176) 164 52 (180) 143 2 (12) 145
Restructuring and severance(38) (24) (41) (63) (90) (41) (62) (131)
Litigation_2(1,155) (268) (846) (333) 68 (134) (1,423) (66)
Impairments0 0 (1,568) 0 0 (285) 0 (285)
2015 2016
(2)
(1)
(3)
45
1,086
(1,986)
(954)
394
28
1,131
423
1Q 2Q 3Q 4Q 1Q 2Q 1H 1H
Global Markets
15
Note: Figures restated due to transfer of Fund Solutions and Certificates and Warrants businesses from Deutsche Asset Management to Global Markets. Figures may not add up due to rounding differences
(1) 2Q 2016 revenues include valuation adjustment items totaling EUR 2m gain (gain of EUR 143m in 1Q 2016). First, EUR 43m CVA hedge gain (gain of EUR 22m in 1Q 2016). Second, EUR 11m DVA loss (gain of EUR 202m in 1Q 2016). Third, EUR 30m FVA loss (loss of EUR 82m in 1Q 2016) (2) Based on average shareholders’ equity
(3) Based on average tangible shareholders’ equity
— 2Q2016 GM revenues were 28% lower y-o-y (24% lower ex-CVA/DVA/FVA) versus a strong prior year quarter driven by DB’s implementation of Strategy 2020 and macro uncertainty impacting client flow particularly in Europe and Asia
— Provision for credit losses driven by a small number of exposures— Noninterest expenses increased 5% y-o-y driven by a EUR 285m IFRS
goodwill impairment in GM in connection with business transfers from Deutsche AM. Lower litigation charges and compensation costs were partly offset by higher spend on technology and controls
— Noninterest expenses excluding impairments, litigation charges, restructuring charges and severance declined 2% y-o-y to EUR 1,891m reflecting lower compensation costs

2Q2016 results 27 July 2016
Deutsche BankInvestor Relations
Revenues Key revenue featuresDebt S&T, in EUR m
2015 2016
Equity S&T, in EUR m
2015 2016
2015 2016
2015 2016
2,8982,254 1,832
1,2592,076 1,817
5,152
3,893
1Q 2Q 3Q 4Q 1Q 2Q 1H 1H
(19)%
1,109 1,040632 554 751 720
2,1491,471
1Q 2Q 3Q 4Q 1Q 2Q 1H 1H
(31)%
Sales & Trading revenues
16
Debt Sales & Trading revenues— Debt Sales & Trading revenues lower y-o-y, driven by the impact of
Strategy 2020 execution, including exits of high risk-weight securitised trading and Agency RMBS trading, coupled with the rationalisation of the EM Debt platform
— FX flat y-o-y versus a strong prior year quarter reflecting significant client activity around the UK’s referendum on EU membership
— Rates slightly up y-o-y with strong performance in the Americas Municipal business and good client flow in Europe
— Credit lower y-o-y driven by the exit of high risk-weight securitisedtrading and lower distressed revenues versus a strong prior year quarter.
— Emerging Markets lower y-o-y driven by the streamlining of DB’s country presence, particularly Russia. Asia Pacific Local Markets lower y-o-y due to more challenging conditions in Asia
Equity Sales & Trading revenues— Equity Sales & Trading revenues lower y-o-y versus a strong prior year
quarter— Cash Equities lower y-o-y driven by lower market volumes— Equity Derivatives significantly lower y-o-y driven by lower client
activity versus a strong prior year quarter— Prime Finance lower y-o-y, reflecting the impact of lower average
customer balances, lower client activity levels and market uncertainty

2Q2016 results 27 July 2016
Deutsche BankInvestor Relations
Income before income taxes Key featuresIn EUR m In EUR m
2Q16 2Q15 2Q16 vs. 2Q15 1H16 1H15 1H16 vs.
1H15
Net revenues 1,888 2,154 (12)% 3,713 4,290 (13)%
Prov. for credit losses (115) (39) 194% (251) (89) 181%
Noninterest exp. (1,341) (1,519) (12)% (2,715) (2,884) (6)%
IBIT 432 595 (27)% 747 1,316 (43)%
CIR 71% 71% 0 ppt 73% 67% 6 ppt
Post-tax RoE 9.5% 12.0% (2) ppt 8.2% 13.9% (6) ppt
Post-tax RoTE 10.5% 13.4% (3) ppt 9.0% 15.5% (7) ppt
2015 2016Restructuring and severance
(14) (11) (17) (46) (94) (61) (25) (155)
Litigation_2
(6) (137) (183) (4) 0 (7) (142) (7)
Impairments
0 0 (600) 0 0 0 0 0
2015 2016
(1)
(2)
721595
(188)
309 315432
1,316
747
1Q 2Q 3Q 4Q 1Q 2Q 1H 1H
Corporate & Investment Banking
17
Note: Figures may not add up due to rounding differences(1) Based on average shareholders' equity(2) Based on average tangible shareholders’ equity
12% decrease in revenues y-o-y reflecting challenging market conditions and weak performance in Corporate Finance; revenues from Transaction Banking are flat EUR 76m increase in provision for credit losses y-o-y driven by continued provisioning on exposures in shipping and metals & mining as these sectors continue to be affected by adverse macro-economic developmentsAdjusted for restructuring cost and litigation, noninterest expenses decreased 7%, or EUR 99m y-o-y, largely due to lower compensationcosts

2Q2016 results 27 July 2016
Deutsche BankInvestor Relations
Revenues Key revenue featuresIn EUR m
2015 20162015 2016
1,136 1,146 1,197 1,191 1,114 1,118
2,282 2,232855 863 610 462
-
559 697
-
1,7181,256
145 145 181 116 151 74
290
225
2,136 2,154 1,9881,770 1,824 1,888
4,290
3,713
1Q 2Q 3Q 4Q 1Q 2Q 1H 1H
Corporate & Investment Banking revenues
18
Advisory
Transaction BankingOrigination, Loan Products & Other
Transaction Banking:Trade Finance & Cash Management Corporates revenues down 6% y-o-y due to further deterioration in the interest rate environment, continued downward trend of trade loan volume in APAC and risk-management of our client relationships in high risk countriesInstitutional Cash & Securities Services showed solid performance, revenues up 3% y-o-y, supported by higher interest rates in the US as well as transaction volume growth
Origination:Equity Origination significantly improved from 1Q2016 reflecting improving momentum, revenues are down 51% y-o-y as a result of continued lower global issuance volumesDebt Origination has been more resilient due to continued low interest rate environment and strong investor appetite for higher yielding assets
Advisory:1H2016 Advisory revenue in 2Q2016 declined as a number of deals have been aborted or postponed

2Q2016 results 27 July 2016
Deutsche BankInvestor Relations
Income before income taxes Key featuresIn EUR m In EUR m
2Q16 2Q15 2Q16 vs. 2Q15 1H16 1H15 1H16 vs.
1H15
Net revenues 1,861 2,091 (11)% 3,597 4,183 (14)%
Prov. for credit losses (66) (74) (10)% (103) (154) (33)%
Noninterest exp. (1,608) (1,534) 5% (3,245) (3,142) 3%
IBIT 187 483 (61)% 249 887 (72)%
CIR 86% 73% 13 ppt 90% 75% 15 pptPost-tax RoE 5.5% 11.6% (6) ppt 3.6% 11.0% (7) ppt
Post-tax RoTE 6.7% 15.1% (8) ppt 4.4% 14.2% (10) ppt
2015 2016Restructuring and severance
(3) (1) 0 (591) (70) (69) (4) (139)
Litigation_2
(3) (20) (20) 1 (4) (28) (23) (32)
Impairments (3)
0 0 (1,006) (6) 0 0 0 0
Hua Xia Bank IBIT123 143 (505) 62 (124) 5 265 (119)
2015 2016
(1)
(2)
404 483
(1,135)
(527)
62187
887
249
1Q 2Q 3Q 4Q 1Q 2Q 1H 1H
Private,Wealth & Commercial Clients
19
Note: Figures may not add up due to rounding differences(1) Based on average shareholders’ equity(2) Based on average tangible shareholders’ equity(3) Includes Goodwill / other intangible impairment; excl. Hua Xia Bank
Revenue decline y-o-y reflecting the discontinuation of Hua Xia equity pick-ups. Excluding Hua Xia, revenues 5% down versus a strong 2Q2015. 2Q2016 revenues benefited from a sale of a stake in Visa Europe Ltd. (EUR 88m)
Provision for credit losses decreased by 10% reflecting continued good portfolio quality
Noninterest expenses excluding restructuring & severance andlitigation remained stable despite higher software amortization and investment expenses related to Strategy 2020
IBIT decline y-o-y continues to reflect the Hua Xia impact as well as higher restructuring and severance charges

2Q2016 results 27 July 2016
Deutsche BankInvestor Relations
Revenues Key revenue featuresPrivate & Commercial Clients, in EUR m
2015 2016
Wealth Management, in EUR m
2015 20162015 2016
2015 2016
1,429 1,393 1,454 1,312 1,362 1,365
2,822 2,727
1Q 2Q 3Q 4Q 1Q 2Q 1H 1H
539 555 501 502 498 490
1,094988
1Q 2Q 3Q 4Q 1Q 2Q 1H 1H
Private,Wealth & Commercial Clients: Business Units
20
Private & Commercial Clients (PCC) PCC revenues down 2% versus a very strong 2Q2015. 2Q2016 included a positive impact from a sale of a stake in VISA Europe (EUR 88m)Credit product revenues with a solid growth of 6%Investment & insurance products down 21% versus a very strong 2Q2015 due to ongoing difficult markets Deposit revenues down 15% versus 2Q2015 driven by the continued low interest rate environment
Wealth Management (WM)WM revenues down 12% versus an exceptionally strong 2Q2015Performance & transaction fees down 33% versus 2Q2015 driven by the more difficult market environment Very low levels of ECM activity in the U.S. resulted in reduced revenues in our Private Client Service unit (“PCS”)Management fees down 9% compared to 2Q2015 reflecting lower market levelsNet interest revenues almost flat versus 2Q2015, despite the ongoing low interest rate environment in Europe

2Q2016 results 27 July 2016
Deutsche BankInvestor Relations
Income before income taxes Key featuresIn EUR m In EUR m
2Q16 2Q15 2Q16 vs. 2Q15 1H16 1H15 1H16 vs.
1H15
Net revenues 706 769 (8)% 1,397 1,518 (8)%Memo: Net revenues ex-Abbey gross-up (1) 635 768 (17)% 1,283 1,340 (4)%
Prov. for credit losses (0) (0) (94)% (1) (0) 12%Noninterest exp. (535) (504) 6% (1,063) (1,151) (8)%
Memo: Noninterest exp. ex-Abbey gross-up (2) (461) (495) (7)% (945) (988) (4)%
IBIT 171 265 (35)% 334 366 (9)%CIR 76% 66% 10 ppt 76% 76% 0 pptInvested assets 719 755 (5)% 719 755 (5)%Net new money (9) 10 n.m. (20) 24 n.m.Post-tax RoE 7.0% 12.0% (5) ppt 6.8% 8.5% (2) ppt
2015 2016 Post-tax RoTE 29.1% 78.6% (50) ppt 28.5% 56.7% (28) pptRestructuring and severance
(1) (2) (1) (3) (23) (33) (3) (56)Litigation_2
0 (4) 3 (0) (1) (0) (4) (1)
2015 2016
(3)
(3)
(4)
(5)
101
265
140174 162 171
366334
1Q 2Q 3Q 4Q 1Q 2Q 1H 1H
Deutsche Asset Management
21
— 2Q2016 revenues down 17% y-o-y (excluding Abbey Life gross-up), largely due to a strong 2Q2015 benefiting from fair value gains in Active and performance fees in Alternatives, and a weaker market environment this year
— Net asset outflows of EUR 9bn mainly due to liquidity products of EUR 5bn yielding single digit basis point returns
— Noninterest expenses excluding Abbey Life policyholder provisions down 7% y-o-y benefiting from lower compensation costs
— 2Q2016 IBIT down 35% y-o-y; CIR 76%
Note: Figures restated due to transfer of Fund Solutions and Certificates and Warrants businesses from Deutsche Asset Management to Global Markets. Figures may not add up due to rounding differences
(1) Net revenues ex mark to market movements on policyholder positions in Abbey Life
(2) Noninterest expenses ex policyholder positions in Abbey Life (3) In EUR bn (4) Based on average shareholder’s equity(5) Based on average tangible shareholders’ equity

2Q2016 results 27 July 2016
Deutsche BankInvestor Relations
Income before income taxes Key featuresIn EUR m In EUR m
2Q16 2Q15 2Q16 vs. 2Q15 1H16 1H15 1H16 vs.
1H15
Net revenues 903 803 13% 1,764 1,660 6%
Prov. for credit losses (34) (26) 31% (76) (84) (9)%
Noninterest exp. (690) (688) 0% (1,387) (1,376) 1%
IBIT 179 88 103% 301 201 50%CIR 76% 86% (9) ppt 79% 83% (4) pptPost-tax RoE 8.0% 2.7% 5 ppt 6.8% 3.1% 4 pptPost-tax RoTE 8.4% 4.1% 4 ppt 7.1% 4.6% 3 ppt
2015 2016Restructuring and severance
1 (0) 0 (84) (1) (1) 1 (2)
Litigation_2
(0) (0) (1) (13) (4) (27) (0) (31)
Impairments0 0 (2,597) 0 0 0 0 0
therein: Postbank NCOU (72) (35) (85) (274) (55) (73) (107) (128)
2015 2016
(1)
(2)
113 88
(2,486)
(312)
122179 201
301
1Q 2Q 3Q 4Q 1Q 2Q 1H 1H
Postbank
22
Note: Figures may not add up due to rounding differencesPostbank segment figures do not match Postbank stand-alone view figures due to separation cost and other items in C&A segment as well as further consolidation effects (e.g. PPA)
(1) Based on average shareholders’ equity(2) Based on average tangible shareholders’ equity
Improvement in IBIT primarily driven by higher Other revenuesRevenue burden from low interest rate environment more than offset by sale of assets including EUR 104m from a stake in Visa Europe Ltd.Provisions for credit losses up y-o-y due to one-off NPL sale in 2Q2015, adjusted for this down EUR 18m or 35% reflecting benign economic environment in GermanyExcluding litigation, costs are down EUR 25m or 4% y-o-y despite continued investments in efficiency and digitalization and increased costs for European deposit insurance schemeSuccessful completion of the operational separability achieved as planned end of 2Q2016
Postbank NCOU IBIT
2Q2016 results 27 July 2016
Deutsche BankInvestor Relations
Income before income taxes Key featuresIn EUR m In EUR m
2Q16 2Q15 2Q16 vs. 2Q15 1H16 1H15 1H16 vs.
1H15
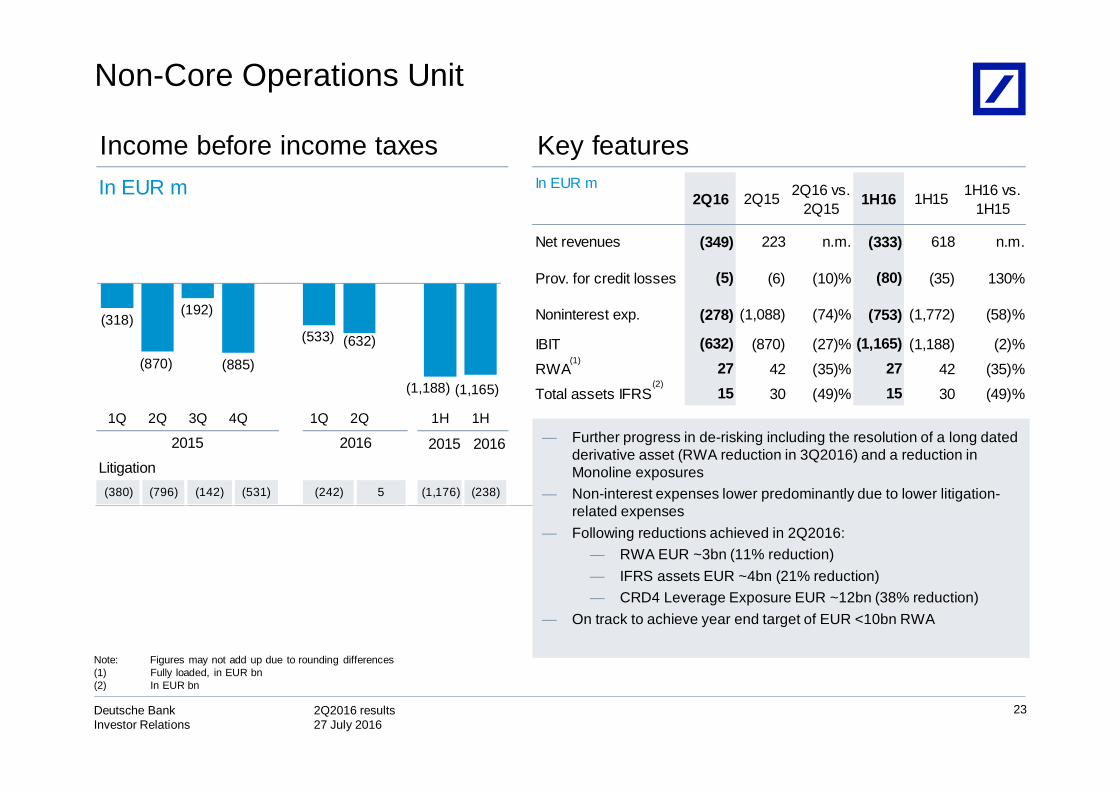
Net revenues (349) 223 n.m. (333) 618 n.m.
Prov. for credit losses (5) (6) (10)% (80) (35) 130%
Noninterest exp. (278) (1,088) (74)% (753) (1,772) (58)%
IBIT (632) (870) (27)% (1,165) (1,188) (2)%
RWA 27 42 (35)% 27 42 (35)%
Total assets IFRS 15 30 (49)% 15 30 (49)%
2015 2016Litigation_2(380) (796) (142) (531) (242) 5 (1,176) (238)
2015 2016
(2)
(1)
(318)
(870)
(192)
(885)
(533) (632)
(1,188) (1,165)
1Q 2Q 3Q 4Q 1Q 2Q 1H 1H
Non-Core Operations Unit
23
Note: Figures may not add up due to rounding differences(1) Fully loaded, in EUR bn(2) In EUR bn
— Further progress in de-risking including the resolution of a long dated derivative asset (RWA reduction in 3Q2016) and a reduction in Monoline exposures
— Non-interest expenses lower predominantly due to lower litigation-related expenses
— Following reductions achieved in 2Q2016: — RWA EUR ~3bn (11% reduction) — IFRS assets EUR ~4bn (21% reduction)— CRD4 Leverage Exposure EUR ~12bn (38% reduction)
— On track to achieve year end target of EUR <10bn RWA

2Q2016 results 27 July 2016
Deutsche BankInvestor Relations
Consolidation & Adjustments
24
Income before income taxes Key featuresIn EUR m In EUR m
2Q16 2Q15 2Q16 vs. 2Q15 1H16 1H15 1H16 vs.
1H15
IBIT 42 (418) n.m. 99 (6) n.m.
thereof
V&T differences 71 (156) n.m. 243 168 45%
FVA (11) (109) (90)% (20) (108) (81)%Postbank deconsolidation (47) (30) 57% (82) (30) 173%
Remaining 28 (123) n.m. (42) (35) 20%
2015 2016
Litigation_2(1) (0) (21) (358) (5) 72 (1) 67
20162015
(1)
(2)
Note: Figures may not add up due to rounding differencesFrom 2016 onwards, certain Liquidity Management activities previously included within the business segments are now being centrally managed by Treasury and therefore have been transferred to C&A and are reflected in the business segments on an allocated basis.
(1) Valuation and Timing (V&T) reflects the effects from different accounting methods used for management reporting and IFRS
(2) Funding Valuation Adjustment (FVA)
413
(418)
(255)
(510)
57 42
(6)
99
1Q 2Q 3Q 4Q 1Q 2Q 1H 1H
— Main driver:
— Positive EUR 73m insurance recoveries related to the Kirchsettlement agreements
— Negative impact of EUR 47m resulting from costs related to Postbank separation

2Q2016 results 27 July 2016
Deutsche BankInvestor Relations
Strategy 2020 - Progress & Outlook
25
Challenging revenue environment, particularly post Brexit vote
2016 remains peak restructuring yearRestructuring and severances of EUR 0.3 – 0.5bn currently expected for 2H2016Adjusted Costs for 2016 currently expected to remain flat versus 2015
RWA to decline as per prior guidance, but will be managed to levels to achieve capital targetsNCOU wind-down still on track – expect less than EUR 10bn RWA by year end
CET 1 ratio expected to be approximately 11% by year end, affirming prior guidance despite headwindsHua Xia Bank transaction expected to be approved by September
Litigation remains a key challenge but still aiming to resolve some major cases in 2016
FTE reductions in Germany now starting and likely to extend into 2017

2Q2016 results 27 July 2016
Deutsche BankInvestor Relations
26
Appendix

2Q2016 results 27 July 2016
Deutsche BankInvestor Relations
Appendix: Table of Contents
27
28P&L details
39NCOU details
40CRD4 – Leverage Exposure and Risk Weighted Assets
41Loan book
42Impaired loans
43Value-at-Risk
Invested assets 44Headcount 46
38Transfer of businesses from AM to GM
2Q2016 results 27 July 2016
Deutsche BankInvestor Relations
28
First half net income 1H2016 vs. 1H2015In EUR m
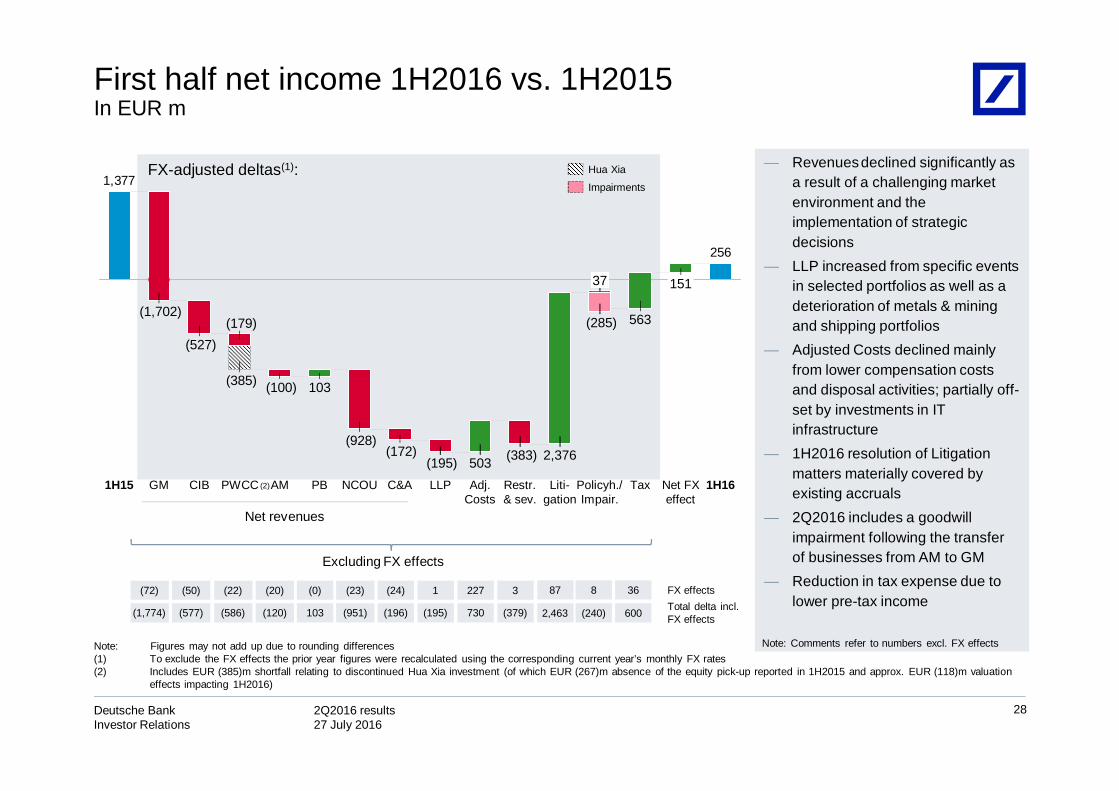
— Revenuesdeclined significantly asa result of a challenging marketenvironment and theimplementation of strategicdecisions
— LLP increased from specific eventsin selected portfolios as well as a deterioration of metals & miningand shipping portfolios
— Adjusted Costs declined mainlyfrom lower compensation costsand disposal activities; partially off-set by investments in IT infrastructure
— 1H2016 resolution of Litigationmatters materially covered byexisting accruals
— 2Q2016 includes a goodwillimpairment following the transferof businesses from AM to GM
— Reduction in tax expense due to lower pre-tax income
Note: Comments refer to numbers excl. FX effectsNote: Figures may not add up due to rounding differences(1) To exclude the FX effects the prior year figures were recalculated using the corresponding current year’s monthly FX rates (2) Includes EUR (385)m shortfall relating to discontinued Hua Xia investment (of which EUR (267)m absence of the equity pick-up reported in 1H2015 and approx. EUR (118)m valuation
effects impacting 1H2016)
(1,774) (577) (586) (120) 103 (951) (196) 730 (379)(195)
(72) (50) (22) (20) (0) (23) (24) 227 31
2,463
87
(240)
8
600
36
Excluding FX effects
Total delta incl. FX effects
FX effects
Net revenues
FX-adjusted deltas(1):
256
1,377
(172)
NCOU
(928)
PB
503
103
AMPWCC
(385)
Liti-gation
2,376
Restr.& sev.
(383)
Adj.Costs
(100)
LLP
151
Tax
563
Policyh./Impair.
37
1H16
(179)
Net FX effect
(527)
GM
(1,702)
1H15
(285)
(195)C&ACIB
Hua Xia
(2)
Impairments

2Q2016 results 27 July 2016
Deutsche BankInvestor Relations
2015 2016
GM 37% 36% 31% 23% 35% 33% 36% 34%
CIB 22% 23% 27% 27% 23% 25% 22% 24%
PWCC 21% 22% 19% 29% 22% 25% 22% 23%
Postbank 9% 9% 11% 9% 11% 12% 9% 11%
AM 8% 8% 8% 13% 9% 10% 8% 9%
NCOU 4% 2% 3% (1)% 0% (5)% 3% (2)%
2015 2016
EUR (1.8) bn (2) (2)
In EUR bnNet revenues
29
(1) Figures may not add up due to rounding differences(2) Includes EUR 0.1bn unfavorable FX movements
Contribution to Group revenues ex Consolidation & Adjustments by business segment(1):
10.4 9.27.3 6.6 8.1 7.4
19.615.5
1Q 2Q 3Q 4Q 1Q 2Q 1H 1H

2Q2016 results 27 July 2016
Deutsche BankInvestor Relations
189145
208
362
230 254
334484
296
17
75 5
35
80
1Q 2Q 3Q 4Q 1Q 2Q2 2Q3 1H 1H0.00%
0.20%
0.40%
0.60%
Provision for credit lossesIn EUR m
30
2015
(1) (1)
2015
Cost of Risk DB Group Cost of Risk Core Bank
Cost of Risk(1)
GM 1 5 0 43 15 39 6 54
CIB 50 39 90 163 136 115 89 251
PW&CC 80 74 54 92 36 66 154 103
Postbank 57 26 64 64 41 34 84 76
Note: Divisional figures do not add up due to omission of Deutsche AM; figures may not add up due to rounding differences(1) Provision for credit losses annualized in % of total loan book; total loan book see page 39
218151
207
380
304
Core NCOU
259
369
564
2016 2016

2Q2016 results 27 July 2016
Deutsche BankInvestor Relations
Loan exposure to ‘focus industries’
Note: Loan exposure refers to gross loans, before deduction of allowances(1) Includes only provision for loan losses before recoveries for individually assessed loans (2) Non-recourse financing of vessels via closed end funds
— Slightly higher drawings compared to Q1 mainly from national oil & gas companies— ~50% to IG borrowers (mainly oil majors and national oil & gas companies)— 25% to higher risk; sub-investment grade exploration & production (predominantly senior
secured) and oil & gas services & equipment segment — Q2 QTD provisions for loan losses EUR 12m(1)
— Loan loss allowances as of June 30, 2016 EUR 63m
— Low 34% to IG clients reflects industry downturn; Hot spots US coal and steel— Significant share of portfolio is in EM, in line with location of mining sites— Q2 QTD provisions for loan losses EUR 55m(1)
— Loan loss allowances as of June 30, 2016 EUR 170m
— Largely collateralized— Portfolio is diversified across ship types— Counterparties mainly domiciled in Europe— High proportion of portfolio is sub IG— Q2 QTD provisions for loan losses EUR 55m(1)
— Loan loss allowances as of June 30, 2016 EUR 308m — <10% of exposure to German “KG” sector(2)
Oil & Gas: ~ EUR 8bn loan exposure
Metals, Mining, Steel: ~ EUR 6bn loan exposure
Shipping: ~ EUR 5bn loan exposure
Loan exposure
EUR 433bn
RetailEUR 188bn
CorporatesEUR 245bn
31

2Q2016 results 27 July 2016
Deutsche BankInvestor Relations
2015 2016
Adjusted Costs (in EUR m) 6,914 6,516 6,210 6,811 6,668 6,032 13,430 12,700excludes:
Impairment of Goodwill & Intangibles 0 0 5,770 6 0 285 0 285
Litigation 1,544 1,227 1,209 1,238 187 120 2,771 308
Policyholder benefits and claims 153 10 (29) 122 44 74 163 118
Restructuring and severance 67 45 63 790 285 207 113 492
Cost / income ratio (reported) 84% 85% 180% 135% 89% 91% 84% 90%
Compensation ratio (reported) 33% 38% 45% 47% 40% 40% 35% 40%
2015 2016
(1)
Noninterest expenses, in EUR bnReported and adjusted costs
32
Compensation and benefitsNoninterest expenses excl. compensation and benefits
Note: Adjusted Costs is a non-GAAP financial measure most directly comparable to the IFRS financial measure noninterest expenses. Adjusted Costs is calculated by adjusting noninterest expenses under IFRS for the excluded items mentioned above. Figures may not add up due to rounding differences.
(1) 3Q2015 includes goodwill and other intangibles impairment of EUR 5,770m in GM, CIB, PW&CC and Postbank
3.4 3.4 3.3 3.1 3.2 3.0 6.9 6.2
5.2 4.4 9.9
5.9 4.0 3.8
9.6 7.88.7 7.8
13.2 9.0 7.2 6.7
16.513.9
1Q 2Q 3Q 4Q 1Q 2Q 1H 1H

2Q2016 results 27 July 2016
Deutsche BankInvestor Relations
In EUR m IBIT CVA / DVA / FVA Restructuring and severance Litigation Impairments
GM 28 2 (41) (134) (285)
CIB 432 0 (61) (7) 0
PWCC 187 0 (69) (28) 0
Postbank 179 0 (1) (27) 0
AM 171 0 (33) (0) 0
C&A 42 (11) (1) 72 0
Core Bank 1,039 (9) (205) (125) (285)
NCOU (632) 44 (1) 5 0
Group 408 35 (207) (120) (285)
2Q16
2Q2016: IBIT detail
33
Note: Figures may not add up due to rounding differences

2Q2016 results 27 July 2016
Deutsche BankInvestor Relations
In EUR m IBIT CVA / DVA / FVA Restructuring and severance Litigation Impairments
GM 1,086 164 (24) (268) 0
CIB 595 (1) (11) (137) 0
PWCC 483 0 (1) (20) 0
Postbank 88 0 (0) (0) 0
AM 265 0 (2) (4) 0
C&A (418) (109) (0) (0) 0
Core Bank 2,099 54 (39) (430) 0
NCOU (870) (16) (6) (796) 0
Group 1,228 38 (45) (1,227) 0
2Q15
2Q2015: IBIT detail
34
Note: Figures may not add up due to rounding differences
2Q2016 results 27 July 2016
Deutsche BankInvestor Relations
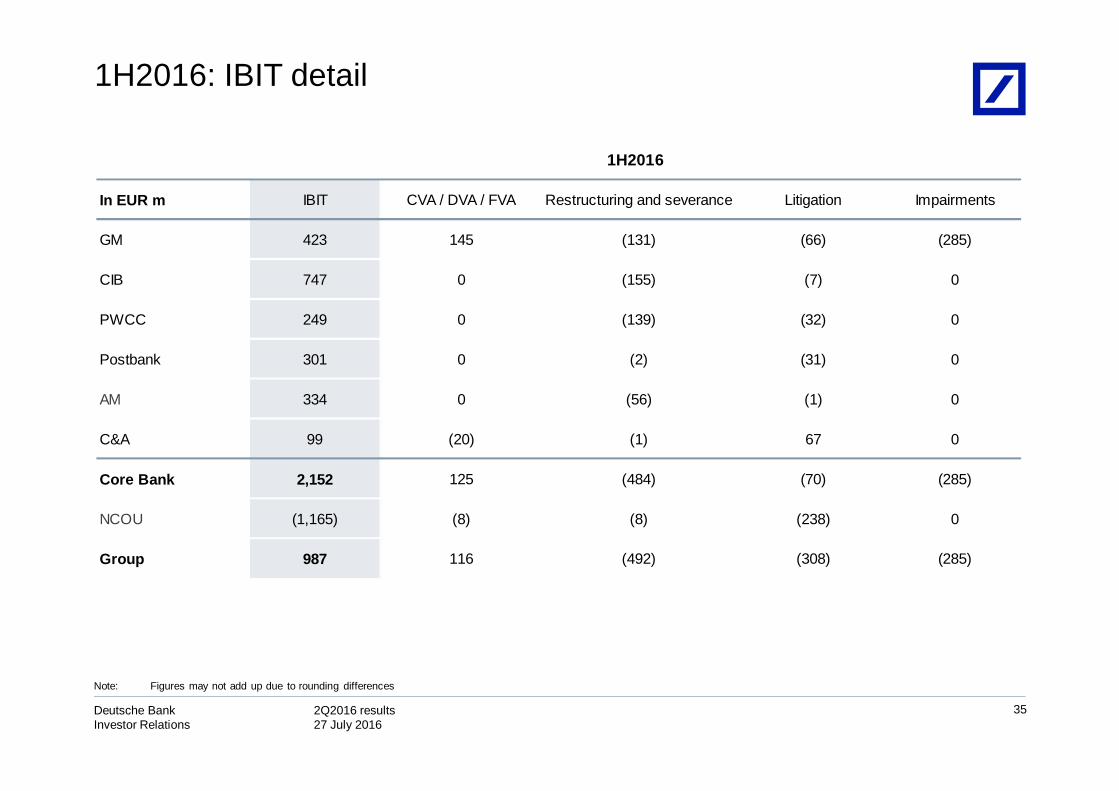
In EUR m IBIT CVA / DVA / FVA Restructuring and severance Litigation Impairments
GM 423 145 (131) (66) (285)
CIB 747 0 (155) (7) 0
PWCC 249 0 (139) (32) 0
Postbank 301 0 (2) (31) 0
AM 334 0 (56) (1) 0
C&A 99 (20) (1) 67 0
Core Bank 2,152 125 (484) (70) (285)
NCOU (1,165) (8) (8) (238) 0
Group 987 116 (492) (308) (285)
1H2016
1H2016: IBIT detail
35
Note: Figures may not add up due to rounding differences

2Q2016 results 27 July 2016
Deutsche BankInvestor Relations
In EUR m IBIT CVA / DVA / FVA Restructuring and severance Litigation Impairments
GM 1,131 (12) (62) (1,423) 0
CIB 1,316 (1) (25) (142) 0
PWCC 887 0 (4) (23) 0
Postbank 201 0 1 (0) 0
AM 366 0 (3) (4) 0
C&A (6) (108) 0 (1) 0
Core Bank 3,896 (120) (95) (1,595) 0
NCOU (1,188) (90) (18) (1,176) 0
Group 2,708 (211) (113) (2,771) 0
1H2015
1H2015: IBIT detail
36
Note: Figures may not add up due to rounding differences

2Q2016 results 27 July 2016
Deutsche BankInvestor Relations
In EUR m, unless otherwise statedPost-tax RoTE
37
Note: Post-tax return on average tangible shareholders’ equity is calculated as net income (loss) attributable to Deutsche Bank shareholders as a percentage of average tangible shareholders’ equity. Net income (loss) attributable to Deutsche Bank shareholders is defined as net income (loss) excluding post-tax income (loss) attributable to noncontrollinginterests. At the Group this level reflects the reported effective tax rate for the Group, which was 95 % for the three months ended June 30, 2016 and 33 % for the prior year’s comparative period. The tax rate was 74 % for the six months ended June 30, 2016 and 49 % for the prior year’s comparative period.
(1) For the post-tax return on average shareholders’ equity and average tangible shareholders’ equity of the segments, the applied tax rates were 35 % for all presented periods.
2Q16 2Q15 2Q16 2Q15 2Q16 2Q15 2Q16 2Q15 2Q16 2Q15 2Q16 2Q15 2Q16 2Q15 2Q16 2Q15
IBIT 28 1,086 432 595 187 483 179 88 171 265 (632) (870) 42 (418) 408 1,228 Taxes 10 384 149 211 65 171 62 31 59 94 (219) (308) 261 (173) 388 410 Net Income 19 702 283 385 122 312 117 57 112 171 (413) (562) (219) (246) 20 818 Noncontrolling Interest 0 0 0 0 0 0 0 0 0 0 0 0 (2) (22) (2) (22)Net Income DB shareholders 19 702 283 385 122 312 117 57 112 171 (413) (562) (221) (268) 18 796 Average Shareholder's Equity 24,344 25,923 11,846 12,867 8,877 10,723 5,838 8,395 6,403 5,706 4,654 6,806 50 1,446 62,011 71,865 Average Goodwill and other intangibles 1,722 2,278 1,108 1,418 1,531 2,448 282 2,831 4,860 4,836 542 537 (45) 1,348 10,001 15,697 Average Tangible Shareholders' Equity 22,621 23,645 10,738 11,448 7,346 8,275 5,556 5,564 1,542 870 4,112 6,269 95 98 52,011 56,168 Post-tax RoTE (in %) 0.3 11.9 10.5 13.4 6.7 15.1 8.4 4.1 29.1 78.6 n.m. n.m. n.m. n.m. 0.1 5.7
1H16 1H15 1H16 1H15 1H16 1H15 1H16 1H15 1H16 1H15 1H16 1H15 1H16 1H15 1H16 1H15IBIT 423 1,131 747 1,316 249 887 301 201 334 366 (1,165) (1,188) 99 (6) 987 2,708 Taxes 146 400 258 466 86 314 104 71 115 130 (403) (421) 423 370 731 1,331 Net Income 277 731 488 850 163 573 197 130 218 236 (762) (767) (324) (376) 256 1,377 Noncontrolling Interest 0 0 0 0 0 0 0 0 0 0 0 0 (24) (38) (24) (38)Net Income DB shareholders 277 731 488 850 163 573 197 130 218 236 (762) (767) (349) (413) 232 1,339 Average Shareholder's Equity 24,177 24,601 11,978 12,276 9,136 10,403 5,786 8,492 6,396 5,593 4,850 7,509 70 2,424 62,393 71,299 Average Goodwill and other intangibles 1,640 2,094 1,108 1,299 1,653 2,311 278 2,818 4,865 4,759 563 572 (71) 1,694 10,036 15,548 Average Tangible Shareholders' Equity 22,537 22,507 10,870 10,977 7,483 8,093 5,508 5,674 1,531 834 4,287 6,937 141 729 52,357 55,751
Post-tax RoTE (in %) 2.5 6.5 9.0 15.5 4.4 14.2 7.1 4.6 28.5 56.7 n.m. n.m. n.m. n.m. 0.9 4.8
C&A GroupGM CIB PWCC Postbank AM NCOU
(1)
(1)
2Q2016 results 27 July 2016
Deutsche BankInvestor Relations
38
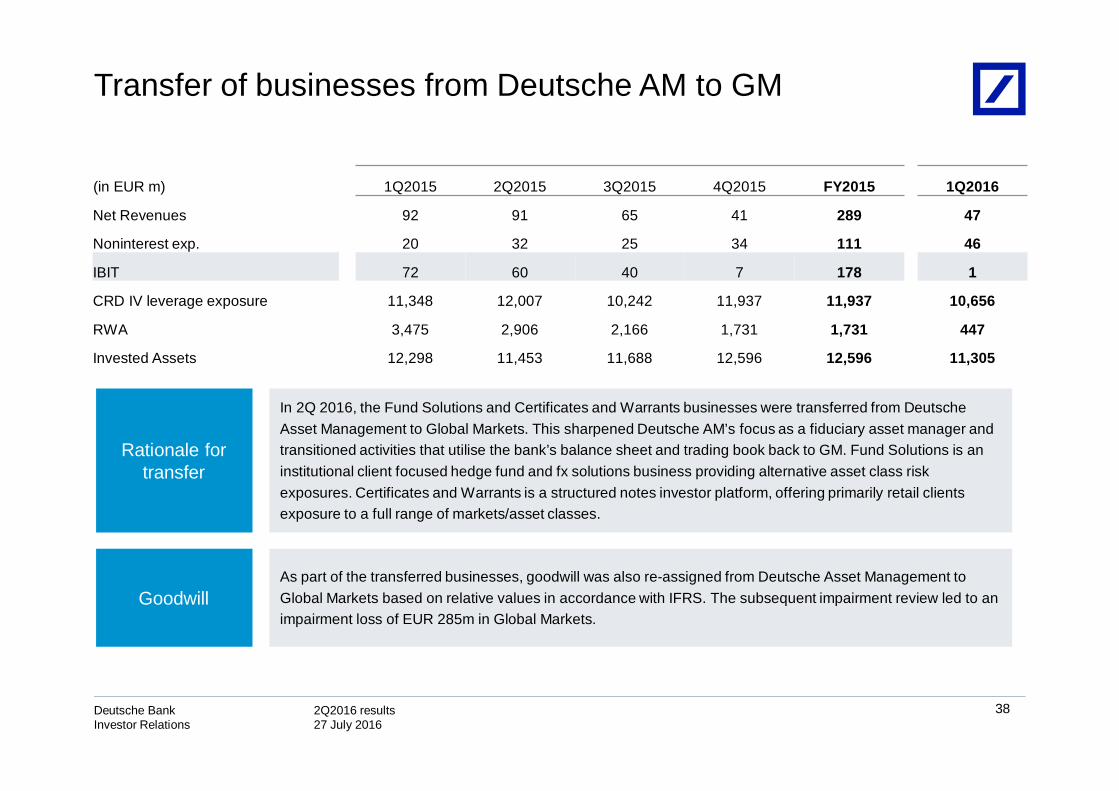
Transfer of businesses from Deutsche AM to GM
In 2Q 2016, the Fund Solutions and Certificates and Warrants businesses were transferred from Deutsche Asset Management to Global Markets. This sharpened Deutsche AM’s focus as a fiduciary asset manager and transitioned activities that utilise the bank’s balance sheet and trading book back to GM. Fund Solutions is an institutional client focused hedge fund and fx solutions business providing alternative asset class risk exposures. Certificates and Warrants is a structured notes investor platform, offering primarily retail clients exposure to a full range of markets/asset classes.
GoodwillAs part of the transferred businesses, goodwill was also re-assigned from Deutsche Asset Management to Global Markets based on relative values in accordance with IFRS. The subsequent impairment review led to an impairment loss of EUR 285m in Global Markets.
Rationale for transfer
(in EUR m) 1Q2015 2Q2015 3Q2015 4Q2015 FY2015 1Q2016
Net Revenues 92 91 65 41 289 47
Noninterest exp. 20 32 25 34 111 46
IBIT 72 60 40 7 178 1
CRD IV leverage exposure 11,348 12,007 10,242 11,937 11,937 10,656
RWA 3,475 2,906 2,166 1,731 1,731 447
Invested Assets 12,298 11,453 11,688 12,596 12,596 11,305
2Q2016 results 27 July 2016
Deutsche BankInvestor Relations
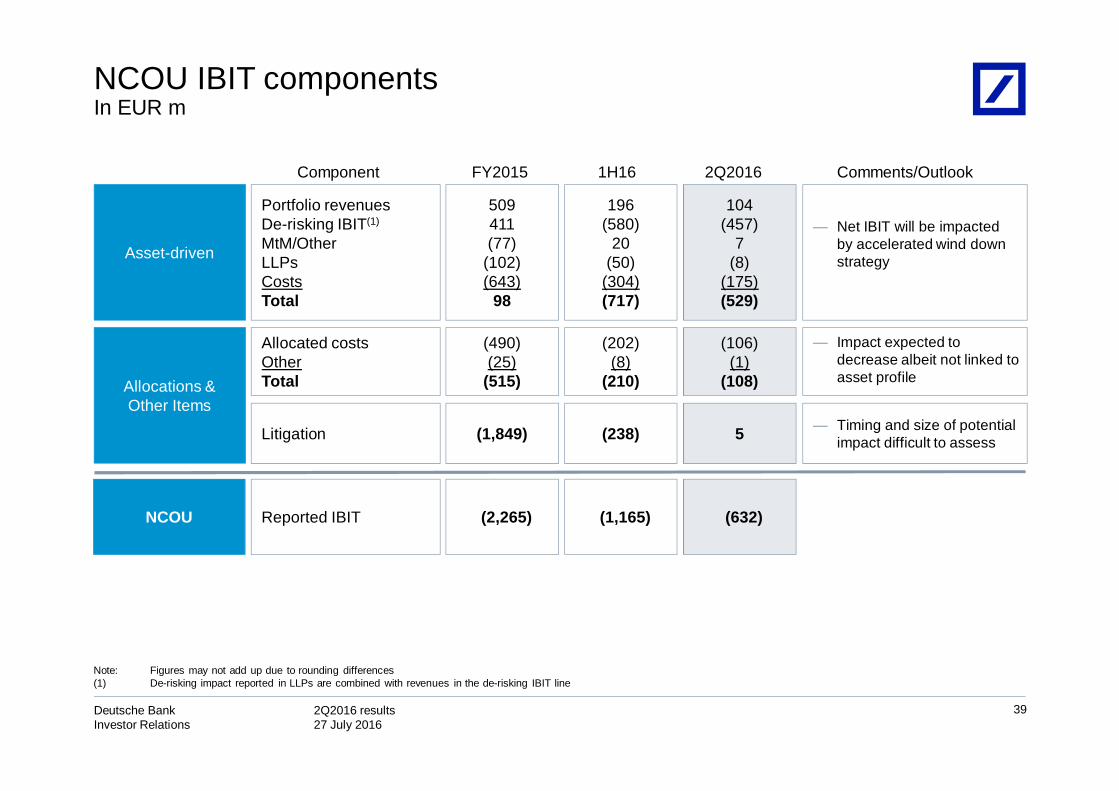
NCOU IBIT components In EUR m
39
Note: Figures may not add up due to rounding differences(1) De-risking impact reported in LLPs are combined with revenues in the de-risking IBIT line
NCOU (2,265) (1,165)
Asset-driven
Portfolio revenuesDe-risking IBIT(1)
MtM/OtherLLPsCostsTotal
— Timing and size of potential impact difficult to assess
— Impact expected to decrease albeit not linked to asset profile
(632)
104(457)
7(8)
(175)(529)
5
(106)(1)
(108)Allocations & Other Items
509411(77)
(102)(643)
98
196(580)
20(50)
(304)(717)
Allocated costs OtherTotal
Litigation
(490)(25)
(515)
(1,849)
(202)(8)
(210)
(238)
Reported IBIT
— Net IBIT will be impacted by accelerated wind down strategy
FY2015 1H16 Comments/Outlook2Q2016Component

2Q2016 results 27 July 2016
Deutsche BankInvestor Relations
CRD4 – Leverage Exposure and Risk Weighted Assets
Leverage Exposure vs. RWA(1)
In EUR bn
250
6464
Note: Figures may not add up due to rounding differences(1) RWA excludes Operational Risk RWA of EUR 96bn(2) Excludes any related Market Risk RWA which has been fully allocated to non-derivatives trading assets(3) Lending commitments and contingent liabilities
40
248
14
44
Credit Risk RWA
CVA
Market Risk RWA
30 Jun 2016
306
Other
Cash and depositswith banks
Reverse repo /securitiesborrowed
Lending
Derivatives(2)
Non-derivativetrading assets
30 Jun 2016
306
44
290 4
130
52
47
30 Jun 2016
1,415
163
102133
183
417
244
Off B/S(3)
31 Mar 2016
1,390
160
102
173
175
413
249
171
121
CRD4 – Leverage Exposure RWA

2Q2016 results 27 July 2016
Deutsche BankInvestor Relations
41
Loan bookIn EUR bn
Note: Loan amounts are gross of allowances for loan losses. Figures may not add up due to rounding differences.
2015 2016
106 103 100 97
50 50 55 58
NCOU
PB
DAM
PW&CC
CIB
GM
31-Dec
433
9
104
0
164
30-Sep
433
11
104
0
163
30-Jun
430
12
104
0
161
31-Mar
434
13
104
0
160
97 97
58 61
31-Mar
429
8
104
0
162
30-Jun
433
163
0
105
6

2Q2016 results 27 July 2016
Deutsche BankInvestor Relations
6.7 6.2 5.9 6.0 6.0 6.1
2.72.5
2.2 2.1 1.6 1.3
1Q 2Q 3Q 4Q 1Q 2Q
Non-Core Operations Unit Core
0.00%
0.50%
1.00%
1.50%
2.00%
2.50%
Impaired loan ratio Deutsche Bank Group Impaired loan ratio Core Bank
Impaired loans(1)Period-end, in EUR bn
42
CoverageRatio(2)
Note: Figures may not add up due to rounding differences(1) IFRS impaired loans include loans which are individually impaired under IFRS, i.e. for which a specific loan loss allowance has been established, as well as loans collectively assessed
for impairment which have been put on nonaccrual status(2) Total on-balance sheet allowances divided by IFRS impaired loans (excluding collateral); total on-balance sheet allowances include allowances for all loans individually impaired or
collectively assessed(3) Impaired loans in % of total loan book
(3)(3)
57% 58% 60% 62% 61%
9.48.7
8.1 8.2 7.6 7.4
61%
2015 2016

2Q2016 results 27 July 2016
Deutsche BankInvestor Relations
43
Value-at-RiskDB Group, 99%, 1 day, in EUR m
Average VaRStressed VaR(1)
(1) Stressed Value-at-Risk is calculated on the same portfolio as VaR but uses a historical market data from a period of significant financial stress (i.e. characterized by high volatilities and extreme price movements)
20
40
60
80
100
120
140
160
180
2Q2015 2Q2016
46 40102 111
3789
3Q2015
3899
4Q2015 1Q2016
3798
EUR 3.3 bn EUR 2.5 bnSales & Trading revenues

2Q2016 results 27 July 2016
Deutsche BankInvestor Relations
Invested Assets / Client Assets – PW&CCIn EUR bn
44
Note: Figures may not add up due to rounding differences(1) Assets under Administration include assets over which DB provides non investment services such as custody, risk management, administration and reporting (including execution
only brokerage) as well as current accounts / non-investment deposits(2) View based on client coverage region
In EUR bn
FY2014 1Q2015 2Q2015 3Q2015 4Q2015 1Q2016 2Q2016Invested Assets 489 523 515 492 499 476 478Assets under Administration (1) 138 155 153 149 157 154 158Client Assets 626 678 668 642 656 630 636
Breakdown of Invested Assets 489 523 515 492 499 476 478 Private & Commercial Clients (PCC) 214 225 218 209 213 205 204 Wealth Management (WM) (2) 275 298 296 284 286 271 274 therein: Americas 82 93 88 85 88 80 82 therein: Asia-Pacific 46 52 52 49 51 49 49 therein: EMEA ex GY 61 66 66 64 66 61 60 therein: Germany 86 88 90 85 82 80 83
Breakdown of Client Assets 626 678 668 642 656 630 636 Private & Commercial Clients (PCC) 274 287 283 274 282 273 275 Wealth Management (WM) (2) 352 391 385 367 374 357 361 therein: Americas 112 127 121 116 119 111 113 therein: Asia-Pacific 46 52 52 49 51 49 49 therein: EMEA ex GY 67 74 73 71 73 70 68 therein: Germany 127 139 139 132 131 127 131
Net new money - Invested Assets 22 2 3 2 (4) (4) (1) Private & Commercial Clients (PCC) 9 1 (1) (1) (0) (2) 0 Wealth Management (WM) 12 1 4 3 (3) (2) (2)

2Q2016 results 27 July 2016
Deutsche BankInvestor Relations
Invested Assets / Client Assets – AMIn EUR bn
45
Note: Figures may not add up due to rounding differences(1) Assets under Administration include assets over which DB provides non investment services such as custody, risk management, administration and reporting (including execution
only brokerage) as well as current accounts / non-investment deposits
FY2014 1Q2015 2Q2015 3Q2015 4Q2015 1Q2016 2Q2016Invested Assets 691 773 755 726 744 711 719Assets under Administration (1) 42 54 53 51 54 57 63Client Assets 733 828 808 777 798 768 782
Breakdown of Invested Assets 691 773 755 726 744 711 719Regional
therein: Americas 215 242 236 228 233 215 216therein: Asia-Pacific 40 45 43 41 42 38 41therein: EMEA ex GY 194 222 200 190 195 189 188therein: Germany 242 264 276 266 274 270 274
Client Viewtherein: Retail 291 338 330 314 333 317 319therein: Institutional 400 435 425 412 412 394 400
Net New Money - Invested Assets 27 14 10 (4) (3) (12) (9)Regional
therein: Americas 0 2 4 (3) (4) (10) (6)therein: Asia-Pacific 9 (0) 1 0 1 0 0therein: EMEA ex GY 17 8 3 (4) 2 (3) (3)therein: Germany 1 4 3 3 (1) 2 (0)
Client Viewtherein: Retail 25 15 12 4 (0) (3) (4)therein: Institutional 3 (1) (2) (8) (2) (9) (5)

2Q2016 results 27 July 2016
Deutsche BankInvestor Relations
Full-time equivalents, at period endGroup headcount
46
30 Jun 2015 30 Sep 2015 31 Dec 2015 31 Mar 2016 30 Jun 201630 Jun 2016
vs.31 Mar 2016
GM 4,891 4,947 4,915 4,783 4,671 (112)
CIB 7,124 7,327 7,359 7,295 7,178 (117)
PWCC 25,759 25,774 25,696 25,640 25,525 (115)
Postbank 18,935 18,843 18,659 18,888 18,728 (160)
AM 2,492 2,599 2,679 2,647 2,569 (78)
NCOU 162 153 141 133 132 (1)
Infrastructure / Regional Management 39,285 40,766 41,656 42,059 42,505 445
Total 98,647 100,407 101,104 101,445 101,307 (138)

2Q2016 results 27 July 2016
Deutsche BankInvestor Relations
This presentation contains forward-looking statements. Forward-looking statements are statements that are not historicalfacts; they include statements about our beliefs and expectations and the assumptions underlying them. Thesestatements are based on plans, estimates and projections as they are currently available to the management of DeutscheBank. Forward-looking statements therefore speak only as of the date they are made, and we undertake no obligation toupdate publicly any of them in light of new information or future events.
By their very nature, forward-looking statements involve risks and uncertainties. A number of important factors couldtherefore cause actual results to differ materially from those contained in any forward-looking statement. Such factorsinclude the conditions in the financial markets in Germany, in Europe, in the United States and elsewhere from which wederive a substantial portion of our revenues and in which we hold a substantial portion of our assets, the development ofasset prices and market volatility, potential defaults of borrowers or trading counterparties, the implementation of ourstrategic initiatives, the reliability of our risk management policies, procedures and methods, and other risks referenced inour filings with the U.S. Securities and Exchange Commission. Such factors are described in detail in our SEC Form20-F of 11 March 2016 under the heading “Risk Factors.” Copies of this document are readily available upon request orcan be downloaded from www.db.com/ir.
This presentation also contains non-IFRS financial measures. For a reconciliation to directly comparable figures reportedunder IFRS, to the extent such reconciliation is not provided in this presentation, refer to the 2Q2016 Financial DataSupplement, which is accompanying this presentation and available at www.db.com/ir.
47
Cautionary statements