Deutsche Bank · 1Q2015 results financial transparency. 26 April 2015 Deutsche Bank Investor...
44
Deutsche Bank Deutsche Bank 1Q 2015 results 26 April 2015
Transcript of Deutsche Bank · 1Q2015 results financial transparency. 26 April 2015 Deutsche Bank Investor...

Deutsche Bank
Deutsche Bank1Q 2015 results
26 April 2015
financial transparency. 1Q2015 results 26 April 2015
Deutsche BankInvestor Relations
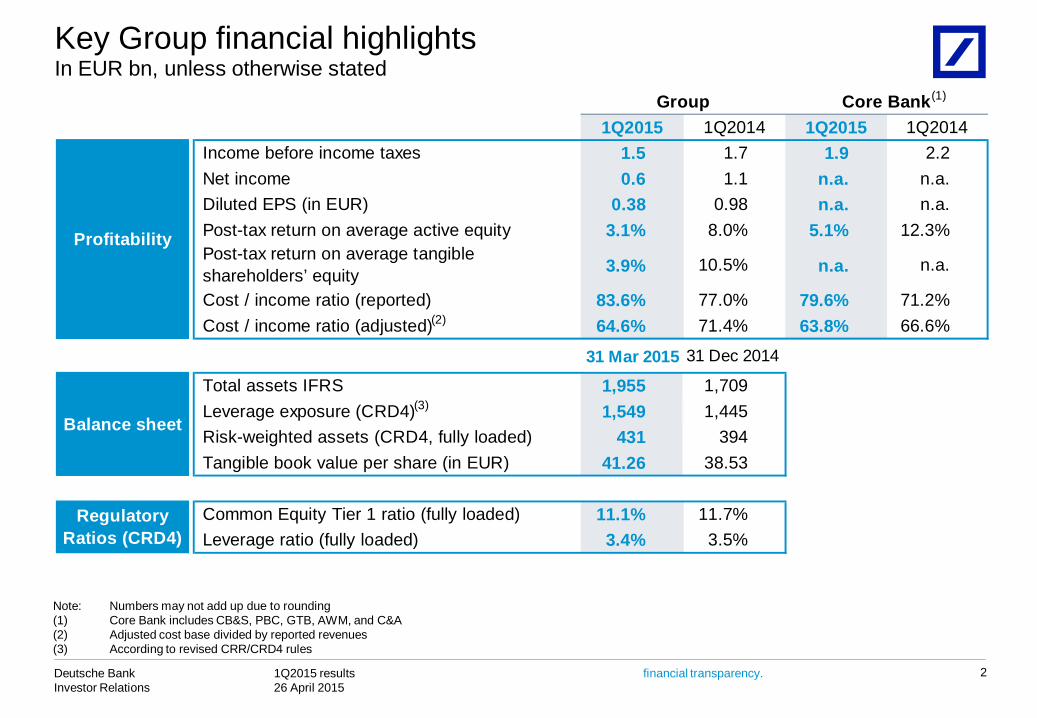
1Q2015 1Q2014 1Q2015 1Q2014Income before income taxes 1.5 1.7 1.9 2.2 Net income 0.6 1.1 n.a. n.a. Diluted EPS (in EUR) 0.38 0.98 n.a. n.a.Post-tax return on average active equity 3.1% 8.0% 5.1% 12.3%Post-tax return on average tangible shareholders’ equity 3.9% 10.5% n.a. n.a.
Cost / income ratio (reported) 83.6% 77.0% 79.6% 71.2%Cost / income ratio (adjusted) 64.6% 71.4% 63.8% 66.6%
31 Mar 2015 31 Dec 2014
Total assets IFRS 1,955 1,709 Leverage exposure (CRD4) 1,549 1,445 Risk-weighted assets (CRD4, fully loaded) 431 394 Tangible book value per share (in EUR) 41.26 38.53
Common Equity Tier 1 ratio (fully loaded) 11.1% 11.7%Leverage ratio (fully loaded) 3.4% 3.5%
RegulatoryRatios (CRD4)
Group Core Bank
Profitability
Balance sheet
(1)
(2)
(3)
In EUR bn, unless otherwise statedKey Group financial highlights
2
Note: Numbers may not add up due to rounding (1) Core Bank includes CB&S, PBC, GTB, AWM, and C&A(2) Adjusted cost base divided by reported revenues(3) According to revised CRR/CRD4 rules
financial transparency. 1Q2015 results 26 April 2015
Deutsche BankInvestor Relations
3
Agenda
1 Key current themes
2 Group results
3 Segment results
Capital / Leverage
Costs
Litigation

financial transparency. 1Q2015 results 26 April 2015
Deutsche BankInvestor Relations
Common Equity Tier 1 capitalIn EUR bn
(1) (1)(2)
Note: Figures may not add up due to rounding differences(1) CRD4/CRR rule interpretation still subject to ongoing issuance of EBA technical standards, etc. Totals do not include capital deductions in relation to additional
valuation adjustments since the final draft technical standard published by EBA is not yet adopted by the European Commission. 2014 dividend accrual based on the bank’s internal dividend policy.
(2) Net income attributable to Deutsche Bank shareholders from 1Q15 fully off-set by dividend accrual due to application of pay-out ratio assumption of 100% (2013 payout ratio capped at 100%) according to ECB decision from 4 Feb 2015.
(3) Before consideration of offset in shortfall of provisions to expected losses
FX Effect
47.81.9
(0.0)
31 Mar 2015
OtherEquity Comp
31 Dec 2014
46.1
Dividend Accrual
(0.5)
Net Income
0.5
(0.1)
11.1%11.7%
Capital: Common Equity Tier 1 developmentCRD4, fully loaded
4
(2)
OutlookFurther headwinds expected from: — EBA Regulatory Technical Standards, e.g.
Prudent Valuation: Potential EUR 1.5 – 2.0 bncapital impact(3)
ECB decision on recognition of interim profits requires dividend accrual based on the highest of:(a) the bank’s internal dividend policy(b) previous year’s payout ratio(c) average payout ratio over last 3 years— 100% of net income being accrued for 1Q15— Minimum of 89% to be accrued for remainder of
2015, assuming 75cts/share is paid out following Annual General Meeting in May
Events in the quarter

financial transparency. 1Q2015 results 26 April 2015
Deutsche BankInvestor Relations
RWAIn EUR bn
Note: Figures may not add up due to rounding differences(1) Credit Valuation Adjustments
Capital: RWA developmentCRD4, fully loaded
18.2
8.46.3
4.6
FX effect
431.4
Opera-tional risk
Market risk
CVA
(0.1)
Credit risk
31 Dec 2014
394.0
31 Mar 2015
(1)
Events in the quarter
Outlook
Further headwinds expected from: — Impact from industry litigation settlements and
continued regulatory focus on operational risks — Single Supervisory Mechanism / ECB, e.g.
— Harmonization of regulatory treatments across Euro-countries
— Continued review of RWA measurement on Basel level (e.g. fundamental trading book review, risk-weighted assets / capital floors, etc.)
— Business growth in credit and market risk— Market risk RWA also impacted by methodology
changes (EUR 3.2 bn)— Further increase in Operational Risk RWA given
recognition of external losses
5

financial transparency. 1Q2015 results 26 April 2015
Deutsche BankInvestor Relations
Leverage ratio: Strong ratio despite FX headwindsCRD4, fully-loaded
6
Note: Numbers may not add up due to rounding
1Q 2015FX Movements
(net of FX)CRD4Exposure
3.5% 3.4%
101
(15)
31 Dec2014
31 Mar2015
1,549
Cash, Coll. & Other
14
Trading Inv.
(1)
SFT
14
Deriv
(5)
Off B/S
(4)
NCOU
1,445
FX effect
Leverage ratio,fully loaded
x%
Events in the quarter
— Almost all of the 1Q2015 increase in LeverageExposure is explained by FX movements
Outlook
— EBA/EC proposal on minimum ratio requirements expected in 2016
FX neutral EUR 3bn

financial transparency. 1Q2015 results 26 April 2015
Deutsche BankInvestor Relations
Costs: Operating Cost and OpEx DevelopmentIn EUR bn
Note: Figures may not add up due to rounding differences(1) Includes also effects from deconsolidation in NCOU (EUR 0.2 bn)
7
1Q2015 vs. 1Q2014 OpEx program to dateIn EUR bn
Adj.cost base
1Q2015
0.5
Regulatory outside
Bank Levy
0.1
OpEx Savings
Adj. Cost base
1Q2014
6.0(0.3) (0.1)
6.7
0.5
Other(1) FX effectBankLevy
2012-14Invested/achieved
1Q 2015
CumulativeSavings
4.0
4.5
0.30.2
3.32.9
CumulativeCtA
3.63.1
1Q2015 reflects full year 2015 BRRD bank levy impact
Further strengthening of control functions and regulatory framework
Target

financial transparency. 1Q2015 results 26 April 2015
Deutsche BankInvestor Relations
8
Litigation: UpdateIn EUR bn
4.8 4.8
0.5 0.4
31 Dec 2014 31 Mar 2015
Litigation reserves Contingent liabilitiesMortgage repurchase demands/reserves (1)
DemandsReserves
In USD
1.9
3.2
31 Dec 2014 31 Mar 2015
— There continues to be significant uncertainty as to the timing and size of potential impacts
— Legal provisions excluding the IBOR settlement increased by EUR 0.5bn, reflecting increased provisions for certain matters and FX impacts offset by reductions as the result of settlements of various matters
— Includes possible obligations where an estimate can be made and outflow is more than remote but less than probable with respect to material and significant matters
— Contingent liabilities increased largely because we were able to make estimations for certain matters that previously we could not estimate
— Treated as negative revenues in NCOU
— We continue to see benign activity on the mortgage repurchase front. We cannot give any assurance that this trend will continue, particularly if there is an adverse decision concerning the statutes of limitations, an issue currently in litigation
(1) Reserves for mortgage repurchase demands are shown net of receivables in respect of indemnity agreements from the originators or sellers of certain of the mortgage loans of U.S.$ 359 million (EUR 334 million) and U.S.$ 359 million (EUR 295 million)as of December 31, 2014 and March 31, 2015, respectively. Gross reserves were U.S. $ 813 million (EUR 669 million) and U.S.$ 808 million (EUR 752 million) as of December 31, 2014 and March 31, 2015, respectively.
3.2
4.8
31 Dec 2014 31 Mar 2015
financial transparency. 1Q2015 results 26 April 2015
Deutsche BankInvestor Relations
9
Agenda
1 Key current themes
2 Group results
3 Segment results
financial transparency. 1Q2015 results 26 April 2015
Deutsche BankInvestor Relations
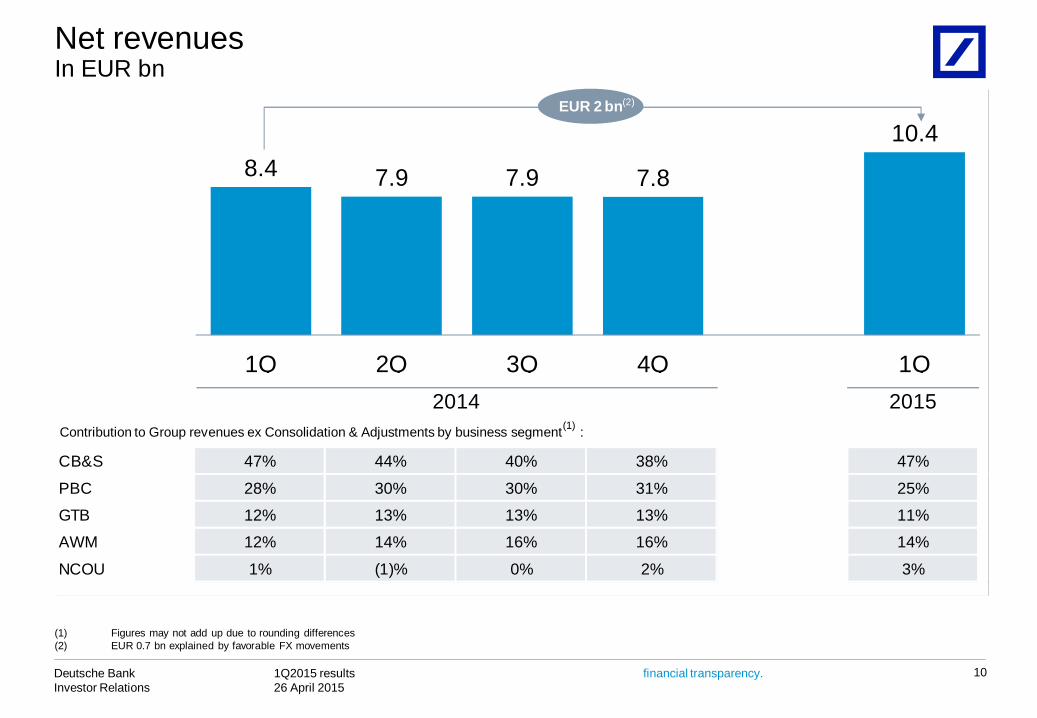
CB&S 47% 44% 40% 38% 47%
PBC 28% 30% 30% 31% 25%
GTB 12% 13% 13% 13% 11%
AWM 12% 14% 16% 16% 14%
NCOU 1% (1)% 0% 2% 3%
2014 2015
EUR 2 bn(2)
In EUR bnNet revenues
10
(1) Figures may not add up due to rounding differences(2) EUR 0.7 bn explained by favorable FX movements
Contribution to Group revenues ex Consolidation & Adjustments by business segment :(1)
8.4 7.9 7.9 7.8
10.4
1Q 2Q 3Q 4Q 1Q

financial transparency. 1Q2015 results 26 April 2015
Deutsche BankInvestor Relations
Adj. cost base (in EUR m) 5,992 5,723 6,043 6,010 6,699excludes:
Cost-to-Achieve 310 375 253 362 208
Litigation 0 470 894 207 1,544
Policyholder benefits and claims 52 80 77 80 153
Other severance 27 16 40 35 44
Remaining 85 29 23 517 31
CIR (adjusted) 71% 73% 77% 77% 65%
Compensation ratio 40% 38% 41% 38% 33%
2014 2015
(1)
(2)
In EUR bnCost: Reported and adjusted
11
Non-Compensation and benefitsCompensation and benefits
Note: Figures may not add up due to rounding differences(1) Includes smaller specific one-offs and impairments; 1Q2014 includes impairment in NCOU; 2Q2014 – 4Q2014 include charges from loan processing fees (EUR 32m 2Q2014, EUR 38m
3Q2014, EUR 330m 4Q2014); 4Q2014 includes recovery of goodwill and intangibles of EUR 83 m and EUR ~200 m Maher impairment in NCOU(2) Adjusted cost base divided by reported revenues
3.3 3.0 3.2 3.0 3.4
3.1 3.7 4.1 4.2 5.2
6.5 6.7 7.3 7.2 8.7
1Q 2Q 3Q 4Q 1Q

financial transparency. 1Q2015 results 26 April 2015
Deutsche BankInvestor Relations
16 44 33 9 3724 47 43 42 15140 145 150 187 135
-50
-40
-30
-20
-10
0
Provision for credit lossesIn EUR m
12
Note: Divisional figures do not add up due to omission of Deutsche AWM; figures may not add up due to rounding differences(1) Provision for credit losses annualized in % of total loan book
Cost of Risk (1)
179230 227 237
190
6719 42
131
28
246 250 269
369
218
0
50
100
150
200
250
300
350
400
1Q 2Q 3Q 4Q 1Q0.10%
0.20%
0.30%
0.40%Core Bank Non-Core Operations Unit Cost of Risk Deutsche Bank Group(1) Cost of Risk Core Bank(1)
2014 2015
CB&S
GTBPBC
(1) (1)
financial transparency. 1Q2015 results 26 April 2015
Deutsche BankInvestor Relations
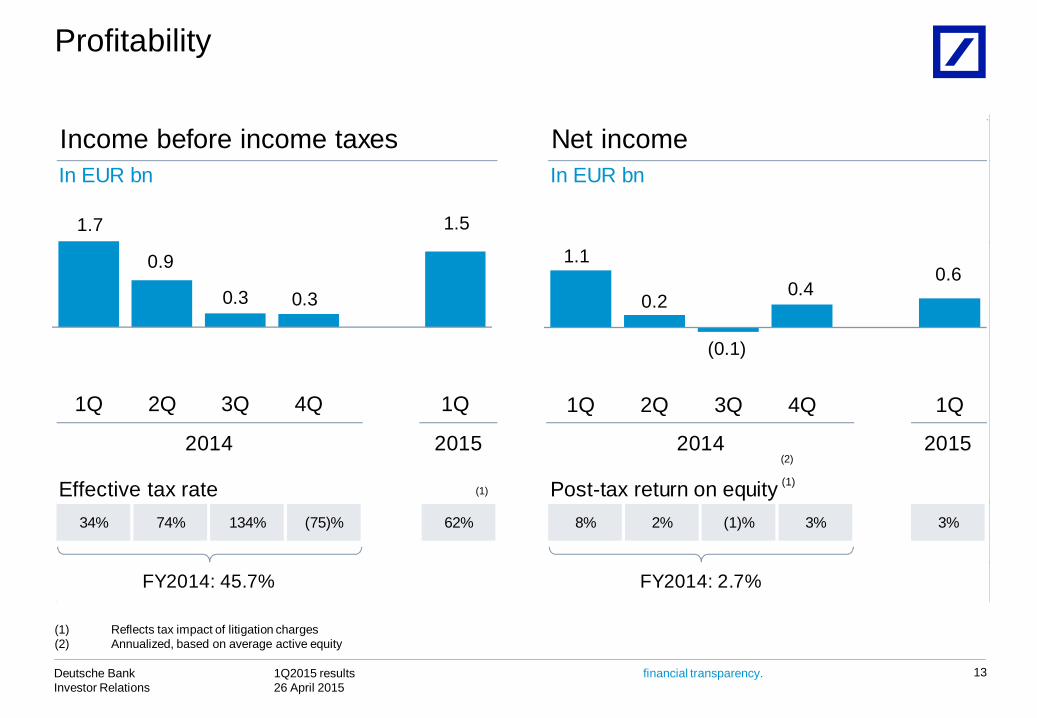
Income before income taxes Net incomeIn EUR bn In EUR bn
Effective tax rate Post-tax return on equity34% 74% 134% (75)% 62% 8% 2% (1)% 3% 3%
2015
FY2015: 0.0%FY2014: 45.7% FY2014: 2.7%
2014 2015 2014
FY2015: 1.7%
(1)
Profitability
13
(1) Reflects tax impact of litigation charges (2) Annualized, based on average active equity
1.1
0.2
(0.1)
0.4 0.6
1Q 2Q 3Q 4Q 1Q
1.7
0.9
0.3 0.3
1.5
1Q 2Q 3Q 4Q 1Q
(1)
(2)

financial transparency. 1Q2015 results 26 April 2015
Deutsche BankInvestor Relations
1.5
1.9
3.5
2.6
0.4
1.20.2
0.2
1Q2015Group reported
IBIT
NCOU Core Bank reported IBIT
Litigation Investing in our platform
CVA / DVA / FVA
1Q2015Core Bank
adjusted IBIT
1Q2014Core Bank
adjusted IBIT
(1)
(2) (3)
1Q2015 Group reported IBIT toCore Bank adjusted IBIT:
EUR 2.0 bn EUR 0.9 bn(4)
In EUR bn1Q2015 Core Bank adjusted IBIT
14
Note: Figures may not add up due to rounding differences(1) Core Bank-related litigation(2) CtA related to Operational Excellence program / restructuring and other severances(3) CVA (Credit Valuation Adjustment in CB&S): Adjustments made for mark-to-market movements related to mitigating hedges for Capital Requirements Regulation /
Capital Requirements Directive 4 risk-weighted assets arising on CVA; DVA (Debt Valuation Adjustment in CB&S): Incorporating the impact of own credit risk in the fair value of derivative contracts; FVA (Funding Valuation Adjustment in CB&S, NCOU, C&A): Incorporating market-implied funding costs for uncollateralized derivative positions
(4) EUR 0.3 bn explained by favorable FX movements

financial transparency. 1Q2015 results 26 April 2015
Deutsche BankInvestor Relations
15
Agenda
1 Key current themes
2 Group results
3 Segment results

financial transparency. 1Q2015 results 26 April 2015
Deutsche BankInvestor Relations
Income before income taxes Key featuresIn EUR m In EUR m 1Q15 1Q14 4Q14 1Q15 vs.
1Q141Q15 vs.
4Q14Revenues 4,654 4,042 2,965 15% 57 %Prov. for credit losses
(37) (16) (9) 137% n.m.
Noninterest exp. (3,959) (2,566) (2,628) 54% 51%IBIT 643 1,439 325 (55)% 98 %CIR 85% 63% 89% 22 ppt (4) pptPost-tax RoE 5.4% 17.9% 2.9% (12) ppt 3 ppt
CtA(111) (161) (69) (84) (70)
CVA / DVA / FVA3 (111) (166) (25) (226)
2014 2015
(2)
(1)
Litigation charges
1,439
826322 325
643
1,161
1Q 2Q 3Q 4Q 1Q
Corporate Banking & Securities
16
— CB&S revenues higher y-o-y driven by higher revenues across Debt Sales & Trading, Equity Sales & Trading and Origination & Advisory
— Higher y-o-y costs driven by higher litigation charges, FX impact and higher regulatory required spend. Excluding these items costs down 8% y-o-y. Compensation costs were down y-o-y despite revenue growthNote: Figures may not add up due to rounding differences
1) 1Q 2015 revenues include EUR 18 m of CVA losses (gain of EUR 31 m in 1Q 2014 and loss of EUR 18 m in 4Q 2014) relating to RWA mitigation efforts. 1Q 2015 revenues also include EUR 13 m of DVA losses (loss of EUR 42 m in 1Q 2014 and gain of EUR 7 m in 4Q 2014), and EUR 194 m FVA losses in 1Q 2015 (gain of EUR 14 m in 1Q 2014 and loss of EUR 15 m in 4Q 2014)
(2) Based on average active equity

financial transparency. 1Q2015 results 26 April 2015
Deutsche BankInvestor Relations
Revenues Key featuresDebt S&T, in EUR m
Equity S&T, in EUR m
2014 2015
2,4351,824
1,435 1,147
2,643
1Q 2Q 3Q 4Q 1Q
770 701 729 728
1,012
1Q 2Q 3Q 4Q 1Q
Sales & Trading revenues
17
Note: 1Q2015 Sales and Trading revenues include EUR 18 m of CVA losses, of which EUR 16 m were included in Debt S&T and EUR 3 m in Equities S&T revenues. Sales and Trading revenues also include EUR 194 m of FVA losses, EUR 193 m of which was included in Debt S&T and EUR 1 m in Equity S&T
Debt Sales & Trading
— FX revenues significantly higher y-o-y reflecting higher market volatility
— Rates revenues significantly higher y-o-y notably in Europe driven by increased client activity
— Global Liquidity Management revenues flat y-o-y
— Credit revenues significantly higher y-o-y driven by higher revenues across Europe and the US
— RMBS revenues significantly lower y-o-y due to changes in the operating environment
— Credit Solutions revenues flat y-o-y reflecting spread compression and market uncertainty
Equity Sales & Trading
— Cash Equities revenues higher y-o-y due to strong markets and good performance in Asia and Europe
— Equity Derivatives revenues significantly higher y-o-y driven by higher revenues in America and Asia
— Prime Finance revenues significantly higher y-o-y benefiting from strong client balances

financial transparency. 1Q2015 results 26 April 2015
Deutsche BankInvestor Relations
Revenues Key featuresIn EUR m
20152014
AdvisoryOrigination
518681
536 553 639
107
130
155 188145625
812691 740 784
1Q 2Q 3Q 4Q 1Q
Origination & Advisory
18
Overall— 1Q 2015 revenues up 26% y-o-y with higher revenues across
ECM, DCM and Advisory
— 2nd highest quarterly revenues since 4Q 2010
— 1Q 2015 saw a very active M&A and capital markets environment
Advisory — 1Q 2015 revenues significantly higher y-o-y driven by a
significant increase in fee pools
Equity Origination — 1Q 2015 revenues significantly higher y-o-y, driven by greater
market activity
Debt Origination — 1Q 2015 revenues higher y-o-y driven by strong performance
in US

financial transparency. 1Q2015 results 26 April 2015
Deutsche BankInvestor Relations
Income before income taxes Key featuresIn EUR m In EUR m 1Q15 1Q14 4Q14 1Q15 vs.
1Q141Q15 vs.
4Q14Revenues 2,471 2,452 2,390 1% 3%Prov. for credit losses
(135) (140) (187) (4)% (28)%
Noninterest exp. (1,801) (1,836) (2,190) (2)% (18)%IBIT 536 475 13 13% n.m.CIR 73% 75% 92% (2) ppt (19) pptPost-tax RoE 8.5% 8.6% 0.2% (0) ppt 8 ppt
CtA(107) (94) (98) (211) (84)
2014 2015
(1)
(2)
Charges from loan processing fees
475
382330
13
536
3238
330
1Q 2Q 3Q 4Q 1Q
Private & Business Clients
19
Note: Figures may not add up due to rounding differences(1) Based on average active equity(2) Includes CtA related to Postbank integration and other OpEx
measures
— One of the best quarters ever, driven by strong operating revenues and lower noninterest expenses
— Record revenues in credit products and in investment & insurance products since the financial crisis more than offset decline in deposit revenues which continue to suffer from low interest rate environment, 1Q2014 revenues benefitted from a one-off gain
— Provisions for credit losses remain close to record lows— Noninterest expenses decline y-o-y driven by improved cost
discipline and lower CtA

financial transparency. 1Q2015 results 26 April 2015
Deutsche BankInvestor Relations
20152014
Private & Commercial Banking Postbank (DB View) Advisory BankingInternational
20152014 20152014
Cost-to-Achieve(1)
Loan processing fees
199
9439
(96)
121
48
70
70
97
6218
21 211
1Q 2Q 3Q 4Q 1Q
169 139 128
(66)
207
1917 18
100
1714 17
119
1Q 2Q 3Q 4Q 1Q
107149 162 175 208
416 9 14
5
1Q 2Q 3Q 4Q 1Q
Income before income taxes, in EUR mPrivate & Business Clients: Profit by business unit
20
(1) Includes CtA related to Postbank integration and other OpEx measures, post-minorities(2) Contains the major core business activities of Postbank AG as well as BHW and norisbank
— IBIT growth y-o-y primarily due to strong growth of investment product revenues and a higher Hua Xia bank contribution
— IBIT down y-o-y largely due to one-off gain in 1Q2014 with strong performance in investment and mortgage products compensating lower product revenues from deposits
— IBIT increase y-o-y driven by strong credit product performance more than offsetting revenue declines in postal services and deposits
(2)

financial transparency. 1Q2015 results 26 April 2015
Deutsche BankInvestor Relations
Income before income taxes Key featuresIn EUR m In EUR m 1Q15 1Q14 4Q14 1Q15 vs.
1Q141Q15 vs.
4Q14Revenues 1,133 1,018 1,039 11% 9%Prov. for credit losses (15) (24) (42) (39)% (65)%
Noninterest exp. (709) (638) (749) 11% (5)%IBIT 409 357 249 15 % 65%CIR 63% 63% 72% (0)ppt (9) pptPost-tax RoE 14.8% 17.4% 9.6% (3) ppt 5 ppt
CtA(19) (32) (23) (23) (12)
2014 2015
(1)
357
221
329
249
409
1Q 2Q 3Q 4Q 1Q
Global Transaction Banking
21
— Solid performance with highest quarterly revenues ever in an ongoing difficult market environment
— Strong y-o-y revenue growth especially in Asia and Americas supported by favorable FX movements
— Provision for credit losses at very low levels
— Increase in noninterest expenses predominantly due to FX movements, higher regulatory costs as well as higher revenue-related expenses
— Awarded as ‘Distinguished Provider of Transaction Banking Services in EUR and USD for three consecutive years’ (2), ‘No.1 Global Best Trade Finance provider’ (3), ‘Best Fund Administrator, Mutual funds for three consecutive years‘ (4)
Note: Figures may not add up due to rounding differences(1) Based on average active equity(2) FImetrix LLC, Distinguished Providers, Mar 2015(3) Euromoney Trade Finance Survey 2015, Jan 2015(4) MENA Fund Manager, Funds Services Awards, Feb 2015

financial transparency. 1Q2015 results 26 April 2015
Deutsche BankInvestor Relations
Income before income taxes Key featuresIn EUR m In EUR m 1Q15 1Q14 4Q14 1Q15 vs.
1Q141Q15 vs.
4Q14Revenues 1,379 1,065 1,240 29% 11%Prov. for credit losses (4) 1 0 n.m. n.m.
Noninterest exp. (1,084) (899) (878) 21% 23%IBIT 291 167 358 75% (19)%Invested assets 1,159 934 1,039 24% 12%Net new money 17 3 10 n.m. 71%Post-tax RoE 10.0% 7.0% 13.4% 3 ppt (3) ppt
CtA(56) (82) (65) (29) (38)
2014 2015
(2)
(1)
(1)
(3)
Impairment/recovery of goodwill and other intangible assets
167204
288 29183
358
1Q 2Q 3Q 4Q 1Q
Deutsche Asset and Wealth Management
22
Note: Figures may not add up due to rounding differences(1) In EUR bn(2) Based on average active equity(3) IBIT adjusted for impairment /recovery of goodwill and other intangible
assets
— Revenues ex Abbey Life gross-up increased 18% y-o-y on the back of strong Alternatives and Passive business as well as a solid performance in Wealth Management. This was despite an unfavorable impact to retirement products from the low interest environment and a write-down on HETA exposure of EUR 110 m, partially offset by alternative products
— Non-interest expenses, excluding CtA, litigation, and policyholder benefits and claims, were up 15% y-o-y on the back of revenue-driven cost increases, higher regulatory spend and strategic hiring
— Net new asset inflows continued for the fifth consecutive quarter amounting to EUR 17 bn with a particularly strong contribution from Passive products. Invested assets totaled EUR 1.2 tr, up 24% y-o-y

financial transparency. 1Q2015 results 26 April 2015
Deutsche BankInvestor Relations
Income before income taxes Key featuresIn EUR m In EUR m 1Q15 1Q14 4Q14 1Q15 vs.
1Q141Q15 vs.
4Q14Revenues 336 63 153 n.m. 120 %Prov. for credit losses (28) (67) (131) (59)% (79)%
Noninterest exp. (690) (538) (736) 28 % (6)%IBIT (381) (541) (712) (30)% (46)%Post-tax RoE (11.7)% (18.3)% (22.7)% 7 ppt 11 pptRWA 46 58 59 (20)% (21)%Total assets IFRS 39 51 39 (24)% (0)%
20152014
(2)(3)
(1)
(2)
(541) (587)
(1,058)
(712)
(381)
1Q 2Q 3Q 4Q 1Q
Non-Core Operations Unit
23
Note: Figures may not add up due to rounding differences(1) Based on average active equity(2) Fully loaded, in EUR bn
— Revenues include de-risking gains of EUR 98 m and a litigation recovery of EUR 219 m
— Noninterest expenses higher due to timing of litigation offset by impact from asset sales
— RWA decrease includes EUR 15 bn from update to Operational Risk model, with corresponding increases in core businesses
— Reduction in IFRS assets from de-risking offset by sizable FX moves

financial transparency. 1Q2015 results 26 April 2015
Deutsche BankInvestor Relations
Income before income taxes Key featuresIn EUR m In EUR m 1Q15 1Q14 4Q14 1Q15 vs.
1Q141Q15 vs.
4Q14IBIT (18) (216) 21 (91)% n.m.thereof
V&T differences 324 (134) (29) n.m. n.m.FVA 1 (95) 18 n.m. (93)%Bank levies (426) 1 1 n.m. n.m.Remaining 82 11 31 n.m. 166 %
2014 2015
(1)
Note: Figures may not add up due to rounding differences(1) Valuation and Timing (V&T): reflects the effects from different
accounting methods used for management reporting and IFRS
(216)
(128)
5621
(18)
1Q 2Q 3Q 4Q 1Q
Consolidation & Adjustments
24
— Lower losses in C&A compared to 1Q2014 mainly due to:
— Positive effects in 1Q15 from V&T differences mainly due to a widening of the basis spread between EUR/USD and a widening of DB’s own structured credit spread
— Negative impact of Bank Levies reflecting accrual of European Bank Levy. This charge is reflected in C&A and will be allocated out to the businesses over the course of the year reducing the impact in C&A to zero

financial transparency. 1Q2015 results 26 April 2015
Deutsche BankInvestor Relations
25
(1) 10% CET1-ratio/ 3.5% leverage-ratio in 1Q2015
Methodology changes: Overview and Divisional impact
Key changes IBIT: Divisional impact
In EUR m 1Q14 1Q15
CB&S (52) (129)
PBC (44) (37)
GTB (11) (21)
AWM (3) (5)
NCOU (10) (15)
C&A clear out
C&A clearout
Reallocation of certain P&L items previously shown in C&A to the Divisions, basically via RWA and balance sheet size as allocation keysNo impact on Group financials; Divisional Financials restated back to FY 2013Items subject to clear-out are bank levy and certain funding related effects – better reflects “costs of doing business” and therefore leading to enhanced performance transparency
AAE Allocation
Previously, capital allocation to Divisions reflected CET1 ratio requirements only (derived from 10% CET1-ratio)Under the new methodology, capital is allocated up to the external Group targets for CET1 ratio and leverage ratio(1), i.e. “higher-of” both demandsAllocation method: First, goodwill and intangibles, then basically pro-rata RWA to meet CET1-ratio requirements, and then pro-rata leverage exposure to meet incremental leverage ratio demands1Q14 allocated AAE is not affected by the new methodology as the CET1-ratio was below 10%1Q15 allocated AAE is appr. EUR 5bn higher under new methodology compared to old regime

Deutsche Bank
Appendix

financial transparency. 1Q2015 results 26 April 2015
Deutsche BankInvestor Relations
Appendix: Table of Contents
27
28IBIT detail
30NCOU Details
33CRD4 – Leverage Exposure and risk weighted assets
34Loan book
36Impaired loans
37Value-at-Risk
Funding
Number of shares38
39Invested assets
Group headcount40
43
financial transparency. 1Q2015 results 26 April 2015
Deutsche BankInvestor Relations
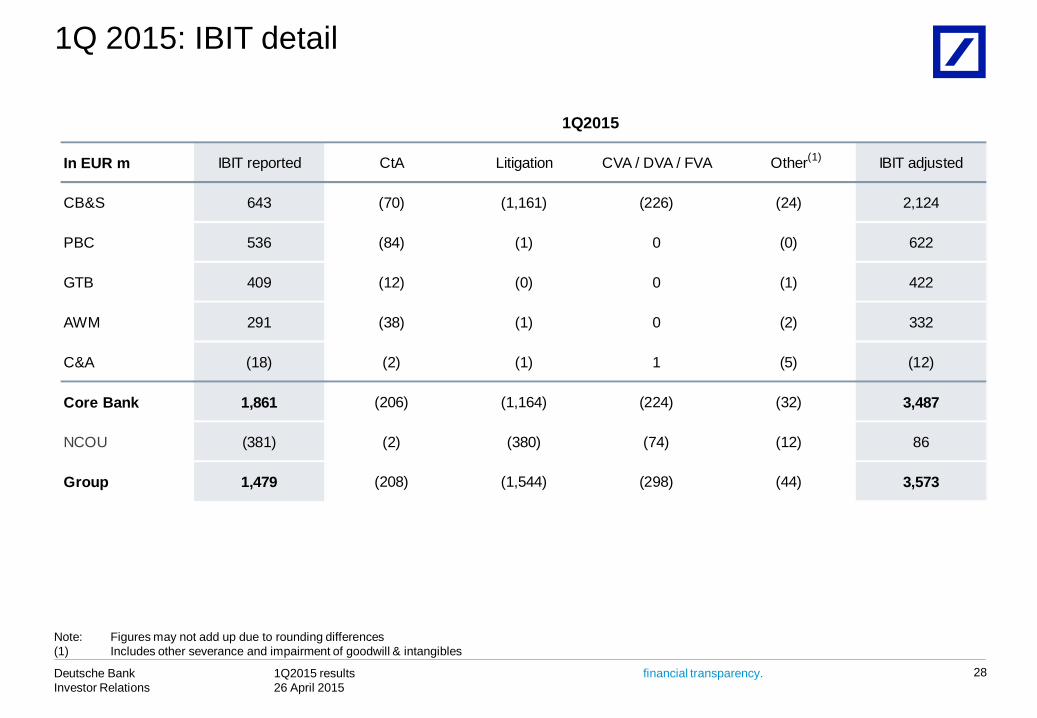
In EUR m IBIT reported CtA Litigation CVA / DVA / FVA Other IBIT adjusted
CB&S 643 (70) (1,161) (226) (24) 2,124
PBC 536 (84) (1) 0 (0) 622
GTB 409 (12) (0) 0 (1) 422
AWM 291 (38) (1) 0 (2) 332
C&A (18) (2) (1) 1 (5) (12)
Core Bank 1,861 (206) (1,164) (224) (32) 3,487
NCOU (381) (2) (380) (74) (12) 86
Group 1,479 (208) (1,544) (298) (44) 3,573
1Q2015
(1)
1Q 2015: IBIT detail
28
Note: Figures may not add up due to rounding differences(1) Includes other severance and impairment of goodwill & intangibles

financial transparency. 1Q2015 results 26 April 2015
Deutsche BankInvestor Relations
In EUR m IBIT reported CtA Litigation CVA / DVA / FVA Other IBIT adjusted
CB&S 1,439 (111) 18 3 (12) 1,540
PBC 475 (107) (0) 0 (4) 586
GTB 357 (19) 2 0 (1) 375
AWM 167 (56) (13) 0 (4) 239
C&A (216) (5) (1) (95) (7) (109)
Core Bank 2,221 (297) 6 (91) (27) 2,630
NCOU (541) (13) (6) (9) (0) (513)
Group 1,680 (310) (0) (101) (27) 2,118
1Q2014
(1)
1Q 2014: IBIT detail
29
Note: Figures may not add up due to rounding differences(1) Includes other severance and impairment of goodwill & intangibles

financial transparency. 1Q2015 results 26 April 2015
Deutsche BankInvestor Relations
NCOU IBIT components IBIT in EUR m, Assets and RWA data as of 31 Mar 2015
NCOU (3,467) (2,899)
FY2013 FY2014 Comments/Outlook
Asset Driven
(RWA 46bn, IFRS Assets 39 bn)
Portfolio RevenuesDe-risking IBITMtM/OtherLLPs(1)
CostsTotalof which: Non-Financial Portfolio
— Net IBIT impact to decrease with lower LLP’s / MtM volatility
— Timing and size of potential impact difficult to assess
— Impact expected to reduce albeit not linked to asset profile
30
(381)
1Q2015
163111166(41)
(166)234
5
(380)
(130)(91)(14)
(235)Allocations & Other
Items
1,592454
(785)(812)
(1,481)(1,032)
(498)
1,107181
(901)(309)
(1,162)(1,083)
(596)
Allocated Costs Postbank LiabilitiesOtherTotal
Litigation
(671)(409)(59)
(1,140)
(1,296)
(572)(413)(37)
(1,021)
(796)
Component
Reported IBIT
Note: Figures may not add up due to rounding differences(1) De-risking impact is reported in the de-risking IBIT line above
— Reflects asset sales

financial transparency. 1Q2015 results 26 April 2015
Deutsche BankInvestor Relations
Since June 2012
1Q2015 Update
Outlook
64
~140
Size of Non-Core Operations Unit
59
142
46
IFRS assets, in EUR bn
Jun 2012 Mar 2015Dec 2013
RWA fully loaded CRD4, in EUR bn
Jun 2012 Mar 2015Dec 2013
NCOU: De-risking Milestones
31
3939
Dec 2014
59
Dec 2014
Note: Figures may not add up due to rounding differences(1) CRD4 fully loaded CET1 ratio on a post-tax basis (excluding litigation related expenses)(2) Pro-forma CRD4 fully loaded
~(72)%
(67)%
— RWA reduction includes EUR 15 bn following update to Operational Risk model
— Maher Prince Rupert sale agreed, expected to close during 2H15
— Derisking from IAS39 (US Muni) portfolio and further SCG wind down
— Regulatory capital generation of EUR 6.2 bn has contributed a CET1 ratio benefit(1) of ~146 bps
— IFRS Assets reduced by EUR ~100 bn since June 2012
— Pace of asset reduction from disposals to slow down, in line with previous guidance
— RWA volatility expected from model driven effects primarily in market and operational risk
— IBIT will be driven by litigation, cost allocations and the negative impact of Postbank liabilities (2) (2)

financial transparency. 1Q2015 results 26 April 2015
Deutsche BankInvestor Relations
NCOU: Asset Composition
32
In EUR bn, as of 31 March 2015
CB&S PBC CI AWM
7.3
1.6
4.5
0.5
8.42.0
4.9
2.5
5.80.9 0.4
AWM
CI
PBC: Postbanknon-core
PBC: Other (1)
IAS 39 reclassified assets
Other trading positions (3)
Monolines
Other loans (2)
Other (4)
Credit Trading –Correlation Book
SCG
EUR 39 bn
Total IFRS assets In EUR bn, as of 31 December 2014
7.4
1.5
4.1
0.7
7.52.4
4.9
2.6
5.60.7 1.2
AWM
CI
PBC: Postbanknon-core
PBC: Other (1)
EUR 39 bn
IAS 39 reclassified assets
Other trading positions (3)
Monolines
Other loans (2)
Other (4)
Credit Trading –Correlation Book
SCG
Total IFRS assets
(1) PBC Other: Includes Advisory Banking International in Italy/Spain(2) Other loans: Cash loans net of LLPs (not IAS39)(3) Other trading positions: Mainly legacy derivative exposures; includes traded loans (4) Other : Includes cash & deposits, equity method positions, consolidated properties and financial assets
financial transparency. 1Q2015 results 26 April 2015
Deutsche BankInvestor Relations
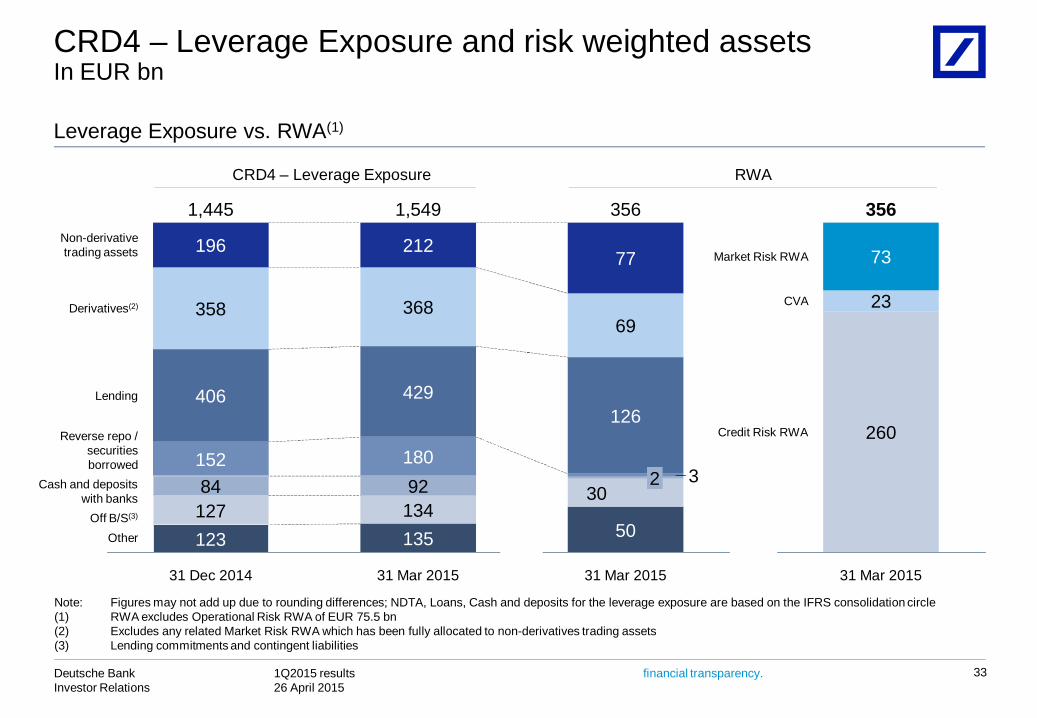
CRD4 – Leverage Exposure and risk weighted assetsIn EUR bn
Leverage Exposure vs. RWA(1)
250
6464
Note: Figures may not add up due to rounding differences; NDTA, Loans, Cash and deposits for the leverage exposure are based on the IFRS consolidation circle(1) RWA excludes Operational Risk RWA of EUR 75.5 bn(2) Excludes any related Market Risk RWA which has been fully allocated to non-derivatives trading assets(3) Lending commitments and contingent liabilities
33
Credit Risk RWA
CVA
Market Risk RWA
31 Mar 2015
356
260
23
73
OtherOff B/S(3)
Cash and depositswith banks
Reverse repo /securitiesborrowed
Derivatives(2)
Lending
Non-derivativetrading assets
31 Mar 2015
356
50
302 3
126
69
77
31 Mar 2015
1,549
13513492180
429
368
212
31 Dec 2014
1,445
12312784152
406
358
196
CRD4 – Leverage Exposure RWA
financial transparency. 1Q2015 results 26 April 2015
Deutsche BankInvestor Relations
34
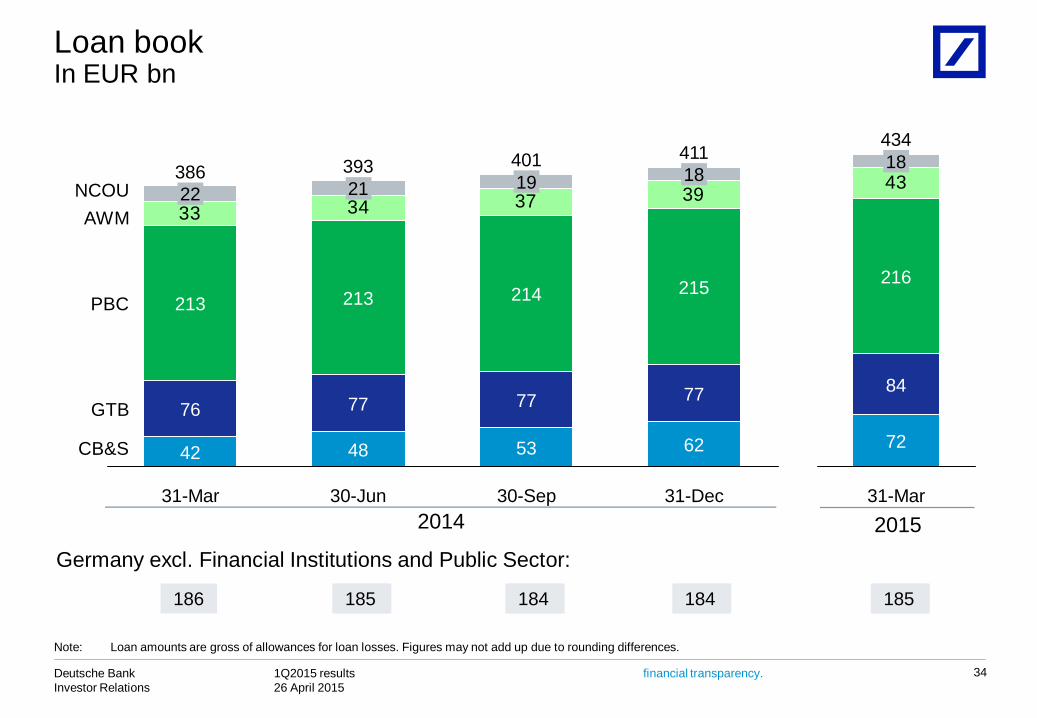
Loan bookIn EUR bn
Germany excl. Financial Institutions and Public Sector:
2014 2015
Note: Loan amounts are gross of allowances for loan losses. Figures may not add up due to rounding differences.
186
33 34 37 39
CB&S
GTB
PBC
AWMNCOU
31-Dec
411
62
77
215
18
30-Sep
401
53
77
214
19
30-Jun
393
48
77
213
21
31-Mar
386
42
76
213
22 43
31-Mar
434
72
84
216
18
185 184 184 184185 184 184 185

financial transparency. 1Q2015 results 26 April 2015
Deutsche BankInvestor Relations
Composition of loan book and provisions by category In EUR m, as of 31 Mar 2015
35
Note: Loan amounts are gross of allowances for loan losses. Figures may not add up due to rounding differences.
Composition of loan book and provisions by category
1Q2015
In EUR m Core BankNon-Core
Operations Unit TotalProvision for credit losses Further details
PBC Mortgages 152,222 6,551 158,772 low loan to valueInvestment-Grade/Postbank non-retail 30,348 520 30,868 mostly German domiciled; partially hedgedGTB 83,883 0 83,883 highly diversified; mostly short-termDeutsche AWM 43,472 748 44,219 mostly collateralized; liquid collateralPBC small corporates/others 18,236 163 18,398 substantial collateralOther 241 31 273
Sub-Total lower risk bucket 328,371 8,043 336,415 111
Asset Finance (DB sponsored conduits) 15,184 2,814 17,998 strong underlying asset qualityPBC consumer finance 19,825 339 20,164 high margin businessCollateralized/hedged structured transactions 21,120 3,117 24,236 substantial collateral/hedging
Sub-total moderate risk bucket 56,129 6,269 62,399 106
Leveraged Finance 6,239 241 6,480 partially hedged; mostly senior securedCommercial Real Estate 17,759 718 18,477 predominantly mortgage secured;
diversified by asset type and locationOther 7,465 2,628 10,092
Sub-total higher risk bucket 31,463 3,586 35,049 1
Total loan book 415,964 17,899 433,862 218 Includes Other non-CB&S, Government collateralized / structured transactions and Corporate Investments.
Mar 31, 2015
1)
1)

financial transparency. 1Q2015 results 26 April 2015
Deutsche BankInvestor Relations
Impaired loans(1)
Period-end, in EUR bn
36
51% 52% 54% 56% 57%
-50
-40
-30
-20
-10
0CoverageRatio(3)
2014 2015
Note: Figures may not add up due to rounding differences(1) IFRS impaired loans include loans which are individually impaired under IFRS, i.e. for which a specific loan loss allowance has been established, as well as loans
collectively assessed for impairment which have been put on nonaccrual status(2) Total on-balance sheet allowances divided by IFRS impaired loans (excluding collateral); total on-balance sheet allowances include allowances for all loans
individually impaired or collectively assessed(3) Impaired loans in % of total loan book
6.9 6.8 6.7 6.5 6.7
3.3 3.3 2.9 2.8 2.7
10.3 10.0 9.5 9.3 9.4
-
2.0
4.0
6.0
8.0
10.0
12.0
1Q 2Q 3Q 4Q 1Q0.10%0.60%1.10%1.60%2.10%2.60%3.10%
Core Bank Non-Core Operations Unit Impaired loan ratio Deutsche Bank Group(3) Impaired loan ratio Core Bank(3)(2)(3)
financial transparency. 1Q2015 results 26 April 2015
Deutsche BankInvestor Relations
37
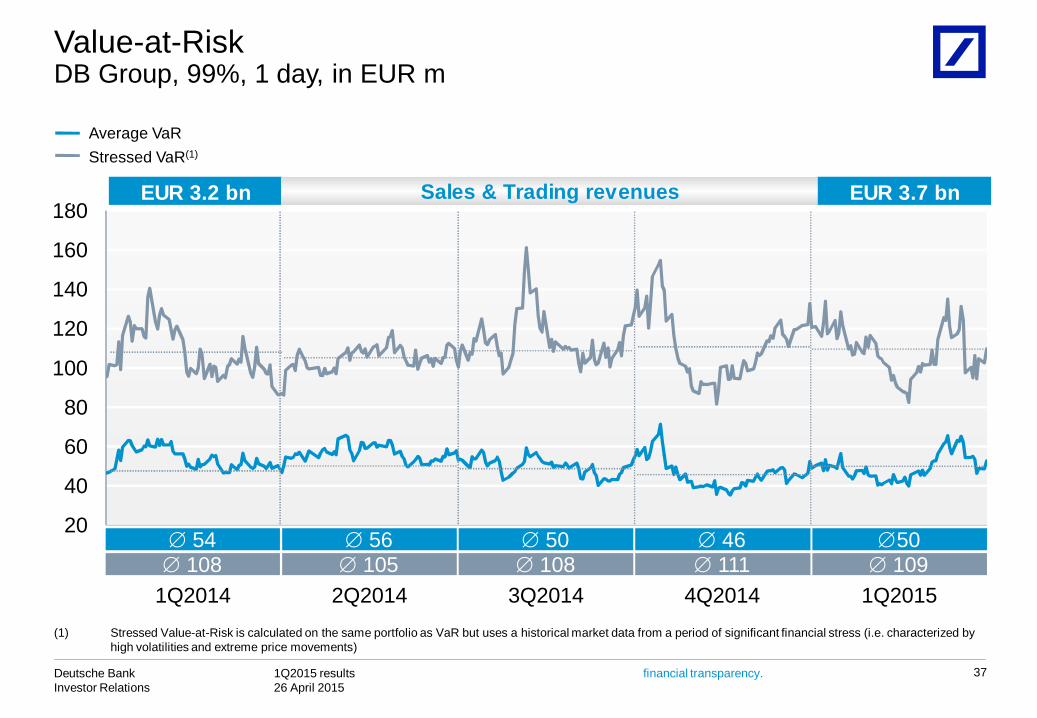
Value-at-RiskDB Group, 99%, 1 day, in EUR m
20
40
60
80
100
120
140
160
180
Average VaRStressed VaR(1)
1Q2014 1Q2015
54 56108 105
50109
2Q2014
50108
3Q2014 4Q2014
46111
(1) Stressed Value-at-Risk is calculated on the same portfolio as VaR but uses a historical market data from a period of significant financial stress (i.e. characterized by high volatilities and extreme price movements)
EUR 3.2 bn EUR 3.7 bnSales & Trading revenues

financial transparency. 1Q2015 results 26 April 2015
Deutsche BankInvestor Relations
7
3 3
9
16
11
8
17
2Q2013 3Q2013 4Q2013 1Q2014 2Q2014 3Q2014 4Q2014 1Q20150
20
40
60
80
100
120
140
160
180
200
38
Funding activities and profile
— Funding plan of EUR 30-35bn for 2015— As of 31-Mar-2015 y-t-d issuance of EUR 17 bn at average spread
of L+49 bps (ca. 30 bps inside interpolated CDS) and average tenor of 5.7 years
— EUR 8bn by public benchmark issuances / EUR 9 bn raised via retail networks and other private placements
Funding cost and volume development
DB issuance spread, 4 week moving average, in bps (1)Issuance, in EUR bn
Funding profile well diversifiedAs of 31 March 2015
Capital Markets and Equity, 23%
Retail (excl. AWM), 24%
Transaction Banking, 21%
Other Customers,
8%
Unsecured Wholesale,
6%
Secured Funding and Shorts, 10%
Financing Vehicles, 1%
75% from most stable funding sources
Total: EUR 996 bn— Total external funding increased by EUR 77 bn to EUR 996 bn— 75% of total funding from most stable sources— Liquidity Reserves EUR 203 bn, up EUR 19 bn from December
2014
(1) Over relevant floating index; AT1 instruments excluded from spread calculation
AWM, 7%
financial transparency. 1Q2015 results 26 April 2015
Deutsche BankInvestor Relations
FY2013 FY2014 1Q2015 31 Dec 2013
31 Dec 2014
31 Mar 2015
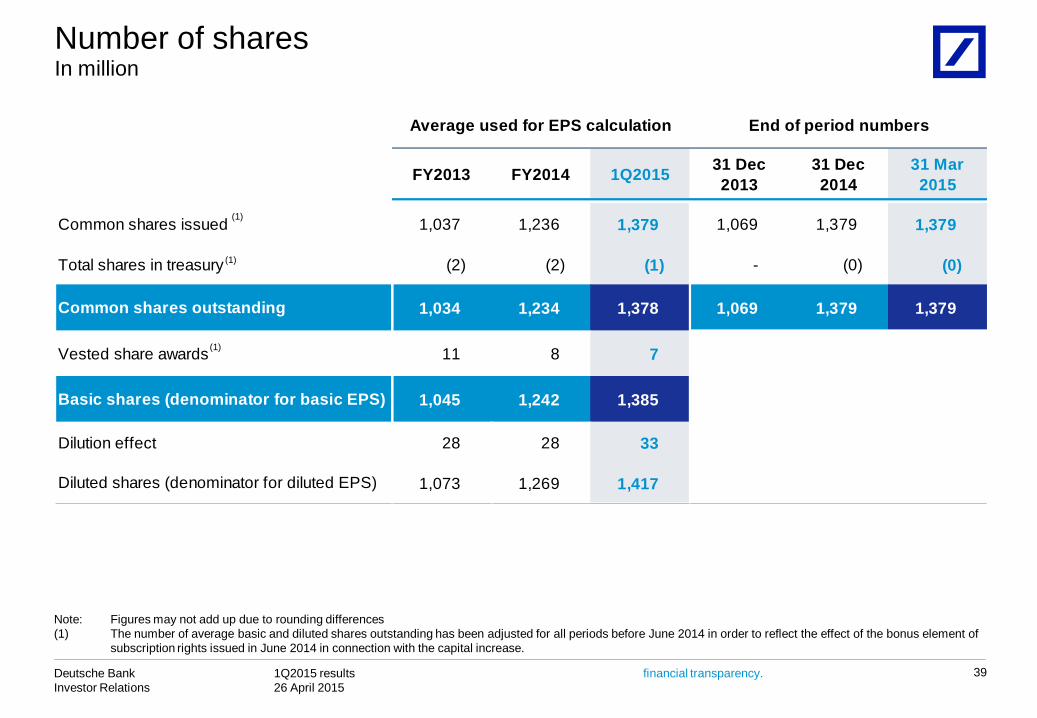
Common shares issued 1,037 1,236 1,379 1,069 1,379 1,379
Total shares in treasury (2) (2) (1) - (0) (0)
1,034 1,234 1,378 1,069 1,379 1,379
Vested share awards 11 8 7
1,045 1,242 1,385
Dilution effect 28 28 33
1,073 1,269 1,417Diluted shares (denominator for diluted EPS)
Basic shares (denominator for basic EPS)
Average used for EPS calculation End of period numbers
Common shares outstanding
(1)
(1)
(1)
In millionNumber of shares
39
Note: Figures may not add up due to rounding differences(1) The number of average basic and diluted shares outstanding has been adjusted for all periods before June 2014 in order to reflect the effect of the bonus element of
subscription rights issued in June 2014 in connection with the capital increase.

financial transparency. 1Q2015 results 26 April 2015
Deutsche BankInvestor Relations
Client view invested assets – Deutsche AWMIn EUR bn
40
Note: Figures may not add up due to rounding differences
Client view net new money – Deutsche AWMIn EUR bn
31 Dec 2013 31 Mar 2014 30 Jun 2014 30 Sep 2014 31 Dec 2014 31 Mar 201531 Mar 2015
vs 31 Dec 2014
Retail 239 244 255 267 272 309 37Institutional 404 403 406 432 449 495 46Private Client 279 287 294 307 317 354 37AWM 923 934 955 1,006 1,039 1,159 120
FY2013 1Q2014 2Q2014 3Q2014 4Q2014 FY2014 1Q2015Retail (3) 5 4 7 2 17 8Institutional (24) (4) 2 5 6 9 7Private Client 14 3 5 5 1 14 2AWM (13) 3 11 17 10 40 17

financial transparency. 1Q2015 results 26 April 2015
Deutsche BankInvestor Relations
In EUR bnRegional invested assets – Deutsche AWM
41
Note: Figures may not add up due to rounding differences
In EUR bnRegional net new money – Deutsche AWM
31 Dec 2013 31 Mar 2014 30 Jun 2014 30 Sep 2014 31 Dec 2014 31 Mar 201531 Mar 2015
vs 31 Dec 2014
Americas 270 265 262 282 297 338 41Asia-Pacific 67 70 75 85 86 97 11EMEA (ex Germany) 245 250 262 272 280 315 35Germany 341 349 355 366 376 409 33AWM 923 934 955 1,006 1,039 1,159 120
FY2013 1Q2014 2Q2014 3Q2014 4Q2014 FY2014 1Q2015Americas (15) (1) 0 1 3 3 1Asia-Pacific 7 2 3 5 (0) 11 0EMEA (ex Germany) (2) 4 8 7 5 23 10Germany (2) (2) (1) 4 2 4 6AWM (13) 3 11 17 10 40 17

financial transparency. 1Q2015 results 26 April 2015
Deutsche BankInvestor Relations
31 Dec 2013 31 Mar 2014 30 Jun 2014 30 Sep 2014 31 Dec 2014 31 Mar 201531 Mar 2015
vs.31 Dec 2014
Private & Business Clients 282 284 286 289 291 303 13Investment & Insurance Products 146 149 153 154 156 167 13Deposits excl. Sight Deposits 136 135 133 135 136 135 0
0Memo: Sight Deposits 84 83 86 88 92 94 5
In EUR bnInvested assets – PBC
42
Note: Figures may not add up due to rounding differences
financial transparency. 1Q2015 results 26 April 2015
Deutsche BankInvestor Relations
31 Dec 2013 31 Mar 2014 30 Jun 2014 30 Sep 2014 31 Dec 2014 31 Mar 201531 Mar 2015
vs.31 Dec 2014
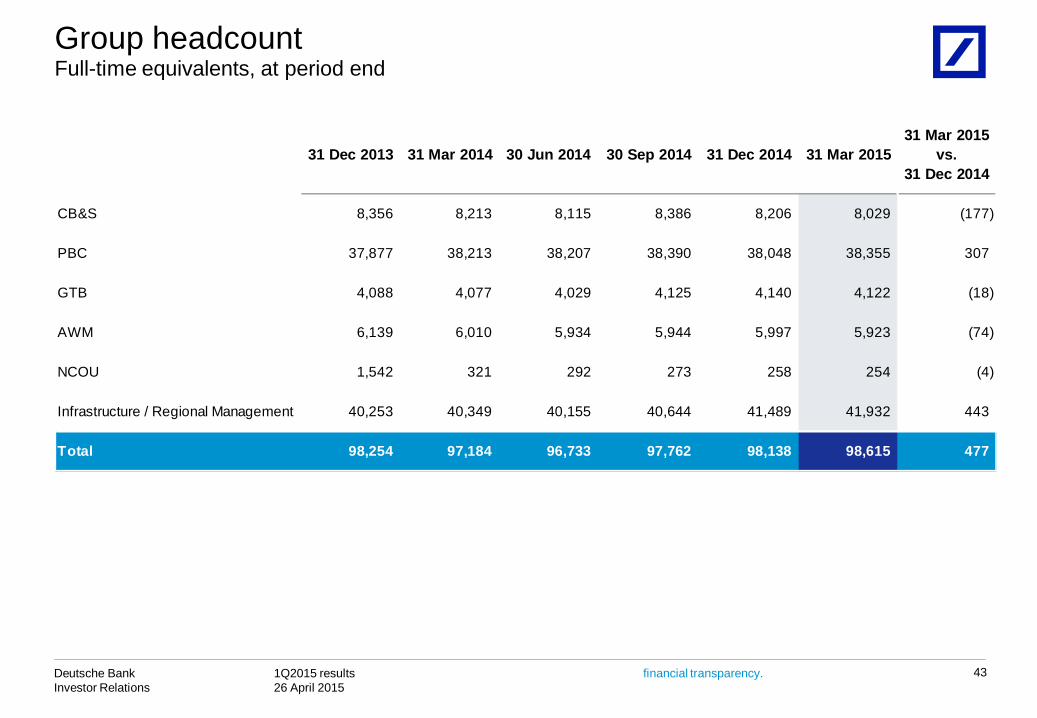
CB&S 8,356 8,213 8,115 8,386 8,206 8,029 (177)
PBC 37,877 38,213 38,207 38,390 38,048 38,355 307
GTB 4,088 4,077 4,029 4,125 4,140 4,122 (18)
AWM 6,139 6,010 5,934 5,944 5,997 5,923 (74)
NCOU 1,542 321 292 273 258 254 (4)
Infrastructure / Regional Management 40,253 40,349 40,155 40,644 41,489 41,932 443
Total 98,254 97,184 96,733 97,762 98,138 98,615 477
Full-time equivalents, at period endGroup headcount
43

financial transparency. 1Q2015 results 26 April 2015
Deutsche BankInvestor Relations
This presentation contains forward-looking statements. Forward-looking statements are statements that are not historicalfacts; they include statements about our beliefs and expectations and the assumptions underlying them. Thesestatements are based on plans, estimates and projections as they are currently available to the management of DeutscheBank. Forward-looking statements therefore speak only as of the date they are made, and we undertake no obligation toupdate publicly any of them in light of new information or future events.
By their very nature, forward-looking statements involve risks and uncertainties. A number of important factors couldtherefore cause actual results to differ materially from those contained in any forward-looking statement. Such factorsinclude the conditions in the financial markets in Germany, in Europe, in the United States and elsewhere from which wederive a substantial portion of our revenues and in which we hold a substantial portion of our assets, the development ofasset prices and market volatility, potential defaults of borrowers or trading counterparties, the implementation of ourstrategic initiatives, the reliability of our risk management policies, procedures and methods, and other risks referenced inour filings with the U.S. Securities and Exchange Commission. Such factors are described in detail in our SEC Form20-F of 20 March 2015 under the heading “Risk Factors.” Copies of this document are readily available upon request orcan be downloaded from www.db.com/ir.
This presentation also contains non-IFRS financial measures. For a reconciliation to directly comparable figures reportedunder IFRS, to the extent such reconciliation is not provided in this presentation, refer to the 1Q2015 Financial DataSupplement, which is accompanying this presentation and available at www.db.com/ir.
44
Cautionary statements