Deuterium Isotope Effects on Hydrophobic Interactions. The … · 2003-07-27 · 3 Abstract:...
41
1 Deuterium Isotope Effects on Hydrophobic Interactions. The Importance of Dispersion Interactions in the Hydrophobic Phase Maciej Turowski, †,‡ Naoki Yamakawa, † Jaroslaw Meller, § Kazuhiro Kimata, † Tohru Ikegami, † Ken Hosoya, † Nobuo Tanaka, *,† and Edward R. Thornton *,^ Contribution from the Department of Polymer Science and Engineering, Kyoto Institute of Technology, Matsugasaki, Sakyo-ku, Kyoto 606-8585, Japan, and the Department of Chemistry, University of Pennsylvania, Philadelphia 19104-6323 Received E-mail: [email protected]; [email protected] TITLE RUNNING HEAD: Isotope Effects on Hydrophobic Interactions * Corresponding Author: Edward R. Thornton, Department of Chemistry, University of Pennsylvania, Philadelphia 19104-6323 USA. † Kyoto Institute of Technology. ‡ On leave from the Department of Biopharmaceutics and Pharmacodynamics, Medical University of Gdansk, ul. Gen. J. Hallera 107, PL80-416 Gdansk, Poland. Present address: The Dow Chemical Company, Analytical Sciences, Midland, MI 48667, USA, E-mail: [email protected]. § Department of Synthetic and Biological Chemistry, Kyoto University, Kyoto, Japan. Present address: Children’s Hospital Research Foundation, Pediatric Informatics, Cincinnati, OH 45229, USA, E-mail: [email protected].
Transcript of Deuterium Isotope Effects on Hydrophobic Interactions. The … · 2003-07-27 · 3 Abstract:...
1
Deuterium Isotope Effects on Hydrophobic Interactions.
The Importance of Dispersion Interactions in the
Hydrophobic Phase
Maciej Turowski,†,‡ Naoki Yamakawa,† Jaroslaw Meller,§ Kazuhiro Kimata,† Tohru Ikegami,† Ken
Hosoya,† Nobuo Tanaka,*,† and Edward R. Thornton*,^
Contribution from the Department of Polymer Science and Engineering, Kyoto Institute of Technology,
Matsugasaki, Sakyo-ku, Kyoto 606-8585, Japan, and the Department of Chemistry, University of
Pennsylvania, Philadelphia 19104-6323
Received
E-mail: [email protected]; [email protected]
TITLE RUNNING HEAD: Isotope Effects on Hydrophobic Interactions
* Corresponding Author: Edward R. Thornton, Department of Chemistry, University of Pennsylvania,
Philadelphia 19104-6323 USA.
† Kyoto Institute of Technology.
‡ On leave from the Department of Biopharmaceutics and Pharmacodynamics, Medical University of
Gdansk, ul. Gen. J. Hallera 107, PL80-416 Gdansk, Poland. Present address: The Dow Chemical
Company, Analytical Sciences, Midland, MI 48667, USA, E-mail: [email protected].
§ Department of Synthetic and Biological Chemistry, Kyoto University, Kyoto, Japan. Present address:
Children’s Hospital Research Foundation, Pediatric Informatics, Cincinnati, OH 45229, USA, E-mail:

2
^ University of Pennsylvania.
3
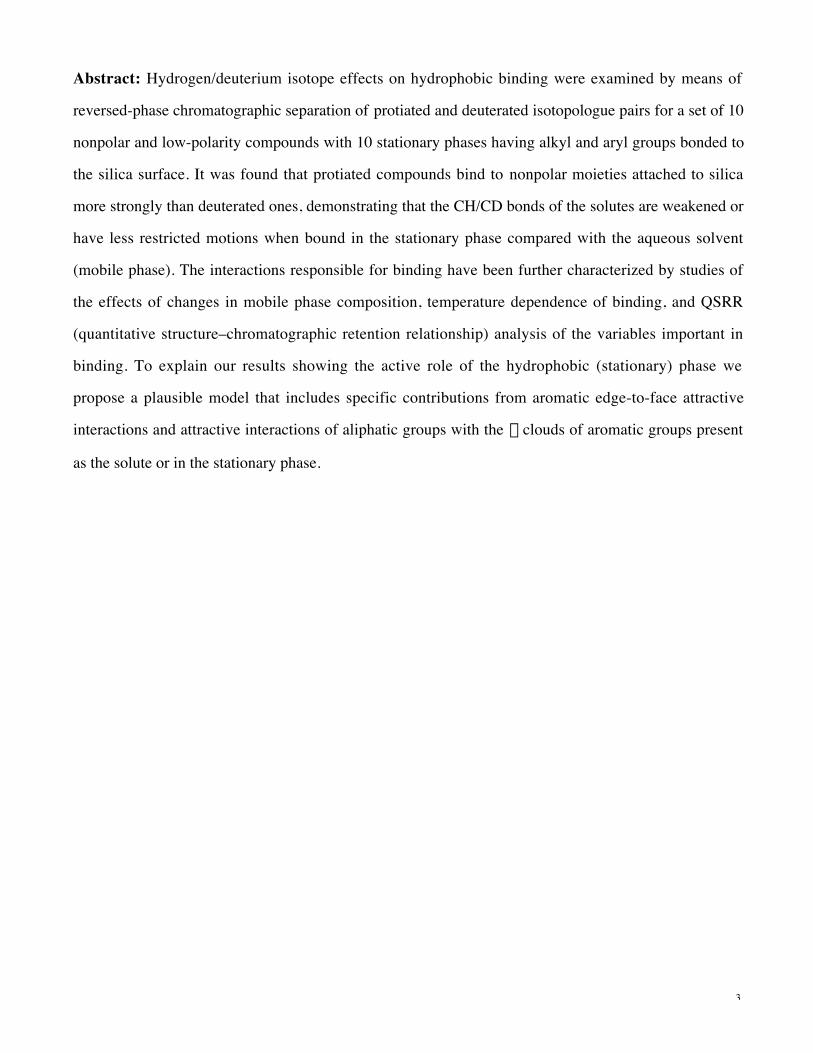
Abstract: Hydrogen/deuterium isotope effects on hydrophobic binding were examined by means of
reversed-phase chromatographic separation of protiated and deuterated isotopologue pairs for a set of 10
nonpolar and low-polarity compounds with 10 stationary phases having alkyl and aryl groups bonded to
the silica surface. It was found that protiated compounds bind to nonpolar moieties attached to silica
more strongly than deuterated ones, demonstrating that the CH/CD bonds of the solutes are weakened or
have less restricted motions when bound in the stationary phase compared with the aqueous solvent
(mobile phase). The interactions responsible for binding have been further characterized by studies of
the effects of changes in mobile phase composition, temperature dependence of binding, and QSRR
(quantitative structure–chromatographic retention relationship) analysis of the variables important in
binding. To explain our results showing the active role of the hydrophobic (stationary) phase we
propose a plausible model that includes specific contributions from aromatic edge-to-face attractive
interactions and attractive interactions of aliphatic groups with the p clouds of aromatic groups present
as the solute or in the stationary phase.
4
Introduction
Reversed-phase, high-performance liquid chromatography (RPLC) involves transfer of solute from a
polar, aqueous mobile phase to a nonpolar, hydrophobic stationary phase. Partitioning between mobile
and stationary phase has been shown to be the predominant retention mechanism, and thus RPLC
constitutes a useful model of hydrophobic effects that are of great importance in biology and chemistry.
The opportunity exists to capitalize on the very high precision of RPLC to measure isotope effects,
which constitute a unique probe of molecular interactions, upon transfer of hydrophobic molecules from
an aqueous to a nonpolar phase.
We have previously shown the utility of RPLC for highly precise isotope effect studies.1,2,3,4
Advances in understanding of hydrophobic effects in general and, simultaneously, of the RPLC
separation process should be accessible through further study of RPLC isotope effects over a wider
range of stationary phase structures, solute structures, and mobile phase compositions.
Hydrophobic interactions play a key role in determining the structure and function of lipid
membranes5 and proteins6 as well as the activity of the drugs and toxins.7,8 Several techniques for
evaluation of hydrophobic properties are available, including measurement of n-octanol/water partition
coefficients P for series of compounds.9 RPLC10,11 methods have provided an excellent method to give
reliable hydrophobicity measurements.12
H/D isotope effects are widely used to characterize chemical processes.13,14,15,16 RPLC separations of
protiated and deuterated pairs of compounds1,4 and separation of nitrogen and oxygen isotopes in acids
and bases2 have been reported. Tritium isotope effects in high-performance liquid chromatography
(HPLC) of eicosanoids and vitamin D metabolites have also been reported. 17,18 Recently, separation of
enantiomers based on isotopic chirality was described.3 A cellulose-based stationary phase was shown
to separate racemic phenyl(phenyl-d5)methanol, thus demonstrating that the chiral stationary phase
exhibits different interactions with the two enantiomers even though they differ only by the
stereochemical positioning of phenyl and phenyl-d5. These results show that liquid chromatography
techniques constitute highly convenient and sensitive tools for precise study of isotope effects.
In this work we have extensively examined secondary isotope effects in the retention process of
RPLC, as a means of investigating the nature of hydrophobic effects. In addition, both HPLC and mass
spectrometric (MS) methods such as isotope-coded affinity are used to compare protein profiles of
different cells, e.g., diseased vs. healthy.19,20 The ability to separate isotopes by HPLC suggests the
5
possibility of combining current LC-MS methods with isotope-coded differential liquid chromatography
to provide a new method for measurement of differential protein content.
The nature of isotope effects involves to a large extent vibrational frequencies.21 Within the
commonly accepted Born–Oppenheimer approximation, the electronic wavefunctions and the resulting
potential energy surfaces do not change upon isotopic substitution but the vibrational wavefunctions of
deuterium and protium are different because the vibrational states depend on the mass of the nuclei.
Ordinarily, structural changes in solute, solvent, or stationary phase will involve changes in potential
energies of interaction which are very difficult to estimate theoretically, so that interpretation of binding
effects is also very difficult. But since isotopic substitution does not affect potential energy, potential
energy effects cancel between isotopologues, and isotope effects involve only the effects of changes in
interactions upon nuclear motions, especially upon vibrational frequencies. Consequently, isotope
effects probe changes in molecular interactions without involving the difficulties of interpreting
potential energy changes. Isotope effects therefore provide a unique and readily interpreted experimental
means of investigating molecular interactions.
As a result of its larger mass, the amplitude of vibrations is smaller for deuterium, also resulting in
slightly lower average volumes and polarizabilities for bonds involving deuterium than for the
corresponding bonds involving protium.22 We use calculations of these effects to give additional
insights into the isotope effects we have observed.
Fundamental work has related hydrophobic effects to retention mechanisms in liquid
chromatography.23,24,25,26,27
Simulation techniques, such as the free energy perturbation method with commonly used Molecular
Dynamics force fields,28 are usually unable to reproduce the experimental numbers with satisfactory
accuracy for the purposes of analyzing HPLC retention processes. Because such difficulties are inherent
in accurately estimating small changes in interaction energies, we employ here Quantitative
Structure–Chromatographic Retention Relationships11 (QSRR) analysis, an extrathermodynamic linear
free-energy relationship (LFER), to aid in elucidating the nature of hydrophobic binding in RPLC.29
The stationary phases tend to resemble organic liquid phases but differ in that they possess significant
ordering resulting from the attachment of the hydrophobic chains to the silica particle core.25 These
stationary phases will bind the methanol component of the mobile phase to some extent, so the
properties we measure refer to methanol-saturated stationary phase. Almost all of the solutes we have
6
chosen for study must interact with the stationary phase almost entirely, if not exclusively, by
partitioning into the hydrophobic layer. Interaction with the silica particle core is believed to be minimal
and most probably negligible for several reasons. First, the stationary phases are prepared with a high
density of covalently attached organic chains that largely mask any residual, underivatized SiOH sites.
Second, the isotopically substituted solutes studied are mainly nonpolar hydrocarbons. Third, our data
show nearly identical values of the isotope effect per CH/CD bond for aliphatic alcohols as for aliphatic
hydrocarbons (though differing among different stationary phases), indicating that the hydrocarbon parts
of the chains are in closely similar environments regardless of the presence or absence of an attached
alcohol group. Finally, our QSRR analysis shows that binding to all of these stationary phases is
primarily if not entirely hydrophobic in nature. Thus the stationary phases we have studied have a
hydrophobic solute-binding mechanism.
Our isotope effect data do not of course provide information about the exact structure or ordering of
the stationary phases and the bound solutes, but our data do tell us about the nature and extent of
solute–stationary phase interactions.
Experimental Section
Equipment. The following analytical equipment was used for the chromatographic experiments: LC-
10AD pump at a flow rate 1 mL min–1 and SPD-10AV UV-VIS detector from Shimadzu
(http://www.shimadzu.com/) at l = 254 nm for the aromatic compounds; JASCO 830-RI refractive
index detector for aliphatic compounds (http://www.jasco.co.jp/). Constant column temperature was
maintained using a water bath. Chromatograms were collected and analyzed by a V-STATION
chromatography data system (http://www.gls.co.jp/) on a PC.
Materials and Methods. Deuterated compounds were available from Aldrich or CEA (Commisariat à
L’Energie Atomique, France). 1-Decan-d21-ol was prepared from decanoic-d19-acid, 1-pentan-d11-ol was
prepared from pentanoic-d9-acid and phenyl-d5-methyl alcohol was prepared from the benzoic-d5-acid.
All other chemicals were of analytical grade and were available from the common major suppliers.
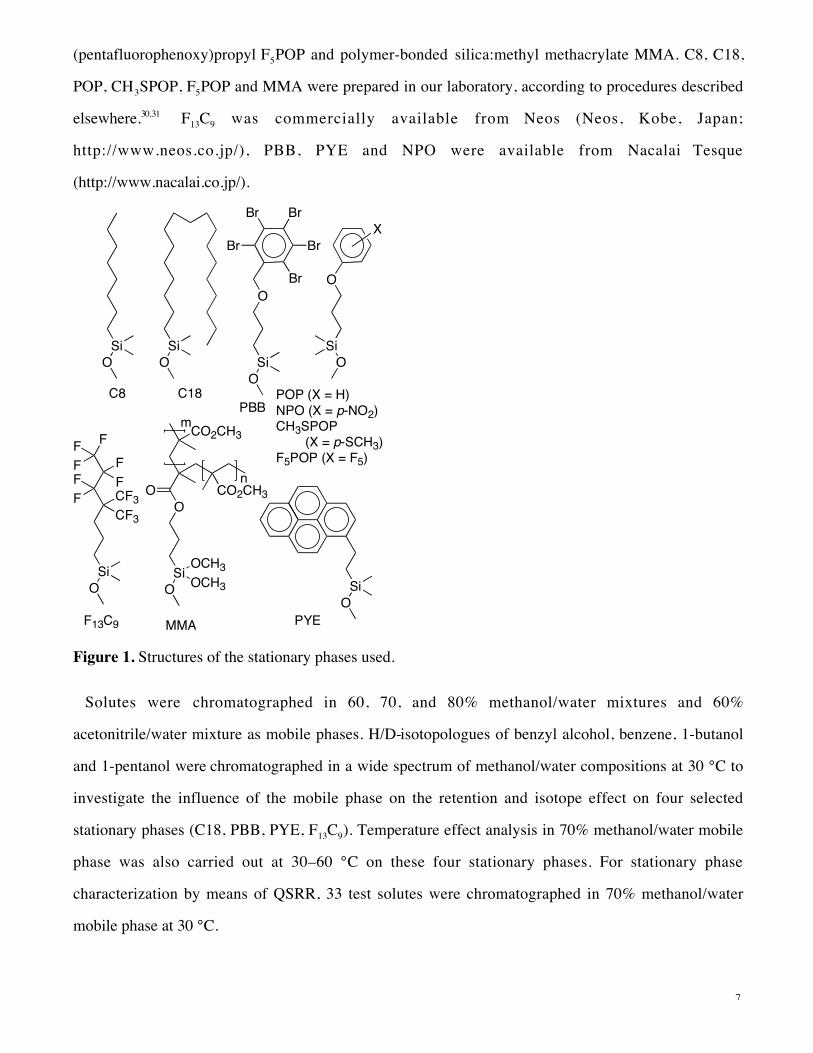
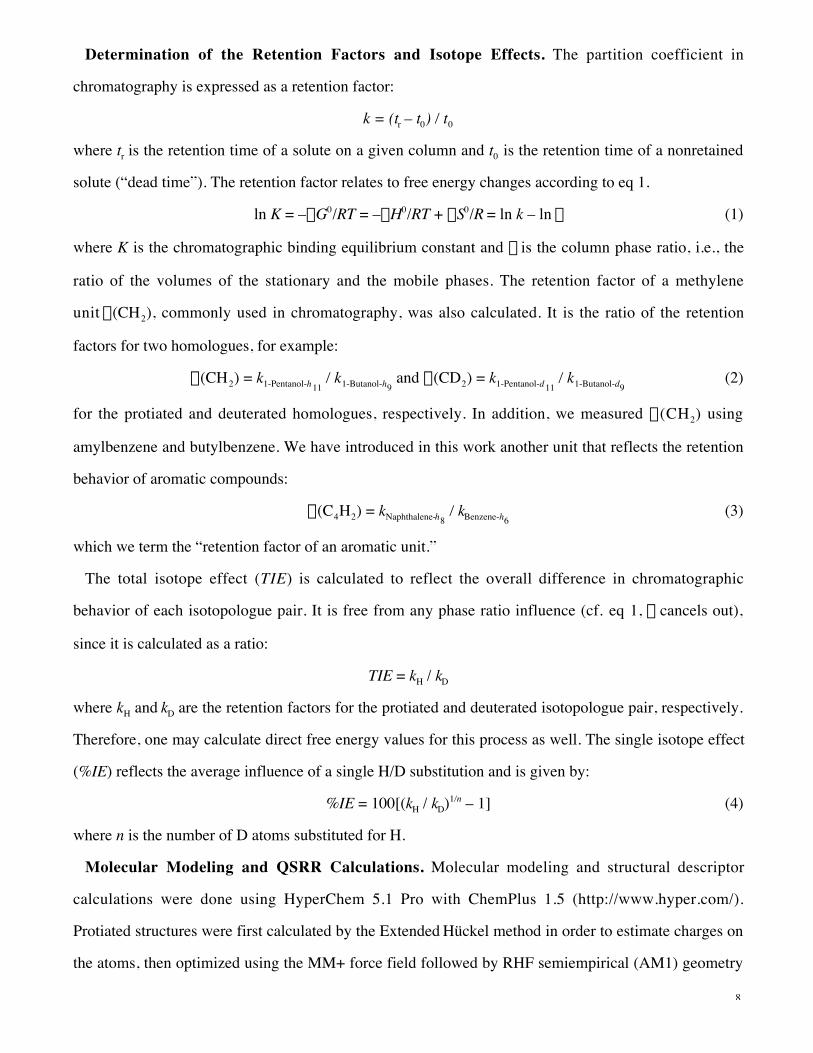
The structures of the stationary phases are presented in Figure 1. We employed a variety of structures
for the stationary phase materials, all based on silica bonded beads: aliphatic octyl C8 and octadecyl
C18, fluorinated 4,4-di(trifluoromethyl)-5,5,6,6,7,7,7-heptafluoroheptyl F13C9, highly dispersive 3-
(pentabromobenzyloxy)propyl PBB, highly aromatic 2-(1-pyrenyl)ethyl PYE, aromatic 3-(p-
nitrophenoxy)propyl NPO, 3-phenoxypropyl POP, 3-(p-methylmercaptophenoxy)propyl CH3SPOP, 3-
7
(pentafluorophenoxy)propyl F5POP and polymer-bonded silica:methyl methacrylate MMA. C8, C18,
POP, CH3SPOP, F5POP and MMA were prepared in our laboratory, according to procedures described
elsewhere.30,31 F13C9 was commercially available from Neos (Neos, Kobe, Japan;
http://www.neos.co.jp/), PBB, PYE and NPO were available from Nacalai Tesque
(http://www.nacalai.co.jp/).
SiO
SiO
C18
O
SiO
POP (X = H)NPO (X = p-NO2)CH3SPOP (X = p-SCH3)F5POP (X = F5)
X
SiO
PYE
F
SiO
FF F
FFF CF3
CF3O
SiO
OCH3OCH3
O
CO2CH3
MMA
m
O
SiO
Br
Br
Br
Br
Br
PBB
CO2CH3n
C8
F13C9
Figure 1. Structures of the stationary phases used.
Solutes were chromatographed in 60, 70, and 80% methanol/water mixtures and 60%
acetonitrile/water mixture as mobile phases. H/D-isotopologues of benzyl alcohol, benzene, 1-butanol
and 1-pentanol were chromatographed in a wide spectrum of methanol/water compositions at 30 °C to
investigate the influence of the mobile phase on the retention and isotope effect on four selected
stationary phases (C18, PBB, PYE, F13C9). Temperature effect analysis in 70% methanol/water mobile
phase was also carried out at 30–60 °C on these four stationary phases. For stationary phase
characterization by means of QSRR, 33 test solutes were chromatographed in 70% methanol/water
mobile phase at 30 °C.
8
Determination of the Retention Factors and Isotope Effects. The partition coefficient in
chromatography is expressed as a retention factor:
k = (tr – t0) / t0
where tr is the retention time of a solute on a given column and t0 is the retention time of a nonretained
solute (“dead time”). The retention factor relates to free energy changes according to eq 1.
ln K = –DG0/RT = –DH0/RT + DS0/R = ln k – ln f (1)
where K is the chromatographic binding equilibrium constant and f is the column phase ratio, i.e., the
ratio of the volumes of the stationary and the mobile phases. The retention factor of a methylene
unit a(CH2), commonly used in chromatography, was also calculated. It is the ratio of the retention
factors for two homologues, for example:
a(CH2) = k1-Pentanol-h11 / k1-Butanol-h9
and a(CD2) = k1-Pentanol-d11 / k1-Butanol-d9
(2)
for the protiated and deuterated homologues, respectively. In addition, we measured a(CH2) using
amylbenzene and butylbenzene. We have introduced in this work another unit that reflects the retention
behavior of aromatic compounds:
a(C4H2) = kNaphthalene-h8 / kBenzene-h6
(3)
which we term the “retention factor of an aromatic unit.”
The total isotope effect (TIE) is calculated to reflect the overall difference in chromatographic
behavior of each isotopologue pair. It is free from any phase ratio influence (cf. eq 1, f cancels out),
since it is calculated as a ratio:
TIE = kH / kD
where kH and kD are the retention factors for the protiated and deuterated isotopologue pair, respectively.
Therefore, one may calculate direct free energy values for this process as well. The single isotope effect
(%IE) reflects the average influence of a single H/D substitution and is given by:
%IE = 100[(kH / kD)1/n – 1] (4)
where n is the number of D atoms substituted for H.
Molecular Modeling and QSRR Calculations. Molecular modeling and structural descriptor
calculations were done using HyperChem 5.1 Pro with ChemPlus 1.5 (http://www.hyper.com/).
Protiated structures were first calculated by the Extended Hückel method in order to estimate charges on
the atoms, then optimized using the MM+ force field followed by RHF semiempirical (AM1) geometry
9
optimization in vacuum. The next step was placing the AM1 optimized structures inside a periodic box
of water molecules and another optimization of geometry, where water was treated by MM+ force field
(classical approach) and the solute was treated by AM1 (semiempirical approach). For these optimized
solute structures, calculations of the van der Waals surfaces and volumes were performed using the
appropriate van der Waals radii values.
Quantitative Structure–Chromatographic Retention analyses by means of simple and multiple linear
regression were performed on a PC machine using Statlets 1.1B (http://www.statlets.com/) and Prophet
5.0 (http://www.bbn.com/), freely available on the web for the research purposes.
Results
This work investigates structural effects upon chromatographic binding equilibria, that is, equilibria
for partitioning of solutes between aqueous and hydrophobic phases. By studying the effects of changes
in aqueous phase composition for different hydrophobic phases, of changes in hydrophobic phase for
different aqueous phase compositions, and of different solutes as a function of both aqueous phase and
hydrophobic phase composition, we are able to dissect important factors that contribute to the
phenomenon of hydrophobic binding. To this end, we give below our results for (a) isotope effects upon
binding, (b) linear free-energy relationships, (c) structural unit retention factors a(CH2) for methylene
and a(C4H2) for aromatics, and (d) temperature effects.
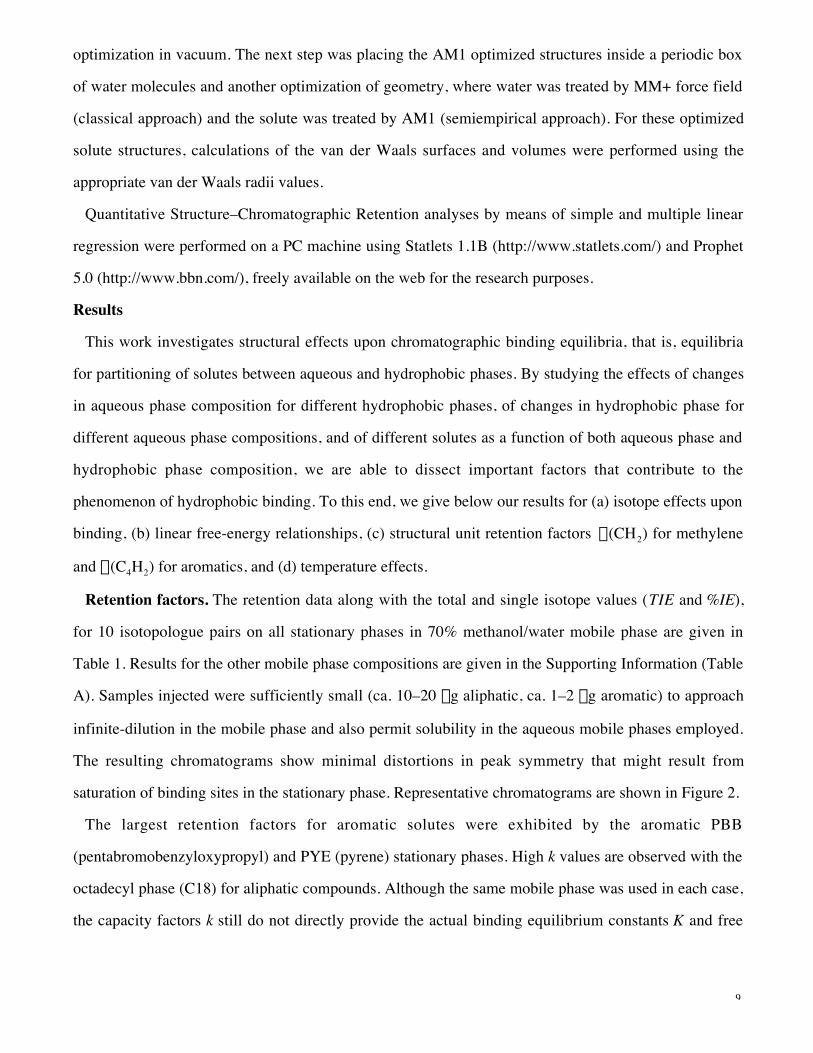
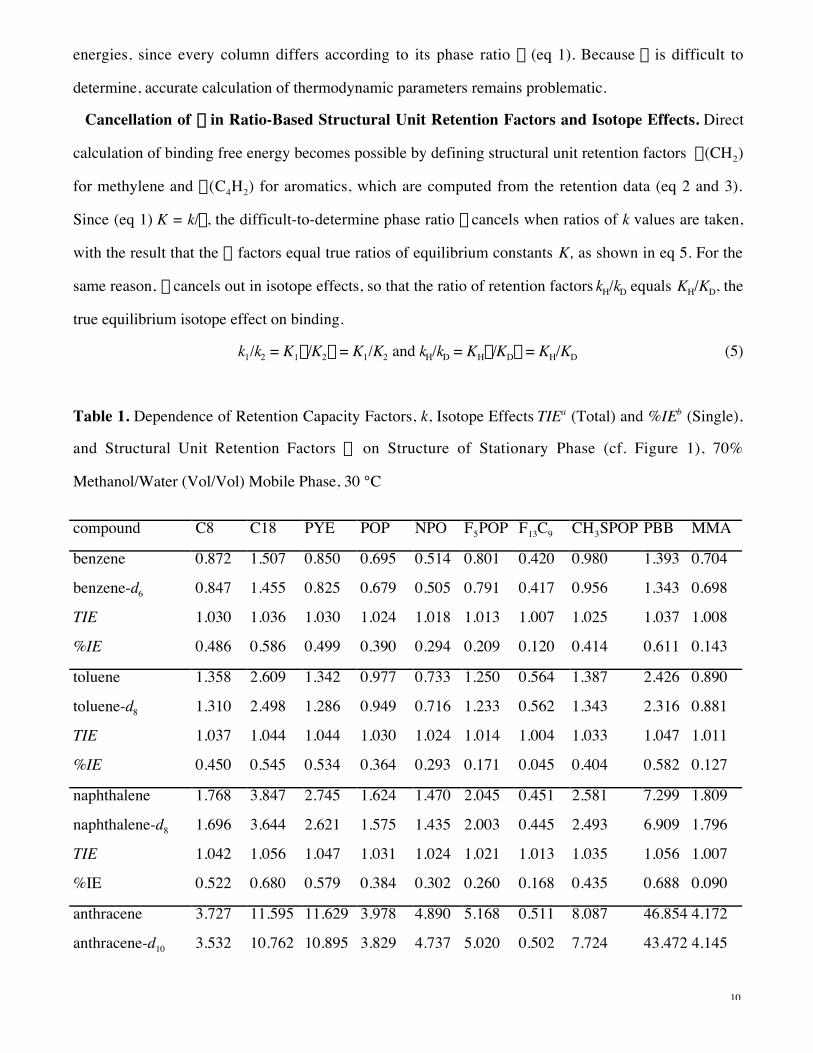
Retention factors. The retention data along with the total and single isotope values (TIE and %IE),
for 10 isotopologue pairs on all stationary phases in 70% methanol/water mobile phase are given in
Table 1. Results for the other mobile phase compositions are given in the Supporting Information (Table
A). Samples injected were sufficiently small (ca. 10–20 mg aliphatic, ca. 1–2 mg aromatic) to approach
infinite-dilution in the mobile phase and also permit solubility in the aqueous mobile phases employed.
The resulting chromatograms show minimal distortions in peak symmetry that might result from
saturation of binding sites in the stationary phase. Representative chromatograms are shown in Figure 2.
The largest retention factors for aromatic solutes were exhibited by the aromatic PBB
(pentabromobenzyloxypropyl) and PYE (pyrene) stationary phases. High k values are observed with the
octadecyl phase (C18) for aliphatic compounds. Although the same mobile phase was used in each case,
the capacity factors k still do not directly provide the actual binding equilibrium constants K and free
10
energies, since every column differs according to its phase ratio f (eq 1). Because f is difficult to
determine, accurate calculation of thermodynamic parameters remains problematic.
Cancellation of f in Ratio-Based Structural Unit Retention Factors and Isotope Effects. Direct
calculation of binding free energy becomes possible by defining structural unit retention factors a(CH2)
for methylene and a(C4H2) for aromatics, which are computed from the retention data (eq 2 and 3).
Since (eq 1) K = k/f, the difficult-to-determine phase ratio f cancels when ratios of k values are taken,
with the result that the a factors equal true ratios of equilibrium constants K, as shown in eq 5. For the
same reason, f cancels out in isotope effects, so that the ratio of retention factors kH/kD equals KH/KD, the
true equilibrium isotope effect on binding.
k1/k2 = K1f/K2f = K1/K2 and kH/kD = KHf/KDf = KH/KD (5)
Table 1. Dependence of Retention Capacity Factors, k, Isotope Effects TIEa (Total) and %IEb (Single),
and Structural Unit Retention Factors a on Structure of Stationary Phase (cf. Figure 1), 70%
Methanol/Water (Vol/Vol) Mobile Phase, 30 °C
compound C8 C18 PYE POP NPO F5POP F13C9 CH3SPOP PBB MMA
benzene 0.872 1.507 0.850 0.695 0.514 0.801 0.420 0.980 1.393 0.704
benzene-d6 0.847 1.455 0.825 0.679 0.505 0.791 0.417 0.956 1.343 0.698
TIE 1.030 1.036 1.030 1.024 1.018 1.013 1.007 1.025 1.037 1.008
%IE 0.486 0.586 0.499 0.390 0.294 0.209 0.120 0.414 0.611 0.143
toluene 1.358 2.609 1.342 0.977 0.733 1.250 0.564 1.387 2.426 0.890
toluene-d8 1.310 2.498 1.286 0.949 0.716 1.233 0.562 1.343 2.316 0.881
TIE 1.037 1.044 1.044 1.030 1.024 1.014 1.004 1.033 1.047 1.011
%IE 0.450 0.545 0.534 0.364 0.293 0.171 0.045 0.404 0.582 0.127
naphthalene 1.768 3.847 2.745 1.624 1.470 2.045 0.451 2.581 7.299 1.809
naphthalene-d8 1.696 3.644 2.621 1.575 1.435 2.003 0.445 2.493 6.909 1.796
TIE 1.042 1.056 1.047 1.031 1.024 1.021 1.013 1.035 1.056 1.007
%IE 0.522 0.680 0.579 0.384 0.302 0.260 0.168 0.435 0.688 0.090
anthracene 3.727 11.595 11.629 3.978 4.890 5.168 0.511 8.087 46.854 4.172
anthracene-d10 3.532 10.762 10.895 3.829 4.737 5.020 0.502 7.724 43.472 4.145
11
TIE 1.055 1.077 1.067 1.039 1.032 1.029 1.018 1.047 1.078 1.007
%IE 0.539 0.748 0.654 0.382 0.318 0.291 0.178 0.460 0.752 0.065
nitrobenzene 0.629 0.887 2.016 0.835 0.950 0.952 0.379 1.292 1.897 1.032
nitrobenzene-d5 0.617 0.865 1.941 0.818 0.936 0.946 0.379 1.263 1.841 1.026
TIE 1.019 1.025 1.039 1.021 1.015 1.006 1.000 1.023 1.030 1.006
%IE 0.385 0.503 0.760 0.413 0.298 0.126 0.000 0.456 0.601 0.116
cyclohexane 3.481 7.836 1.986 1.599 1.010 1.695 1.348 1.937 3.101 0.951
cyclohexane-d12 3.373 7.519 1.901 1.553 0.988 1.689 1.369 1.869 2.955 0.939
TIE 1.032 1.042 1.045 1.030 1.022 1.004 0.985 1.036 1.049 1.012
%IE 0.263 0.345 0.365 0.243 0.184 0.030 –0.128 0.298 0.403 0.106
hexane 5.055 12.136 2.608 1.856 1.166 2.510 2.226 2.224 3.840 0.971
hexane-d14 4.901 11.565 2.468 1.795 1.136 2.502 2.255 2.130 3.619 0.956
TIE 1.031 1.049 1.057 1.034 1.026 1.003 0.987 1.044 1.061 1.015
%IE 0.221 0.345 0.395 0.239 0.186 0.023 –0.093 0.309 0.425 0.111
octane 11.887 35.406 6.320 3.487 2.119 5.063 3.968 4.492 10.014 1.630
octane-d18 11.387 33.264 5.878 3.334 2.044 5.022 4.061 4.235 9.275 1.599
TIE 1.044 1.064 1.075 1.046 1.037 1.008 0.977 1.061 1.080 1.019
%IE 0.239 0.347 0.404 0.250 0.200 0.045 –0.129 0.328 0.427 0.107
1-decanol 5.278 10.292 4.307 2.166 1.349 2.508 1.843 2.680 5.580 0.693
1-decanol-d21 5.009 9.588 3.963 2.062 1.297 2.485 1.886 2.517 5.118 0.672
TIE 1.054 1.073 1.087 1.050 1.040 1.009 0.977 1.065 1.090 1.032
%IE 0.249 0.338 0.397 0.234 0.187 0.044 –0.110 0.299 0.413 0.147
1-dodecanol 12.036 29.850 9.573 3.991 2.390 4.907 3.248 5.266 13.930 1.167
1-dodecanol-d25 11.312 27.400 8.680 3.764 2.274 4.862 3.345 4.882 12.563 1.125
TIE 1.064 1.089 1.103 1.060 1.051 1.009 0.971 1.079 1.109 1.038
%IE 0.248 0.343 0.393 0.234 0.199 0.037 –0.118 0.303 0.414 0.147
a(CH2) 1.510 1.680 1.540 1.380 1.350 1.380 1.330 1.410 1.590 1.296
a(C4H2) 2.028 2.553 3.229 2.337 2.860 2.553 1.074 2.634 5.240 2.570
nD30 c 1.404 1.441 – 1.513 1.576 1.427 1.295 d 1.573 – –aTIE = kH / kD. b%IE = 100[(kH / kD)1/n – 1]. cExperimentally measured refractive indices for the olefins
used as the precursors for the stationary phases. dMeasured at 20 °C.
12
1
2
3 4
DH
D H
C18
PYE
5
67D
H
D H
t r, min
0 2 4 6 8 10 12 14
0 5 10 15 20
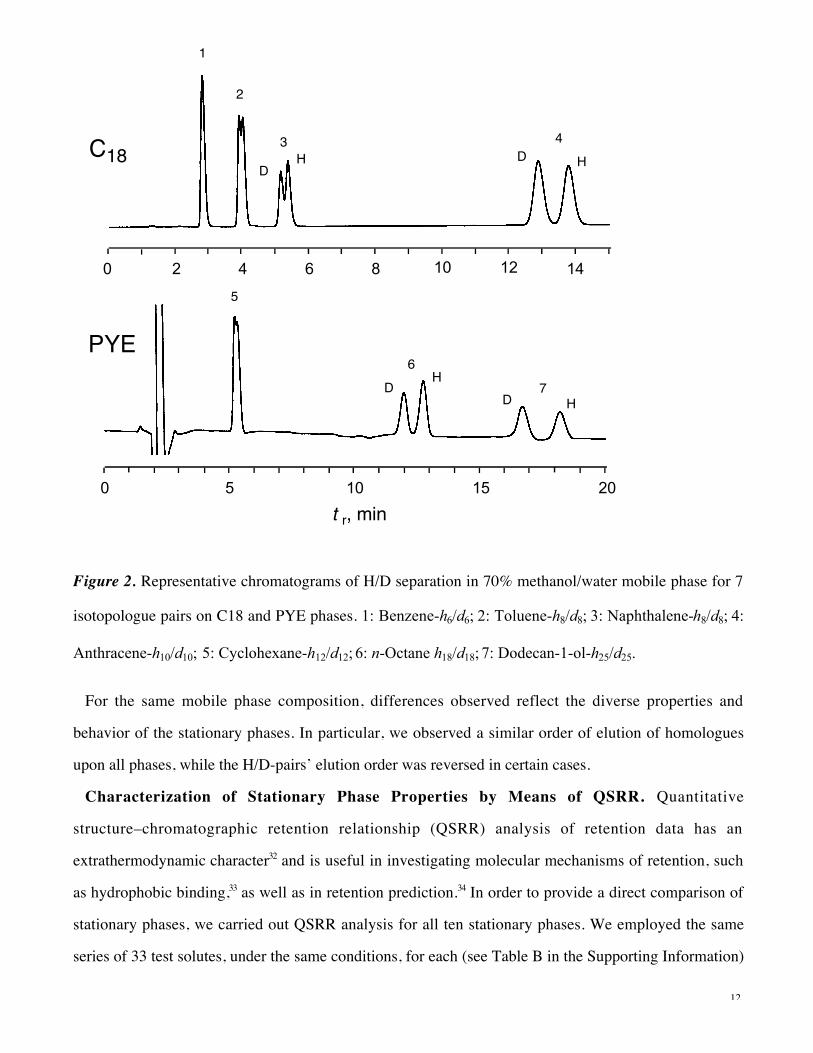
Figure 2. Representative chromatograms of H/D separation in 70% methanol/water mobile phase for 7
isotopologue pairs on C18 and PYE phases. 1: Benzene-h6/d6; 2: Toluene-h8/d8; 3: Naphthalene-h8/d8; 4:
Anthracene-h10/d10; 5: Cyclohexane-h12/d12; 6: n-Octane h18/d18; 7: Dodecan-1-ol-h25/d25.
For the same mobile phase composition, differences observed reflect the diverse properties and
behavior of the stationary phases. In particular, we observed a similar order of elution of homologues
upon all phases, while the H/D-pairs’ elution order was reversed in certain cases.
Characterization of Stationary Phase Properties by Means of QSRR. Quantitative
structure–chromatographic retention relationship (QSRR) analysis of retention data has an
extrathermodynamic character32 and is useful in investigating molecular mechanisms of retention, such
as hydrophobic binding,33 as well as in retention prediction.34 In order to provide a direct comparison of
stationary phases, we carried out QSRR analysis for all ten stationary phases. We employed the same
series of 33 test solutes, under the same conditions, for each (see Table B in the Supporting Information)

13
and used the structural descriptors proposed by Abraham 35 to characterize the stationary phase
properties.36 Abraham’s equation (eq 6), derived from the Kamlet–Taft solvatochromic parameters,37
log k = m + nVx + Sp2H + aSa2
H + bSb2H + rR2 (6)
describes retention in terms of molecular properties of solutes and the chromatographic mobile and
stationary phases, where m is a constant (intercept), Vx is the McGowan characteristic volume of the
solute, a2H is the hydrogen-bond acidity of the solute, b2
H is the hydrogen-bond basicity of the solute,
p2H is the dipolarity–polarizability of the solute, and R2 is excess molar refraction of the solute.
Respective coefficients n, S, a, b, and r reflect differences in properties between the stationary and
mobile phases, to be discussed later. Table 2 presents the results of multiple regression analysis of
retention data with 70% methanol/water mobile phase composition. The coefficients are related to the
properties of both the stationary and mobile phase. However, if the same mobile phase is employed with
different stationary phases, as in Table 2, the mobile phase properties cancel out in comparing the
coefficients for different stationary phases. The results are presented for independent variables giving
significance level, p, ≤ 0.05. QSRR regression analysis was also performed including all variables
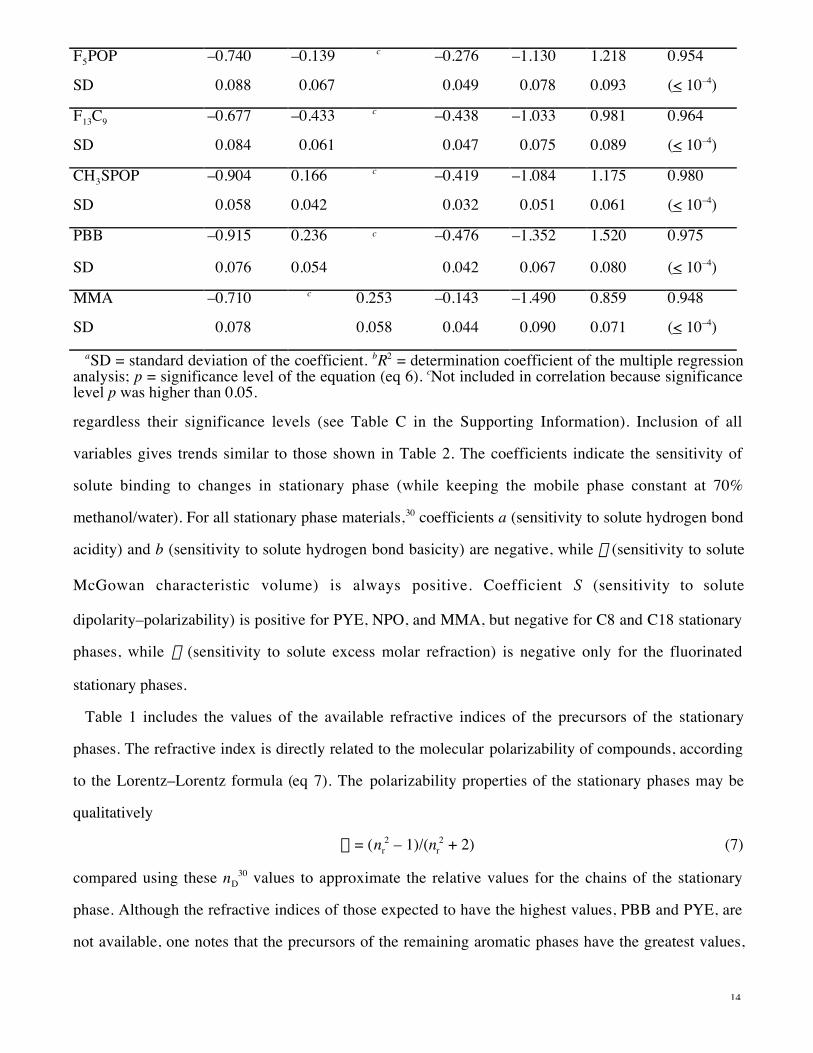
Table 2. Results of QSRR Analysis (Eq 6) of 33 Test Compounds for Series of Stationary Phases (cf.
Figure 1), Mobile Phase 70% Methanol/Water, 30 °C
stationary phase
SDa
m r S a b n R2 b
(p)
C8 –0.730 c –0.364 –0.208 –1.304 1.393 0.987
SD 0.060 0.036 0.032 0.056 0.059 (< 10–4)
C18 –0.584 0.242 –0.679 –0.298 –1.509 1.632 0.991
SD 0.066 0.077 0.066 0.036 0.079 0.071 (< 10–4)
PYE –1.218 c 0.498 –0.848 –1.154 1.428 0.963
SD 0.107 0.065 0.057 0.099 0.105 (< 10–4)
POP –0.843 c c –0.371 –1.025 1.124 0.986
SD 0.046 0.023 0.041 0.047 (< 10–4)
NPO –1.070 c 0.327 –0.330 –1.167 1.053 0.959
SD 0.077 0.046 0.040 0.071 0.075 (< 10–4)
14
F5POP –0.740 –0.139 c –0.276 –1.130 1.218 0.954
SD 0.088 0.067 0.049 0.078 0.093 (< 10–4)
F13C9 –0.677 –0.433 c –0.438 –1.033 0.981 0.964
SD 0.084 0.061 0.047 0.075 0.089 (< 10–4)
CH3SPOP –0.904 0.166 c –0.419 –1.084 1.175 0.980
SD 0.058 0.042 0.032 0.051 0.061 (< 10–4)
PBB –0.915 0.236 c –0.476 –1.352 1.520 0.975
SD 0.076 0.054 0.042 0.067 0.080 (< 10–4)
MMA –0.710 c 0.253 –0.143 –1.490 0.859 0.948
SD 0.078 0.058 0.044 0.090 0.071 (< 10–4)aSD = standard deviation of the coefficient. bR2 = determination coefficient of the multiple regression
analysis; p = significance level of the equation (eq 6). cNot included in correlation because significancelevel p was higher than 0.05.
regardless their significance levels (see Table C in the Supporting Information). Inclusion of all
variables gives trends similar to those shown in Table 2. The coefficients indicate the sensitivity of
solute binding to changes in stationary phase (while keeping the mobile phase constant at 70%
methanol/water). For all stationary phase materials,30 coefficients a (sensitivity to solute hydrogen bond
acidity) and b (sensitivity to solute hydrogen bond basicity) are negative, while n (sensitivity to solute
McGowan characteristic volume) is always positive. Coefficient S (sensitivity to solute
dipolarity–polarizability) is positive for PYE, NPO, and MMA, but negative for C8 and C18 stationary
phases, while r (sensitivity to solute excess molar refraction) is negative only for the fluorinated
stationary phases.
Table 1 includes the values of the available refractive indices of the precursors of the stationary
phases. The refractive index is directly related to the molecular polarizability of compounds, according
to the Lorentz–Lorentz formula (eq 7). The polarizability properties of the stationary phases may be
qualitatively
a = (nr2 – 1)/(nr
2 + 2) (7)
compared using these nD30 values to approximate the relative values for the chains of the stationary
phase. Although the refractive indices of those expected to have the highest values, PBB and PYE, are
not available, one notes that the precursors of the remaining aromatic phases have the greatest values,
15
followed by the aliphatic C18 and C8. The precursor of the F13C9 phase has a refractive index smaller
than that for water (nD30 = 1.333).
The negative coefficients a and b reflect the fact that polar interactions of solutes are much stronger in
the aqueous mobile phase than in the stationary phase. The fact that a and b for all stationary phases are
similar to that for the C18 phase indicates that solute binding by all phases is almost exclusively of a
hydrophobic nature, especially involving London dispersion attractive interactions, as is already widely
accepted for C18 stationary phases.36 That this similarity exists even for the NPO phase, which has a p-
nitrophenyl group, indicates that the nitro groups are probably at the surface of this phase and
interacting primarily with the aqueous mobile phase, and that even in this case the binding of solutes is
hydrophobic in nature. The data thus indicate that interactions, even of polar solutes, with the silica core
of these stationary phases are most probably negligible. With our nonpolar solutes, if any interactions
involving the silica core were present, they would most probably be with the polar methanol component
of the aqueous phase and not with the bound solutes.
Single Isotope Effect. As outlined in the Introduction, isotope effects upon binding constitute a
unique probe of molecular interactions because isotopic substitution does not significantly affect
potential energy. Potential energy effects cancel between isotopologues, meaning that isotope effects
result essentially only from the effects of changes in interactions upon nuclear motions, especially
vibrational frequencies.
We have studied perdeuterated solutes as a means of obtaining RPLC separation of isotopologues and
accurate values of isotope effects. For purposes of comparison and interpretation, isotope effects for a
single deuterium substitution are needed, so we calculate averaged isotope effects per CH/CD bond
from our directly observed total isotope effects, TIE, as %IE (eq 4). The basis of this calculation is the
usual approximation that, at ordinary temperatures, the isotope effect for each CH/CD bond contributes
additively to the free energy (accurate if the isotope effect is controlled by zero-point energy
differences) and thus multiplicatively to the TIE. That is, ln (TIE) = ln (kH / kD) = n ln (avg single
CH/CD IE), where n is the number of CH/CD substitutions in the deuterated isotopologue, so that the
average single CH/CD isotope effect = (kH / kD)1/n, or, expressing this isotope effect on a percentage
basis, %IE = 100[(kH / kD)1/n – 1].
In any molecule the average %IE cannot be exactly the same except for symmetry-related CH/CD
bonds, so most of the molecules we have investigated involve finite differences among different types of
16
bonds. However, since all are CH/CD bonds and are largely nonpolar, the interactions between them
and the mobile as well as the stationary phase should be quite similar within a given molecule. We do
see differences between aromatic and aliphatic CH/CD bond types (cf. Table 1), but the only molecule
studied which contains both aromatic and aliphatic is toluene. For the other molecules at least, the use of
averaged %IE should be a good approximation. This conclusion is strongly supported by the results,
which show that %IE values are closely clustered for almost all compounds on all ten stationary phases
studied (see Figure 3 below). The fact that only relatively small differences in %IE are seen for different
aliphatic chain lengths or for different aromatics demonstrates that there is little effect of structural
variation within each series, aliphatic or aromatic. This is especially true for the aliphatic series, and can
be true only if the %IE for methyl protons and the different methylene protons in different chains are all
nearly equal; if any type were significantly different, the average %IE should vary among the different
compounds.
The trends of isotope effects on binding relative to the binding affinity of each stationary phase for a
single CH2 group are shown for representative solutes in Figure 3, plotted as ln (%IE) (eq 4) vs ln
[a(CH2)] (eq 2). (Since these logarithms are proportional to free energies, this is equivalent to a free
energy vs free energy plot.) The retention factor of a methylene unit a (CH2) (eq 2) is taken as an
approximate measure of the overall affinity or binding ability of each different stationary phase. A linear
relationship is not necessarily expected, but as shown in Figure 3, the aromatic stationary phases alone
give rather linear plots, suggesting the possibility that interactions with aromatic p electrons may play
some role, while the nonaromatic stationary phases appear to form separate groups (see Discussion).
Although isotope effects per CH/CD are small, amounting to fractions of a percent, their values have
high reproducibility and thus differences in %IE values are highly significant. High reproducibilities are
aided by the fact that isotopologue pairs may be injected simultaneously and separated in a single run,
but the reproducibilities are high even in those cases where the isotope effect is small enough to
necessitate separate determination of retention times by sequential injection of the protiated and
deuterated isotopologues. Total isotope effects, TIE, for solutes containing several deuterium
substitutions are typically several per cent (cf. Table 1) and are reproducible to ± 0.1% in most cases. As
a typical example, cyclohexane vs cyclohexane-d12 on C18 stationary phase gives a TIE = 1.0422. A
reproducibility of ± 0.001 gives, from eq 4, %IE = 0.345 ± 0.008. Thus the differences in %IE observed
17
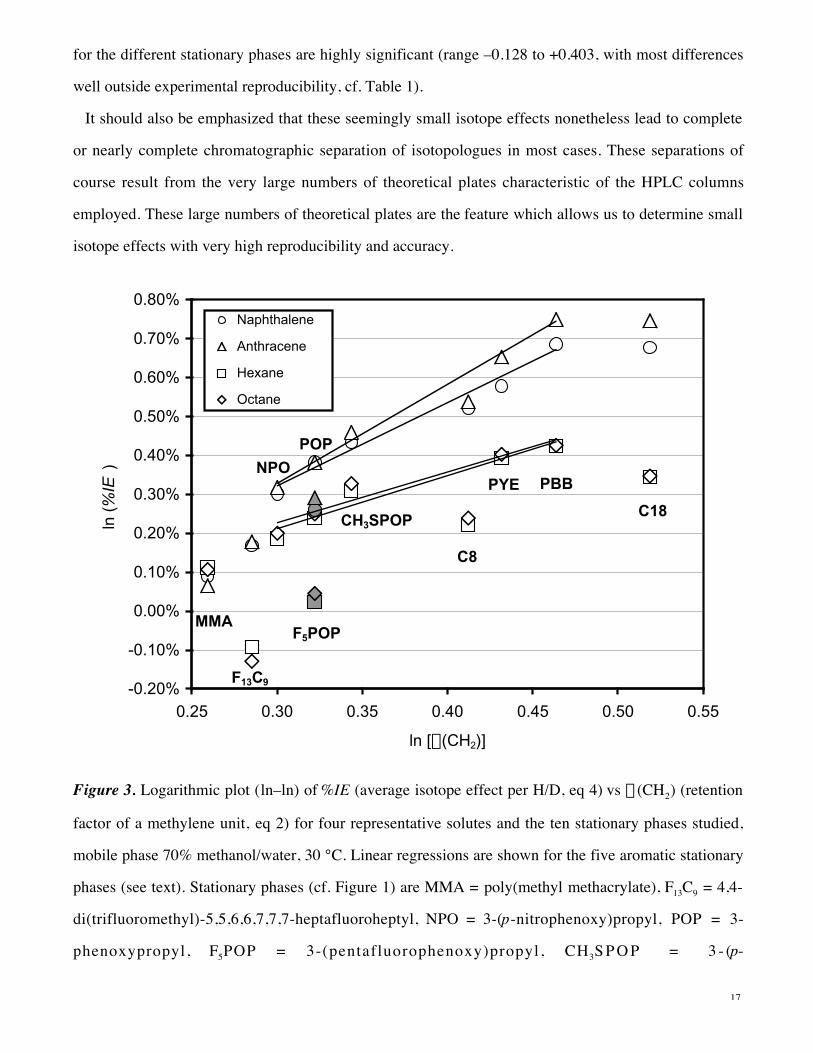
for the different stationary phases are highly significant (range –0.128 to +0.403, with most differences
well outside experimental reproducibility, cf. Table 1).
It should also be emphasized that these seemingly small isotope effects nonetheless lead to complete
or nearly complete chromatographic separation of isotopologues in most cases. These separations of
course result from the very large numbers of theoretical plates characteristic of the HPLC columns
employed. These large numbers of theoretical plates are the feature which allows us to determine small
isotope effects with very high reproducibility and accuracy.
-0.20%
-0.10%
0.00%
0.10%
0.20%
0.30%
0.40%
0.50%
0.60%
0.70%
0.80%
0.25 0.30 0.35 0.40 0.45 0.50 0.55
ln [a(CH2)]
ln (
%IE
)
Naphthalene
Anthracene
Hexane
Octane
Naphthalene(F5)Anthracene(F5)Hexane(F5)
Octane(F5)
Naphthalene(C8,18)Anthracene(C8,18)Hexane(C8,18)
Octane(C8,18)
Naphthalene(MMA)Anthracene(MMA)Hexane(MMA)
Octane(MMA)
Naphthalene(F13)Anthracene(F13)Hexane(F13)
Octane(F13)
Linear(Anthracene)Linear(Naphthalene)Linear(Hexane)Linear(Octane)
MMA
F13C9
NPO
F5POP
POP
CH3SPOP
C8
PYE PBB
C18
Figure 3. Logarithmic plot (ln–ln) of %IE (average isotope effect per H/D, eq 4) vs a (CH2) (retention
factor of a methylene unit, eq 2) for four representative solutes and the ten stationary phases studied,
mobile phase 70% methanol/water, 30 °C. Linear regressions are shown for the five aromatic stationary
phases (see text). Stationary phases (cf. Figure 1) are MMA = poly(methyl methacrylate), F13C9 = 4,4-
di(trifluoromethyl)-5,5,6,6,7,7,7-heptafluoroheptyl, NPO = 3-(p-nitrophenoxy)propyl, POP = 3-
phenoxypropyl, F5POP = 3-(pentafluorophenoxy)propyl, CH3S P O P = 3 - (p-
18
methylmercaptophenoxy)propyl, C8 = octyl, PYE = 2-(1-pyrenyl)ethyl, PBB = 3-
(pentabromobenzyloxy)propyl, and C18 = octadecyl.
Because of the unique nature of isotope effects, these isotope effects specifically measure only
changes in the properties of the CH/CD bonds of the solute upon transfer from the aqueous mobile
phase to the hydrophobic stationary phase. As a result, the %IE isolates separately the effect of the
binding process upon just the solute, i.e., shows how the differences in binding interactions between the
two phases affect the properties of the CH/CD bonds of the solute. The fact that the observed values of
%IE are different from zero directly shows that the solute has different intermolecular interactions with
the hydrophobic stationary phase than with the aqueous mobile phase.
As a primary conclusion, our %IE data show that the solute does not interact with the stationary vs the
mobile phase while remaining unperturbed; rather, the properties of the solute are altered, probably via
changes in the vibrational frequencies of the CH/CD bonds, as a result of the intermolecular interactions
of solute with stationary and/or mobile phases. Positive values of %IE show that the CH/CD bonds are
less restricted in the stationary phase than in the mobile phase—usually caused by weakening of the
bonds, in this case weaker in the stationary phase relative to the mobile phase. Importantly, such
weakening in turn implies that the interactions of the solutes with the relatively nonpolar, hydrophobic
stationary phase are stronger than those with the polar, aqueous mobile phase. This result, observed here
for most solutes and a variety of stationary phases, is consistent with an active role of the hydrophobic
phase in hydrophobic phenomena, i.e., with the idea that lipophilic phenomena make an important
contribution to the hydrophobic effect.
The values of %IE are higher for aromatic than for aliphatic CH/CD in all chromatographic systems
examined. Moreover, for the aromatic isotopologues %IE increases with the molecular size, while it
remains constant for the H/D-alkanes. The largest isotope effects are found for the three stationary
phases exhibiting the strongest binding as estimated by a(CH2), for aromatics the order of %IE being
PBB > C18 > PYE, for aliphatics, PBB > PYE > C18. In contrast, the smallest isotope effects for
aromatic solutes are found for the two stationary phases exhibiting the weakest binding as estimated by
a(CH2), methyl methacrylate ester (MMA) and fluorinated F13C9. For aliphatic solutes, small isotope
effects are found for MMA and F13C9, the latter even giving inverse isotope effects for aliphatic solutes,
and fluorinated F5POP gives small isotope effects as well.
19
These trends in %IE with different types of solutes and stationary phases are also consistent with an
active role of the hydrophobic phase in hydrophobic phenomena. They suggest possible involvement of
CH/CD----p (aromatic) interactions in the isotope effects and hence in the binding process (see
Discussion).
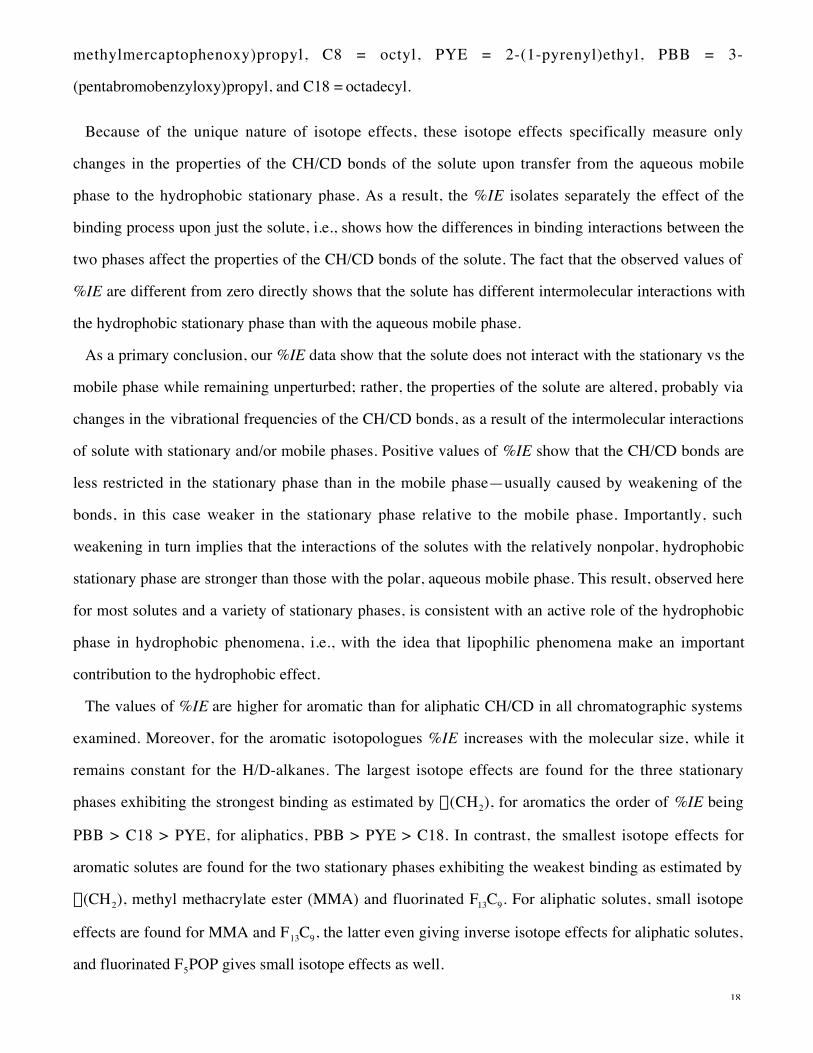
Effect of Mobile Phase Upon Retention and Isotope Effects. While it was not possible to examine
most solutes over a wide range of solvent composition, it was possible to determine %IE for benzene
over the range of water (0% methanol) up to 80% methanol/water, as shown in Figure 4 along with
a(CH2), the retention factor of a methylene unit, on four representative stationary phases. There are
significant changes in %IE which tend to parallel the trends in binding affinities for a methylene unit,
with the exception that the %IE for the nonaromatic stationary phases C18 and F13C9 levels off at about
20% methanol and less. Entirely comparable effects are found with all solutes and stationary phases
over the accessible range of 60–80% methanol for aromatic solutes and 70–80% methanol for aliphatic
solutes (complete data for all solutes are in Table A of Supporting Information).
If the mobile phase simply provided an essentially noninteracting cage for the solute, the isotope
effects would be independent of mobile phase composition. The fact that the isotope effects depend on
mobile phase composition as well as on stationary phase demonstrates that the solute interacts with the
mobile phase, too. Hence, these isotope effects show that the aqueous phase plays an active role as well,
in addition to the important contribution to the hydrophobic effect from lipophilic phenomena (see the
previous section).
0.00%
0.20%
0.40%
0.60%
0.80%
1.00%
1.20%
1.40%
0 10 20 30 40 50 60 70 80 90
% Methanol
ln (
%IE
)
1
10
a(C
H2)
%IE C18%IE PYE%IE F13C9%IE PBB (CH2) C18 (CH2) PYE (CH2) F13C9 (CH2) PBB
3.16
20
Figure 4. Plot of ln (%IE), where %IE is the average isotope effect per H/D for benzene (eq 4) (open
symbols) and log plot of a(CH2), the retention factor of a methylene unit (eq 2) (closed symbols) vs %
methanol in methanol/water mobile phase for representative stationary phases, 30 °C. (Logarithmic
plots are presented since logarithms are proportional to free energy differences, so that these plots are
equivalent to plots of free energies vs % methanol.)
Temperature Effects on Binding and on Isotope Effects. Temperature effects were studied for all
H/D-isotopologues in 70% methanol/water mobile phase on four representative stationary phases. In all
cases, the van’t Hoff plots for the measured chromatographic retention factor k were highly linear and
show that the binding process is exothermic. As discussed above (see eq 5), k differs from the
equilibrium constant for binding K as K = k/f . The phase ratio f being difficult to determine,
thermodynamic quantities involving k are not useful for comparison.
However, f cancels when ratios of k values are taken, meaning that the a factors and isotope effects
equal true ratios of equilibrium constants K (cf. eq 5), so that meaningful thermodynamic quantities
DG0, DH0, and DS0 can be calculated for the retention factor for a methylene unit a (CH2), eq 2, the
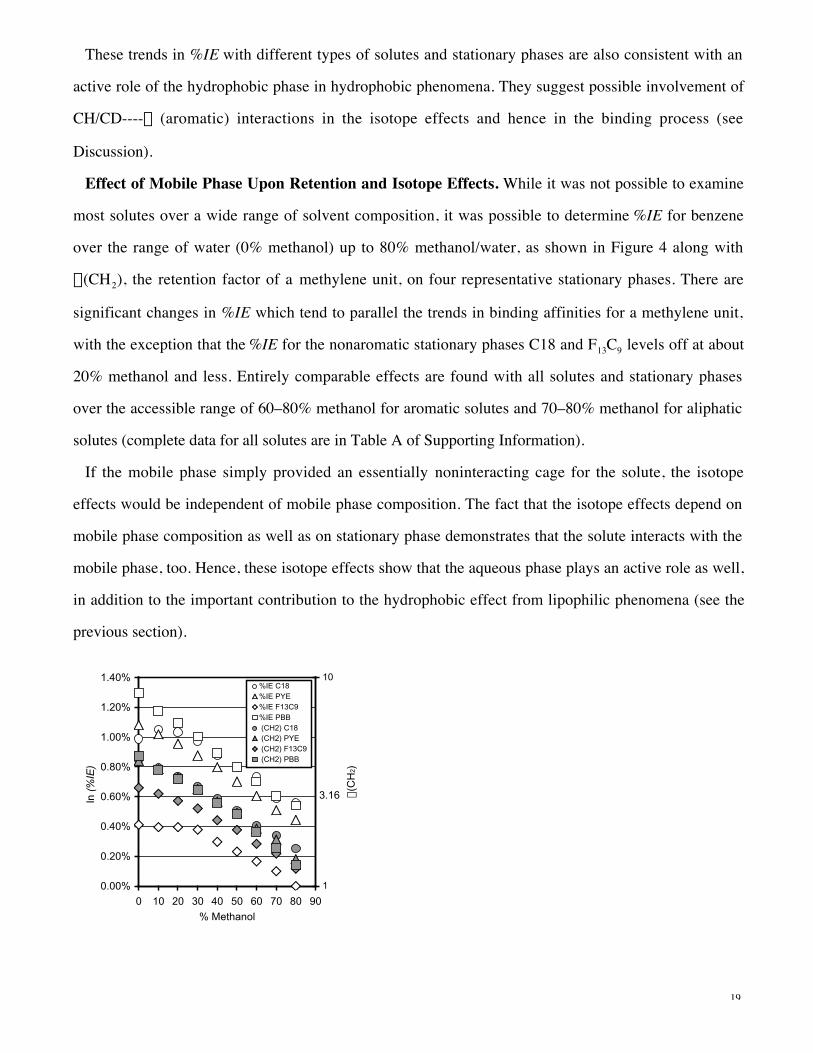
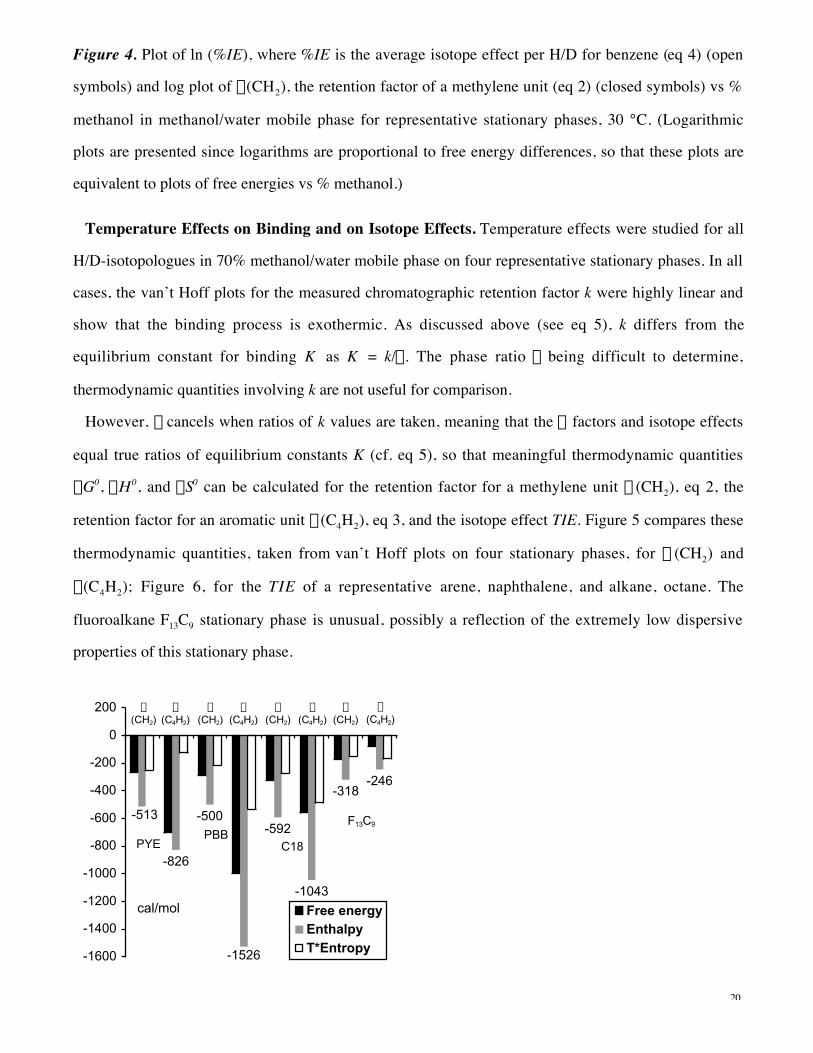
retention factor for an aromatic unit a(C4H2), eq 3, and the isotope effect TIE. Figure 5 compares these
thermodynamic quantities, taken from van’t Hoff plots on four stationary phases, for a (CH2) and
a(C4H2); Figure 6, for the TIE of a representative arene, naphthalene, and alkane, octane. The
fluoroalkane F13C9 stationary phase is unusual, possibly a reflection of the extremely low dispersive
properties of this stationary phase.
-826
-500
-1526
-592
-1043
-318-246
-513
-1600
-1400
-1200
-1000
-800
-600
-400
-200
0
200
1 2 3 4 5 6 7 8
Free energyEnthalpyT*Entropy
cal/mol
PYEPBB
C18
F13C9
a(CH2)
a(C4H2)
a(C4H2)
a(C4H2)
a(C4H2)
a(CH2)
a(CH2)
a(CH2)
21
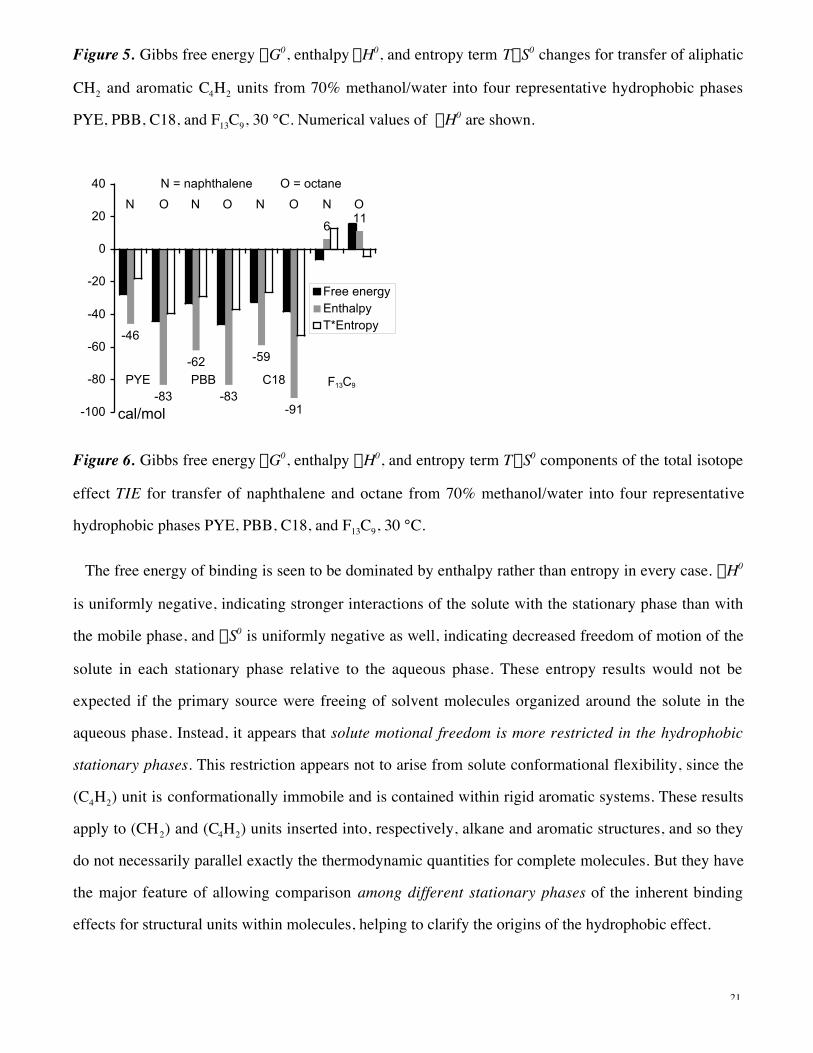
Figure 5. Gibbs free energy DG0, enthalpy DH0, and entropy term TDS0 changes for transfer of aliphatic
CH2 and aromatic C4H2 units from 70% methanol/water into four representative hydrophobic phases
PYE, PBB, C18, and F13C9, 30 °C. Numerical values of DH0 are shown.
-46
-83
-62
-83
-59
-91
611
-100
-80
-60
-40
-20
0
20
40
Free energyEnthalpyT*Entropy
cal/mol
PYE PBB C18 F13C9
N = naphthalene O = octane
N N N NO O O O
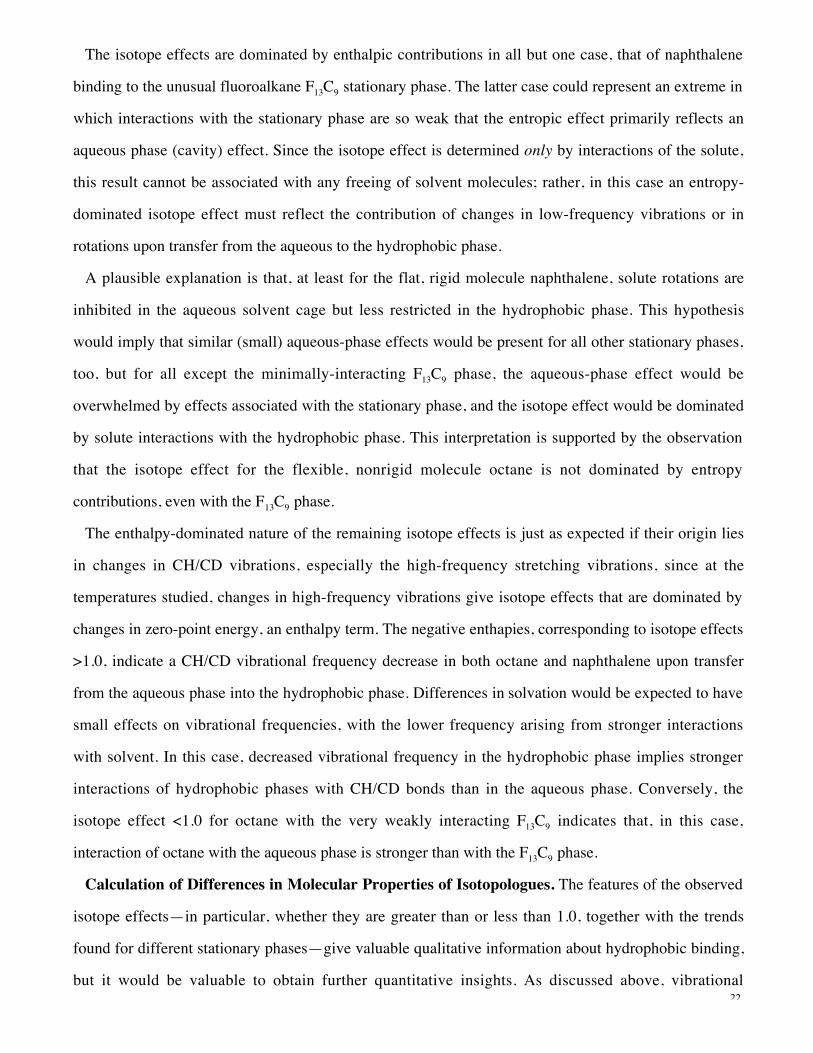
Figure 6. Gibbs free energy DG0, enthalpy DH0, and entropy term TDS0 components of the total isotope
effect TIE for transfer of naphthalene and octane from 70% methanol/water into four representative
hydrophobic phases PYE, PBB, C18, and F13C9, 30 °C.
The free energy of binding is seen to be dominated by enthalpy rather than entropy in every case. DH0
is uniformly negative, indicating stronger interactions of the solute with the stationary phase than with
the mobile phase, and DS0 is uniformly negative as well, indicating decreased freedom of motion of the
solute in each stationary phase relative to the aqueous phase. These entropy results would not be
expected if the primary source were freeing of solvent molecules organized around the solute in the
aqueous phase. Instead, it appears that solute motional freedom is more restricted in the hydrophobic
stationary phases. This restriction appears not to arise from solute conformational flexibility, since the
(C4H2) unit is conformationally immobile and is contained within rigid aromatic systems. These results
apply to (CH2) and (C4H2) units inserted into, respectively, alkane and aromatic structures, and so they
do not necessarily parallel exactly the thermodynamic quantities for complete molecules. But they have
the major feature of allowing comparison among different stationary phases of the inherent binding
effects for structural units within molecules, helping to clarify the origins of the hydrophobic effect.
22
The isotope effects are dominated by enthalpic contributions in all but one case, that of naphthalene
binding to the unusual fluoroalkane F13C9 stationary phase. The latter case could represent an extreme in
which interactions with the stationary phase are so weak that the entropic effect primarily reflects an
aqueous phase (cavity) effect. Since the isotope effect is determined only by interactions of the solute,
this result cannot be associated with any freeing of solvent molecules; rather, in this case an entropy-
dominated isotope effect must reflect the contribution of changes in low-frequency vibrations or in
rotations upon transfer from the aqueous to the hydrophobic phase.
A plausible explanation is that, at least for the flat, rigid molecule naphthalene, solute rotations are
inhibited in the aqueous solvent cage but less restricted in the hydrophobic phase. This hypothesis
would imply that similar (small) aqueous-phase effects would be present for all other stationary phases,
too, but for all except the minimally-interacting F13C9 phase, the aqueous-phase effect would be
overwhelmed by effects associated with the stationary phase, and the isotope effect would be dominated
by solute interactions with the hydrophobic phase. This interpretation is supported by the observation
that the isotope effect for the flexible, nonrigid molecule octane is not dominated by entropy
contributions, even with the F13C9 phase.
The enthalpy-dominated nature of the remaining isotope effects is just as expected if their origin lies
in changes in CH/CD vibrations, especially the high-frequency stretching vibrations, since at the
temperatures studied, changes in high-frequency vibrations give isotope effects that are dominated by
changes in zero-point energy, an enthalpy term. The negative enthapies, corresponding to isotope effects
>1.0, indicate a CH/CD vibrational frequency decrease in both octane and naphthalene upon transfer
from the aqueous phase into the hydrophobic phase. Differences in solvation would be expected to have
small effects on vibrational frequencies, with the lower frequency arising from stronger interactions
with solvent. In this case, decreased vibrational frequency in the hydrophobic phase implies stronger
interactions of hydrophobic phases with CH/CD bonds than in the aqueous phase. Conversely, the
isotope effect <1.0 for octane with the very weakly interacting F13C9 indicates that, in this case,
interaction of octane with the aqueous phase is stronger than with the F13C9 phase.
Calculation of Differences in Molecular Properties of Isotopologues. The features of the observed
isotope effects—in particular, whether they are greater than or less than 1.0, together with the trends
found for different stationary phases—give valuable qualitative information about hydrophobic binding,
but it would be valuable to obtain further quantitative insights. As discussed above, vibrational
23
frequency changes appear to be the major source of the isotope effects we have observed. Hence, an
investigation of solute vibrational frequencies might provide further support and interpretation of our
results. However, changes of only a few cm–1 in the stretching frequency of each CH/CD bond would be
sufficient to account for the magnitude of the observed isotope effects.
It should be emphasized that changes in solvation would not be expected to alter the vibrational
frequencies of the nearly nonpolar CH/CD bonds a great deal, so that even such small effects can yield
insights into differences in solvation in the aqueous vs the stationary phase. Moreover, isotope effects
constitute a very sensitive probe, so that effects of the magnitude reported here are significant and
readily interpretable. And importantly, as discussed above, our isotope effects have very high
reproducibilities and hence can justifiably be used to probe phenomena such as the nature of, and
differences in, hydrophobic binding phenomena.
Though frequency changes of only a few cm–1 are expected, we did undertake preliminary FT-IR
studies of certain of our solutes in different solvents. Small shifts of approximately the appropriate
magnitude to account for the observed isotope effects were found in some but not all cases.
Consequently, and not surprisingly, interpretation was not feasible without more data, being
complicated by the fact that these solution spectra result from superposition of several normal vibrations
involving multiple CH or CD bonds present in each solute as well as by the smallness of the frequency
shifts expected (and observed).
It is feasible, however, to explain our results further through computations of molecular properties.
Such a theoretical rationale is valuable both in supporting interpretation of the present results and as a
potential tool for future extrapolation and prediction.
The chromatographic retention mechanism can be defined as the sum of all physical interaction
processes among solute, stationary phase, and mobile phase.11 Among all the H/D pairs of compounds
examined, only nitrobenzene possesses a large dipole moment. For the remaining compounds, the major
interactions to be considered are dipole–induced dipole and London dispersion interactions between the
solute and the stationary phase, and additionally the hydrophobic (solvent) cavity effect. The van der
Waals volume (VvdW), and surface area (SvdW) are commonly used for describing interactions of nonpolar
molecules. Also, the volume-related molecular polarizability (a) describes satisfactorily the dispersive
properties of non-polar solutes38 and is also related to the hydrophobic cavity effect.
24
van der Waals Radius, Surface Area, and Volume. Experimental values for carbon, oxygen, and
nitrogen van der Waals (vdW) atomic radii (r) were used to calculate VvdW and SvdW.39 For hydrogen,
however, we introduced corrections to adjust vdW radii for sp2 vs sp3 carbon-bound hydrogen.40 These
corrections are detailed in the Supporting Information.
We then calculated the change in the vdW radius for the deuterium atom. According to Pauling’s
model, the vdW radius is described by eq 8, where b is a number characteristic for an element. As
r = const + b (8)
described in the introduction, the amplitude of vibrations is different for H and D. The smaller zero-
point energy of vibrations (ZPE) of deuterium bound to a carbon atom is a manifestation of the different
vibrational frequencies of deuterium and protium in the lowest vibrational state. Pictorially, one may
think of deuterium as “penetrating” a smaller area of the potential energy surface.
The turning point, Xtp, of a quantum harmonic oscillator in the lowest vibrational state is given by eq
9, where mCH is the reduced mass of H (bound to C), w is the CH bond vibrational frequency (in rad s–1)
Xtp = (h/mCHw)1/2 (9)
[w = (k /mCH)1/2, where k is the force constant], and h = h/2p, where h is Planck’s constant. Xtp, in the
classical limit, corresponds to the amplitude of a harmonic oscillator. Following Ubbelohde,41 the
extent, or amplitude, of vibration is assumed to be correlated with the vdW radius. Therefore, b (eq 8) is
simply postulated to be equal to Xtp. The frequency of CH vibration was estimated from experimentally
measured IR spectra of protiated solutes.42 For an sp3 CH bond the average frequency is 2934 cm–1, for
sp2 (aromatic) CH, 3067 cm–1. Using eq 9 we obtained values for b of 0.103 and 0.101 Å, respectively.
The different vdW radii between hydrogen (and deuterium) bound to sp2 carbon (smaller) and sp3
carbon (larger) give different H/D volumes, which contribute to differences in hydrophobicity of
aromatic and aliphatic compounds, since hydrophobic properties are related to molecular volume.
The difference in vdW radius between protium and deuterium results from the difference in amplitude
of vibrations of CH vs CD bonds. Since b is proportional to 1/(mk)1/4, the ratio of bH for protium to bD for
deuterium is given by eq 10, from which eq 11 and (using eq 8) eq 12 follow.
bH/bD = (mCD/mCH)1/4 = (13/7)1/4 = 1.1674 (10)
bD = bH – 0.1434 bH (11)
rD = rH – 0.1434 bH (12)
25
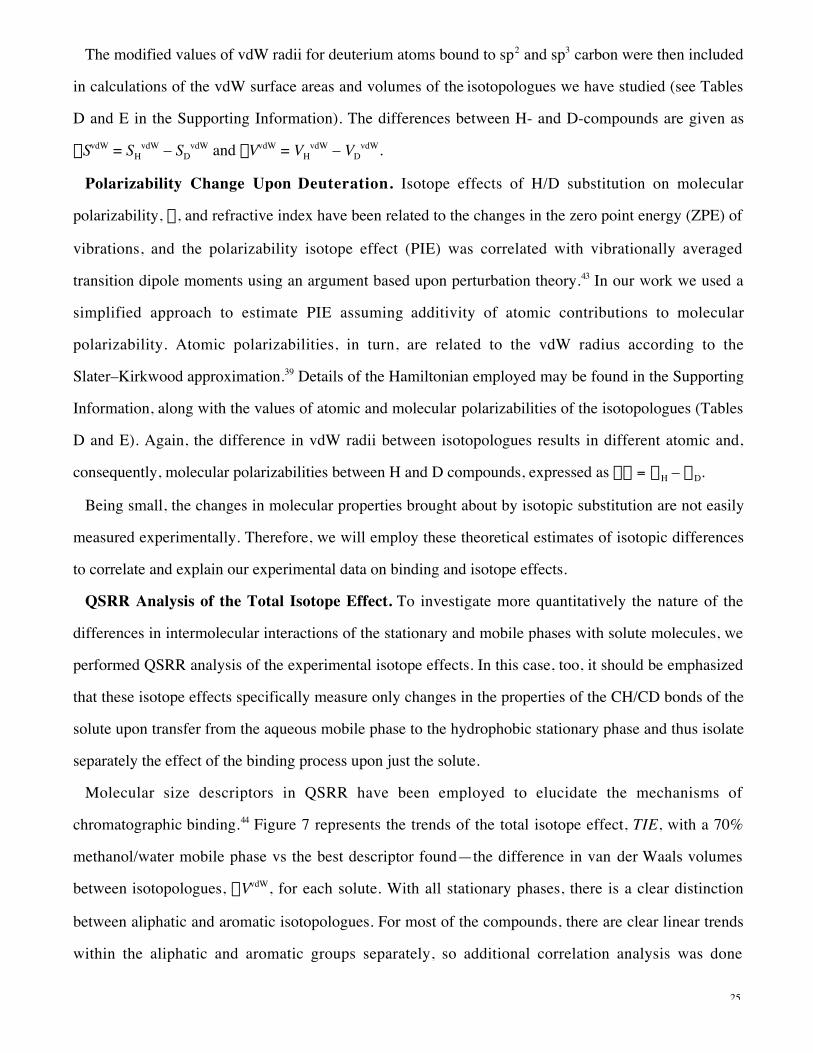
The modified values of vdW radii for deuterium atoms bound to sp2 and sp3 carbon were then included
in calculations of the vdW surface areas and volumes of the isotopologues we have studied (see Tables
D and E in the Supporting Information). The differences between H- and D-compounds are given as
DSvdW = SHvdW – SD
vdW and DVvdW = VHvdW – VD
vdW.
Polarizability Change Upon Deuteration. Isotope effects of H/D substitution on molecular
polarizability, a, and refractive index have been related to the changes in the zero point energy (ZPE) of
vibrations, and the polarizability isotope effect (PIE) was correlated with vibrationally averaged
transition dipole moments using an argument based upon perturbation theory.43 In our work we used a
simplified approach to estimate PIE assuming additivity of atomic contributions to molecular
polarizability. Atomic polarizabilities, in turn, are related to the vdW radius according to the
Slater–Kirkwood approximation.39 Details of the Hamiltonian employed may be found in the Supporting
Information, along with the values of atomic and molecular polarizabilities of the isotopologues (Tables
D and E). Again, the difference in vdW radii between isotopologues results in different atomic and,
consequently, molecular polarizabilities between H and D compounds, expressed as Da = aH – aD.
Being small, the changes in molecular properties brought about by isotopic substitution are not easily
measured experimentally. Therefore, we will employ these theoretical estimates of isotopic differences
to correlate and explain our experimental data on binding and isotope effects.
QSRR Analysis of the Total Isotope Effect. To investigate more quantitatively the nature of the
differences in intermolecular interactions of the stationary and mobile phases with solute molecules, we
performed QSRR analysis of the experimental isotope effects. In this case, too, it should be emphasized
that these isotope effects specifically measure only changes in the properties of the CH/CD bonds of the
solute upon transfer from the aqueous mobile phase to the hydrophobic stationary phase and thus isolate
separately the effect of the binding process upon just the solute.
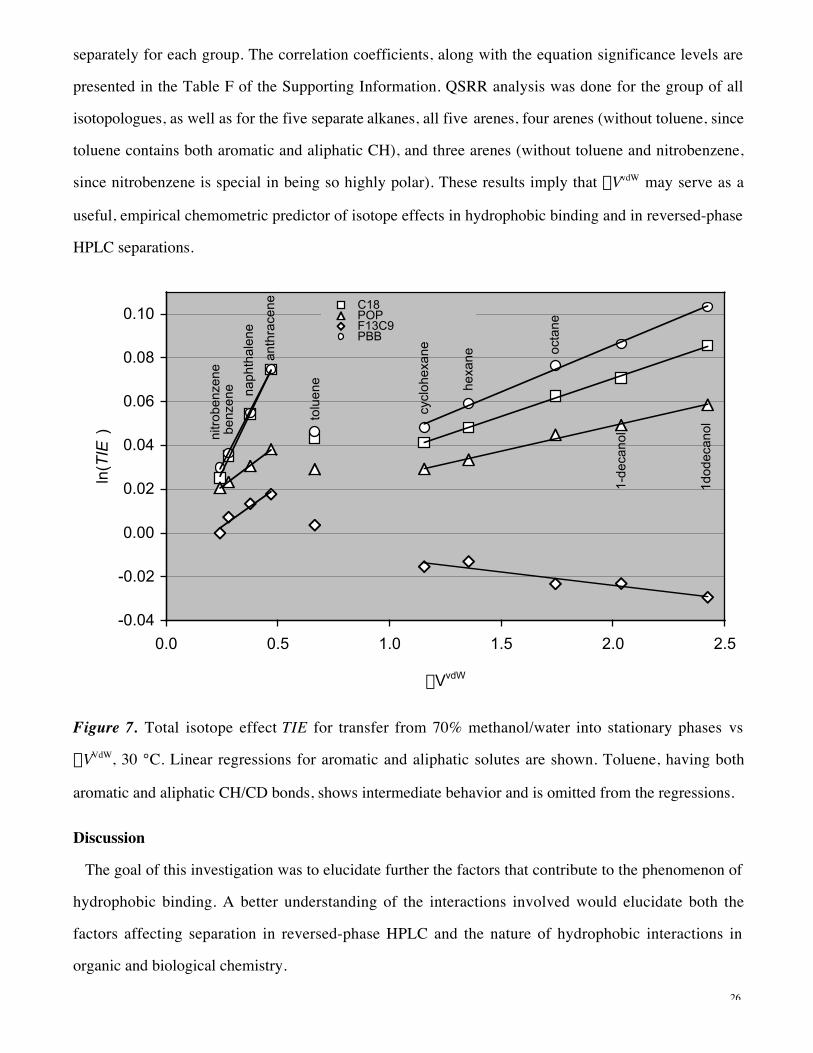
Molecular size descriptors in QSRR have been employed to elucidate the mechanisms of
chromatographic binding.44 Figure 7 represents the trends of the total isotope effect, TIE, with a 70%
methanol/water mobile phase vs the best descriptor found—the difference in van der Waals volumes
between isotopologues, DVvdW, for each solute. With all stationary phases, there is a clear distinction
between aliphatic and aromatic isotopologues. For most of the compounds, there are clear linear trends
within the aliphatic and aromatic groups separately, so additional correlation analysis was done
26
separately for each group. The correlation coefficients, along with the equation significance levels are
presented in the Table F of the Supporting Information. QSRR analysis was done for the group of all
isotopologues, as well as for the five separate alkanes, all five arenes, four arenes (without toluene, since
toluene contains both aromatic and aliphatic CH), and three arenes (without toluene and nitrobenzene,
since nitrobenzene is special in being so highly polar). These results imply that DVvdW may serve as a
useful, empirical chemometric predictor of isotope effects in hydrophobic binding and in reversed-phase
HPLC separations.
-0.04
-0.02
0.00
0.02
0.04
0.06
0.08
0.10
0.0 0.5 1.0 1.5 2.0 2.5
DVvdW
ln(T
IE)
C18POPF13C9PBBC18(aliph)POP(aliph)F13C9(aliph)PBB(aliph)C18(toluene)POP(toluene)F13C9(toluene)PBB(toluene)Linear (F13C9)Linear (POP)Linear (C18)Linear (PBB)Linear (F13C9(aliph))Linear (POP(aliph))Linear (C18(aliph))Linear (PBB(aliph))
nitr
oben
zene
benz
ene na
phth
alen
e
anth
race
ne
tolu
ene
cycl
ohex
ane
hexa
ne
octa
ne
1-de
cano
l
1dod
ecan
ol
Figure 7. Total isotope effect TIE for transfer from 70% methanol/water into stationary phases vs
DVVdW, 30 °C. Linear regressions for aromatic and aliphatic solutes are shown. Toluene, having both
aromatic and aliphatic CH/CD bonds, shows intermediate behavior and is omitted from the regressions.
Discussion
The goal of this investigation was to elucidate further the factors that contribute to the phenomenon of
hydrophobic binding. A better understanding of the interactions involved would elucidate both the
factors affecting separation in reversed-phase HPLC and the nature of hydrophobic interactions in
organic and biological chemistry.
27
Our QSRR analysis of binding to the ten reversed-phase HPLC stationary phases we investigated (cf.
Results) showed that the main driving force for binding is strongly dependent on the solute’s McGowan
characteristic volume. As indicated in Results, our QSRR data indicate that the binding to all of our
stationary phases, even including the p-nitrophenyl-containing phase NPO, is primarily hydrophobic in
nature.
The hydrophobic binding phenomenon is complicated by the fact that the free energy of binding
includes a combination of effects—both on the solute itself and on the aqueous and hydrophobic
phases—making it very difficult to determine the kinds of interactions that may be involved. By
examining isotope effects upon binding of deuterated vs. protiated solutes, we were able to dissect the
binding process and probe just the changes in interactions of the solute in the aqueous (mobile) vs the
hydrophobic (stationary) phases. This ability results from the fact that isotopic substitution does not
significantly affect potential energy, so that potential energy effects cancel between isotopologues and,
therefore, isotope effects result essentially only from the effects of changes in interactions upon nuclear
motions, especially vibrational frequencies. As shown in Results above, our measured values have high
reproducibility and thus differences between different types of solutes and stationary phases are highly
significant.
For these reasons, our observed %IE values isolate the effect of binding upon the solute alone and thus
show directly any differences in binding interactions of the solute in the hydrophobic, stationary phase
vs the aqueous, mobile phase. The fact that the observed values of %IE are different from zero
conclusively shows that the interactions of the solutes with the hydrophobic phase are different from
their interactions with the aqueous phase. This already constitutes the first important finding
demonstrated by our experiments: the solute is perturbed upon transfer from the aqueous phase to the
hydrophobic phase, i.e., hydrophobic binding is not simply a matter of how the aqueous vs the
hydrophobic phase solvates the solute, it also specifically involves different interactions of the solute
with the aqueous vs the hydrophobic phase, which affect the properties of the solute as well.
Positive values of %IE ( eq 4) arise when the protiated solute binds to the stationary phase more
strongly than the deuterated solute. This requires that the CH/CD bonds of the solute are less restricted
in the stationary phase than in the mobile phase. Less restricted motion indicates lower force constants
in the stationary phase than in the aqueous phase, i.e., weakening of the CH/CD bonds in the
hydrophobic phase relative to the aqueous phase. This in turn indicates that the interactions of the
28
solutes with the relatively nonpolar, hydrophobic stationary phases are stronger than those with the
polar, aqueous mobile phase. Our experiments show that this weakening occurs for most solutes with a
variety of stationary phases. This leads to the second important point demonstrated by our experiments:
the hydrophobic phase appears to play an active role in hydrophobic phenomena, i.e., lipophilic
phenomena make an important contribution to the hydrophobic effect.
As shown above in Results, values of %IE differ for different types of solutes and stationary phases,
also indicating an active role of the hydrophobic phase in hydrophobic phenomena. In fact, the results
suggest the possible involvement of CH/CD----p (aromatic) interactions as contributing to the observed
differences in isotope effects and hence in the binding process among different types of solutes and
hydrophobic phases. Figure 3 shows representative data, but the same trends are found in all of our data,
involving ten different solutes (cf. Table 1) and different mobile phase compositions (cf. Supporting
Information, Table A). A monotonic, rather linear increase in ln(%IE) with ln[a(CH2)], where a(CH2) is
the binding strength for a CH2 unit, is found for the five aromatic stationary phases studied. Even the
aliphatic stationary phases C18 and C8 give lower isotope effects than would be expected based on their
binding strength and their comparison with the isotope effects seen on the aromatic stationary phases.
Moreover, aromatic solutes (that is, aromatic CH/CD bonds) all exhibit higher %IE than aliphatic
solutes (that is, aliphatic CH/CD bonds) for all stationary phases except the very weakly binding, very
polar, MMA phase.
Our temperature-dependence studies also show that the binding process is enthalpy-driven (cf. Figure
5). QSRR analysis also indicates that the McGowan characteristic volume of the solute is the major
variable enhancing solute binding to all of these stationary phases (cf. eq 6 and Table 2). In addition, our
calculations of DVVdW, the difference in van der Waals volumes between isotopologues, reveal that it is
the best descriptor of the changes in %IE among different stationary phases (cf. Figure 7). The fluorous
stationary phase F13C9 shows an inverse dependence of %IE on DVVdW, entirely consistent with the fact
that such fluorous phases, including fluorous solvents, interact very weakly with, and phase-separate
from, both polar and hydrocarbon phases.45 Taken together, the data mutually support the conclusion
that binding to the stationary phases we have studied is dominated by London dispersion forces between
the solute and the stationary phase.
29
The differences noted between %IE for aromatic vs aliphatic stationary phases and solutes lead to a
plausible model which qualitatively explains these trends, as follows. It is well known that aromatic
rings have favorable edge-to-face interactions, including the herringbone structure for crystalline
benzene.46 It is also known that aliphatic CH complexes favorably with the p-face of aromatic rings.47
Such interactions appear likely to be present in the binding of solutes and stationary phases when either
or both contain an aromatic group. It would not be necessary for solutes to be bound entirely through
such complexation, but if on the average there were significant contributions from binding involving
aromatic p faces, this should directly affect the isotope effects. In particular, analogously to hydrogen
bonding, but a much smaller effect, the binding of CH/CD to an aromatic p face should lower the
CH/CD stretching vibrational frequency, and we suggest it is probable that this small frequency
lowering effect would still be larger than the frequency lowering effect that would be produced by
generalized London dispersion interactions. But also, we believe that use of aromatic p electrons to form
such complexes with CH bonds would, by this small degree of electron-withdrawal from the ring
carbons, lower by a small amount the stretching frequency of the CH/CD bonds of an aromatic solute,
which should then give enhanced isotope effects.
According to this model, the relatively high %IE values for aromatic solutes binding to aromatic
stationary phases would be the result of relatively strong aromatic CH/CD edge interactions with the
aromatic stationary phases. The lower, but still relatively high, isotope effects seen for aliphatic solutes
binding to aromatic stationary phases would be the result of effective aliphatic CH/CD interactions with
the aromatic stationary phases, which would give enhanced isotope effects, though not as large as those
resulting from aromatic–aromatic edge interactions. The isotope effects for aliphatic solutes binding to
aliphatic stationary phases C18 and C8 would not involve any of these aromatic interactions and so
would be smaller, but binding of aromatic solutes to the aliphatic stationary phases would involve
interaction of the p face of the aromatic solute with the aliphatic groups of the stationary phase, giving
enhanced isotope effects for aromatic as compared with aliphatic solutes binding to aliphatic stationary
phases.
We have also investigated plots of ln(%IE) vs ln[a(C4H2)], where a(C4H2) is the binding strength for
an aromatic C4H2 unit, but the correlation of isotope effect with binding strength of the aromatic unit is
not as good as with a(CH2), even for aromatic solutes with aromatic stationary phases. We believe this
30
results from the more specific interactions of aromatic groups that our model suggests. In this sense, the
values of a(CH2) may be thought of as reflecting less specific interactions involving London dispersion
forces along with, in the case of the aromatic stationary phases, the characteristic attractive interaction
between an aliphatic CH2 group and the p clouds of the aromatic stationary phases. Thus, use of a(CH2),
as in Figure 3, led to more readily interpretable differences and suggested the model we are proposing
here.
The fluorous stationary phases F13C9 and F5POP would be expected to have very weak interactions
with hydrocarbon solutes.45 The enthalpy measured for binding of a CH2 unit to the F13C9 stationary
phase is indeed considerably less negative than that for other stationary phases (cf. Figure 6). It would
then be possible that aliphatic solutes would have stronger London dispersion interactions with the
methanol present in the mobile phases and that, at sufficiently high % methanol, the total interactions
with CH/CD bonds of the solute could be larger within the mobile phase than within the F13C9 phase. As
a result, the CH/CD bonds would have slightly lower stretching vibrational frequencies in the mobile
phase than in the fluorous phase, which would in turn result in inverse isotope effects (%IE <1), as
observed for all five aliphatic solutes we have studied (70% methanol–water mobile phase, cf. Table 1).
Inverse isotope effects are also found for all five aliphatic solutes binding to F13C9 for mobile phase
compositions of 80% methanol–water and 60% acetonitrile–water (cf. Supporting Information, Table
A).
However, aromatic solutes give normal (%IE greater than 1), though quite small, isotope effects upon
binding to the F13C9 stationary phase. Both the binding of an aromatic C4H2 unit and its enthalpy of
binding are significantly weaker than for the aliphatic CH2 unit. A possible interpretation of this weak
binding for of the aromatic C4H2 unit is that, upon binding, aliphatic solutes do to some extent penetrate
into the fluorous F13C9 phase, but aromatic solutes may not penetrate so well in view of possible
repulsive interactions between the polar C–F bonds and the p electron clouds of the aromatic solutes. On
the other hand, the weak interactions of aromatic solutes might well involve weak attractive interactions
of the polar highly electronegative fluorine atoms with the aromatic H/D atoms, i.e., weak CH/CD----F
hydrogen bonding, which should cause lower CH/CD stretching frequencies and thus give normal
isotope effects. These effects are small, and so this can only be a suggestion at this point.
31
Finally, the MMA (methyl methacrylate ester) stationary phase exhibits even weaker binding of a CH2
unit than the F13C9 phase. The unique feature of MMA is that the isotope effects are very similar for
binding of both aliphatic and aromatic solutes. This similarity may result from the absence of specific
interactions with aromatic solutes and in that sense supports our model, which explains differences in
terms of characteristic p face and/or edge interactions. However, of all the stationary phases studied,
MMA is probably most likely to have significant amounts of adsorbed methanol equilibrated from the
mobile phase, and this methanol could also be involved in the binding process. From the very weak
binding observed, as well as the suggested interpretation of the similarity of isotope effects for aromatic
and aliphatic solutes, it may be that such methanol effects are minimal. But, because the possible
complications of this system cannot be ignored, any conclusion about MMA must remain speculative.
It might be suggested that aromatic solutes, being more polarizable than aliphatic, could have some
interaction with the silica core of the stationary phases to account for the larger isotope effects seen in
the aromatic series. However, we consider this possibility to be very improbable based on our QSRR
results discussed above, which indicate a binding mechanism dominated by London dispersion forces.
In addition, the fact that larger isotope effects are observed for larger aromatic solutes strongly argues
against this interpretation, since the larger aromatics should have less access to the inner core. At the
least, fewer of a larger aromatic solute’s CH/CD bonds could interact simultaneously with the core, so
that the larger the aromatic solute the less the average isotope effect per CH/CD should be affected by
the core, contrary to what is observed.
The model presented here constitutes our third point, suggested by our experiments: the active role of
the hydrophobic (stationary) phase can be explained by a plausible model which invokes specific
contributions—from (a) aromatic edge-to-face attractive interactions and (b) attractive interactions of
aliphatic groups with the p clouds of aromatic groups present as the solute or in the stationary phase.
So far we have discussed our studies of different types of stationary phases, which have shown that the
hydrophobic phase plays an active, attractive role in binding. Binding equilibria are of course controlled
by the difference in free energies of the solute in the stationary phase vs the mobile phase. To elucidate
possible interactions of solutes within the mobile phase, further investigation of the effect of the mobile
phase composition on the isotope effects was undertaken (cf. Figure 4). It is observed, as qualitatively
expected, that isotope effects decrease at higher % methanol in the mobile phase, in fact showing a
32
strong parallel with changes in a(CH2), the binding strength for a CH2 unit over the same range of
methanol concentrations. A leveling of isotope effects between 30–20% and 0% methanol is observed
for only C18 and fluorous and stationary phases, but not for PYE or PBB (aromatic) phases. This
leveling effect is difficult to understand at present, at least without trying to invoke highly specific and
speculative interactions. The problem is that, since it involves a different type of dependence on mobile
phase composition for different stationary phases, it cannot result directly from any interactions within
the mobile phase, since the solute and its interactions with the different mobile phase compositions are
the same no matter which stationary phase is being studied. Hence, the source of this leveling effect
must reflect phenomena associated with the stationary phases that would be somehow affected by
methanol concentration in different ways for the different types of stationary phases. Further
experiments on a variety of solutes seem necessary to test the generality and nature of this leveling
effect.
Aside from these leveling effects, however, the changes in isotope effect with mobile phase
composition can be explained by increased attractive interactions with the solute by mobile phases of
increasing methanol concentration. Such increases would be expected if the nonpolar methyl groups of
methanol molecules could orient toward and possibly complex with the solute molecule, resulting in a
more hydrophobic solute environment within the mobile phase, with interactions that start to resemble
those of the solute within the stationary phase. This in turn would decrease any differences in the
interactions of CH/CD within the stationary phase vs the mobile phase, and so decrease the isotope
effect. In fact, a possible explanation of these rather significant changes in isotope effects would be
along the lines of our model above. If methanol forms complexes with the p faces of aromatic solutes,
the change in isotope effects with increasing mobile phase methanol concentrations might be enhanced,
and might be a larger effect than for aliphatic solutes, which are expected to have less specific London
dispersion type interactions with methanol. This interpretation was suggested by experimental and
theoretical evidence supporting complexation of ethanol with aromatic rings as the source of observed
antihydrophobic cosolvent effects on rates of several organic reactions.48 Although a range of solutes
has not been studied over a wide range of methanol compositions, we have determined isotope effects
for all ten solutes investigated with 80, 70, and in some cases 60% methanol (cf. Supporting
Information, Table A). With very few exceptions, mostly involving the polar nitrophenyl NPO and
33
fluorous F13C9 stationary phases, plots of ln(%IE) vs % methanol uniformly give slopes about half as
great for aliphatic as for aromatic solutes. Hence the fourth point derived from our experiments is that
the sensitivity of isotope effects to changes in mobile phase composition is approximately half as great
for aliphatic as for aromatic solutes, results which are consistent with more specific interaction of
aromatic solutes with methanol probably involving HOCH3----p face complexation.
Though our data on temperature dependence are limited to four representative hydrophobic
(stationary) phases and only a few solutes (cf. Figures 6 and 7), they indicate that the transfer from
aqueous to hydrophobic phase is dominated by a negative enthalpy contribution, meaning that solutes
are more strongly bound by their interactions with the hydrophobic phase than those with the aqueous
phase. The entropy change is also found to be uniformly negative, showing that the motional freedom of
the solute is actually more restricted in the hydrophobic phase than in the aqueous phase. These results
lead to our fifth point: they imply that the hydrophobic phase packs and folds around the solute to give
significant binding interactions that appear also to restrict the motional freedom of the solute, while any
aqueous solvent cage around the hydrophobic solutes interacts less strongly and gives less restriction of
motional freedom.
Our calculations of isotopic property differences for different solutes show that the difference in van
der Waals volume of isotopologues, DVvdW for each solute is the best descriptor found for correlating the
observed isotope effects (cf. Figure 7). This empirical correlation provides a potentially useful means of
evaluating the isotope effects to be expected for more complex structures. We should emphasize that
DVvdW is a specific (calculated) property of individual solute molecules, a property which we find
empirically to be a good predictor of isotope effects. The fact that DVvdW is a good predictor, in spite of
the fact that it involves volume, not surface area (DSvdW, the corresponding surface area difference, was
found to be a less effective predictor of the observed isotope effects), suggests that DVvdW provides a
combined measure of possibilities for interactions, and in some empirically appropriate way
approximately combines aspects of surface area plus aspects of polarizability (expected to be volume-
dependent). This specific molecular property reflects the nature of all of the molecule’s CH/CD bonds
taken together, but does not depend directly on other parts of the molecular structure, and thus in turn
reflects the capacity of the molecule for interactions that would give altered CH/CD vibrational
frequencies upon transfer from the aqueous to the hydrophobic phase, resulting in isotope effects. Thus
34
our sixth point is that DVvdW may serve as an empirical, calculable chemometric predictor of isotope
effects for diverse structures.
In addition, these calculations serve as a sort of corroboration of our interpretations of the observed
isotope effects, that is, although we cannot directly make use of infrared data since the CH/CD
vibrational frequency shifts on transfer from the aqueous to the hydrophobic phase are small, these
computations provide an equivalent, alternative measure of expected isotope effects which is both
consistent with observations and capable of being used for predictive purposes for other structures.
Our data demonstrate significant molecular interactions with the solute upon its binding into
hydrophobic environments. The data also suggest interactions of methanol with the solute when it is in
the aqueous water–methanol environment. A model which invokes relatively specific aromatic edge-to-
face and alkyl–p face interactions with aromatic solutes as well as aromatic groups present as part of
hydrophobic phases is found to explain the differences observed among aromatic and aliphatic structural
types. While less specific interactions could conceivably explain our observations, the major trends
observed, all of which are consistently explained by our model, do rather strongly support this model at
least as a working hypothesis.
Conclusions
We have investigated the effects of (a) solute structure including both aliphatic and aromatic solutes,
(b) hydrophobic (stationary) phase structure, and (c) hydrophilic (mobile) phase composition on the
equilibrium transfer of solutes from hydrophilic to hydrophobic phases. In this way, we are able to
determine the importance and investigate the nature of each of these three variables. In particular, by
study of solute isotopologues we determined isotope effects, which constitute a unique probe of
hydrophobic binding, i.e., of the transfer of the solute from the aqueous to the various hydrophobic
phases. From this information we draw the following conclusions.
(1) The fact that the isotope effects change significantly with different hydrophobic (stationary) phases
demonstrates that lipophilic phenomena make an important contribution to the hydrophobic effect. The
solute is not passively transferred without change from the hydrophilic to the hydrophobic environment,
but rather the solute itself is perturbed by the change from one environment to the other.
(2) The fact that isotope effects are uniformly >1 (with the exception of one fluorous stationary phase,
F13C9—which is unique in having simultaneously hydrophobic and lipophobic properties)45 shows that
35
solute CH/CD bonds have stronger interactions in hydrophobic environments than in hydrophilic
environments.
(3) The differences in isotope effects among aromatic vs aliphatic solutes and among aromatic vs
aliphatic stationary phases can be nicely explained by a plausible model which invokes relatively
specific aromatic edge-to-face and alkyl–p face interactions with aromatic solutes as well as aromatic
groups present as part of hydrophobic phases.
(4) We find that mobile phase interactions, at least in the case of methanol–water mobile phases, also
influence the isotope effects; that is, the isotope effects are partially determined by interactions of at
least the mobile phase component methanol with solutes, and are not solely dependent on interactions of
solutes with the hydrophobic phase. The fact that the sensitivity of isotope effects to aqueous (mobile)
phase composition (% methanol in methanol–water mobile phases) is approximately half as great for
aliphatic as for aromatic solutes is also consistent with this model, in that specific interactions of
aromatic solutes with methanol in the mobile phase, probably involving HOCH3----p face complexation,
would be expected to cause an increased sensitivity to solvent composition of the isotope effects for
aromatic solutes.
(5) The enhanced binding of solutes within the hydrophobic phases also gives entropy effects which
indicate that the hydrophobic phases restrict the motional freedom of solutes even more than any
possible solvent cages present around hydrophobic solutes in the aqueous phase.
(6) The finding that DVvdW is the best empirical molecular property descriptor for chemometric
correlation of our observed isotope effects implies that calculated values of DVvdW may serve as a
valuable predictor of isotope effects for diverse structures in hydrophobic binding and in reversed-phase
HPLC separations.
Acknowledgment. We thank Japan Society for the Promotion of Science (JSPS) for post-doctoral
fellowships (P97379 to M. Turowski and P97273 to J. Meller) and the related Monbusho Grant-in-Aid,
allowing us to conduct the investigations reported here. We also express our gratitude to the Neos
company for their material support (columns).
Supporting Information Available: Tables A–F, details of adjustments to van der Waals radii and
calculation of atomic and molecular polarizabilities for isotopologues.
36
References
1 (a) Tanaka, N.; Thornton, E. J. Am. Chem. Soc. 1976, 98:6, 1617–1619. (b) Tanaka, N.; Thornton, E.
J. Am. Chem. Soc. 1977, 99:22, 7300–7306. (c) Lockley, W. J. S. J. Chromatogr. 1989, 483, 413–418.
2 Tanaka, N.; Hosoya, K.; Nomura, K.; Yoshimura, T.; Ohki, T.; Yamaoka, R.; Kimata, K; Araki, M.
Nature 1989, 341, 727–728.
3 Kimata, K.; Hosoya, K.; Araki, T.; Tanaka, N. Anal. Chem. 1997, 69, 2610–2612.
4 See also: Cartoni, G. P.; Ferreti, I. J. Chromatogr. 1976, 122, 287.
5 (a) Némethy, G.; Scheraga, H. A. J. Chem. Phys. 1962, 36, 3382–3400; 3401-3417. (b) Scheraga, H.
A. J. Biomol. Struct. Dyn. 1998, 16, 447–460. (c) Tanford, C. Science 1978, 200, 1012–1018. (d)
Tanford, C. The Hydrophobic Effect: Formation of Micelles and Biological Membranes, 2nd ed.; Wiley:
New York, 1980, and references therein. (e) Kyte, J. Biophys. Chem. 2003, 100, 193–202. (f) Southall,
N. T.; Dill, K. A.; Haymet, A. D. J. J. Phys. Chem. B 2002, 106, 521–533. (g) Southall, N. T.; Dill, K.
A. J. Phys. Chem. B 2000, 104, 1326–1331. (h) Huang, D. M.; Chandler, D. J. Phys. Chem. B 2002,
106, 2047–2053. (i) Hummer, G.; Garde, S.; García, A. E.; Pratt, L. R. Chem. Phys. 2000, 258,
349–370. (j) Soda, K. Adv. Biophys. 1993, 29, 1–54. (k) Waldbillig, R. C.; Szabo, G. Biochim. Biophys.
Acta 1979, 557, 295–305. (l) Helm, C. A.; Israelachvili, J. N.; McGuiggan, P. M. Science 1989, 246,
919–922. (m) Helm, C. A.; Israelachvili, J. N.; McGuiggan, P.M. Biochemistry 1992, 31, 1794–1805.
6 (a) Branden, C.; Tooze, J. Introduction to Protein Structure, 2nd ed.; Garland Publ.: New York, 1998.
(b) Némethy, G.; Scheraga, H. A. J. Phys. Chem. 1962, 66, 1773–1789; Erratum: J. Phys. Chem. 1963,
67, 2888. (c) Takano, K.; Yamagata, Y.; Yutani, K., J. Mol. Biol. 1998, 280(4), 749–761. (d) Baldwin,
R. L. Proc. Natl. Acad. Sci. USA 1986, 83(21), 8069–8072. (e) Tóth, G.; Murphy, R. F.; Lovas, S.
Protein Eng. 2001, 14, 543–547.
7 Balaz, S. Membrane Transport and Cellular Distribution. In Lipophilicity in Drug Design and
Toxicology; Methods and Principles in Medicinal Chemistry Vol. 4; Pliska, V.; Testa, B.; van de
Waterbeemd, H., Eds.; VCH: Weinheim, 1996; pp 295–308.
37
8 Hansch, C.; Kim, D.; Leo, A. J.; Novellino, E.; Silipo, C.; Vittoria, A. Crit. Rev. Toxicol. 1989, 19,
185–226.
9 (a) Hansch, C.; Maloney, P. P.; Fujita, T.; Muir, R. M., Nature 1962, 194, 178–180. (b) Fujita, T.;
Iwasa, J.; Hansch, C. J. Am. Chem. Soc. 1964, 86, 5175–5180. (c) Hansch, C.; Leo, A.; Hoekman, D.
Exploring QSAR, Vol. 2: Hydrophobic, Electronic, and Steric Constants, ACS Professional Reference
Books, Washington, D.C., 1995.
10 (a) Braumann, T. J. Chromatogr. 1986, 373, 191–225. (b) Dorsey, J. G.; Khaledi, M. G. J.
Chromatogr. 1993, 656, 485–499.
11 (a) Kaliszan, R. Quantitative Structure–Chromatographic Retention Relationships, John Wiley &
Sons, New York, 1987. (b) Nasal, A.; Sznitowska, M.; Bucinski, A.; Kaliszan, R. J. Chromatogr. A
1995, 692, 83–89.
12 (a) Krass, J. D.; Jastorff, B.; Genieser, H. G. Anal. Chem. 1997, 69, 2575–2581. (b) Valkó, K.;
Bevan, C.; Reynolds, D. Anal. Chem. 1997, 69, 2022–2029.
13 Streitwieser, A., Jr.; Klein, H. S. J. Am. Chem. Soc. 1964, 86, 5170–5173.
14 Wolfsberg, M. Acc. Chem. Res. 1972, 5, 225–233.
15 Isotope Effects in Chemical Reactions, ACS Monograph; Collins, C. J.; Bowman, N. S.; Eds., Van
Nostrand Reinhold Company, New York, 1970.
16 Streitwieser, A., Jr.; Klein, H. S. J. Am. Chem. Soc. 1963, 85, 2759–2763.
17 Do, U. H.; Lo, S. L.; Iles, J.; Rosenberger, T.; Tam, P.; Hong, Y.; Ahern, D. Prostagl. Leucotri. Ess.
Fatty Acids 1994, 50, 335–338.
18 Worth, G. K.; Retallack, R. W. Anal. Biochem. 1988, 174, 137–141.
19 Partial separation of istopically labeled peptides has been demonstrated; it was shown that such
incomplete separation could cause significant systematic errors in quantitative proteomics: Zhang, R.;
Sioma, C. S.; Wang, S.; Regnier, F. E. Anal. Chem. 2001, 73, 5142–5149.
38
20 Yu, L. R.; Johnson, M. D.; Conrads, T. P.; Smith, R. D.; Morrison, R. S.; Veenstra, T. D.
Electrophoresis 2002, 23, 1591–1598.
21 (a) Thornton, E. R. Ann. Rev. Phys. Chem. 1966, 17, 349–372. (b) Bartell, L. S. Tetrahedron Letters
1960, 6, 13–16. (c) Halevi, E. A.; Nussim, M.; Ron, A. J. Chem. Soc. 1963, 866–875.
22 Deuterium isotope effects in noncovalent interactions have been reviewed: Wade, D. Chem.-Biol.
Interact. 1999, 117, 191–217.
23 Tan. L. C.; Carr, P. W. J. Chromatogr. A 1997, 775, 1–12.
24 Vailaya, A.; Horváth, Cs. J. Chromatogr. A 1998, 829, 1–27.
25 (a) Dorsey, J. G.; Dill, K. A. Chem. Rev. 1989, 89, 331–346. (b) Dorsey, J. G.; Cooper, W. T. Anal.
Chem. 1994, 66 (17), 857A–867A.
26 Jaroniec, M. J. Chromatogr. 1993, 656, 37–50.
27 Zhao, J.; Carr, P. W. Anal. Chem. 1998, 70, 3619–3628.
28 Meller, J. Molecular Dynamics. http://folding.chmcc.org/publications/3048.doc. In Encyclopedia of
Life Sciences; http://www.els.net. Macmillan Reference Ltd., 2001.
29 Klatte, J. S.; Beck, T. L. J. Phys. Chem. 1996, 100, 5931–5934.
30 Kimata, K.; Hirose, T.; Moriuchi, K.; Hosoya, K.; Araki, T.; Tanaka, N. Anal. Chem. 1995, 67,
2556–2561.
31 Go, H., Sudo, Y., Hosoya, K., Ikegami, T., Tanaka, N. Anal. Chem. 1998, 70(19), 4086–4093.
32 Kaliszan, R. Structure and Retention in Chromatography. A Chemometric Approach, Harwood
Academic Publishers, Amsterdam, 1997.
33 Abraham, M. H.; Chadha, H. S.; Leitao, R. A. E.; Mitchell, R. C.; Lambert, W. J.; Kaliszan, R.;
Nasal, A.; Haber, P. J. Chromatogr. 1997, 766, 35–47.
39
34 (a) Tan, L. C.; Carr, P. W. J. Chromatogr. 1993, 656, 521–535. (b) Tan, L. C.; Carr, P. W.;
Abraham, M. H. J. Chromatogr. 1996, 752, 1–18.
35 Abraham, M. H. Chem. Soc. Rev. 1993, 73–83.
36 Buszewski, B.; Gadzala-Kopciuch, R. M.; Markuszewski, M.; Kaliszan, R. Anal. Chem. 1997, 69,
3277–3284.
37 (a) Kamlet, M. J.; Taft, R. W. J. Am. Chem. Soc. 1976, 98, 377–383. (b) Taft, R. W.; Kamlet, M. J.
J. Am. Chem. Soc. 1976, 98, 2886–2894.
38 In general, such picture is certainly too simplistic. However, since we consider only two families of
solute molecules, namely the aromatic and aliphatic hydrocarbons that share general patterns and shapes
of electronic density, the assumption that polarizability is proportional to volume within each family
should work quite well.
39 Miller, K. J. J. Am. Chem. Soc. 1990, 112, 8533–8542.
40 Nyburg, S. C.; Faerman C. H.; Prasad, L. Acta Cryst. 1987, B43, 106–110.
41 Ubbelohde, A. R. Trans. Faraday. Soc. 1936, 32, 525–529.
42 “IR and Mass Spectra” by NIST Mass Spec Data Center, S.E. Stein, director, in NIST Chemistry
WebBook, NIST Standard Reference Database Number 69, Eds. W.G. Mallard and P.J. Linstrom,
March 1998, National Institute of Standards and Technology, Gaithersburg MD, 20899
(http://webbook.nist.gov/).
43 Van Hook W. A.; Wolfsberg M. Z. Naturforsch. 1994, 49a, 563–577.
44 (a) Abraham, M. H.; McGowan, J. C. Chromatographia 1987, 23, 243–246. (b) Kamlet, M. J.;
Abraham, M. H.; Carr, P. W.; Doherty, R. M.; Taft, R. W. J. Chem. Soc. Perkin Trans. 1988, 2,
2087–2092. (c) Kaliszan, R.; Nasal, A.; Turowski, M. Biomed. Chromatogr. 1995, 9, 211–215.
45 (a) Cornils, B. Angew. Chem., Int. Ed. Engl. 1997, 36, 2057–2059. (b) Horváth, I. T.; Rábai, J.
Science 1994, 266, 72–75.
40
46 (a) Jennings, W. B; Farrell, B. M.; Malone, J. F. Acc. Chem. Res. 2001, 34, 885–894. (b) Tsuzuki,
S.; Honda, K.; Uchimaru, T.; Mikami, M.; Tanabe, K. J. Am. Chem. Soc. 2002, 124, 104–112.
47 (a) Nishio, M.; Umezawa, Y.; Hirota, M.; Takeuchi, Y. Tetrahedron 1995, 51, 8665–8701. (b)
Tsuzuki, S.; Honda, K.; Uchimaru, T.; Mikami, M.; Tanabe, K. J. Am. Chem. Soc. 2000, 122,
3746–3753.
4848 (a) Breslow, R.; Groves, K.; Mayer, M. U. J. Am. Chem. Soc. 2002, 124, 3622–3635. (b) Breslow,
R.; Groves, K.; Mayer, M. U. Pure Appl. Chem. 1998, 70, 1933–1938.
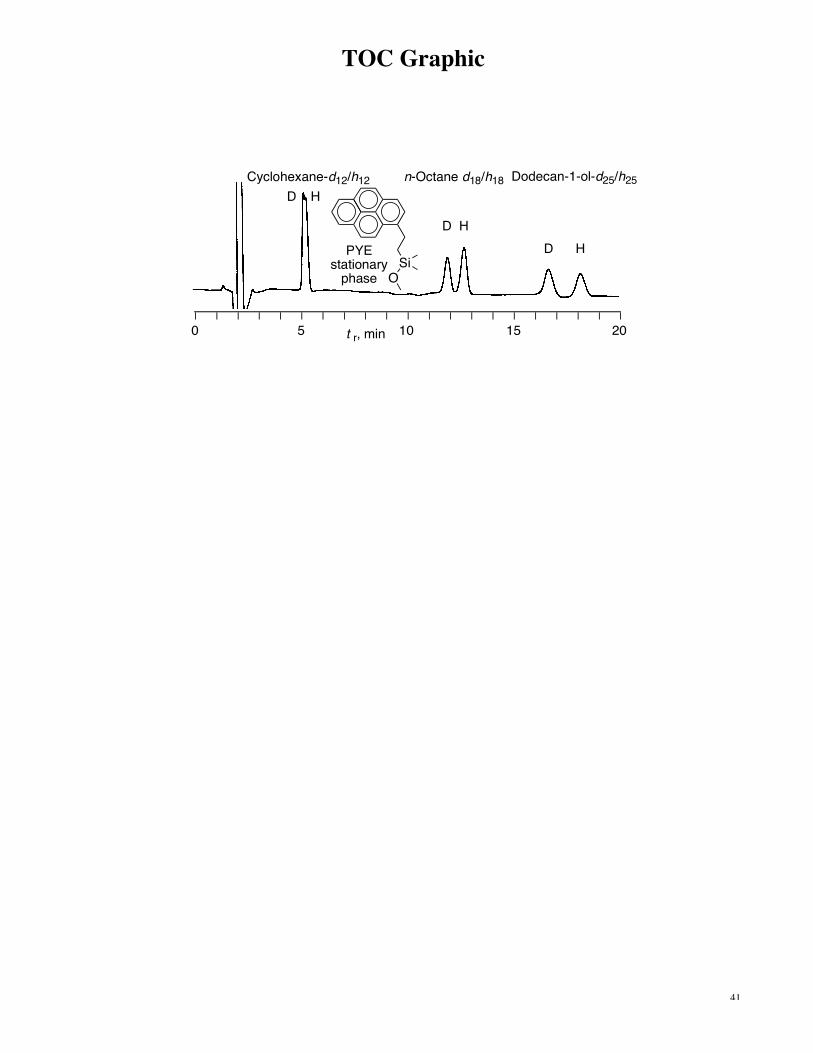
41
TOC Graphic
t r, min0 5 10 15 20
SiO
PYEstationary
phase
Cyclohexane-d12/h12 n-Octane d18/h18 Dodecan-1-ol-d25/h25
HDD
D
H
H