Culture Lab Detroit and Museum of Contemporary Art Detroit ...

FIVE-YEAR ECONOMIC IMPACT ANALYSIS OF THE
DETROIT ZOO PRESENTED TO THE DETROIT ZOOLOGICAL SOCIETY
FEBRUARY 12
2019

February 12, 2019
Mr. Paul GoodCommunity and Government Relations ManagerDetroit Zoological Society8450 West 10 Mile RoadRoyal Oak, MI 48067
Dear Mr. Good:
We have completed the study process for an updated analysis of the economic impacts
associated with the Detroit Zoo (Zoo) for the five-year period spanning 2014 through 2018.
Over the past several months, CSL has worked closely with Detroit Zoological Society
leadership and staff in conducting research into the many ways in which the operations of the
Zoo provide a quantifiable economic impact locally and throughout the state of Michigan.
The generation of economic impacts associated with the Zoo requires the coordinated effort
of the highly qualified Zoo staff and management team, the public sector (through support in
funding Zoo operations), the private sector (through vendors and suppliers working with the
Zoo), and the thousands of volunteers that provide an invaluable service to a highly valued
community asset. The purpose of this study is to develop an impact model using conservative
assumptions in order to present supportable estimates of community-wide benefits associated
with the Detroit Zoo.
We sincerely appreciate the assistance and cooperation we have been provided in the
completion of this report and would be pleased to be of further assistance in the
interpretation and application of our findings.
Very truly yours,
CSL International

TABLE OF CONTENTS
EXECUTIVE SUMMARY
1.0 | PROJECT BACKGROUND & INTRODUCTION
2.0 | DETROIT ZOO IMPACT ANALYSIS
2.1 ZOO FINANCIAL OPERATIONS
2.2 ZOO VENDOR SPENDING
2.3 ZOO VISITOR SPENDING
2.4 TOTAL DIRECT SPENDING, OUTPUT, EARNINGS AND EMPLOYMENT
1
3
4
5
6
10

EXECUTIVE SUMMARY
The 125-acre Detroit Zoo (Zoo) opened in 1928 and recently celebrated its 90th anniversary. The Zoo
attracts an average of nearly 1.5 million guests per year. These visitors are able to experience and enjoy
more than 2,400 animals among 235 different species, a wide variety of world-class habitats and a
growing number of interactive educational programs. The Zoo has continued to make significant
investments throughout the campus in recent years. Totaling more than $40 million, these projects have
added to and improved the Zoo’s habitats and visitor amenities.
Over the past several months, CSL has worked closely with Detroit Zoological Society (DZS) leadership
to conduct extensive research into the many ways in which the Detroit Zoo serves as a vital community
asset and helps support the generation of significant economic impacts within the community. This effort
seeks to update these impacts for the five-year period spanning 2014 through 2018. As part of the analysis
process, extensive data with respect to Zoo operations, attendance levels, and other such factors have
been analyzed. A summary of the various impacts generated as part of this report is presented below.
Over the past five years, the Zoo has attracted a total of nearly 7.5 million visitors,
or an average of approximately 1.5 million annual attendees. The number of Zoo
visitors reached a high of nearly 1.7 million in 2016, with the opening of the
Polk Penguin Conservation Center.
⦁Total Output, which represents the re-spending of dollars in the economy, has ranged
from a low of approximately $154 million in 2014 to more than $196 million in 2015.
The financial operations of the Zoo itself represent nearly half of this total output.
This compares to approximately 44 percent from visitor spending (outside of the Zoo)
and eight percent from the Zoo’s third-party food/beverage and gift shop services provider.
⦁Over the past five years, approximately 46 percent of the total output generated by
Zoo-related visitor spending takes place among people residing outside of Michigan.
This compares to 31 percent for those residing outside of the tri-county metro area
(but within Michigan) and 23 percent from local visitors.
⦁In 2018, the Zoo supported more than $65 million in earnings
and an estimated 1,916 full- and part-time jobs.
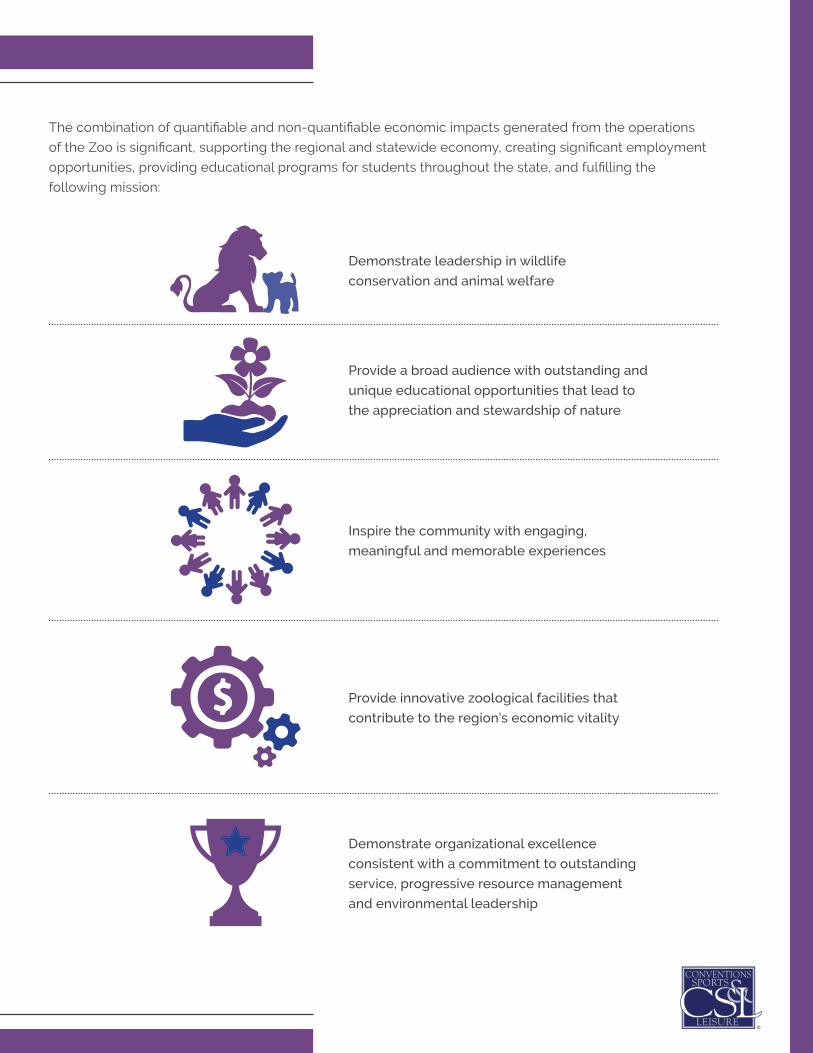
The combination of quantifiable and non-quantifiable economic impacts generated from the operations
of the Zoo is significant, supporting the regional and statewide economy, creating significant employment
opportunities, providing educational programs for students throughout the state, and fulfilling the
following mission:
Demonstrate leadership in wildlife
conservation and animal welfare
Provide a broad audience with outstanding and
unique educational opportunities that lead to
the appreciation and stewardship of nature
Inspire the community with engaging,
meaningful and memorable experiences
Provide innovative zoological facilities that
contribute to the region’s economic vitality
Demonstrate organizational excellence
consistent with a commitment to outstanding
service, progressive resource management
and environmental leadership

2014HIGHLIGHTS
2016HIGHLIGHTS
2018HIGHLIGHTS
2015HIGHLIGHTS
2017HIGHLIGHTS
Construction started on the Polk Penguin Conservation Center. At $32 million, it was the largest project ever undertaken by the Zoo.
The $1.8 million Cotton Family Wolf Wilderness was completed. This 2-acre habitat provides a beautiful, naturalistic home for gray wolves.
The Polk Penguin Conservation Center opened to the public. Noted as the most extraordinary center for penguins in the world, the facility includes a 326,000- gallon, 25-foot-deep aquatic area for the 75 penguins to explore. The 33,000-square-foot building offers an underwater gallery with large acrylic windows and two acrylic tunnels to provide 360-degree views of the birds from all angles.
The Zoo began a $2 million expansion of the giraffe habitat. The first two phases of this project included doubling the space within the giraffe holding building, rehabilitating the exterior of the facility, as well as expanding and improving the outdoor yard. The final phase is still in progress and will include a redesigned, larger entry plaza to improve the guest experience.
Construction was completed on a $1.4 million anaerobic digester that converts animal waste into energy. This complex provides a renewable energy resource that helps power the Ruth Roby Glancy Animal Hospital Complex.
A new $650,000 aquatic habitat was built for Japanese giant salamanders inside the National Amphibian Conservation Center immersion gallery.
DZS partnered with Buddy’s Pizza to open a Buddy’s restaurant at the Zoo. The $1.2 million stand-alone facility seats 163 guests and features a rooftop deck that provides views of the Zoo’s grounds.
The Holtzman Wildlife Foundation Red Panda Forest was completed at a cost of $800,000 and includes a new indoor holding area, a flowing stream, a larger arboreal pathway, and additional land for exploration. It also includes an elevated rope bridge that guests can use to walk across and experience the habitat.
Construction began on the Devereaux Tiger Forest, which is expected to cost $3 million and will triple the size of the tiger habitat. The habitat will feature a new water pool with a recirculation system, dead-fall and activity logs, as well as a new landscape. Public viewing and landscape areas will also be remodeled.
1
The Zoo has continued to make significant investments throughout the campus in recent years. Totaling
more than $40 million, these projects have added to and improved the Zoo’s habitats and visitor amenities.
A summary of the ongoing efforts to build on the Zoo’s success is presented below.
The 125-acre Detroit Zoo (Zoo) opened in 1928 and recently celebrated its 90th anniversary. The Zoo is op-
erated by the Detroit Zoological Society (DZS), which currently employs more than 290 full- and part-time
people, along with the assistance of more than 1,000 volunteers donating in excess of 100,000 hours of
their time each year. Together, the highly professional staff, thousands of volunteers, and essential private
sector partners work to support the operations of the Zoo.
The Zoo attracts an average of nearly 1.5 million people per year. These visitors are able to experience
and enjoy more than 2,400 animals among 235 species, a wide variety of world-class habitats and a
growing number of interactive educational programs. Major habitats include the Polk Penguin Conservation
Center, Arctic Ring of Life, Australian Outback Adventure, Great Apes of Harambee, National Amphibian
Conservation Center, Holden Reptile Conservation Center and Butterfly Garden.
1.0 | PROJECT BACKGROUND & INTRODUCTION

Over the past several months, CSL has worked closely with DZS leadership to conduct extensive research
into the many ways in which the Detroit Zoo serves as a vital community asset and helps support the
generation of significant economic impacts within the community. This analysis builds on a previously
conducted analysis by CSL in which we evaluated the economic impacts of the Detroit Zoo in 2013.
This effort seeks to update these impacts for the five-year period spanning 2014 through 2018.
the DZS recently completed an update to its Physical Master Plan - a 13-year, $83 million plan that is to be
implemented in three primary phases between 2011 and 2024. The phasing approach considers timing of
important new guest experiences, the impact of construction on surrounding areas of the Zoo,
and maintaining the guest access/experience. In addition to this plan, the Zoo is also planning for the
development of a $15 million facility called the Great Lakes Nature Center, which will focus on the water
and wildlife of the Great Lakes and will be situated in Macomb County.
ADDITIONALLY,
2

2.0 | DETROIT ZOO IMPACT ANALYSIS
The purpose of this section of the analysis is to summarize the findings and supporting research with
respect to the quantifiable economic impacts of the operation and investment in the Detroit Zoo over the
five-year period spanning 2014 through 2018. We have worked closely with DZS staff to develop an
understanding of the various financial operating and visitor spending sources that comprise economic im-
pact. Spending generated by Zoo operations and vendors has been taken from various audited financial
reports. In conducting this analysis, we have measured the economic impacts generated from three
specific Zoo-related sources as described below.
ZOO FINANCIAL OPERATIONS includes all expenditures made to operate the Zoo.
ZOO VENDOR SPENDING includes the expenditures made by the Zoo’s third-party food/beverage
and gift shop vendor that are not included in the Zoo’s financial statements.
ZOO VISITOR SPENDINGincludes only spending taking place outside the Zoo. Any spending that
takes place inside the Zoo is accounted for in the Zoo’s financial operations.
A summary of key assumptions and
resulting impacts associated with each of
these sources is presented throughout the
remainder of this section.
3

2.1 | ZOO FINANCIAL OPERATIONS
Each year, the Zoo spends millions of dollars on labor, services, supplies, equipment, conservation,
marketing, utilities, insurance, large-scale capital improvement projects and other such expenses. Such
spending creates significant impacts on the community and the region. As part of this analysis, we have
reviewed the financial operations for the Detroit Zoo over the past several years. A summary of DZS
expenditures between 2014 and 2018 is presented below.
SUMMARY OF DZS OPERATING EXPENSES (2014 – 2018)
2014 2015 2016 2017 2018
$10,000,000
$0
$20,000,000
$30,000,000
$40,000,000
$50,000,000
$60,000,000
$70,000,000
$41,381,811
$61,020,087
$51,027,851
$42,998,565
$47,837,550
As presented, total DZS expenditures have ranged from a low of approximately $41 million in 2014 to a high
of more than $61 million in 2015. It is important to note that figures for 2015 include nearly $25 million in capital
improvement spending, largely representing investment in the development of the Polk Penguin Conservation
Center. These expenses are supported primarily by operating revenue generated from visitor purchases at
the Zoo. In addition, public sector support is provided to ensure that the Zoo remains a highly professional
entertainment and educational asset for the community. These financial operating data are applied to
economic impact multipliers, as discussed later in this section.
4
2.2 | ZOO VENDOR SPENDING
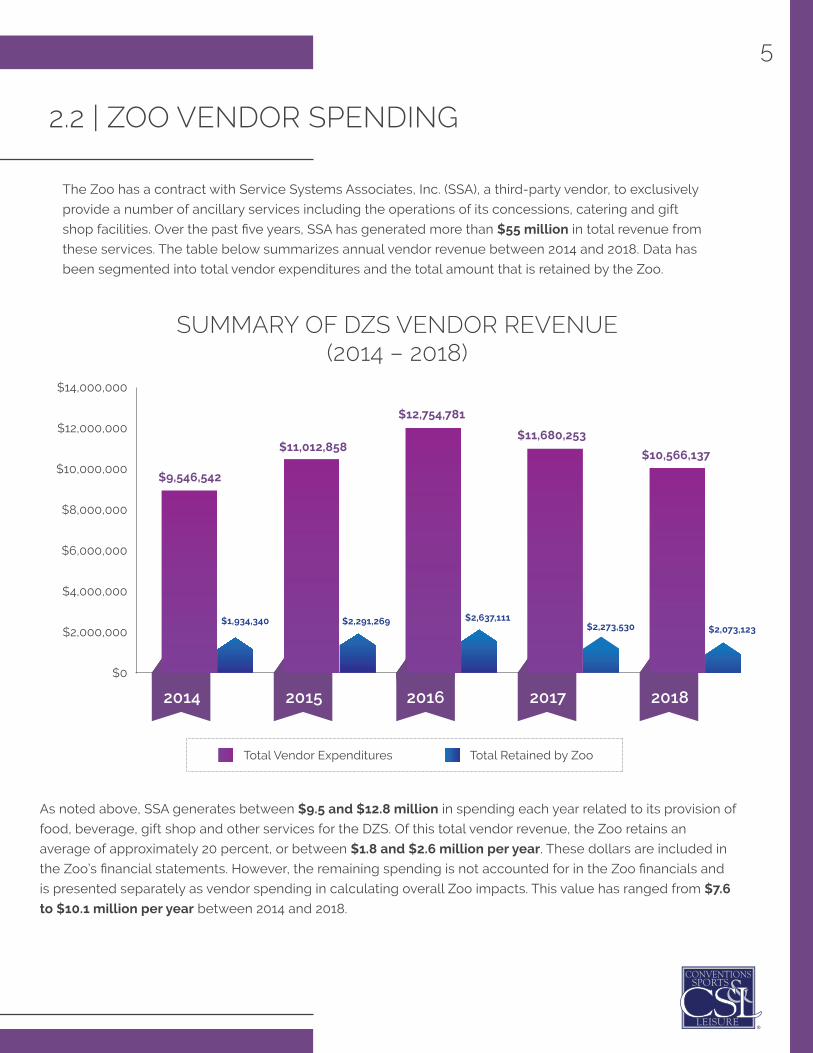
The Zoo has a contract with Service Systems Associates, Inc. (SSA), a third-party vendor, to exclusively
provide a number of ancillary services including the operations of its concessions, catering and gift
shop facilities. Over the past five years, SSA has generated more than $55 million in total revenue from
these services. The table below summarizes annual vendor revenue between 2014 and 2018. Data has
been segmented into total vendor expenditures and the total amount that is retained by the Zoo.
SUMMARY OF DZS VENDOR REVENUE (2014 – 2018)
As noted above, SSA generates between $9.5 and $12.8 million in spending each year related to its provision of
food, beverage, gift shop and other services for the DZS. Of this total vendor revenue, the Zoo retains an
average of approximately 20 percent, or between $1.8 and $2.6 million per year. These dollars are included in
the Zoo’s financial statements. However, the remaining spending is not accounted for in the Zoo financials and
is presented separately as vendor spending in calculating overall Zoo impacts. This value has ranged from $7.6
to $10.1 million per year between 2014 and 2018.
5
$2,000,000
$0
$4,000,000
$6,000,000
$8,000,000
$10,000,000
$12,000,000
$14,000,000
$9,546,542
$11,012,858
$12,754,781
$11,680,253
$10,566,137
2014 2015 2016 2017 2018
Total Vendor Expenditures Total Retained by Zoo
$1,934,340 $2,291,269 $2,637,111$2,273,530 $2,073,123
2.3 | ZOO VISITOR SPENDING
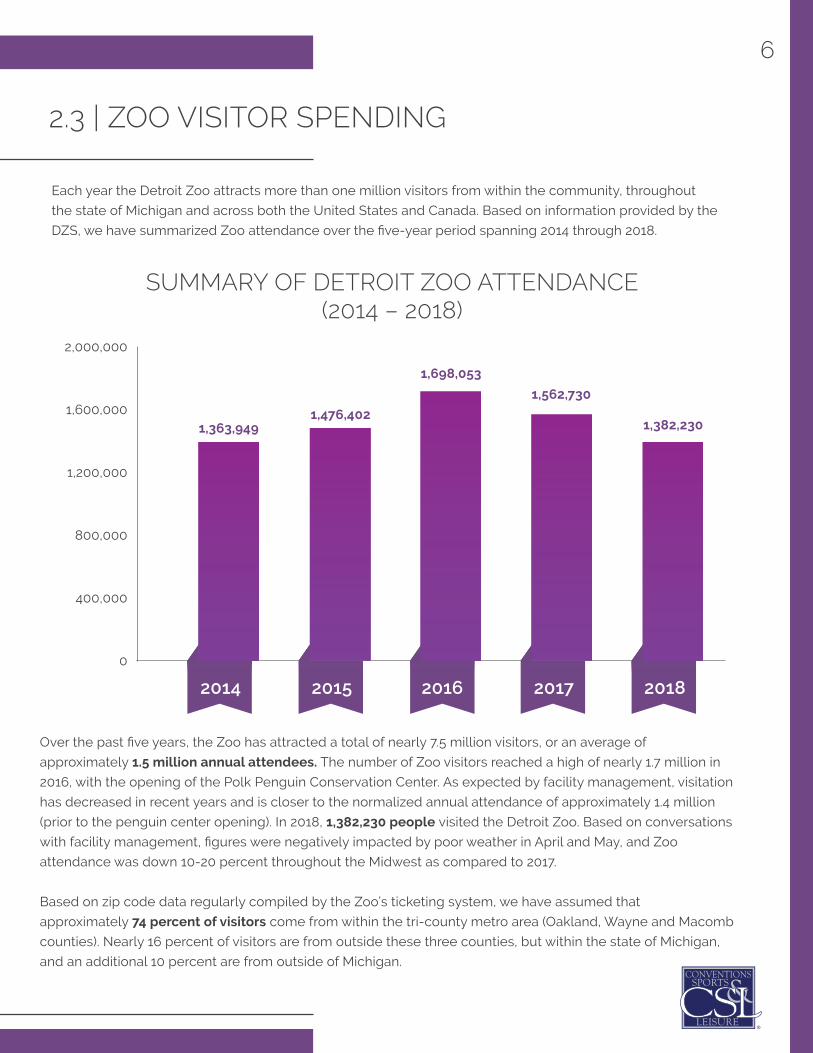
Each year the Detroit Zoo attracts more than one million visitors from within the community, throughout
the state of Michigan and across both the United States and Canada. Based on information provided by the
DZS, we have summarized Zoo attendance over the five-year period spanning 2014 through 2018.
SUMMARY OF DETROIT ZOO ATTENDANCE (2014 – 2018)
2014 2015 2016 2017 2018
0
400,000
800,000
1,200,000
1,600,000
2,000,000
1,363,9491,476,402
1,698,053
1,562,730
1,382,230
Over the past five years, the Zoo has attracted a total of nearly 7.5 million visitors, or an average of
approximately 1.5 million annual attendees. The number of Zoo visitors reached a high of nearly 1.7 million in
2016, with the opening of the Polk Penguin Conservation Center. As expected by facility management, visitation
has decreased in recent years and is closer to the normalized annual attendance of approximately 1.4 million
(prior to the penguin center opening). In 2018, 1,382,230 people visited the Detroit Zoo. Based on conversations
with facility management, figures were negatively impacted by poor weather in April and May, and Zoo
attendance was down 10-20 percent throughout the Midwest as compared to 2017.
Based on zip code data regularly compiled by the Zoo’s ticketing system, we have assumed that
approximately 74 percent of visitors come from within the tri-county metro area (Oakland, Wayne and Macomb
counties). Nearly 16 percent of visitors are from outside these three counties, but within the state of Michigan,
and an additional 10 percent are from outside of Michigan.
6

CALCULATION OF DIRECT SPENDING
Through the attraction of visitors, the ongoing operation of the Zoo generates direct spending. In order
to estimate this spending (also termed change in final demand), we have developed a unique model to
incorporate various performance measures associated with DZS operations, including attendance, visitor
origination (local, regional and national), and a set of assumptions for per-person spending.
We have also made various assumptions with respect to per-person spending within a variety of industry
sectors including lodging, food and beverage, fuel, and other such expenditures among visitors from
each of these geographic areas. These assumptions focus on the percentage of visitors that make
purchases outside of the Zoo, and the value of these purchases. The spending data were derived from a
report conducted by Longwoods International for the Michigan Economic Development Corporation in
late 2016 that provides detailed information with regard to visitor and travel spending in Michigan. The
assumptions used in this analysis have been developed in conjunction with DZS management and
consider our 2013 analysis of the economic impacts of the Detroit Zoo, various other major market zoo
impact studies conducted nationally, as well as our own past economic impact research for the Detroit
Riverfront and associated events and activities. The following chart identifies the various sources
of direct spending included in this analysis.
7
DETROIT ZOO ATTENDEE SPENDING
RESTAURANTS FUEL LODGING RETAIL OTHER
TOTAL ZOO DIRECT SPENDING
DETROIT ZOO OPERATIONS & VENDORS
CAPITAL PROJECTS UTILITIES MAINTENANCE SUPPLIES SALARIES

8
THE FOLLOWING TYPES OF ASSUMPTIONS HAVE BEEN MADE IN QUANTIFYING ZOO-RELATED DIRECT SPENDING.
VISITORS FROM THE
TRI-COUNTY METRO AREA⦁• 30 percent visit restaurants outside the Zoo,
spending an average of $22.89 per person.
• Other spending (entertainment, retail, etc.)
accounts for $2.00 per person.
• The resulting total spending per person for
this category is $8.87 per person.
VISITORS FROM OUTSIDE THE
METRO AREA BUT STILL WITHIN THE STATE • Visitors spend approximately two days and two nights in the market.
• 40 percent visit restaurants outside the Zoo, spending an average of $30 per person per day.
• 50 percent purchase fuel at $50 per tank with three people per party.
• 25 percent stay at hotels and pay an average nightly rate of $135 (three people per party).
• Other spending (entertainment, retail, etc.) accounts for $4.00 per person.
• The resulting total spending per person for this category is $58.83 per person.
VISITORS FROM
OUTSIDE OF MICHIGAN• Visitors spend approximately two days and two nights in the market.
⦁• 90 percent visit restaurants outside the Zoo, spending an average of $30 per person per day.
⦁• 90 percent purchase fuel at $50 per tank with three people per party.
⦁• 65 percent stay at hotels and pay an average nightly rate of $135 (three people per party).
⦁• Other spending (entertainment, retail, etc.) accounts for $6.00 per person.
⦁• The resulting total spending per person for this category is $127.50 per person.
Based on these and other assumptions, we have calculated that visitors from within the
tri-county area spend an average of $8.87 per person per trip. Visitors from other areas of the
state spend approximately $58.83 per person, and people from outside of Michigan spend an
estimated $127.50 per person. The higher spending among out-of-state visitors is largely
driven by hotel and restaurant spending.
TRI-COUNTY
OUT OF STATE
IN MICHIGAN
9
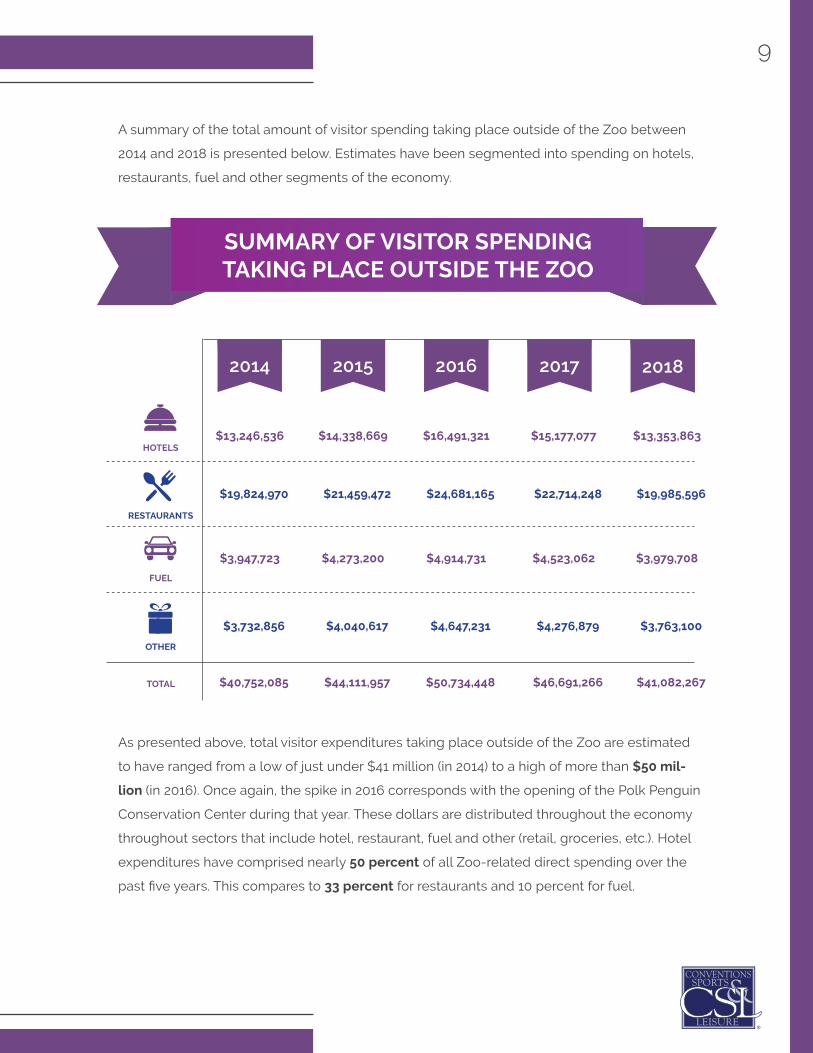
A summary of the total amount of visitor spending taking place outside of the Zoo between
2014 and 2018 is presented below. Estimates have been segmented into spending on hotels,
restaurants, fuel and other segments of the economy.
SUMMARY OF VISITOR SPENDING TAKING PLACE OUTSIDE THE ZOO
RESTAURANTS
FUEL
HOTELS
OTHER
2014 2015 2016 2017 2018
TOTAL
$13,246,536 $14,338,669 $15,177,077 $13,353,863$16,491,321
$3,947,723 $4,273,200 $4,523,062 $3,979,708$4,914,731
$40,752,085 $44,111,957 $46,691,266 $41,082,267$50,734,448
$19,824,970 $21,459,472 $22,714,248 $19,985,596$24,681,165
$3,732,856 $4,040,617 $4,276,879 $3,763,100$4,647,231
As presented above, total visitor expenditures taking place outside of the Zoo are estimated
to have ranged from a low of just under $41 million (in 2014) to a high of more than $50 mil-
lion (in 2016). Once again, the spike in 2016 corresponds with the opening of the Polk Penguin
Conservation Center during that year. These dollars are distributed throughout the economy
throughout sectors that include hotel, restaurant, fuel and other (retail, groceries, etc.). Hotel
expenditures have comprised nearly 50 percent of all Zoo-related direct spending over the
past five years. This compares to 33 percent for restaurants and 10 percent for fuel.

2.4 | TOTAL DIRECT SPENDING, OUTPUT, EARNINGS AND EMPLOYMENT
The operation of a major Zoo facility can generate significant visitation and associated economic impacts
within a community and region. The expenses incurred to maintain the Zoo, and the business generated by
vendors working at the Zoo also generate significant economic impacts. In terms of quantifiable economic
impacts presented in this report, effects are characterized in terms of direct spending, total output,
personal earnings and employment. These terms are defined below.
10
DIRECT SPENDING represents the initial change in final demand (or spending) generated directly by the
operations of the Zoo and the visiting patrons and groups. For this report, we accumulate
all direct spending in order to measure the “economic footprint” of the Zoo operations
within the regional economy. We have not focused on issues of “net new” spending, as it
is very difficult to define the likely spending patterns for visitors were the Zoo not to exist.
TOTAL OUTPUTrepresents the total direct, indirect and induced spending effects generated
by the Zoo. This calculation measures the total dollar change in output that
occurs in the local economy for each dollar of direct spending generated by
Zoo operations and visitation.
INDUCED EFFECTSconsist of the positive changes in employment, earnings and tax collections generated
by changes in population associated with the direct and indirect expenditures.
The re-spending of dollars in an economy (encompassing the indirect and induced spending) is estimated
by utilizing economic multipliers specific to the local economy and applying them to the amount
of direct, or initial spending. The multipliers illustrate that spending in a defined economy will lead to
additional spending until that dollar has completed its cycle through leakage. Leakage represents the
portion of a dollar spent in areas outside the designated economy.
11
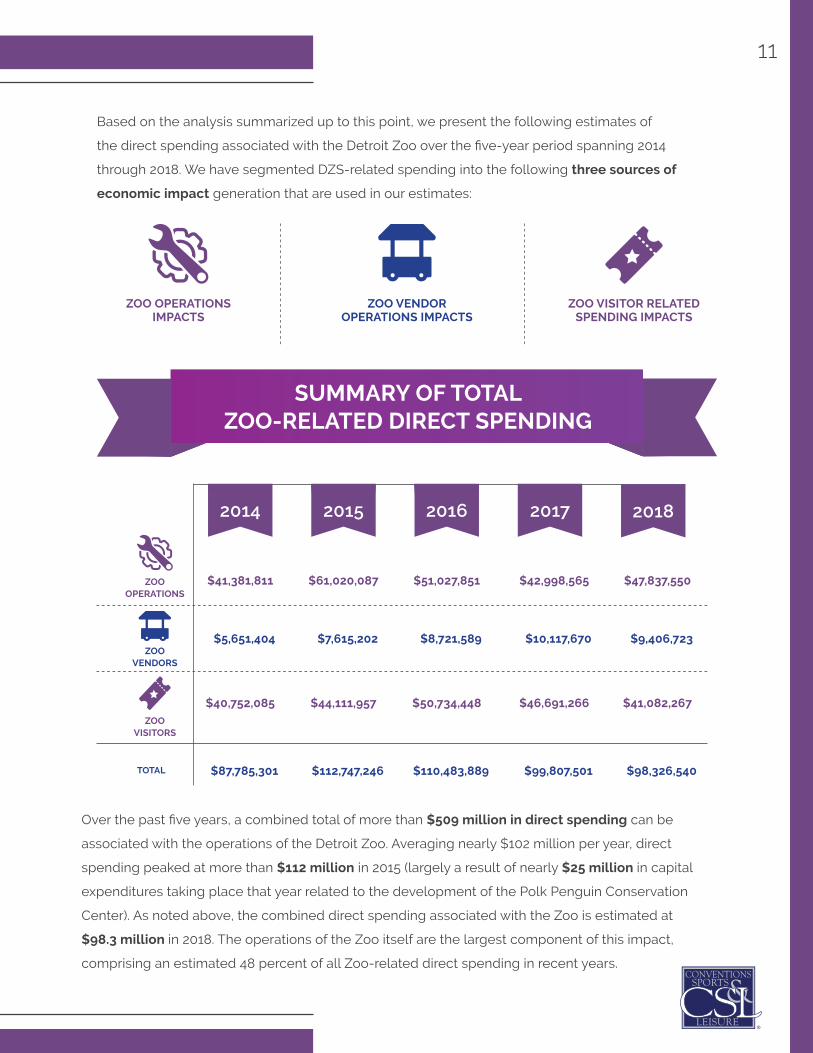
Based on the analysis summarized up to this point, we present the following estimates of
the direct spending associated with the Detroit Zoo over the five-year period spanning 2014
through 2018. We have segmented DZS-related spending into the following three sources of
economic impact generation that are used in our estimates:
SUMMARY OF TOTAL ZOO-RELATED DIRECT SPENDING
Over the past five years, a combined total of more than $509 million in direct spending can be
associated with the operations of the Detroit Zoo. Averaging nearly $102 million per year, direct
spending peaked at more than $112 million in 2015 (largely a result of nearly $25 million in capital
expenditures taking place that year related to the development of the Polk Penguin Conservation
Center). As noted above, the combined direct spending associated with the Zoo is estimated at
$98.3 million in 2018. The operations of the Zoo itself are the largest component of this impact,
comprising an estimated 48 percent of all Zoo-related direct spending in recent years.
ZOO OPERATIONS IMPACTS
ZOO VISITOR RELATED SPENDING IMPACTS
ZOO VENDOR OPERATIONS IMPACTS
2014 2015 2016 2017 2018
TOTAL
$41,381,811 $61,020,087 $42,998,565 $47,837,550$51,027,851
$40,752,085 $44,111,957 $46,691,266 $41,082,267$50,734,448
$5,651,404 $7,615,202 $10,117,670 $9,406,723$8,721,589
$87,785,301 $112,747,246 $99,807,501 $98,326,540$110,483,889
ZOO OPERATIONS
ZOO VENDORS
ZOO VISITORS

Multipliers are also used to calculate the amount of earnings associated with direct spending, as well as the
resulting full- and part-time employment impacts. The multiplier effect is estimated in this analysis using a
regional economic forecasting model provided by the IMPLAN Group, Inc., a private economic modeling
company. The IMPLAN system utilizes an input-output matrix with specific data for multipliers based on
regional business patterns from across the country. Financial information for the matrix of multipliers is
collected from various sources that include, but are not limited to, the U.S. Department of Labor, as well as
state sales and tax reports. The system utilizes this data to determine the economic independence of
specific geographic regions, as well as the interdependence which exists between industries in those regions.
The systems provide total industry output, personal earnings and employment data for approximately
540 industry segments.
is applied to economic impact multipliers in order to measure the indirect and induced spending. Combined,
the direct, indirect and induced spending is referred to as total output. Stated another way, the initial direct
spending of new dollars into an economy begins a series of transactions in which the dollars are cycled
through the economy. The re-spending of the dollars is estimated by utilizing the economic multipliers and
applying them to the amount of direct, or initial, spending. The multiplier illustrates that spending in a defined
economy will lead to additional spending until that dollar has completed its cycle through leakage. Leakage
represents the portion of a dollar spent in areas outside the designated economy, such as the taxes paid on
purchases of goods and services.
THIS DIRECT SPENDING
12

13
The multipliers used in this analysis are specific to the local economy and are
summarized below.
ECONOMIC IMPACT MULTIPLIERS
1.787 0.683 18.220
1.490 0.499 10.317
ZOO OPERATIONS
EARNINGS EMPLOYMENT
HOTELS
RESTAURANTS
OTHER INDUSTRIES
LOCALTRANSPORTATION
1.656 0.685 25.998
1.732 0.675 20.900
1.879 0.952 39.742
OUTPUT

To calculate output, earnings and employment, these multipliers are applied to our estimates of
Zoo-related direct spending. The resulting total output, earnings and full- and part-time employment
impacts associated with the operations of the Detroit Zoo are presented in the following table.
Annual estimates have been calculated for the past five calendar years.
14
DETROIT ZOO ECONOMIC IMPACT SUMMARY
2014
$153,981,888
1,776
$59,851,230
2015
$196,531,362
2,226
$76,187,519
2017
$169,752,580
1,966
$66,026,335
2018
$167,626,085
1,916
$65,070,604
2016
$191,962,134
2,213
$74,612,000
TOTAL OUTPUT
EARNINGS
EMPLOYMENT
CALCULATION OF ECONOMIC IMPACT SUMMARY

Total Output, which represents the re-spending of dollars in the economy, has ranged from a low of
approximately $154 million in 2014 to more than $196 million in 2015.
The financial operations of the Zoo itself represent nearly half of this total
output. Visitor spending has comprised an estimated 44 percent of the
Zoo’s total output and the operations of Service Systems Associates (the
Zoo’s third-party food/beverage and gift shop services provider) accounts
for approximately eight percent of the Zoo’s total economic output.
Large capital projects, such as the development of the Polk Penguin
Conservation Center, have a significant impact on the total output of the
Detroit Zoo. For example, in 2015, more than $44 million in output can be
directly attributed to capital projects.
Over the past five years, approximately 46 percent of the total output
generated by Zoo-related visitor spending takes place among people
residing outside of Michigan. This compares to 31 percent for those
residing outside of the tri-county metro area (but within Michigan) and
23 percent from local visitors.
15
TOTAL OUTPUT
Personal Earnings, which represents the dollars earned among jobs supported by Zoo operations, has
ranged from a low of approximately $59.9 million in 2014 to approximately $76.2 million in 2015.
PERSONAL EARNINGS
Employment, which represents the number of full- and part-time employment impacts supported by
Zoo operations, has ranged between 1,776 and 2,226 positions between 2014 and 2018.
EMPLOYMENT