Deterministic Approach for Calculation of Carbon Footprint ...
20
Deterministic Approach for Calculation of Carbon Footprint for Cement Plants in India amit Kumar shrivastava ( [email protected] ) Delhi Technological University https://orcid.org/0000-0001-7281-1097 Aman Vashishth Delhi Technological University Bhagya Jayant2 Delhi Technological University Research Article Keywords: CO2 emissions, Direct & indirect emissions, cement production Posted Date: March 22nd, 2021 DOI: https://doi.org/10.21203/rs.3.rs-285464/v1 License: This work is licensed under a Creative Commons Attribution 4.0 International License. Read Full License
Transcript of Deterministic Approach for Calculation of Carbon Footprint ...

Deterministic Approach for Calculation of CarbonFootprint for Cement Plants in Indiaamit Kumar shrivastava ( aksrivastavadceacin )
Delhi Technological University httpsorcidorg0000-0001-7281-1097Aman Vashishth
Delhi Technological UniversityBhagya Jayant2
Delhi Technological University
Research Article
Keywords CO2 emissions Direct amp indirect emissions cement production
Posted Date March 22nd 2021
DOI httpsdoiorg1021203rs3rs-285464v1
License This work is licensed under a Creative Commons Attribution 40 International License Read Full License
Deterministic approach for calculation of Carbon
Footprint for Cement plants in India Amit K Shrivastava Aman Vashishth
1 Bhagya Jayant
2
Faculty Department of Civil Engineering Delhi Technological University Delhi India aksrivastavadceacin 1 Student of Environmental Engineering Delhi Technological University Delhi India amanvashishth20gmailcom 2 Student of Civil Engineering Delhi Technological University Delhi India bhagyajayant1822gmailcom
ABSTRACT
Estimating cement process emissions through an industryrsquos dataset has more often if not always been majorly based on strong assumptions India being the second largest producer of cement across the globe next only to China lags in providing accurate estimates of its official time-series to UNFCCC (United Nations Framework Convention on Climate Change)
Present study has been undertaken to lay out a deterministic approach for calculation of carbon footprint for any Indian Cement Plant using the customized design methodology Modelling of which is done by referring to and prioritizing various companiesrsquo official data emission factors and cement protocols The framework aligns itself to Greenhouse Gas Protocol and Cement Sector Emissions Calculation Tool Indian Version 10 (July
2005) and CO2 Accounting and Reporting Standard for the Cement Industry The Cement CO2 Protocol
Version 20 (Cement Sustainability Initiative June 2005) It aims to provide a more reliable source for estimation of greenhouse gas - CO2 emissions in any cement processing plant of India
Index Terms ndash CO2 emissions Direct amp indirect emissions cement production
I INTRODUCTION
India is the second-largest cement producer in the world next only to China (Indian Cement Industry Analysis IBEF 2021) Accounting for more than 8 of the total installed capacity across the globe (2019) its cement production capacity in FY20 was reported to be about 545 MT (Indian Cement Industry Analysis IBEF 2021) The Indian cement industry comprises of 210 cement plants in a total of which 77 are established in Andhra Pradesh and Tamil Nadu (Indian Cement Industry Analysis IBEF 2021) An increase in the installed capacity for cement production is expected to be about 800 MTPA by the year 2030 (Cement Bureau of Energy Efficiency 2021) Investment in cement and gypsum attracted US $528 billion from April 2000 to March 2020 (DPIIT IBEF 2021) and the demand is still high
Cement production is a major source for greenhouse gas emissions contributing towards CO2 emissions in majority According to the Indian Cement Industry report Indiarsquos greenhouse gas emission intensity value ranges from 560 kg CO2 ton of cement produced to 687 kg CO2 ton of cement produced (CII 2010) Being the largest manndashmade material in the world cement is linked relentlessly to Climate Change responsible for health problems and deaths related to air pollution Economic degradation due to the exponential expense burden in the healthcare department is another consequence Carbon dioxide is majorly produced as a by-product of clinker production in the process of cement manufacture and as energy produced in fossil fuels However the dependence on meeting the global economic productions through energy from combustion of fossil has detritus effects expected to harm global welfare and diminish economic productivity
II LITERATURE REVIEW
The industrial and energy sources in cement production contribute to approximately 24 of the global carbon dioxide emissions (Marland et al 1989) As per estimations 05 to 09 kg of CO2 is emitted on the production of 1 kg of cement (Gartner 2004) 90 of the energy required for cement manufacturing is met out of fossil fuels while the remaining 10 is met whence electricity (C A Hendriks et al 2004) Besides E Benhelal et al (2013) reasoned out the estimation of global CO2 emissions from the cement industry at 5 to Portland cement manufacturing and the use of outdated industrial equipment responsible for the consumption and the consequent evolution of huge amounts of particulate matter And even though the latest technologies have increased the production efficiency of cement production there has been a significant rise in CO2 emissions as a consequence of increased demand for development in infrastructure (G U Fayomi et al 2019)
Cement Processing in a Plant
Cement is a binding material used for construction to bind the materials together It is generally used to bind sand and gravel together to manufacture concrete and with fine aggregates to manufacture mortar or masonry Every cement plant undergoes the steps shown in Fig 1 for the manufacturing of cement
Fig 1 ndash Cement manufacturing processes in a cement plant
(Encyclopedia Britannica Inc 2007)
Carbon capture in Cement manufacturing plant
The reaction begins at the limestone quarry The limestone near the surface has a high content of minerals like silica iron and aluminum oxide On ndash going at a further depth we find more of CaCO3 content The first carbon footprint counts or carbon capture is marked here in making a big hole using machines which take up a lot of energy Limestone found in mines are then drilled to smaller sizes in the process of quarrying
Next the detonator is fixed and the holes are digged in the ground and plant-powerful explosives are set - up for blasting (Maintaining a distance of at least 50m) Here the second carbon capture is observed For emissions from blasting which include CH4 and CO2 emissions from natural gas extraction CO2 emissions from ammonia production and the emissions from the actual blasting
After blasting the material is filled in the dumper using an excavator which is weighed at the cement plant to determine the amount of raw material for the plant After the explosion the loaders move in they transfer the limestone rock to a dump truck At the plants the trucks dump the rocks in the primary crusher The primary crusher reduces the material to smaller sizes There is a constant spray of water to keep the dust from billowing up and settling on the shoots This conversion also gives out a lot of energy marking as the third carbon capture
Next the limestone is fed in the crusher which is sent to the compound impact cursor using a conveyor The material is crushed using limestone crusher to finer sizes (25 mm or 30 mm) depending upon the available mill as vertical roller mill or ball mill Rocks with high calcium carbonate and rocks low in calcium carbonate are crushed separately Then itrsquos mixed This overhead machine also known as the tripper then makes piles of the required proportions known as the raw mix A reclaimer loads this raw mix into a grinding machine called a roller mill The factory or plant adds extra minerals such as silica and iron Certain types of cement also require aluminum oxide The roller then mixes and grinds the ingredients uniformly producing a dry rock powder called the raw meal More crushing implies more energy and all the added minerals have their own associated emissions thereby marking the fourth carbon capture
Now the powder goes into the pre-heater the temperature of which is 80˚C upon entering Within 40 seconds it gets more than ten times hotter releasing a lot of energy responsible for fifth carbon capture in the plant This begins the process of bonding the minerals together so that they later harden when hydrated with water
The preheater is equipped with a flash calcine In about 5s it removes about 95 of the CO2 and the powder through a chemical reaction isolates the lime which is the most important element in the cement In 5s 95 of the fixed CO2 is released in the atmosphere which had been stripped from the limestone fixed in the rock for over 100 million years polluting it and marking the sixth carbon capture
From here the powder moves into the rotary kiln which is a huge cylindrical furnace It is set at an angle so that the powder moves a distance of about 49 m from top to bottom The kiln rotates about two turns a minute to ensure the material travels through at a right speed The burner gas flame at the bottom reaches a scorching 1600˚C ndash 1700˚C As the powder approaches or cools down to a 1500˚C mark it fuses into pieces with a diameter of about 5 cm approximately These pieces are called clinkers As the clinker leaves the kiln large fans further cool it down to a temperature range of 60˚C ndash 80˚C It is important to cool the clinker quickly in order to have quality cement According to IPCC (Intergovernmental Panel on Climate Change 2008) every 1 ton of clinker releases 125 tons of CO2 in the atmosphere Thereby making this stage as the eighth carbon capture
From here the clinker goes to the storage area This process requires tons of fossil fuels to release CO2 from clinkers marking the seventh carbon capture This also explains the reason behind cement plants produce more CO2 emissions than cement
The last stage of cement processing is finish grinding In this stage gypsum is added to the clinker Gypsum delays the cements initial setting time so that it can be worked for up to 2 hours before hardening The material after being crushed is transported using a conveyor belt to the pile yard for stocking Here the material is homogenized using the reclaimer and scraping chain along the belt conveyor This is the final and the eighth carbon capture concluding the cement manufacturing transporting and storing process in the plant in complete totality
III OBJECTIVE
This study has been intricately performed to overcome the problem of data unavailability for calculating CO2 emissions in the processing of cement in India It has been resolved by factually analyzing the various cement ndash manufacturing industriesrsquo official data emission factors and cement protocols with reduced assumptions for better accuracy As a consequence a customized framework has been designed with the aid of Greenhouse Gas
Protocol and Cement Sector Emissions Calculation Tool Indian Version 10 (July 2005) and CO2 Accounting
and Reporting Standard for the Cement Industry The Cement CO2 Protocol Version 20 (Cement Sustainability
Initiative June 2005) The framework has been broadly classified into Scope 1 and Scope 2 for calculation of direct CO2 emissions and indirect CO2 emissions respectively in various cement-manufacturing plant units It is a user-friendly algorithm that may be utilized as a guide for computation of the carbon footprint of Indian cement plant(s) This can be done by performing certain alterations throughout the framework after the assembling of scrutinized plant-specified data
IV METHODOLOGY
The framework generated in this paper is compatible with the latest guidelines for national greenhouse gas inventories issued by IPCC (Intergovernmental Panel on Climate Change) and with the revised WRI WBCSD Protocol The framework has been developed with the aid of Greenhouse Gas Protocol and Cement Sector
Emissions Calculation Tool Indian Version 10 (July 2005) an algorithm developed by the World Resource Institute (WRI) also called as the Indian Cement tool and CO2 Accounting and Reporting Standard for the
Cement Industry The Cement CO2 Protocol Version 20 (Cement Sustainability Initiative June 2005) which is intended as a tool for cement companies worldwide inclusive of calculations for direct and indirect CO2 emissions The companies undertaken must include activities such as clinker production including raw material quarrying grinding of clinker additives and cement substitutes such as slag both in integrated cement plants and stand-alone grinding stations in the voluntary calculation using this framework The framework is ideal for calculating the carbon footprint of any Indian cement plantindustry and may be used for further investigation or exploration in the same field
Framework
The framework breaks down the scope of calculating CO2 emissions into Scope 1 and Scope 2 based on direct CO2 emissions and indirect CO2 emissions from cement processing in the industry respectively
Scope 1 ndash Direct CO2 emissions
Direct CO2 emissions are those that are generated from sources owned or controlled by the cement ndash producing companies These emissions are primarily a result of CO2 emissions attributed to the calcination of raw materials and fuel combustion Calcination is the process of transforming raw materials into clinker And fuel combustion is the process of burning the fuels (oil coal petrol coke etc) in kilns and mobile combustions Also the scope takes into consideration emissions from the organizationrsquos vehicles and (if any) refrigerant ndash leaks on site In short all on-site emissions are accounted for in Scope 1 The in-depth discussion regarding these sources and their calculations has been done and performed in the coming sections subcategorized into ndash
Scope 11 ndash CO2 from raw materials
Scope 12 ndash CO2 from direct stationary combustion
Scope 13 ndash CO2 from mobile combustion
Scope 11 ndash Calculating CO2 emissions from raw material
The emissions from scope 11 originate from the calcination of clinker calcination of dust and organic carbon in the raw material Calcination is defined as the purification process of heating (oxidizing) the raw materials at a high temperature to remove the volatile materials from the mass Cement process CO2 emissions mainly from calcination of calcium carbonate (CaCO3) and magnesium carbonate (MgCO3) in the raw meal for clinker production which can be expressed by the following chemical equations (Worrell et al 2001)
CaCO3 rarr CaO + CO2 (1)
MgCO3 rarr MgO + CO2 (2)
Using the relative formula mass Mr the above chemical equations can be rewritten accordingly to the suit the law of conservation of matter
Mr (CaCO3) = Mr (CaO) + Mr (CO2) (3)
Mr (MgCO3) = Mr (MgO) + Mr (CO2) (4)
Where Mr is the molar mass
Mr (CaCO3) =10009 u
Mr (MgCO3) = 8431 u
Mr (CaO) = 5608 Mr (MgO) = 4030 u
Mr (CO2) = 4401 u
From the above equations it is observed that the calcination of 1 ton (t) of CaCO3 emits about 044 t of CO2 and the calcination of 1 t of MgCO3 emits about 052 t of CO2
Generally there are two types of widely ndash accepted and often ndash used calculation methods for estimating the processed CO2 emissions from cement production the input method (raw materials or raw meal in particular) and the output method (clinker method and cement method) (CSI 2011) In this framework the output methods have been included which are the Clinker ndash based approach and Cement-based approach Either of the two methods may be used depending upon the availability of data from the company for calculating direct CO2
emissions from raw materials The framework is designed for the annual production of Ordinary Portland Cement (OPC) in cement
manufacturing companies The amount of Cement produced is assumed to be 1 ton This standard value can be multiplied with the data from the cement company and consecutive changes may be made throughout the framework for calculation purposes Besides alteration may be done to the framework for different types of cement plant-specific values for emissions and much more For reference the framework is inclusive of certain parameters intricately yet sequentially mentioned throughout the framework Considering the average CO2 emission factor for clinker (EFCli) equal to 0528 t CO2 t clinker (Indian Cement tool [6]) on an average the production of 1 ton of cement releases 125 tons of CO2 (IPCCC 2018)
1 tons of cement 125 tons of CO2
1 ton of clinker (releases) 528 kg of CO2 = 0528 tons of CO2
From the above equations
1 ton of CO2 is released from (1 0528) tons of clinker
1 ton of CO2 is released from 1893 tons of clinker
125 ton of CO2 is released from 1893 x 125 tons of clinker
1 tons of cement 236 tons of clinker 125 ton of CO2 (5) Therefore average amount of clinker produced for 1 ton of cement production = 236 tons
(I) Clinker ndash based approach
This approach calculates CO2 emissions from cement production based on the CaO and MgO content and the amount of clinker thereby produced This method involves estimating process-related CO2 emissions from cement production
Step 1 Consider the amount of clinker produced (PCli) = 236 tons (assumption from eq (5))
Step 2 Average CO2 emission factor for clinker (EFCli) = 0528 t CO2 t clinker (Indian Cement tool [6])
Step 3 The amount of CKD lost in the absence of plant ndash specific value may be considered as 2 of CO2 released
from clinker production (from eq (5) CSI [7])
Therefore the amount of CKD lost = (002) x (125) = 0025 tons
Step 4 Average CO2 emission factor for CKD (EFCKD) = 04514 t CO2 t CKD lost (Indian Cement tool [6])
Step 5 Let the total CO2 emissions from Scope 11 be X1 (Indian Cement tool [6])
(Total CO2 emissions from scope 11) = PCli EFCli + CKD EFCKD (5)
X1 = 236 x 0528 + 0025 x 04514 = 1257 CO2
Let CO2 emissions per ton of raw material (clinker) used be A
A = 1257 236 = 05327 t CO2
In the absence of plant ndash specific value the value of A shall be directly multiplied with the amount of clinker produced (in tons) In which case the intermediate steps may be skipped However one should ensure that when doing so the assumptions mentioned in the beginning of the framework are matched
(I) Cement ndash based approach
Since different types of cement contain varying clinker fractions it is important to segregate cement production data by its cement type In the cement-based approach the data should be reported separately for Ordinary Portland Cement (OPC) Pozzolana Portland Cement (PPC) Portland Slag Cement (PSC) and other cement types Some of the default clinker fractions based on the assumed cement type blends can be used as given in Table 1 (Indian Cement Tool [6]) This method involves estimating process-related CO2 emissions from cement production
Table 1 Default clinker to cement ratio based on cement type
S No Cement Type Clinker to cement ratio ()
01 Ordinary Portland cement (100 Portland output) 95
02 Portland Pozzolana Cement 75
03 Portland Slag Cement 55
Step 1 Consider the amount of cement produced = 1 ton (assumption eq (5))
Step 2 Clinker to cement ratio = 095 (OPC Table 1)
Step 3 Total clinker that is released from just the cement production may be calculated as-
(Total clinker from cement production only) = (amount of cement produced) x (clinker to cement (6)
ratio)
= 1 x 095 = 095 tons of clinker (Indian Cement tool [6])
Step 4 Consider he amount of clinker imported and exported Assuming that no clinker has been imported or
exported to the plant Therefore amount of clinker imported and exported = 0
Step 5 Total clinker produced in the company facility plant is calculated as below (Indian Cement tool [6])
= (Total clinker from cement production) ndash (imported clinker) + (exported clinker) (8)
= 095 tons of clinker
Step 6 To determine the amount of raw materials used and then calculate ton of raw material per ton of clinker
on dividing In the absence of plant ndash specific value for raw material or import and export clinker amounts
the default value of 15 can be considered
Therefore (t of Raw material) (t of Clinker) = 15 (Indian cement tool [6])
Step 7 To determine the amount of CaCO3 equivalent used to produce clinker calculated as ndash
(CaCO3 equivalent raw material ratio ) = (CaCO3 equivalent for raw material) x (amount of raw material)
In the absence of plant ndash specific value consider the default value of CaCO3 equivalent raw material
ratio as 078 (India Cement Tool [6])
Step 8 Finally let the total CO2 emissions (in tons) be X1rsquo
X1rsquo = Pcement x (clinkercement) x (RMclinker) x (CaCO3 equivalent RM) x (MW CO2MW CaCO3) (9)
where RM = Raw Material and MW = Molecular Weight (Indian cement tool [6])
The stoichiometric ratio of CO2 to CaCO3 = (44100) = 044
= 1 x 095 x 15 x 078 x 044
= 0489 tons of CO2 emissions
Let the CO2 emissions per ton of raw material (cement) used be B
Then B = 0489 kg CO2 ton
In the absence of plant ndash specific value the value of B shall be directly multiplied with the amount of cement produced (in tons) In which case the intermediate steps may be skipped However one should ensure that when doing so the assumptions mentioned in the beginning of the framework are matched
Scope 12 ndash Calculating CO2 emissions from direct combustion
When the raw material is fed into the preheater rotary kiln the conventional kiln fuels like anthracite bituminous and coke alternative fossil fuels like natural gas biomass fuels non ndash kiln fuels like NOX and
wastewater in combusted all of which come under scope 12 In this scope the steps represented in Table 2 below are used to calculate CO2 emissions from each fuel
Table 2 Step ndash by ndash step procedure for calculation of scope 12 CO2 emissions
S No Fuel Quantity of fuel
burned
(in tons)
(I)
Calorific value
of fuel
(in GL tons)
(II)
CO2
Combustion
Factor
(in kg CO2 GJ)
(III)
Oxidized
carbon
fraction
(IV)
Total CO2 emissions
from fuel (in kg)
(= I x II x III x IV)
Eg Bamboo Dust
45000 1525 9610 100 66948625
Σ = helliphelliphelliphellip
The above table for individual fuel calculations has also been represented in steps below The total CO2 emissions contributing towards scope 12 is the summation of CO2 emissions from each fuel (Indian Cement tool [6])
Step 1 Consider the quantity of fuel burned (in tons)
Step 2 Average net calorific value in GL tons (plant ndash specific default value)
Step 3 Calculate quantity of fuel used in energy (in GJ) (using the formula) (Indian Cement tool [6])
Quantity of fuel used in energy = (Quantity of fuel burned) x (Average net calorific value) (10)
Step 4 Take CO2 combustion emission factor specific to fuel (kg CO2 GJ) (plant ndash specific default value)
Step 5 Consider the oxidized carbon fraction In case of unavailability of this value certain default values are given below
Table 3 Default value for oxidized carbon fraction based on fuel type
S No Fuel type Oxidized carbon fraction
01 Coal Lignite used in kiln of pre ndash calcinator 100
02 Coal used in other furnaces 098
03 Oil 099
04 Gas 0995
(Reference ndash Indian Cement tool)
Step 6 Therefore CO2 emissions (in kg) (Indian Cement tool [6])
= (Quantity of fuel used in energy) x (CO2 combustion emission factor) x (oxidized carbon fraction) (11)
= helliphelliphellip kg CO2 emissions = helliphellip tons CO2 emissions
The summation of CO2 emissions from each fuel type contributes towards the total CO2 emission in Scope 12 Let X2 be the total CO2 emissions from Scope 12 Therefore X2 = Σ (fuel emissions tons)
Scope 13 Calculating CO2 emissions from direct mobile combustion
In this framework we have only considered the transportations wherein the vehicles are owned or controlled by the reporting entity or the company under consideration The cement production process involves the transportation of raw materials fuels and the distribution of finished goods The transportation modes can be railways waterways andor roadways each of which emits CO2 which is accounted for under this scope The following diagram highlights the inclusivity of Direct and Indirect emissions from the on-site emissions from transportation in the framework
Fig 2 Breakdown of transports by type and coverage (Indian Cement tool)
Table 4 also latter represented in steps are used to calculate the CO2 emissions for each vehicle and its corresponding fuel type These steps are repeated for each vehicle type and the results for each cycle are added The summation of the final CO2 emissions for each vehicle type results in the total CO2 emissions contributing towards Scope 13 This can be calculated either using distance travelled by the vehicle or through its fuel consumption details
Method 1 CO2 emissions from fuel consumption in the vehicle(s)
When fuel consumption data for a vehicle is available (Plant-specific values)
Table 4 Step ndash by ndash step procedure for calculation of scope 13 ndash METHOD 1 CO2 emissions
S No Transport
Description
Fuel type
Used
Fuel consumption
Or quantity of fuel
Burned (L)
(I)
CO2 emission
Factor
(in kg CO2 L)
(II)
Oxidized carbon
fraction
(default value)
(III)
Total CO2 emissions
(tons)
=(I x II x III) 1000
Eg Loader Diesel 5000 01005 099 5025
Σ = helliphelliphelliphellip
Step 1 Collect data regarding the vehicle type fuel used its fuel consumption CO2 emissions factor for the fuel type in
vehicle type
Step 2 Taking default value of oxidized carbon fraction as 099 (Indian Cement tool [6])
Step 3 Let the total CO2 emissions (in tons) be X3 then using the formula ndash (Indian Cement tool [6])
X3 = (Fuel consumption) x (CO2 emission factor) x (oxidized carbon fraction) 1000 (12)
Method 2 CO2 emissions from distance ndash travelled by the vehicle(s)
Table 5 Step ndash by ndash step procedure for calculation of scope 13 ndash METHOD 2 CO2 emissions
S No Transport
Description
Distance travelled
On-site (km)
(I)
CO2 emission
Factor
(in kg CO2 km)
(II)
Total emissions
(in kg)
(= I x II)
Eg Loader 5000 01005 5025
Σ = helliphelliphelliphellip
Step 1 Collect the data regarding the vehicle and fuel type quantity of such vehicle types like trucks cars dumpers loaders
and more visiting the site per day the average distance travelled by it on ndash site in a year and the specific CO2
emission factor corresponding to the vehicle and fuel type
Step 2 The total CO2 emissions from mobile combustion of each vehicle is calculated as below (Indian Cement tool [6])
Total CO2 emissions from mobile combustion = (Distance travelled) x (CO2 emission factor) (13)
= helliphelliphellip kg = helliphelliphellip tons
Let total CO2 emissions from scope 13 emissions be X3
Therefore X3 = Σ (emissions from each vehicle type)
Total CO2 emissions from SCOPE 1
Let total CO2 emissions from scope 11 12 and 13 will be X
Thus X = X1 X1rsquo+ X2 + X3
Scope 2 ndash Indirect CO2 emissions
An organization may use energy that doesnrsquot generate emissions onsite However the creation of electricity and its distribution results in emissions that are off-site (from the power plant) It should be noted that electricity emissions vary greatly because of the fuel used to produce electricity For eg Coal produces the most ndash emissions because it is not a clean fuel Electricity can also be generated from heavy furnaces oil or gas which are relatively cleaner The cleanest source of electricity is renewables
Table 6 also latter represented in step below can be used for calculating the contribution of CO2 emissions for each stream description The total CO2 emissions contributing towards scope 2 will be the summation of all CO2 emissions from electricity consumption (Σ)
Table 6 Step ndash by ndash step procedure for calculation of scope 2 CO2 emissions
S No Description Electricity
Purchased
(in kWh)
(I)
CO2 emissions
Factor
(in g CO2 kWh)
(II)
Indirect CO2
Emissions (in tons)
(= I x II)
Eg -- 80000000 806 64480
Step 1 Consider the emission factor based on the location of the industry (Indian Cement tool [6])
Step 2 Take average electricity purchased in kWh for a year (plant ndash specific value)
Step 3 Therefore CO2 emissions from each electricity consumption activity is calculated as below (14)
CO2 emissions from each electricity consumption = ((Electricity purchased) x (CO2 emission factor)) 1000000
= helliphelliphelliphelliphellip Tons (Indian Cement tool [6])
Let the total CO2 emissions from scope 2 be Y
Then Y = Σ (CO2 emissions from each electricity consumption activity)
Calculating total carbon footprint
Calculating carbon footprint = CO2 emissions produced by the industry in a year = (X+Y)
= helliphelliphellip tons per annum
V CASE STUDY
To substantiate the credibility of this framework letrsquos calculate the CO2 emissions for the following case study of one of the leading cement-manufacturing companies in India The results of which would later be tallied with the actual reporting data figures acquired from their official websites For simple yet efficient processing of the entire framework which is easy to understand certain assumptions would be made in the progression
Assuming the companyrsquos name is ABC
Background of company ABC ndash one of the leading cement-manufacturing companies in India
ABC company has its roots all across India with 17 cement manufacturing units 90 ready ndash mix concrete plants with over 6600 employees and vast distribution network of 50000 + dealers The cement type manufactured in ABC is Ordinary Portland Cement (grade 53 and grade 43) in the bag size of 50 kg The CO2 emissions calculated for the inputted data for the year 2018
For Scope 11 ndash CO2 emissions from raw materials (Using Cement ndash based approach)
Due to the unavailability of the clinker data for the company the cement ndash based approach has been opted for calculating CO2 emissions from raw materials
Step 1 Total amount of cement ndash produced = 3305 MT (installed cement capacity Sustainability Report 2019)
Step 2 Clinker to cement ratio = 95 (Indian Cement tool [16])
Step 3 Therefore the clinker used for the cement production (in tons) using formula ndash
(Total clinker used for cement production) = (cement produced) x (clinker to cement ratio)
= (3305) x (-095) = 31395 tonsrsquo clinker
Step 4 Imported clinker and exported clinker = 0 (no data available)
Step 5 Therefore total clinker produced in the facilityplant
= (total clinker used for cement production) -(imported clinker) + (exported clinker)
Step 6 The raw materials and their amounts used are listed as below (ABC Sustainability Report)
Table 7 Quantity of raw materials used for manufacturing of OPC cement in ABC company
S No Raw material Quantity (in MT)
01 Limestone 2486
02 Gypsum 118
03 Alternate materials 337
04 Slag 318
05 Fly ash 574
06 Additives 010
07 Others 167 Σ = 371 MT
Other raw materials like lubricating oil grease are proportionately very small and hence neglected for calculations
Therefore the amount of raw materials used for manufacturing of cement = 371 MT
Step 7 The amount of CaCO3 used to produce clinker
= (CaCO3 equivalent raw material) x (amount of raw material)
The default value of ratio of CaCO3 to raw material is considered since the plant-specific value is not
available Implying (CaCO3 equivalent raw material) = 078 (Indian Cement tool [16])
(Amount of CaCO3 used to produce clinker) = (078) x (371) = 2893 MT CaCO3
Step 8 Finally the total CO2 emissions (in tons) is given by the formula -
= Pcement x (clinkercement) x (RMclinker) x (CaCO3 equivalent RM) x (MW of CO2 MW of CaCO3)
= (3305) x (095) x (37131395) x (2893371) x (44100) x 10-6 MT CO2 emissions
= 125 MT CO2
Therefore X1rsquo = 125 MT CO2
For Scope 12 ndash CO2 emissions from direct stationary combustion (fuel combustion)
Combustion of the kiln (conventional and alternative) and non ndash kiln fuels for ABC and their respective energy consumptions have been listed in Table 8 and Table 9 respectively The individual values of the quantity of fuel used their calorific values and the oxidized fraction are not available However the data for the energy consumption by each fuel is available It can be expressed as below
Energy consumption = (Quantity of fuel burned) x (calorific value of fuel) x (oxidized carbon fraction) (15)
Now using the framework and representing the steps for calculations under scope 12 in tabular form under Table 8 and Table 9 with a combined column for Energy consumption
1 CO2 released from conventional and alternative kiln fuels
The kiln fuels used by the company are listed as below
Table 8 Step ndash by ndash step procedure for calculation of ABC CO2 emissions from kiln fuels
S No Fuel Energy
consumed
(in TJ)
Energy
consumed
(in GJ)
x 103
(I)
CO2 combustion
factor
(kgCO2GJ)
(II)
COLUMN A
Total CO2 emissions (kg)
= (I) x (II)
1 Pet coke + coal 51417 51417000 107738 5539564746
2 Diesel oil 62 62000 7384 4578080
3 Biomass fuels 648 648000 6998 45347040
4 Alternative fuels 1744 1744000 11245 196112800
CO2 released from conventional and alternative fuels = Σ (COLUMN A) = 578560266 kg = 5785 MT CO2
2 CO2 released from non - kiln fuels
The non - kiln fuels used by the company are listed as below
Table 9 Step ndash by ndash step procedure for calculation of ABC CO2 emissions from non-kiln fuels
S No Fuel Energy
consumed
(TJ)
Energy
consumed
(in GJ)
x 103
(I)
CO2 combustion
factor
(kgCO2GJ)
(II)
COLUMN B
Total CO2 emissions
(kg)
= (I) x (II)
1 Pet coke + coal 24510 24510000 107738 2640658380
2 Diesel oil 7 7000 7384 516880
3 Biomass fuels 100 100000 6998 6998000
4 Alternative fuels 167 167000 11245 18779150
CO2 released from non ndash kiln fuels = Σ (COLUMN B) = 2666952410 kg = 2667 MT CO2
Thus the total CO2 emissions from scope 12 (X2) = Σ (COLUMN A + COLUMN B) = 5785 + 2667
Therefore X2 = 8452 MT CO2
For Scope 13 ndash CO2 emissions from direct mobile combustion
Major contribution towards production of CO2 emissions in the company industry has been from the truck Assuming the truck to be of an average weight of 16 tons with 4 km per liter mileage (Assumptions [11])
Using Method 2 ndash CO2 emissions from distance travelled by the vehicle
Here the truck with diesel is travelling on ndash site which is responsible for CO2 emissions based on distance travelled on-site The default value for diesel is taken to be 7401 kg CO2 GJ (Indian Cement tool [6])
By stoichiometry
1 GJ energy of diesel (generates) 7401 kg of CO2
Fuel energy density of diesel = 386 MJL (Fuel energy density[13])
1 L of diesel (releases) 386 MJ energy
1 L of diesel (releases) 00386 GJ energy (1 GJ = 1000 MJ)
259 L of diesel (releases) 1 GJ of energy
Therefore on equating (1) and (2)
259 L of diesel (generates) 7401 kg of CO2
1 L of diesel (generates) 2857 kg of CO2
Since the truck weighs an average of 16 tons with 4 km per liter mileage
Therefore in 1 L the truck travels 4 km (roughly)
Which implies that 2857 kg of CO2 is released when the truck travels 4 km
That is 071425 kg of CO2 is released when the truck travels 1 km
Thus the CO2 emission factor (in kg CO2 km) = 07145
Table 10 Step ndash by ndash step procedure for calculation of ABC scope 13 ndash METHOD 2 CO2 emissions
S No Transport
Description
Fuel type
used
Distance travelled
On-site (km)
(I)
CO2 emission
Factor
(in kg CO2 km)
(II)
Total emissions
(in kg)
(= I x II)
01 Truck Diesel 7904157584 07145 5645544554
Therefore X3rsquo = 56455 MT CO2
Total CO2 emissions from scope 1 is X = X1 + X2 + X3 = 125 + 8452 + 5645 = 2659 MT asymp 266 MT
SCOPE 2 Calculating CO2 emissions due to indirect air emissions
Average of emission factors = 806 kg CO2Kwh (Indian Cement tool [6])
Total electricity consumed = 601649000Kwh (ABC Sustainability Report 2019)
Total CO2 released due to indirect air emissions = (Electricity emission factor) (total electricity consumed)
Total emissions = (601649000) x (806) = 484929094 kg CO2 = 0484929094 MT CO2
Tabulated as below
Table 11 Step ndash by ndash step procedure for calculation of ABC scope 2 CO2 emissions
S No Description Electricity
Purchased
(in kWh)
(I)
CO2 emissions
Factor
(in g CO2 kWh)
(II)
Indirect CO2
Emissions (in kg)
(= I x II)
01 Electricity used in ABC 601649000 0806 484929094
Therefore Y = 04849 MT CO2
Total carbon dioxide emissions in ABC Industry
= X + Y
= 266 + 04849
= 2708 MT CO2
ABC produces approximately 2708 MT of CO2 emissions for a cement production of 3305 MT It means that 08195 ton of CO2 is emitted per ton of cement production
Limitations
The import and export of clinker and other raw materials have not been considered Certain assumptions like mileage of vehicle have been done well under the acceptable guidelines which may differentially alter the accuracy of the result
VI RESULTS AND DISCUSSION
The carbon footprint for the company ABC as calculated from the framework is now scope-wise tallied with the officially generated Sustainability Report 2019 of ABC as in the table below
Table 12 Comparing Scope-wise ABC CO2 emissions
Customized framework vs official sustainability report (2019)
Scope ndash wise emissions (MT CO2) Using customized framework As reported in Sustainability
Report of ABC
SCOPE 1
266
166
SCOPE 2 0484929 0534401
SCOPE 3 - 0675988
Total 2708 1783
The above results indicate that for the production of 3305 MT of cement the CO2 emissions as calculates using the framework and that reported by the company vary From the customized framework it has been concluded that (2708 3305) = 0819 t of CO2 is emitted per ton of cement production While it has been reported that ABC emits (1783 3305) = 0539 t of CO2 per ton of cement production
VII CONCLUSION
The framework is factual and incorporates every aspect of GHG emissions during the whole cement manufacturing process and may therefore be used for calculating CO2 emissions of any Indian cement ndash producing company During the CF analysis of ABC Company it was found that the emissions reported were much lower then what should have been the case if proper methodology for CF analysis had been followed Image enhancement tax evasion and maintaining brand value might have been the motive behind the cause
This work will also act as a guide to those who want to learn and apply this particular framework in calculating CF of Indian cement plants in future and plan the strategy to reduce the CO2 emission
REFERENCES
[1] Andrew Robbie M (2019) Global CO2 emissions from cement production 1928 ndash 2018 Earth system
Science Data 11 1975 ndash 1710 httpsdoiorg105194essd-11-1675-2019
[2] Mikulcic Hrvoje Vujanovic Milan Markovska Natasa Filkoski Risto V Ban Marko Duic Neven (2013) CO2 Emission Reduction in the Cement Industry Chemical Engineering Transactions 35 doi 103303CET1335117
[3] Fayomi G U Mini S E Fayomi O S I Ayoola A A (2019) Perspectives on environmental CO2
emission and energy factor in Cement Industry IOP Conference Series Earth and Environmental Science 331
doi 1010881755-13133311012035
[4] Gartner E (2004) Industrially interesting approaches to ldquolow CO2rdquo cements $ 34 1489 ndash 1498 httpsdoiorg101016jcemconres200401021
[5] Benhelal E Zahedi GShamsaei E Bahadori A (2013)Global strategies and Potentials to curb CO2
emissions in cement industry Journal of Cleaner Production 51142 -161 httpsdoiorg101016jjclepro201210049
[6] Energy and Resources Institute (TERI) July 2005 Cement Sector Emissions Calculation Tool India Version 10
[7] World Business Council for Sustainable Development (2011 May) Cement Sustainability Initiative (CSI)
CO2 and Energy Accounting and Reporting Standard for the Cement Industry The Cement CO2 and Energy
Protocol Version 30 httpsdocswbcsdorg201105CSI-CO2-Protocolpdf
[8] IBEF- Indian Brand Equity Foundation ndash wwwibefcom
[9] Bureau of Energy Efficiency 2017 httpsbeeindiagovincontentfuel-efficiency
[10] Intergovernmental Panel on Climate Change (IPCC) (1997) Revised 1996 IPCC Guidelines for National Greenhouse Gas Inventories Reference Manual (Revised) Vol 3 J T Houghton et al IPCCOECDIEA Paris France
[11] The Hindu Paper - httpswwwthehindubusinesslinecomeconomylogisticsBeat-diesel-price-rise-by-cutting-logistics-costsarticle20566696ece~text=Today2C20the20average20mileage20that80020kms20in20developed20countries
[12] Road transport and highway Ministry 2018 httpseconomictimesindiatimescomnewseconomypolicygovernment-raises-load-capacity-for-heavy-vehicles-by-20-25articleshow65017330cmsfrom=mdr~text=The20gross20vehicle20weight20ofcapacity20by20just20over202025
[13] Fuel energy density ndash Diesel - httpsenwikipediaorgwikiEnergy_density
[14] Marland G Boden T A RC Griffin Huang S F Kanciruk P Nelson TR (1989) Estimates of
CO2 Emissions from Fossil Fuel Burning and Cement Manufacturing Based on the United Nationals Energy Statistics and the US Bureau of Mines Cement Manufacturing Data Report No ORNLCDIAC-25 Carbon Dioxide Information Analysis Centre Oak Ridge National Laboratory Oak Ridge Tennessee USA
[15] Worrel E Pryce L Martin N Hendriks C Ozawa L(2001) Carbon dioxide emissions from global
cement industry Annu Rev Energy Environ 26 303-329
Figures
Figure 1
Cement manufacturing processes in a cement plant (Encyclopedia Britannica Inc 2007)
Figure 2
Breakdown of transports by type and coverage (Indian Cement tool)
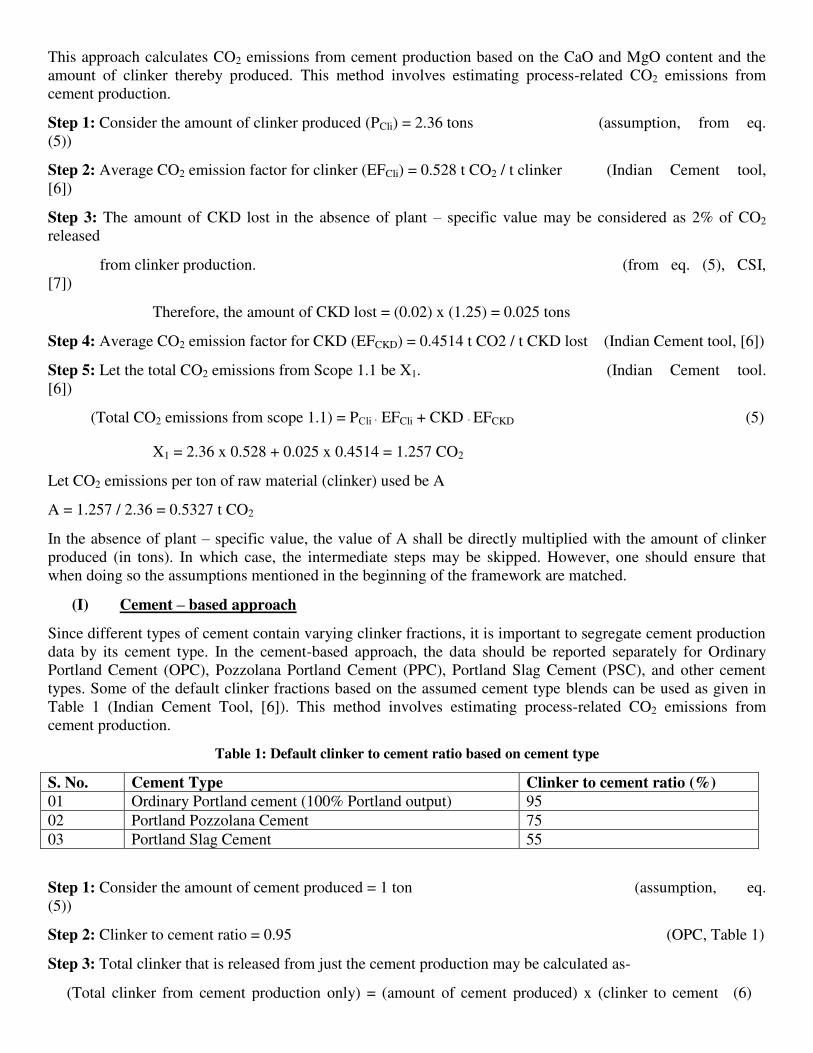
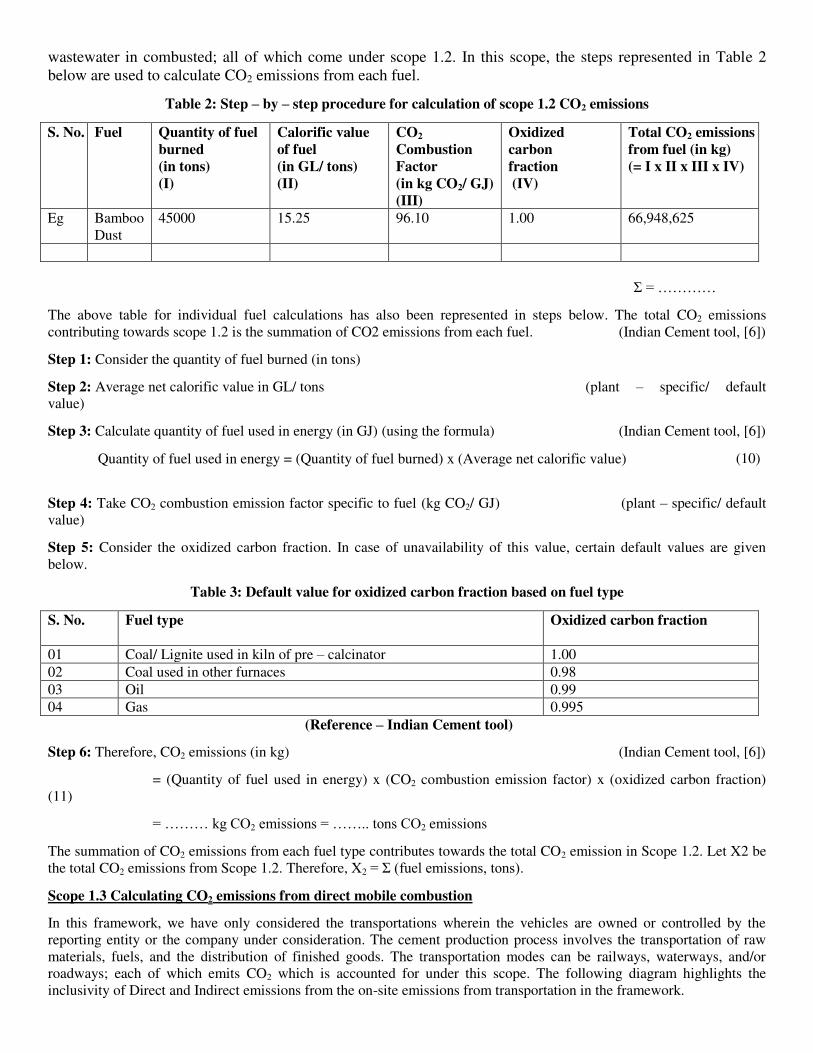
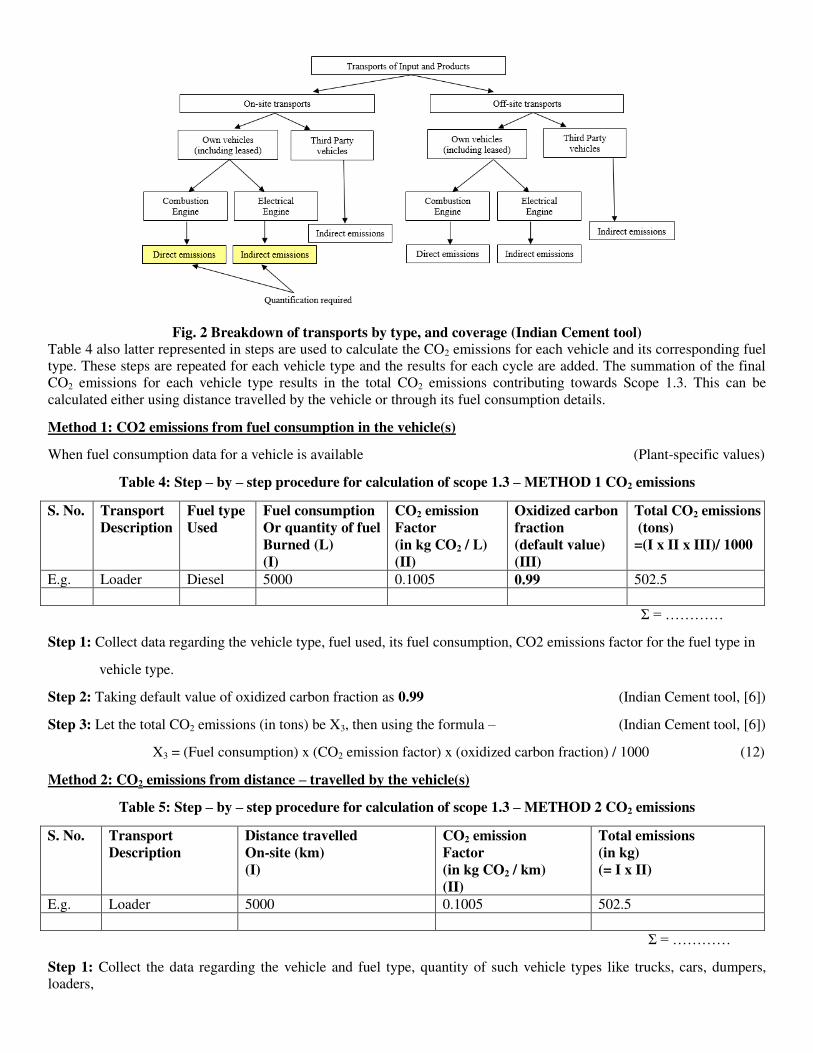

Figures
Figure 1
Cement manufacturing processes in a cement plant (Encyclopedia Britannica Inc 2007)
Figure 2
Breakdown of transports by type and coverage (Indian Cement tool)

Figure 2
Breakdown of transports by type and coverage (Indian Cement tool)