Determining the SIL level of a Safety Instrumented ... SIL Level_ENG… · Nr. of accidents per...
96
Determining the SIL level of a Safety Instrumented Function (SIF)
Transcript of Determining the SIL level of a Safety Instrumented ... SIL Level_ENG… · Nr. of accidents per...
Determining the SIL level of a Safety Instrumented Function
(SIF)
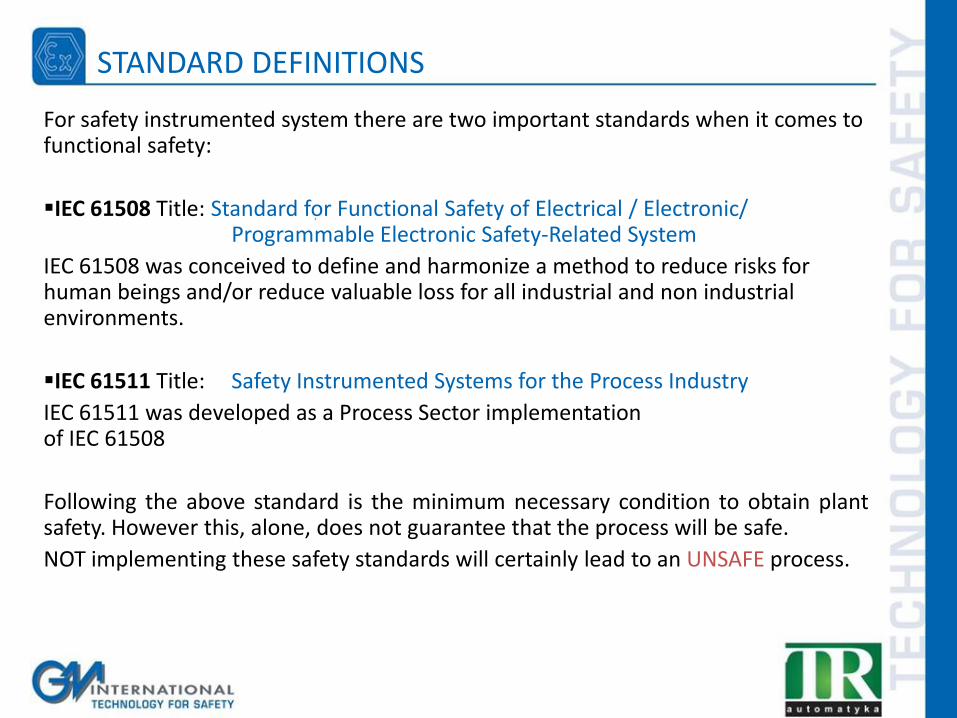
For safety instrumented system there are two important standards when it comes to functional safety:
IEC 61508 Title: Standard for Functional Safety of Electrical / Electronic/ Programmable Electronic Safety-Related System
IEC 61508 was conceived to define and harmonize a method to reduce risks for human beings and/or reduce valuable loss for all industrial and non industrial environments.
IEC 61511 Title: Safety Instrumented Systems for the Process Industry
IEC 61511 was developed as a Process Sector implementation of IEC 61508
Following the above standard is the minimum necessary condition to obtain plant safety. However this, alone, does not guarantee that the process will be safe.
NOT implementing these safety standards will certainly lead to an UNSAFE process.
STANDARD DEFINITIONS
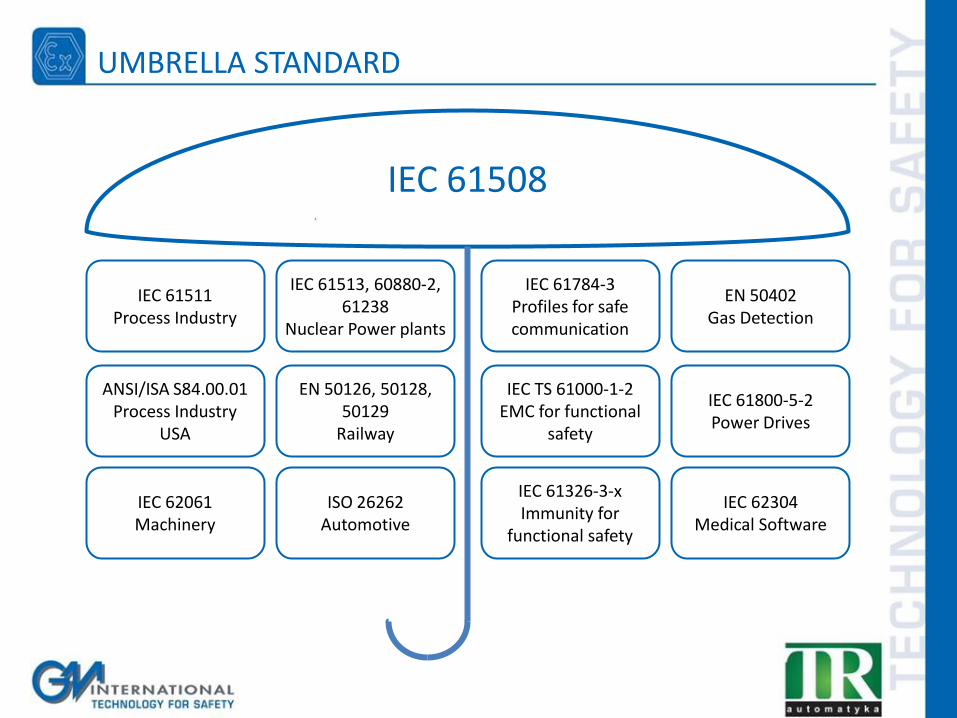
UMBRELLA STANDARD
IEC 61508
IEC 61511 Process Industry
IEC 61513, 60880-2, 61238
Nuclear Power plants
ANSI/ISA S84.00.01 Process Industry
USA
EN 50126, 50128, 50129
Railway
IEC 62061 Machinery
ISO 26262 Automotive
IEC 61784-3 Profiles for safe communication
EN 50402 Gas Detection
IEC TS 61000-1-2 EMC for functional
safety
IEC 61800-5-2 Power Drives
IEC 61326-3-x Immunity for
functional safety
IEC 62304 Medical Software
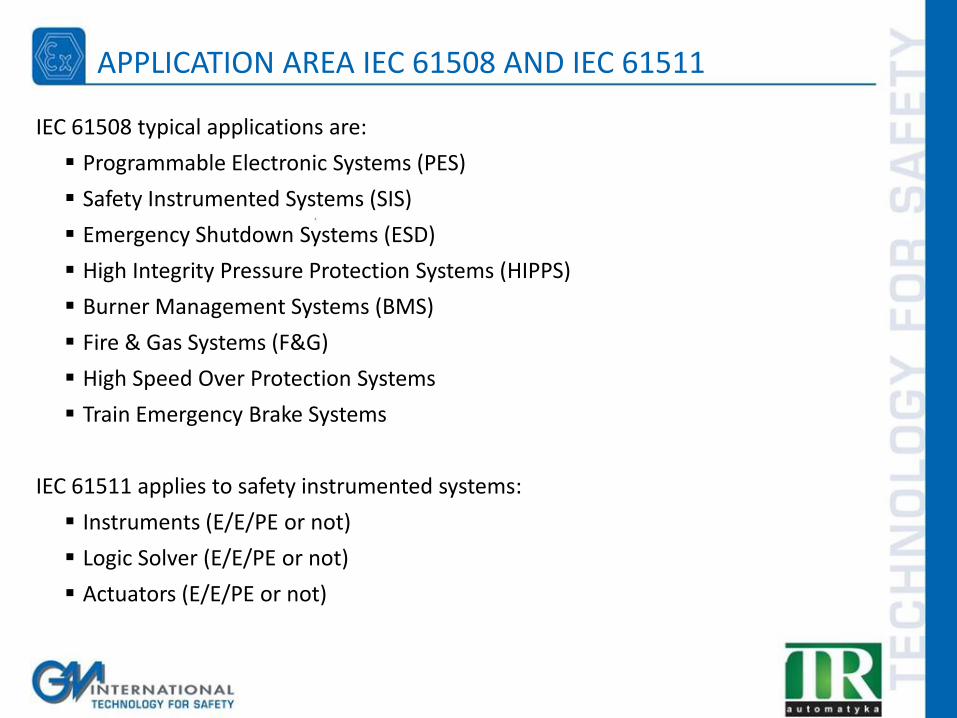
APPLICATION AREA IEC 61508 AND IEC 61511
IEC 61508 typical applications are:
Programmable Electronic Systems (PES)
Safety Instrumented Systems (SIS)
Emergency Shutdown Systems (ESD)
High Integrity Pressure Protection Systems (HIPPS)
Burner Management Systems (BMS)
Fire & Gas Systems (F&G)
High Speed Over Protection Systems
Train Emergency Brake Systems
IEC 61511 applies to safety instrumented systems:
Instruments (E/E/PE or not)
Logic Solver (E/E/PE or not)
Actuators (E/E/PE or not)
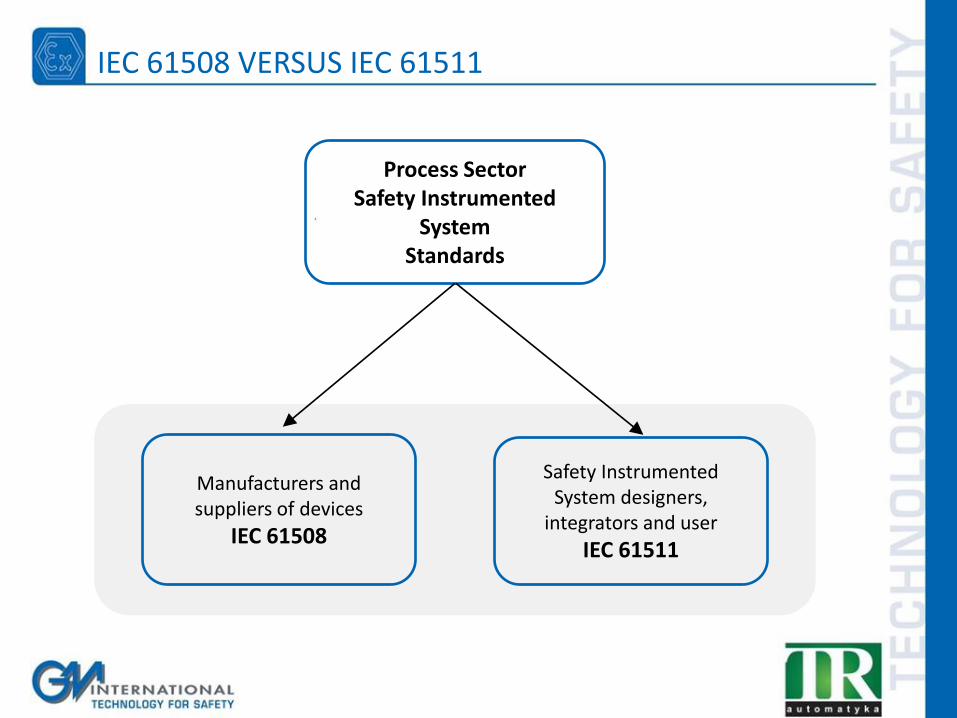
IEC 61508 VERSUS IEC 61511
Process Sector Safety Instrumented
System Standards
Manufacturers and suppliers of devices
IEC 61508
Safety Instrumented System designers,
integrators and user
IEC 61511
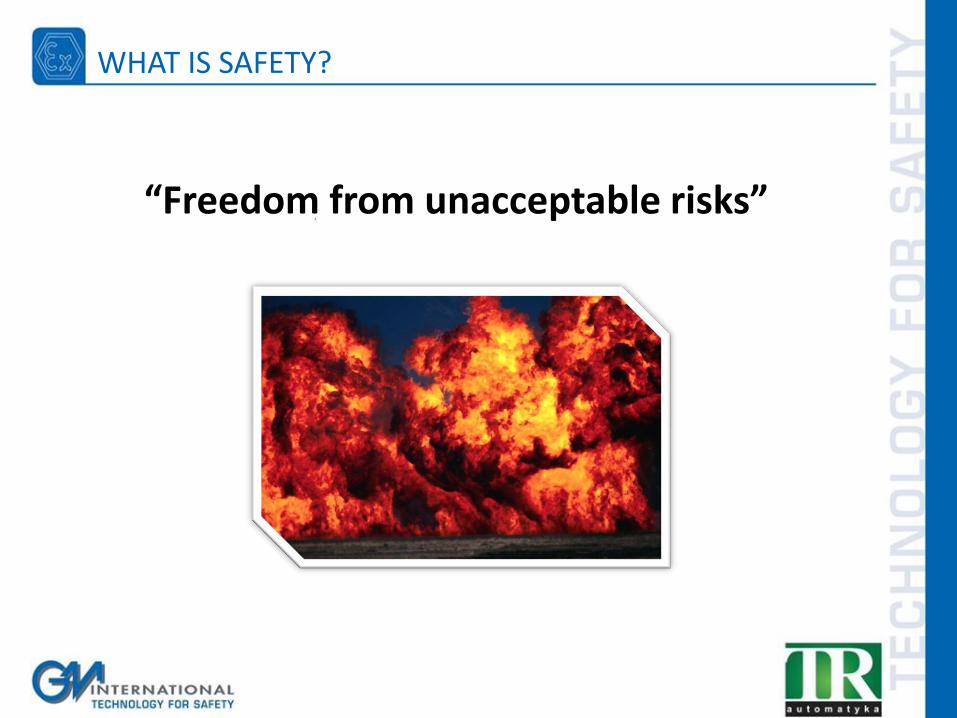
“Freedom from unacceptable risks”
WHAT IS SAFETY?
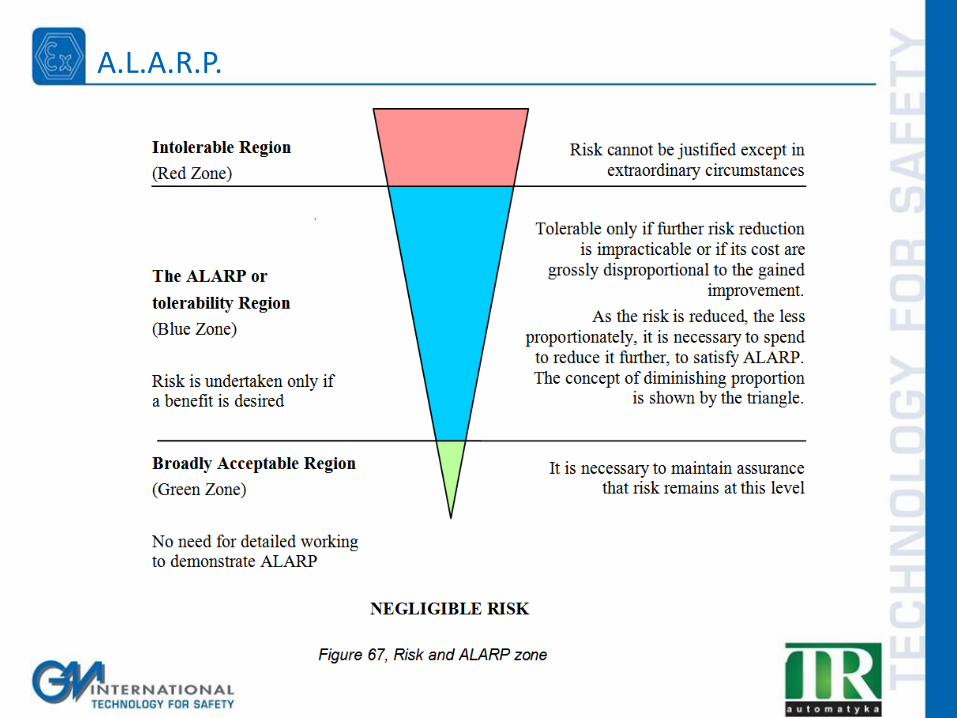
A.L.A.R.P.
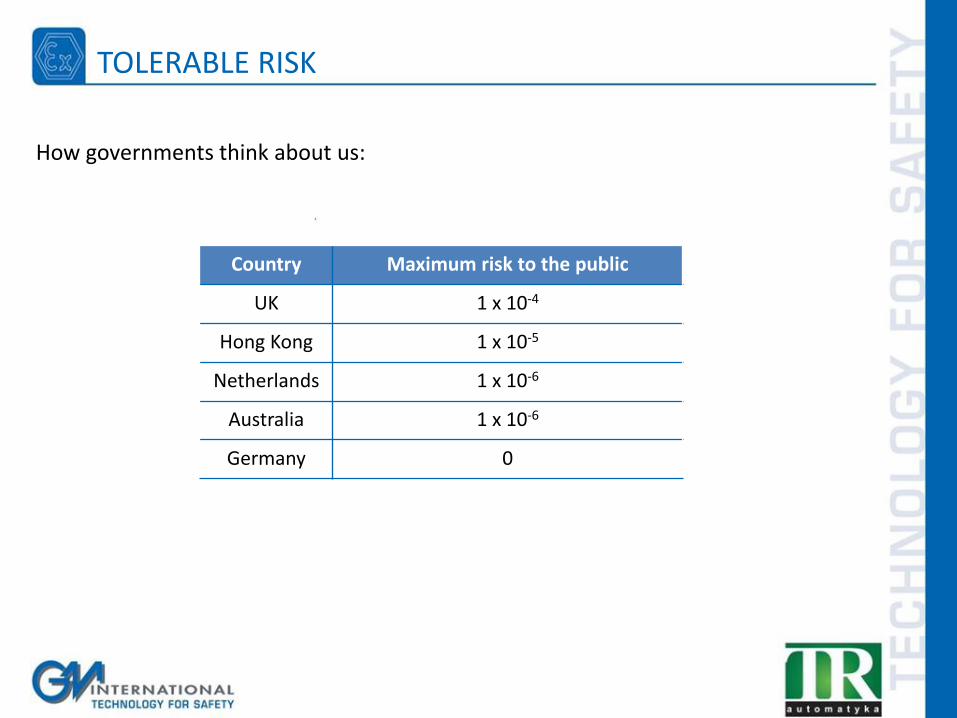
TOLERABLE RISK
Country Maximum risk to the public
UK 1 x 10⁻⁴
Hong Kong 1 x 10⁻⁵
Netherlands 1 x 10⁻⁶
Australia 1 x 10⁻⁶
Germany 0
How governments think about us:
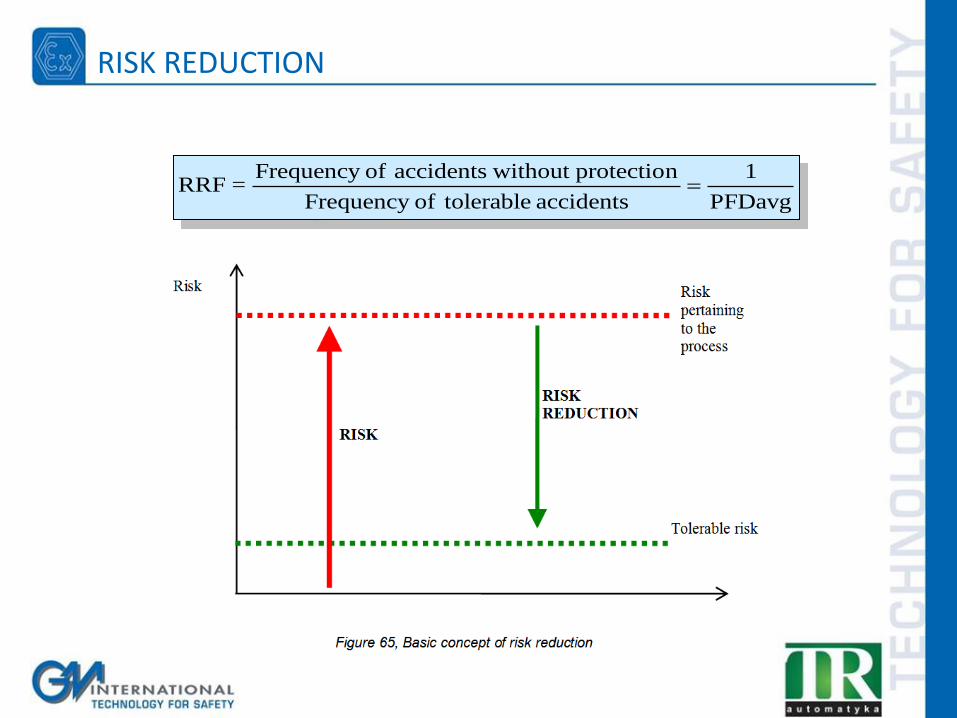
Frequency of accidents without protection 1RRF =
Frequency of tolerable accidents PFDavg
RISK REDUCTION
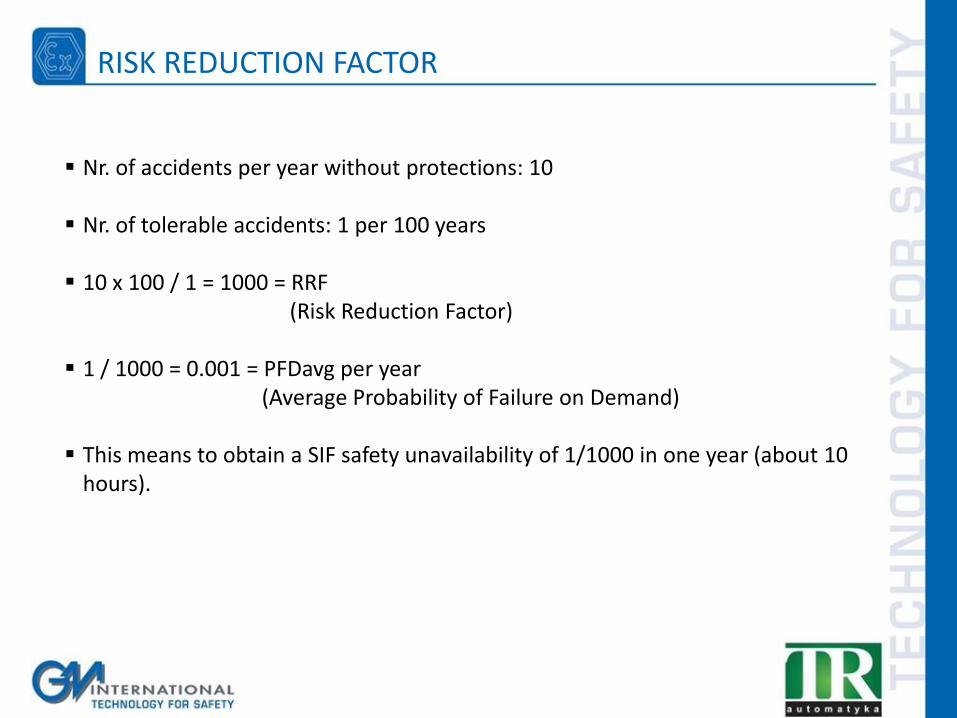
RISK REDUCTION FACTOR
Nr. of accidents per year without protections: 10
Nr. of tolerable accidents: 1 per 100 years
10 x 100 / 1 = 1000 = RRF (Risk Reduction Factor)
1 / 1000 = 0.001 = PFDavg per year (Average Probability of Failure on Demand)
This means to obtain a SIF safety unavailability of 1/1000 in one year (about 10 hours).
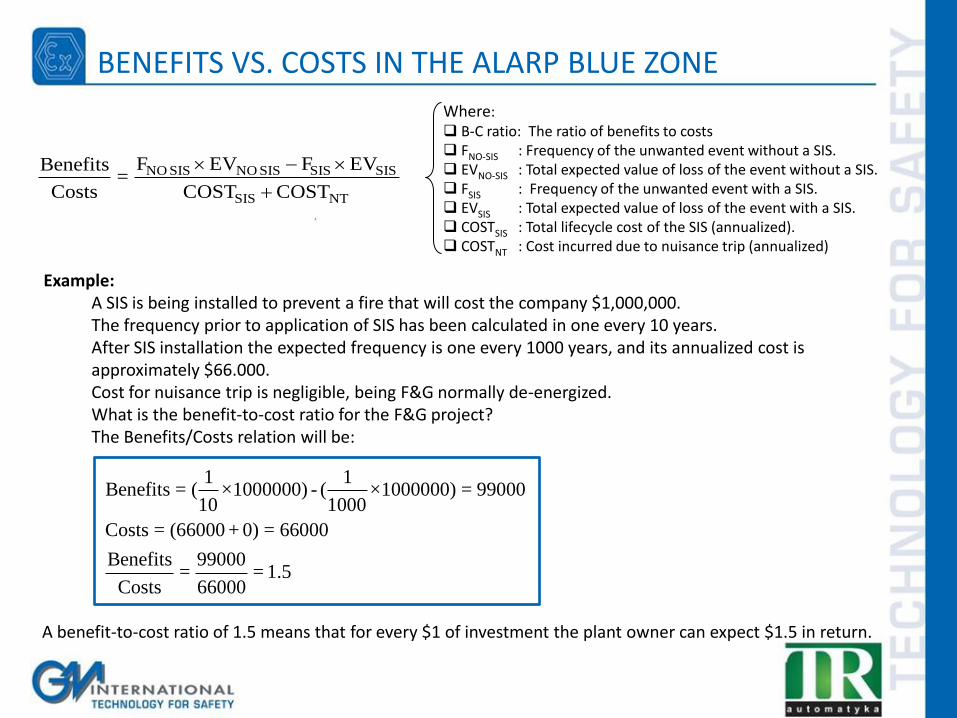
1 1Benefits = ( ×1000000) - ( ×1000000) = 99000
10 1000
Costs = (66000 + 0) = 66000
Benefits 99000= = 1.5
Costs 66000
NO SIS NO SIS SIS SIS
SIS NT
F EV F EVBenefits=
Costs COST COST
Where: B-C ratio: The ratio of benefits to costs FNO-SIS : Frequency of the unwanted event without a SIS. EVNO-SIS : Total expected value of loss of the event without a SIS. FSIS : Frequency of the unwanted event with a SIS. EVSIS : Total expected value of loss of the event with a SIS. COSTSIS : Total lifecycle cost of the SIS (annualized). COSTNT : Cost incurred due to nuisance trip (annualized)
Example: A SIS is being installed to prevent a fire that will cost the company $1,000,000. The frequency prior to application of SIS has been calculated in one every 10 years. After SIS installation the expected frequency is one every 1000 years, and its annualized cost is approximately $66.000. Cost for nuisance trip is negligible, being F&G normally de-energized. What is the benefit-to-cost ratio for the F&G project? The Benefits/Costs relation will be:
A benefit-to-cost ratio of 1.5 means that for every $1 of investment the plant owner can expect $1.5 in return.
BENEFITS VS. COSTS IN THE ALARP BLUE ZONE
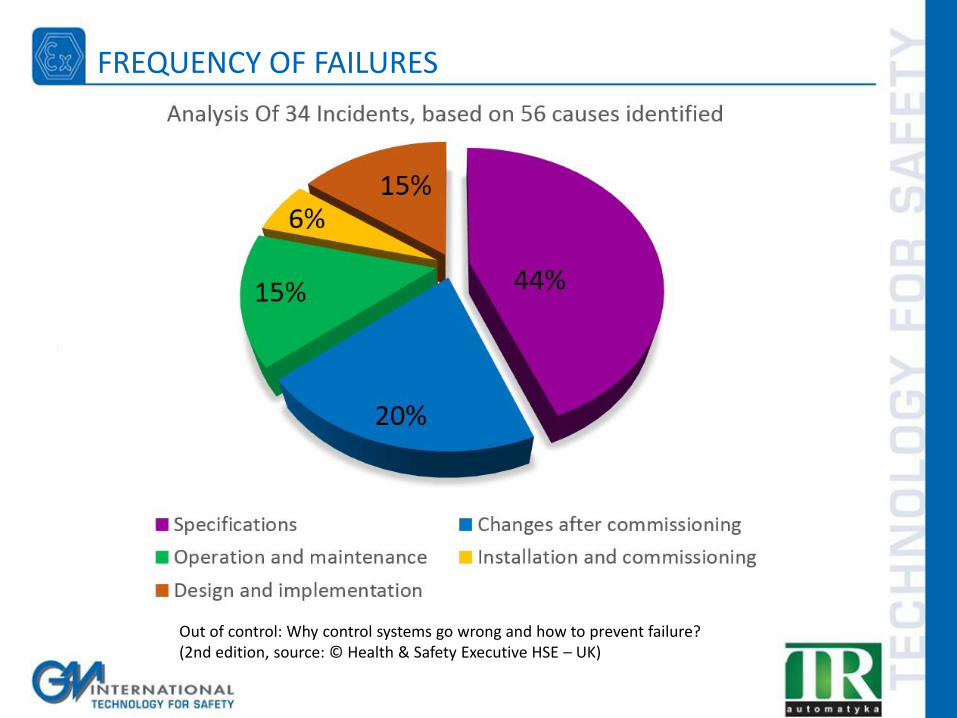
FREQUENCY OF FAILURES
Out of control: Why control systems go wrong and how to prevent failure? (2nd edition, source: © Health & Safety Executive HSE – UK)
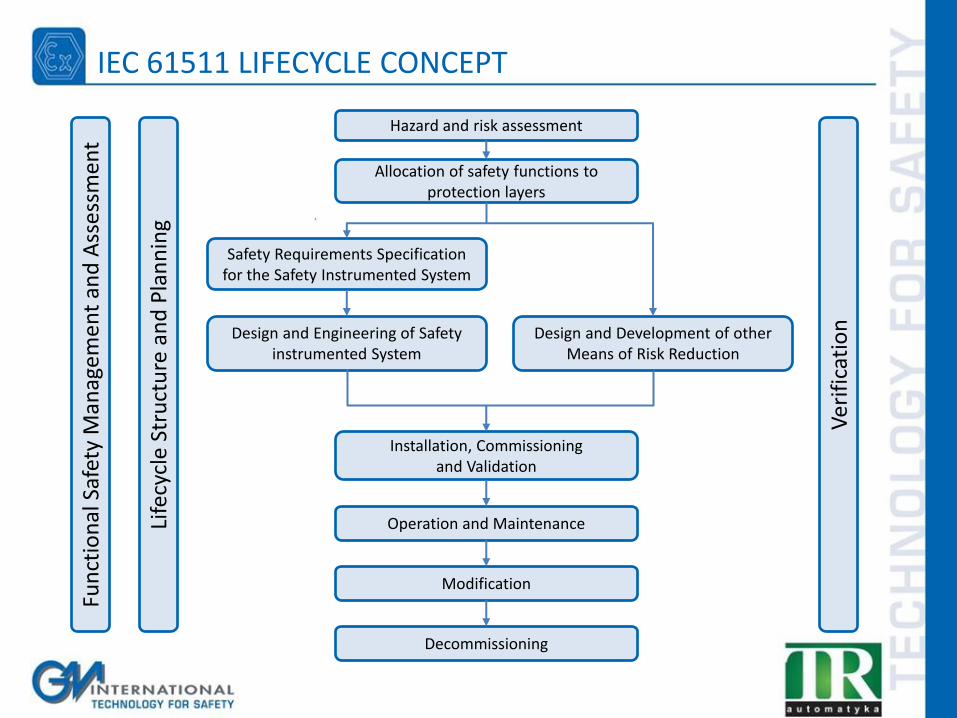
IEC 61511 LIFECYCLE CONCEPT Fu
nct
ion
al S
afet
y M
anag
eme
nt
and
Ass
ess
men
t
Life
cycl
e St
ruct
ure
an
d P
lan
nin
g
Ver
ific
atio
n
Hazard and risk assessment
Allocation of safety functions to protection layers
Safety Requirements Specification for the Safety Instrumented System
Design and Development of other Means of Risk Reduction
Design and Engineering of Safety instrumented System
Installation, Commissioning and Validation
Operation and Maintenance
Modification
Decommissioning
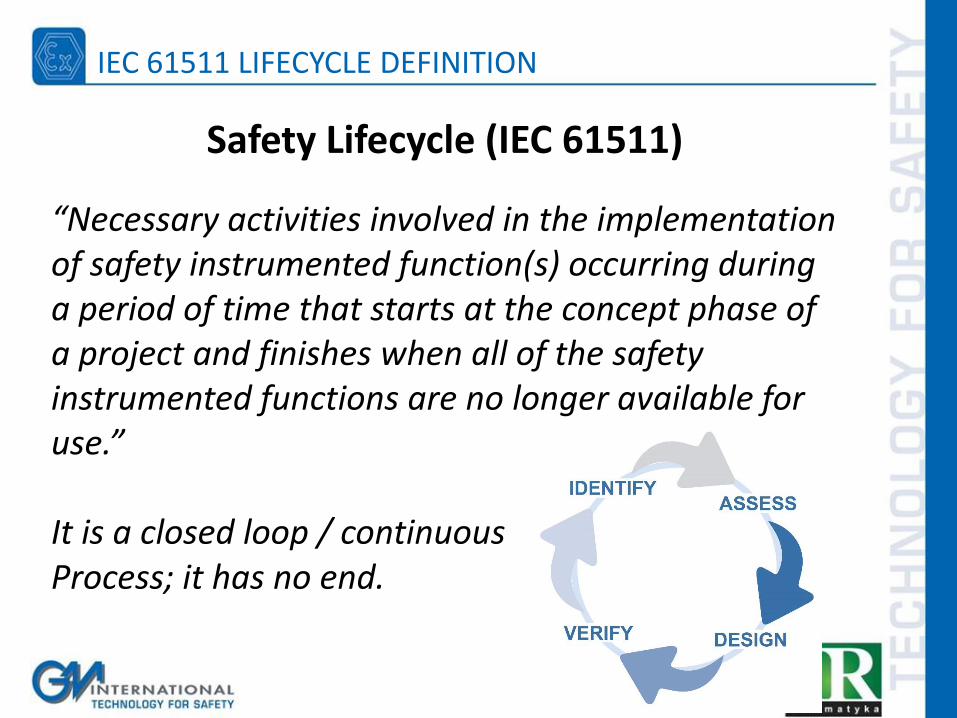
Safety Lifecycle (IEC 61511)
“Necessary activities involved in the implementation of safety instrumented function(s) occurring during a period of time that starts at the concept phase of a project and finishes when all of the safety instrumented functions are no longer available for use.” It is a closed loop / continuous Process; it has no end.
IEC 61511 LIFECYCLE DEFINITION
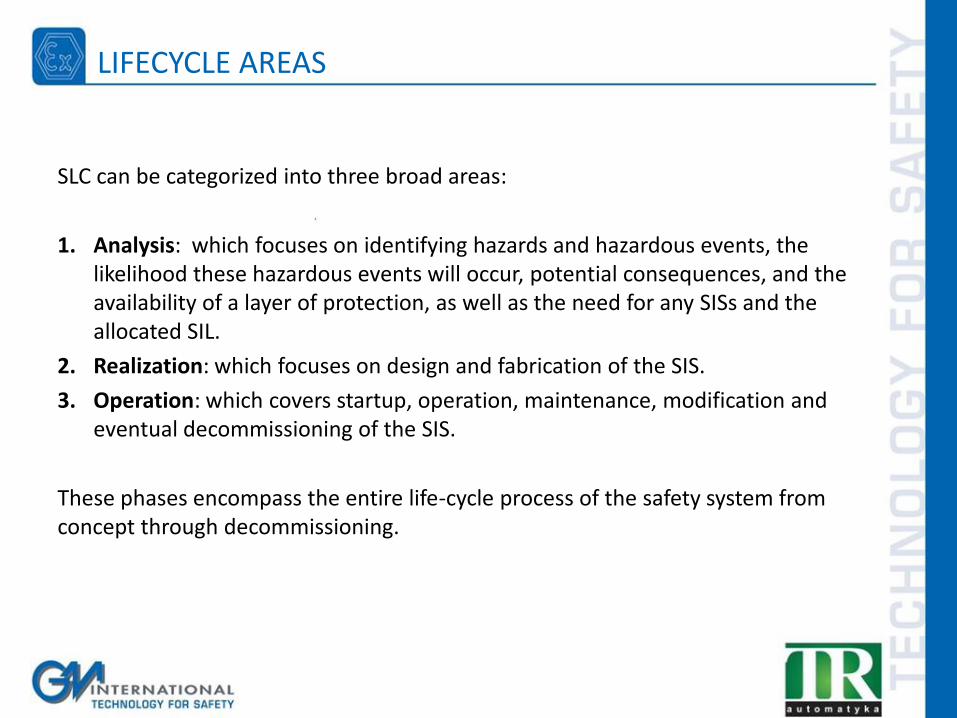
SLC can be categorized into three broad areas:
1. Analysis: which focuses on identifying hazards and hazardous events, the likelihood these hazardous events will occur, potential consequences, and the availability of a layer of protection, as well as the need for any SISs and the allocated SIL.
2. Realization: which focuses on design and fabrication of the SIS.
3. Operation: which covers startup, operation, maintenance, modification and eventual decommissioning of the SIS.
These phases encompass the entire life-cycle process of the safety system from concept through decommissioning.
LIFECYCLE AREAS
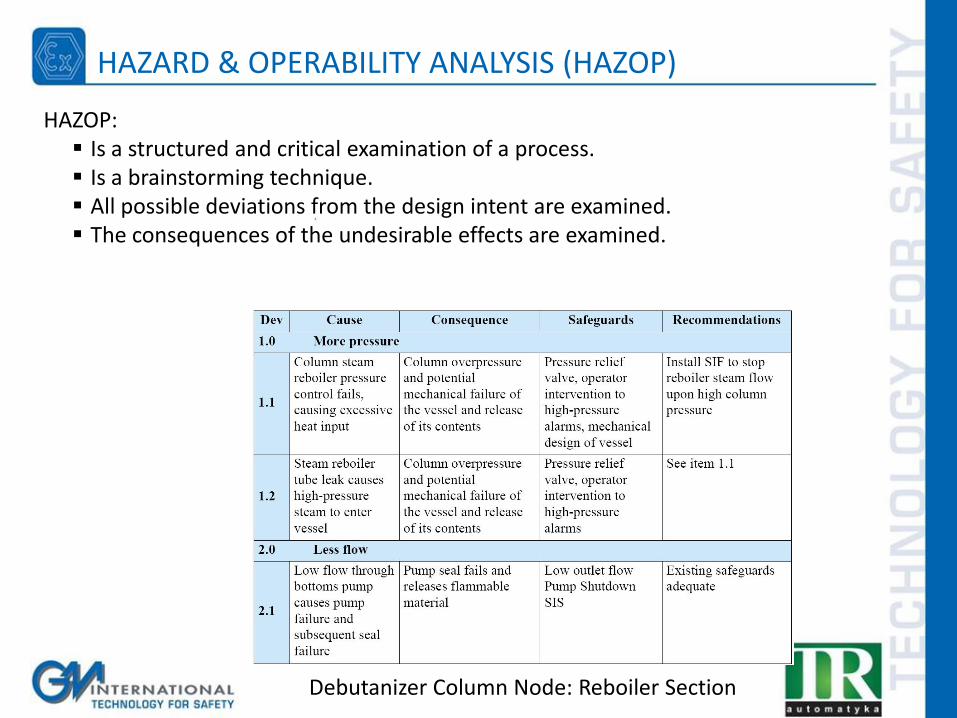
Debutanizer Column Node: Reboiler Section
HAZOP: Is a structured and critical examination of a process. Is a brainstorming technique. All possible deviations from the design intent are examined. The consequences of the undesirable effects are examined.
HAZARD & OPERABILITY ANALYSIS (HAZOP)
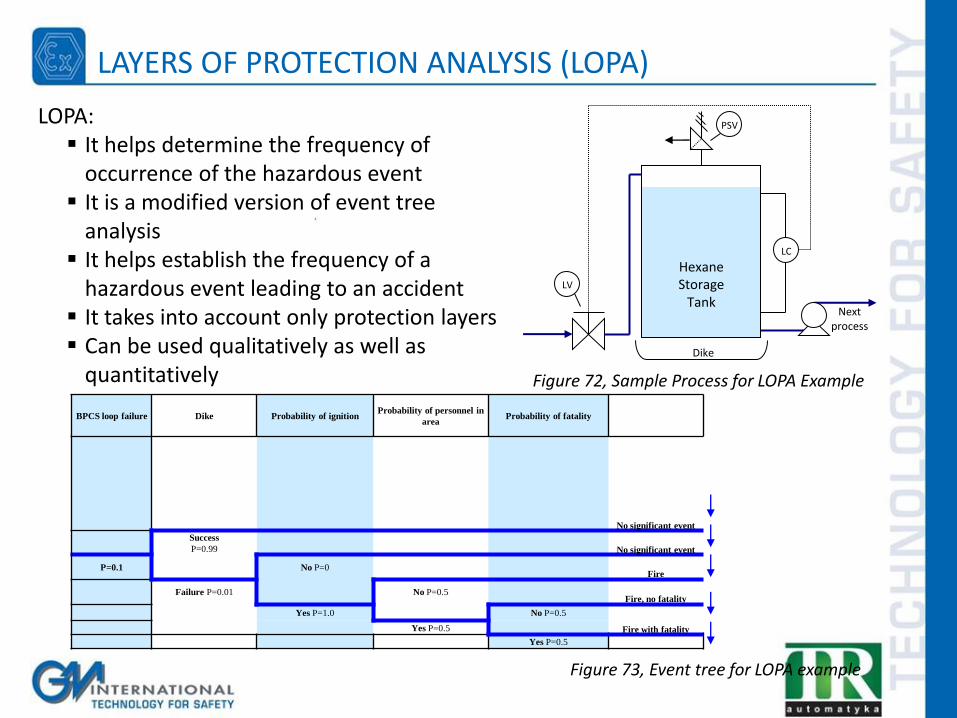
Figure 72, Sample Process for LOPA Example
Figure 73, Event tree for LOPA example
Hexane Storage
Tank
PSV
LV
LC
Next process
Dike
BPCS loop failure Dike Probability of ignition Probability of personnel in
area Probability of fatality
No significant event
Success
P=0.99 No significant event
P=0.1 No P=0
Fire
Failure P=0.01 No P=0.5 Fire, no fatality
Yes P=1.0 No P=0.5
Yes P=0.5 Fire with fatality
Yes P=0.5
LOPA: It helps determine the frequency of
occurrence of the hazardous event It is a modified version of event tree
analysis It helps establish the frequency of a
hazardous event leading to an accident It takes into account only protection layers Can be used qualitatively as well as
quantitatively
LAYERS OF PROTECTION ANALYSIS (LOPA)
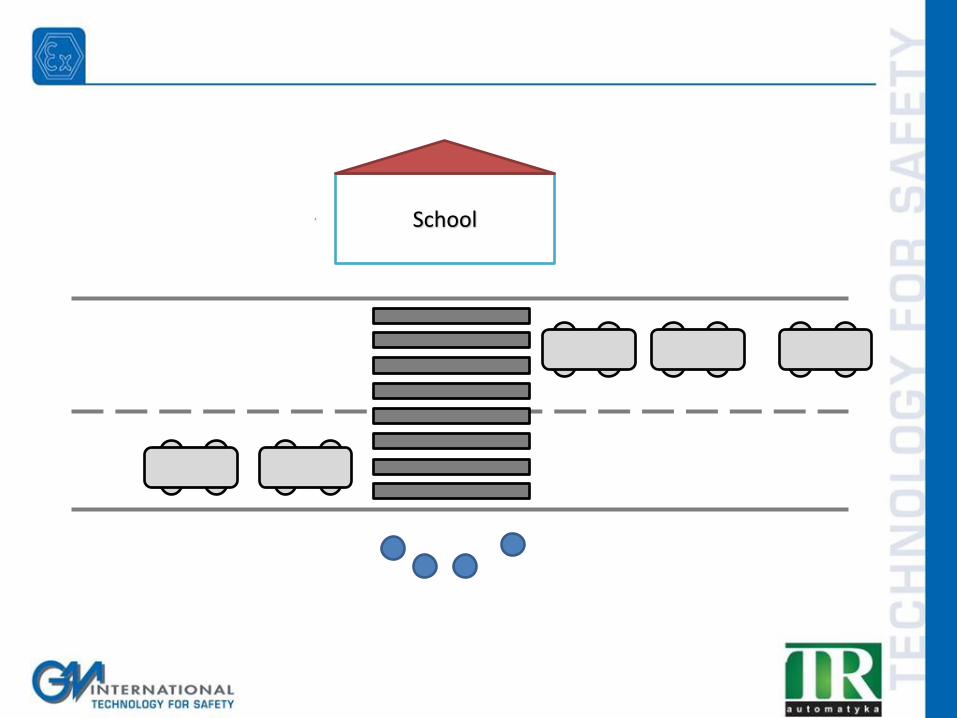
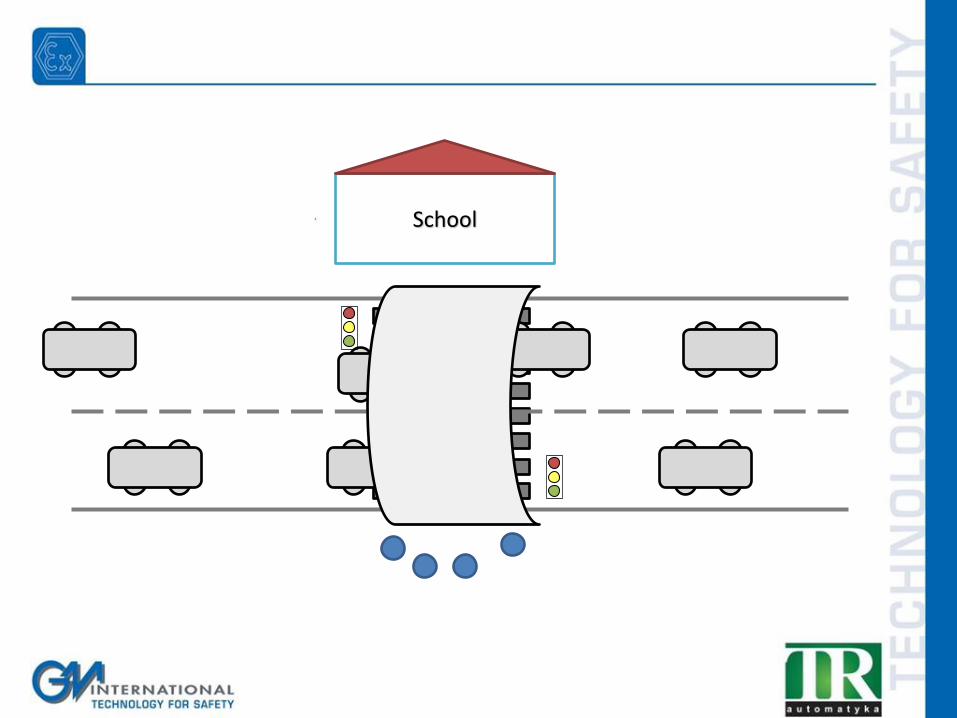
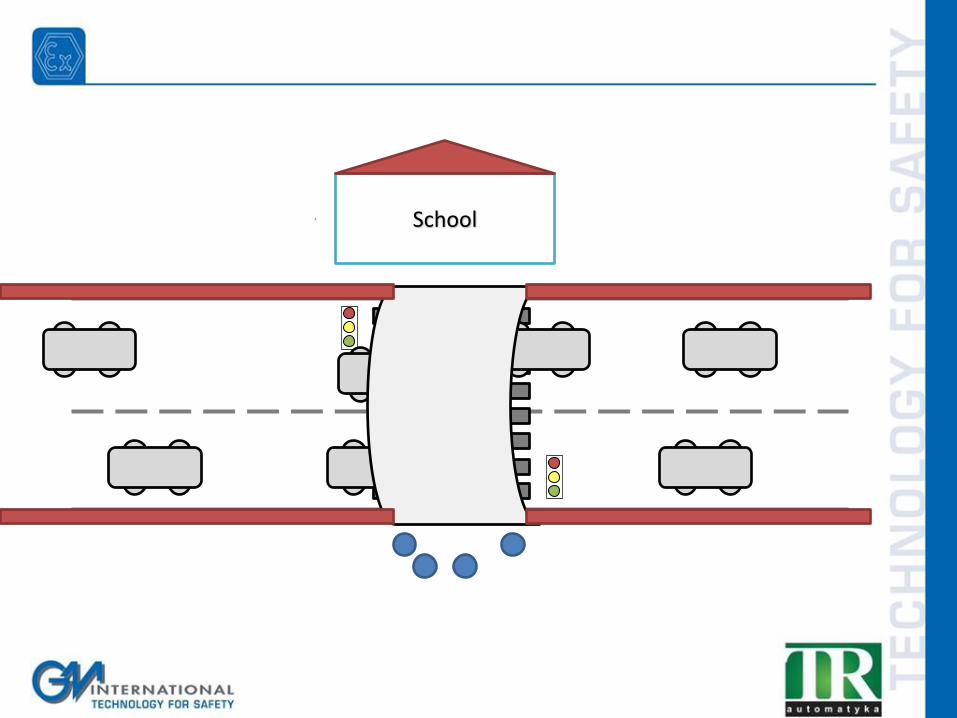
RISK REDUCTION WITH PROTECTION LAYERS
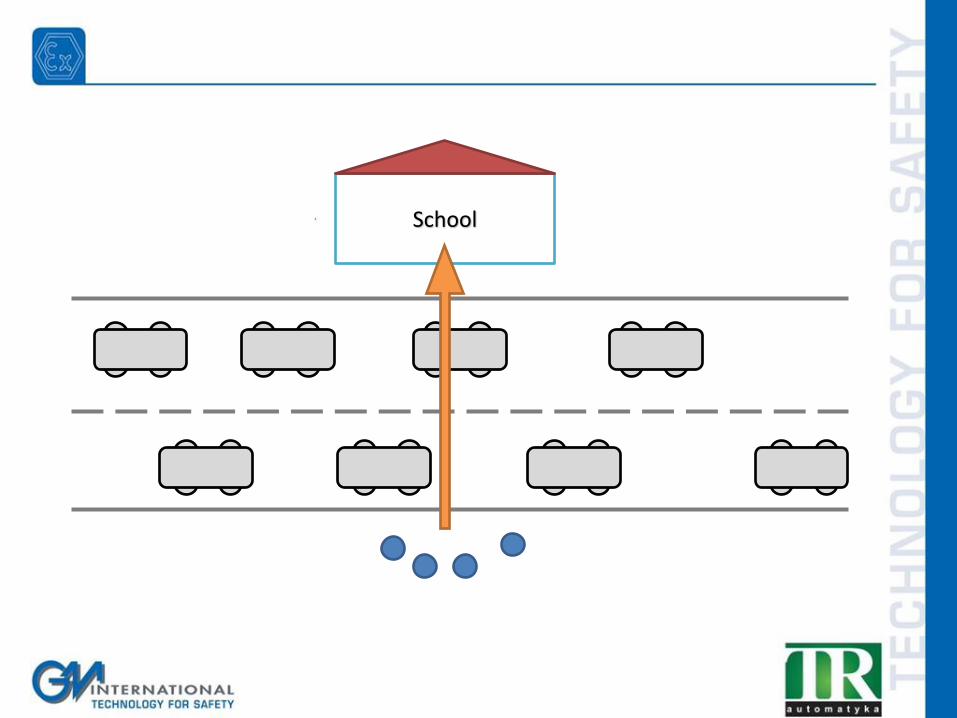
School
School

School
School
School
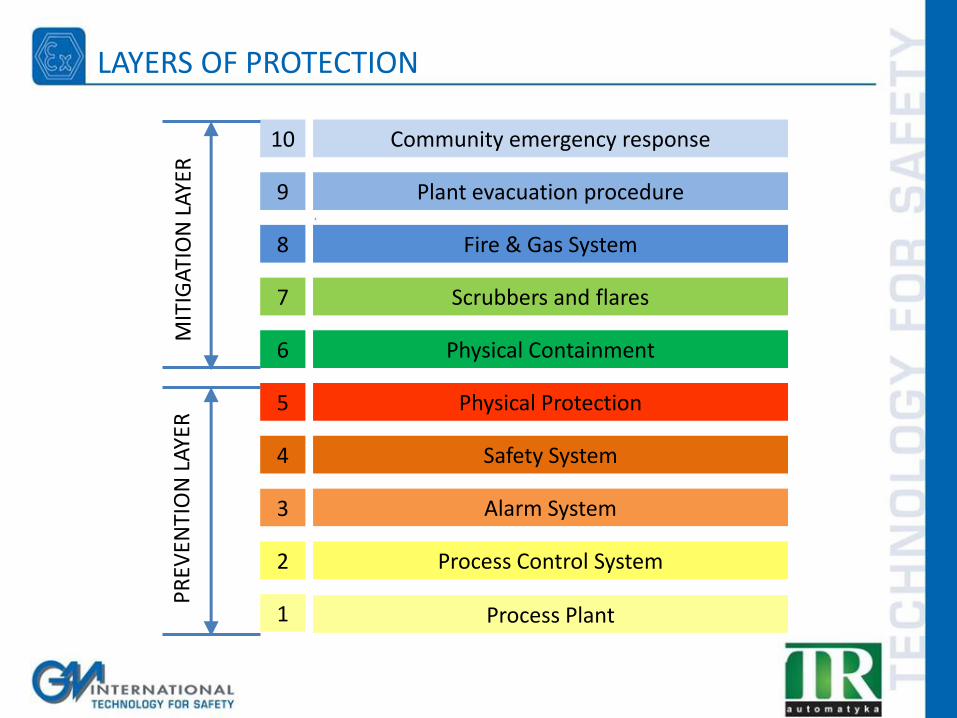
LAYERS OF PROTECTION
Community emergency response 10
Plant evacuation procedure 9
Fire & Gas System 8
Scrubbers and flares 7
Physical Containment 6
Physical Protection 5
Safety System 4
Alarm System 3
Process Control System 2
Process Plant 1
PR
EVEN
TIO
N L
AYE
R
MIT
IGA
TIO
N L
AYE
R
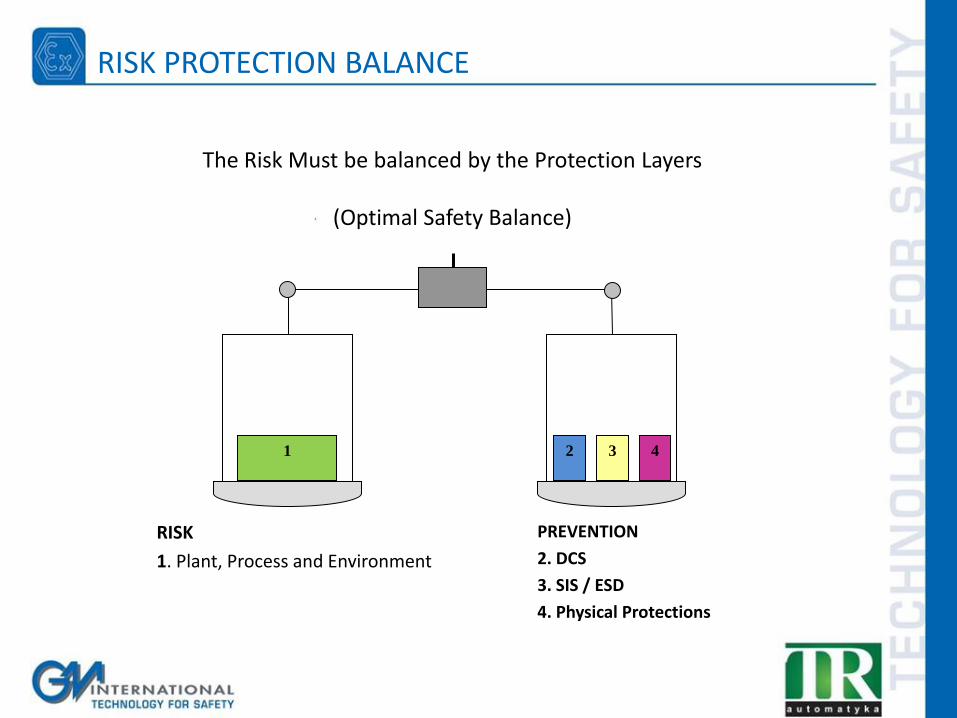
The Risk Must be balanced by the Protection Layers
(Optimal Safety Balance)
1 2 3 4
RISK
1. Plant, Process and Environment
PREVENTION
2. DCS
3. SIS / ESD
4. Physical Protections
RISK PROTECTION BALANCE
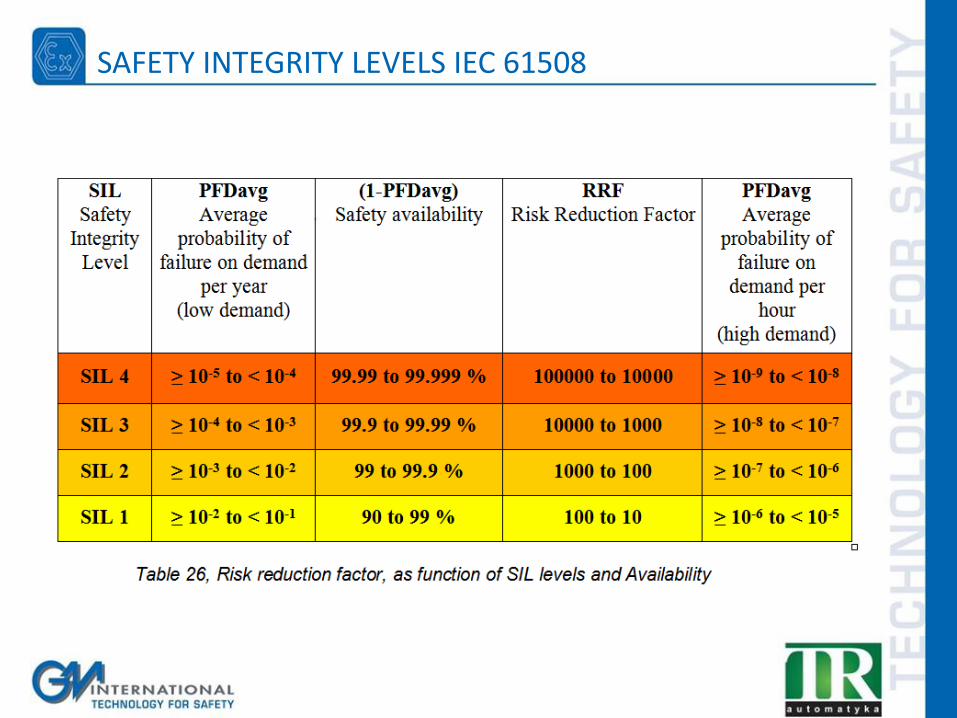
SAFETY INTEGRITY LEVELS IEC 61508
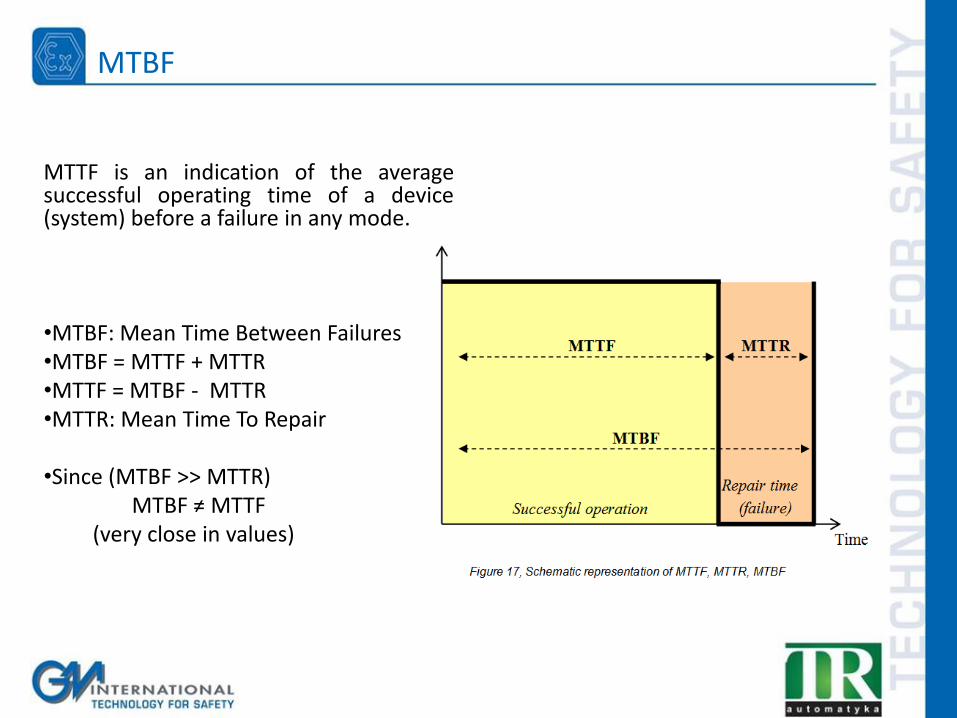
MTTF is an indication of the average successful operating time of a device (system) before a failure in any mode.
•MTBF: Mean Time Between Failures •MTBF = MTTF + MTTR •MTTF = MTBF - MTTR •MTTR: Mean Time To Repair •Since (MTBF >> MTTR) MTBF ≠ MTTF (very close in values)
MTBF
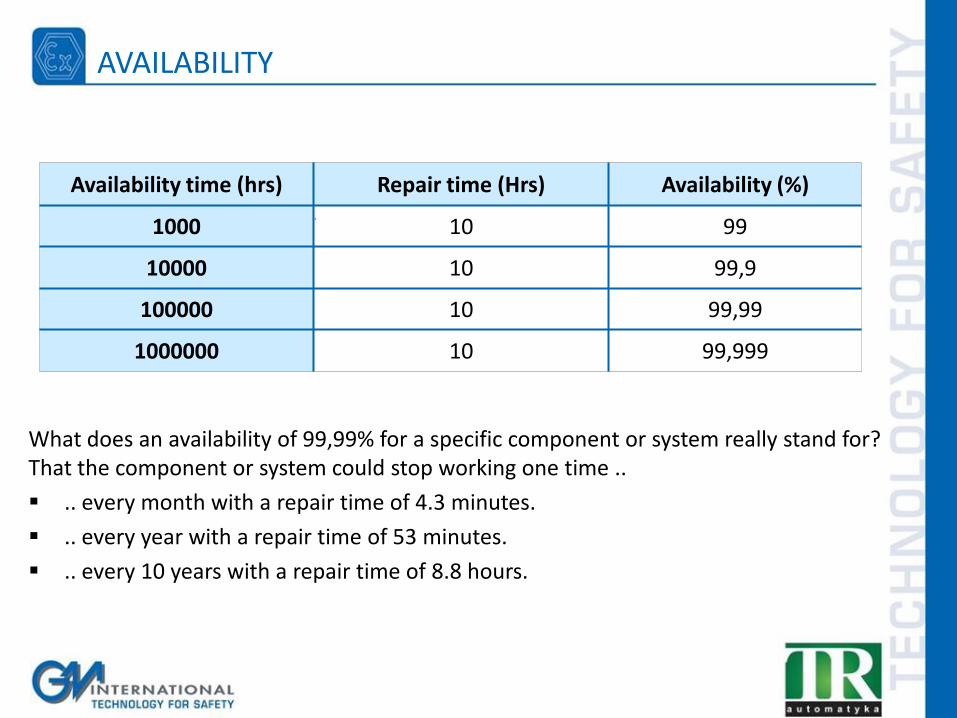
Availability time (hrs) Repair time (Hrs) Availability (%)
1000 10 99
10000 10 99,9
100000 10 99,99
1000000 10 99,999
What does an availability of 99,99% for a specific component or system really stand for? That the component or system could stop working one time ..
.. every month with a repair time of 4.3 minutes.
.. every year with a repair time of 53 minutes.
.. every 10 years with a repair time of 8.8 hours.
AVAILABILITY
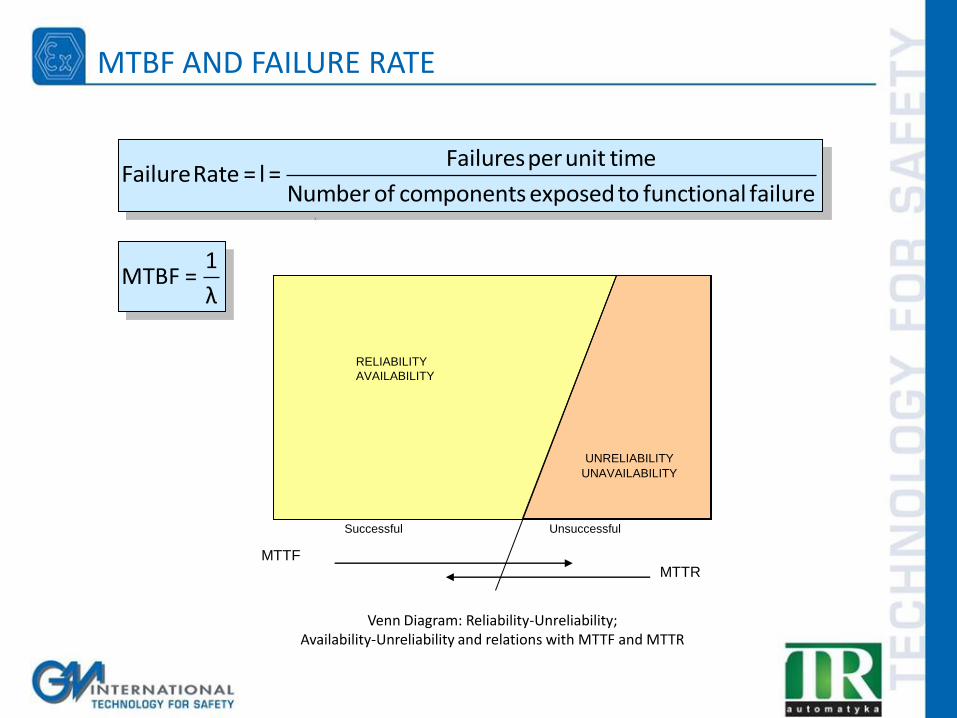
1
MTBF =λ
Failures per unit timeFailure Rate = l =
Number of components exposed to functional failure
Successful Unsuccessful
UNRELIABILITY
UNAVAILABILITY
RELIABILITY
AVAILABILITY
MTTR MTTF
Venn Diagram: Reliability-Unreliability;
Availability-Unreliability and relations with MTTF and MTTR
MTBF AND FAILURE RATE
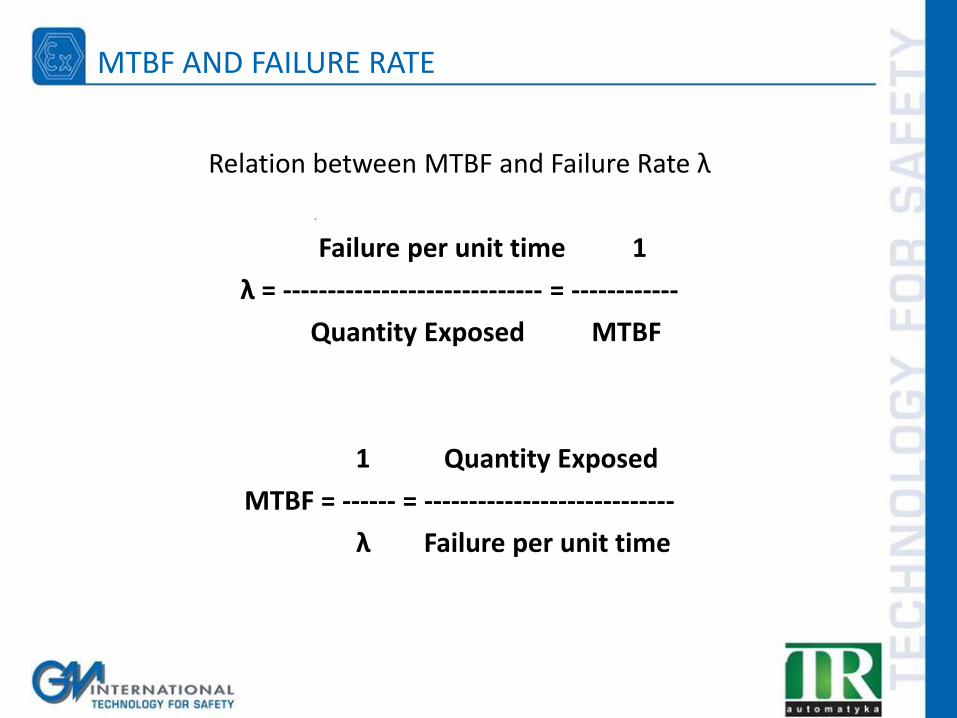
Relation between MTBF and Failure Rate λ
Failure per unit time 1
λ = ----------------------------- = ------------
Quantity Exposed MTBF
1 Quantity Exposed
MTBF = ------ = ----------------------------
λ Failure per unit time
MTBF AND FAILURE RATE
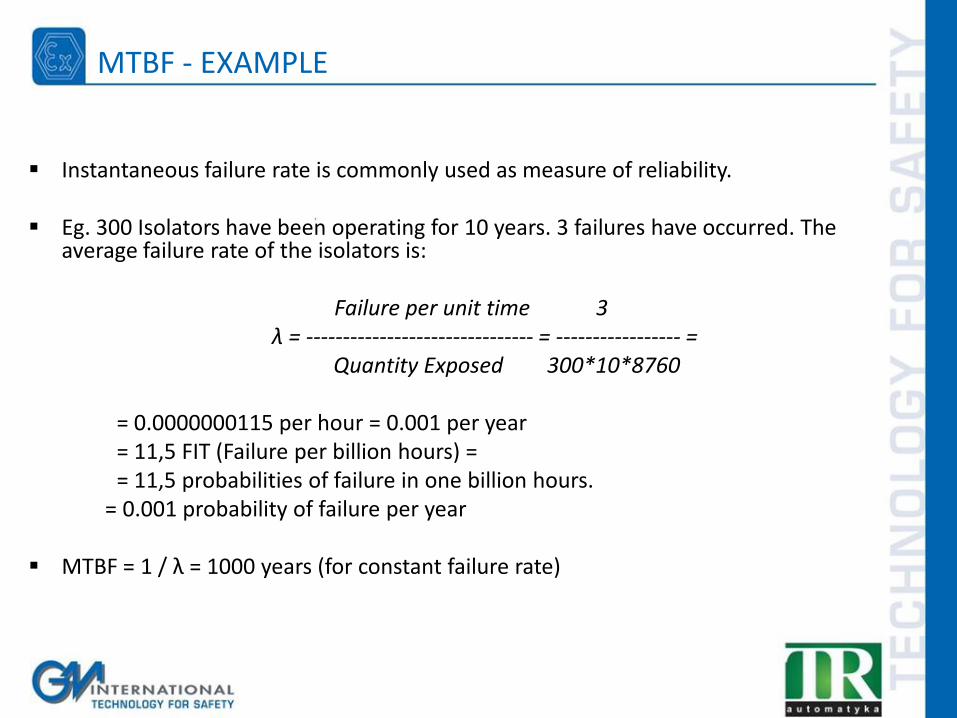
Instantaneous failure rate is commonly used as measure of reliability.
Eg. 300 Isolators have been operating for 10 years. 3 failures have occurred. The average failure rate of the isolators is:
Failure per unit time 3 λ = ------------------------------- = ----------------- =
Quantity Exposed 300*10*8760 = 0.0000000115 per hour = 0.001 per year = 11,5 FIT (Failure per billion hours) = = 11,5 probabilities of failure in one billion hours. = 0.001 probability of failure per year
MTBF = 1 / λ = 1000 years (for constant failure rate)
MTBF - EXAMPLE
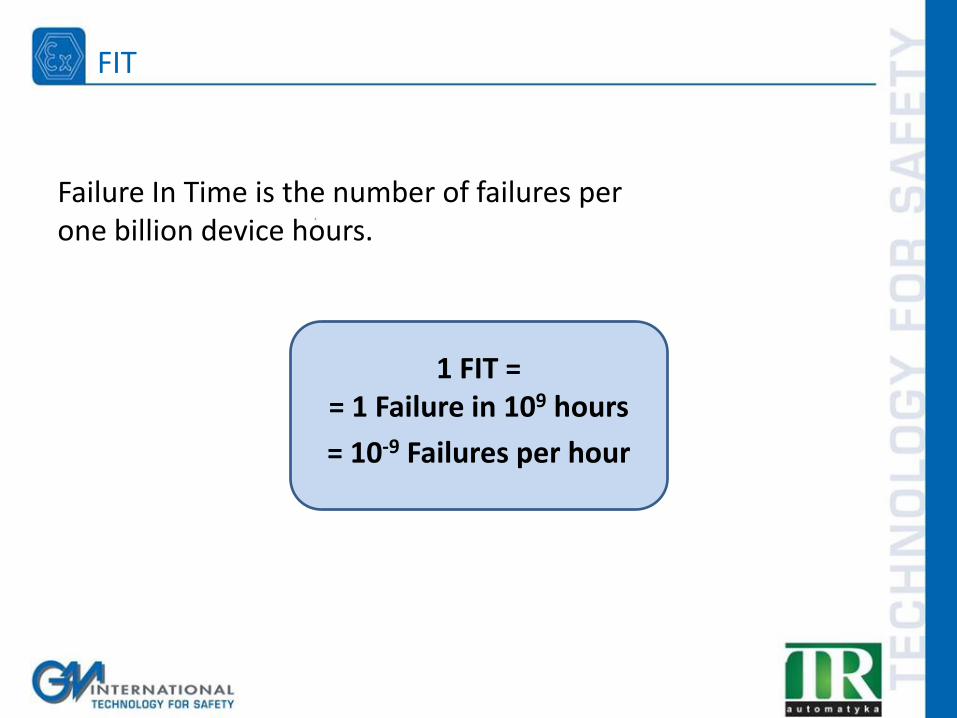
Failure In Time is the number of failures per one billion device hours.
1 FIT = = 1 Failure in 109 hours
= 10-9 Failures per hour
FIT
0,8 mA
20 mA
4 mA
du
dd/sd
su
du
dd/sd
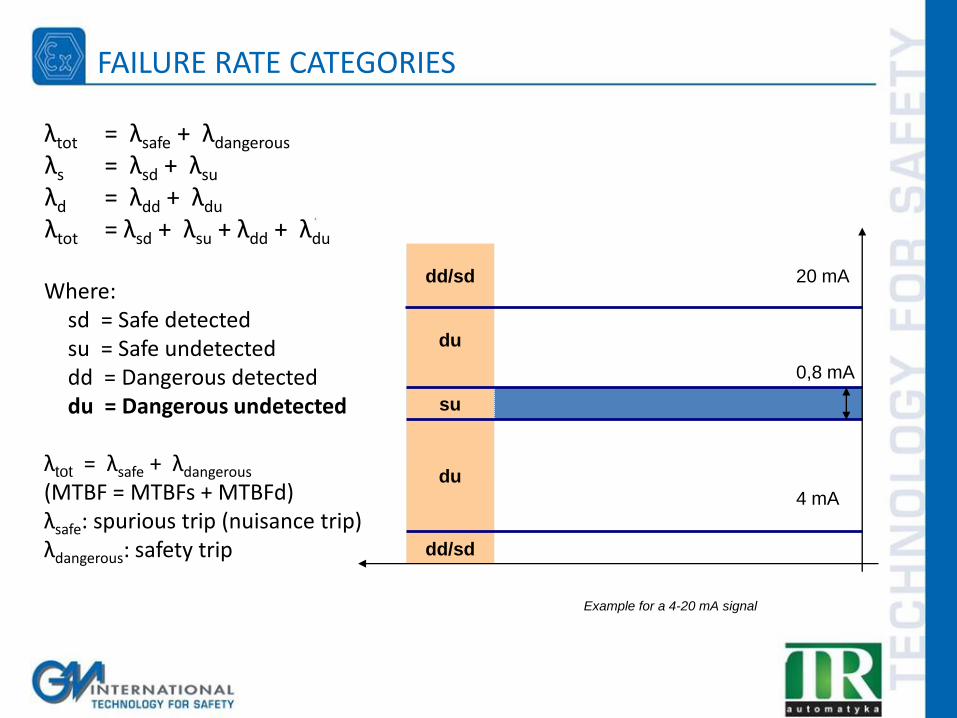
Example for a 4-20 mA signal
λtot = λsafe + λdangerous λs = λsd + λsu
λd = λdd + λdu
λtot = λsd + λsu + λdd + λdu
Where: sd = Safe detected su = Safe undetected dd = Dangerous detected du = Dangerous undetected λtot = λsafe + λdangerous
(MTBF = MTBFs + MTBFd) λsafe: spurious trip (nuisance trip) λdangerous: safety trip
FAILURE RATE CATEGORIES
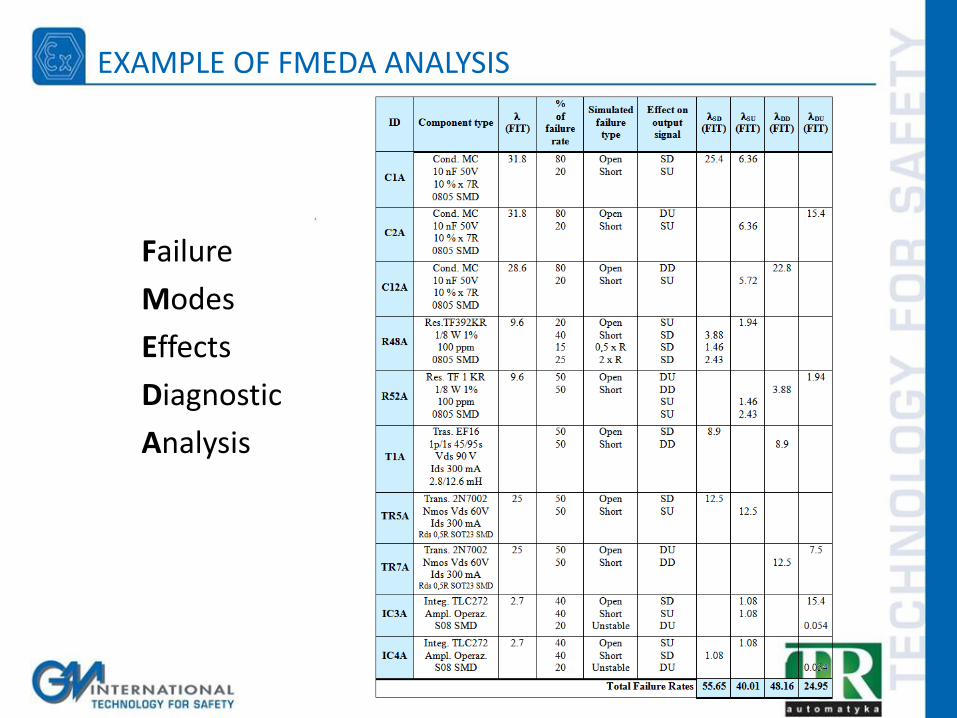
Failure
Modes
Effects
Diagnostic
Analysis
EXAMPLE OF FMEDA ANALYSIS
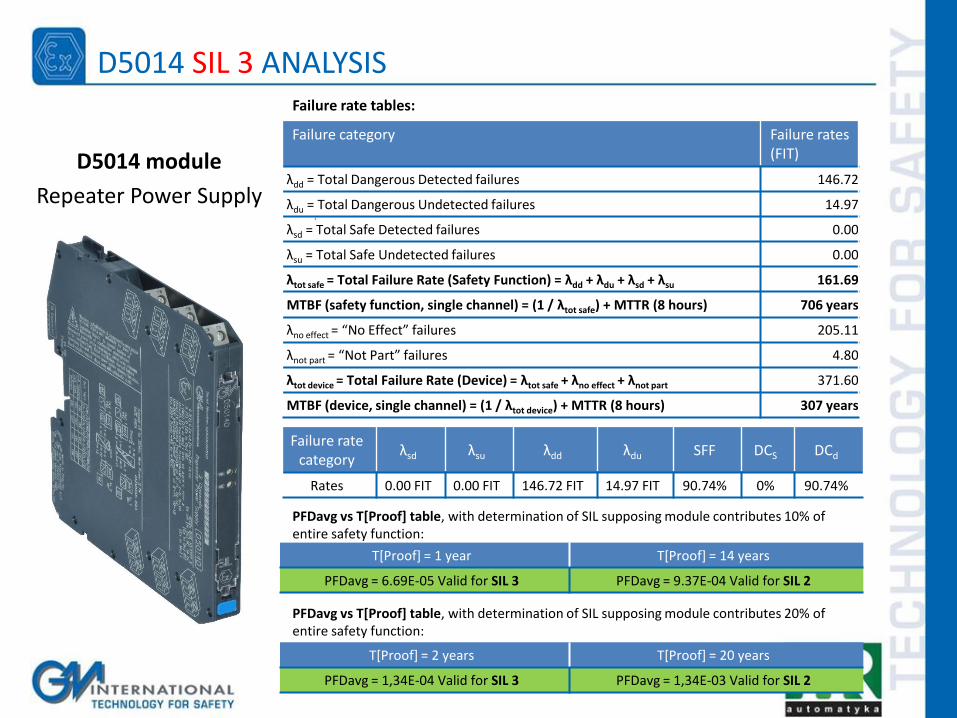
D5014 module
Repeater Power Supply
Failure category Failure rates (FIT)
λdd = Total Dangerous Detected failures 146.72
λdu = Total Dangerous Undetected failures 14.97
λsd = Total Safe Detected failures 0.00
λsu = Total Safe Undetected failures 0.00
λtot safe = Total Failure Rate (Safety Function) = λdd + λdu + λsd + λsu 161.69
MTBF (safety function, single channel) = (1 / λtot safe) + MTTR (8 hours) 706 years
λno effect = “No Effect” failures 205.11
λnot part = “Not Part” failures 4.80
λtot device = Total Failure Rate (Device) = λtot safe + λno effect + λnot part 371.60
MTBF (device, single channel) = (1 / λtot device) + MTTR (8 hours) 307 years
Failure rate category
λsd λsu λdd λdu SFF DCS DCd
Rates 0.00 FIT 0.00 FIT 146.72 FIT 14.97 FIT 90.74% 0% 90.74%
T[Proof] = 1 year T[Proof] = 14 years
PFDavg = 6.69E-05 Valid for SIL 3 PFDavg = 9.37E-04 Valid for SIL 2
T[Proof] = 2 years T[Proof] = 20 years
PFDavg = 1,34E-04 Valid for SIL 3 PFDavg = 1,34E-03 Valid for SIL 2
Failure rate tables:
PFDavg vs T[Proof] table, with determination of SIL supposing module contributes 10% of entire safety function:
PFDavg vs T[Proof] table, with determination of SIL supposing module contributes 20% of entire safety function:
D5014 SIL 3 ANALYSIS
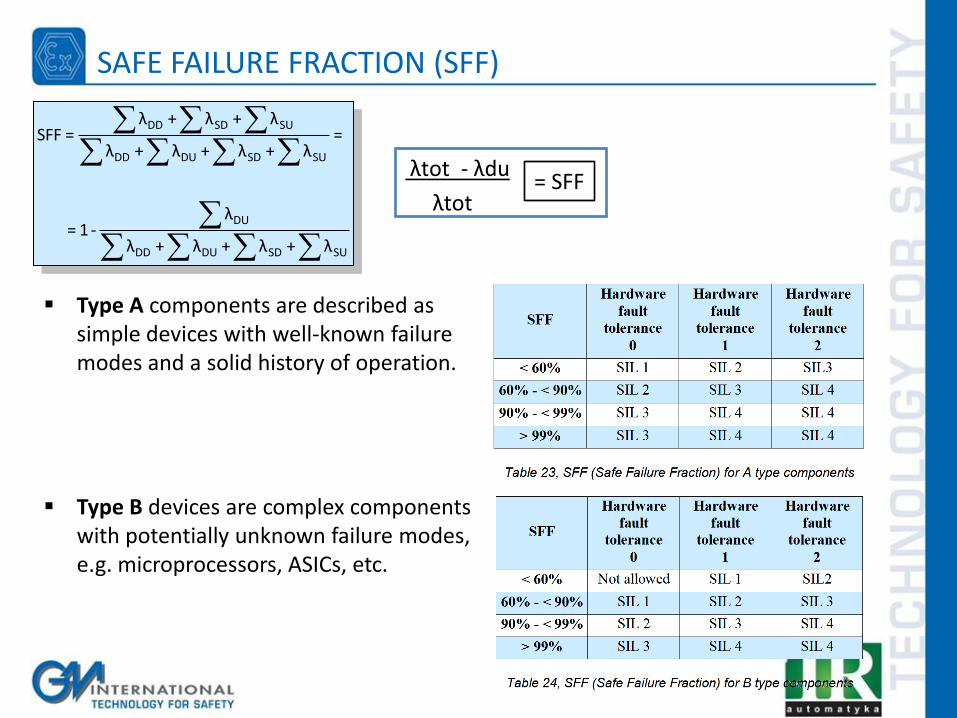
λtot - λdu
λtot
Type A components are described as simple devices with well-known failure modes and a solid history of operation.
DD SD SU
DD DU SD SU
DU
DD DU SD SU
λ + λ + λSFF = =
λ + λ + λ + λ
λ= 1 -
λ + λ + λ + λ
= SFF
SAFE FAILURE FRACTION (SFF)
Type B devices are complex components with potentially unknown failure modes, e.g. microprocessors, ASICs, etc.
SYSTEMATIC FAILURES
Definition:
A hidden fault in design or implementation
Software as well as hardware
Design specification
User manuals
Procedures, etc
Can occur in any lifecycle phase
IEC 61508:2010 Ed. 2 approach:
Measures to avoid failures.
SYSTEMATIC FAILURES
SYSTEMATIC FAILURES
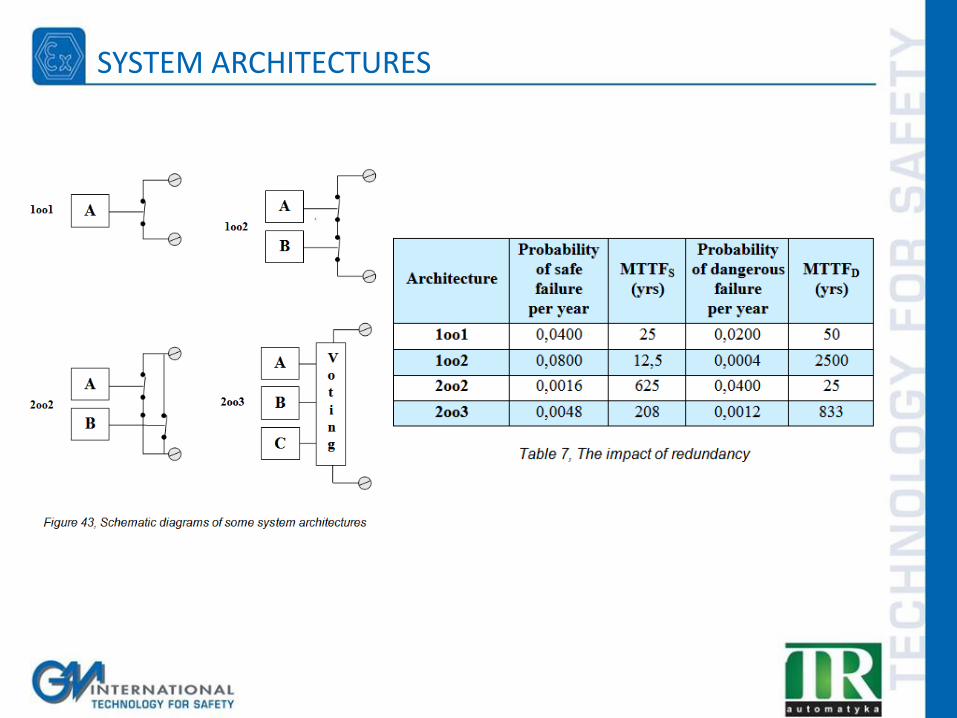
SYSTEM ARCHITECTURES

PFDavg SIMPLIFIED EQUATIONS
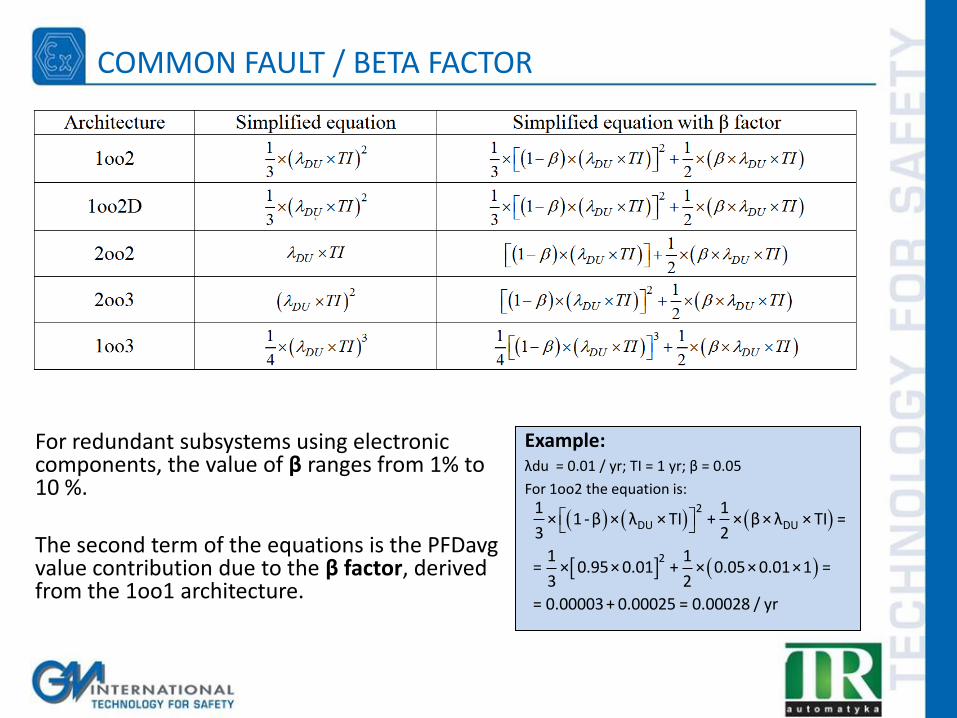
For redundant subsystems using electronic components, the value of β ranges from 1% to 10 %. The second term of the equations is the PFDavg value contribution due to the β factor, derived from the 1oo1 architecture.
Example: λdu = 0.01 / yr; TI = 1 yr; β = 0.05
For 1oo2 the equation is:
2
DU DU
2
1 1× 1 -β × λ × TI + × β× λ × TI =
3 2
1 1= × 0.95× 0.01 + × 0.05× 0.01×1 =
3 2
= 0.00003 + 0.00025 = 0.00028 / yr
COMMON FAULT / BETA FACTOR
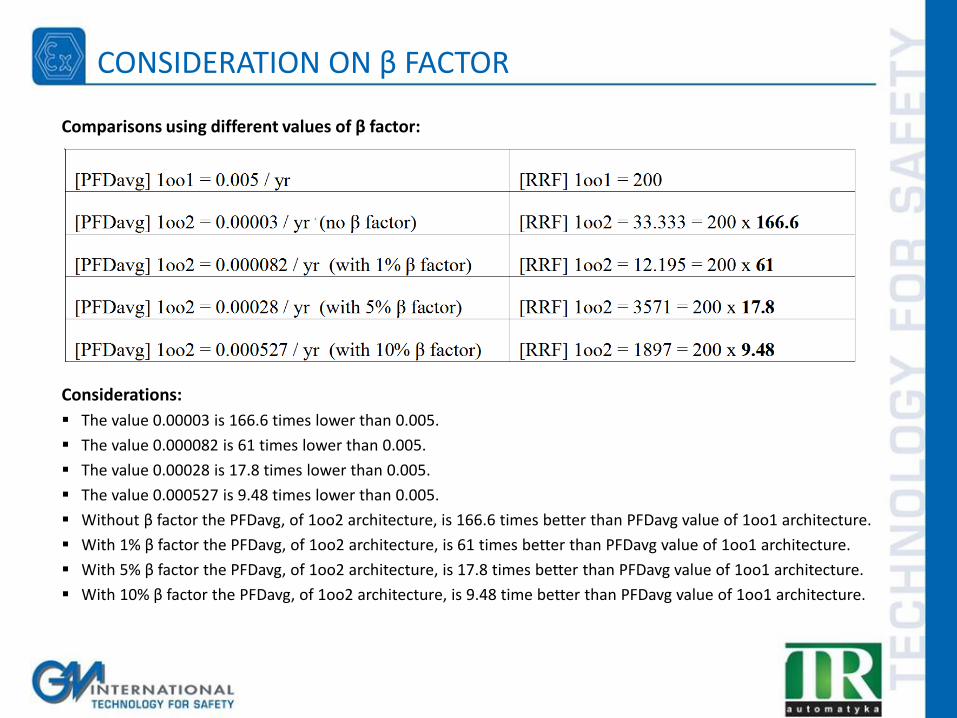
Comparisons using different values of β factor:
Considerations:
The value 0.00003 is 166.6 times lower than 0.005.
The value 0.000082 is 61 times lower than 0.005.
The value 0.00028 is 17.8 times lower than 0.005.
The value 0.000527 is 9.48 times lower than 0.005.
Without β factor the PFDavg, of 1oo2 architecture, is 166.6 times better than PFDavg value of 1oo1 architecture.
With 1% β factor the PFDavg, of 1oo2 architecture, is 61 times better than PFDavg value of 1oo1 architecture.
With 5% β factor the PFDavg, of 1oo2 architecture, is 17.8 times better than PFDavg value of 1oo1 architecture.
With 10% β factor the PFDavg, of 1oo2 architecture, is 9.48 time better than PFDavg value of 1oo1 architecture.
CONSIDERATION ON β FACTOR
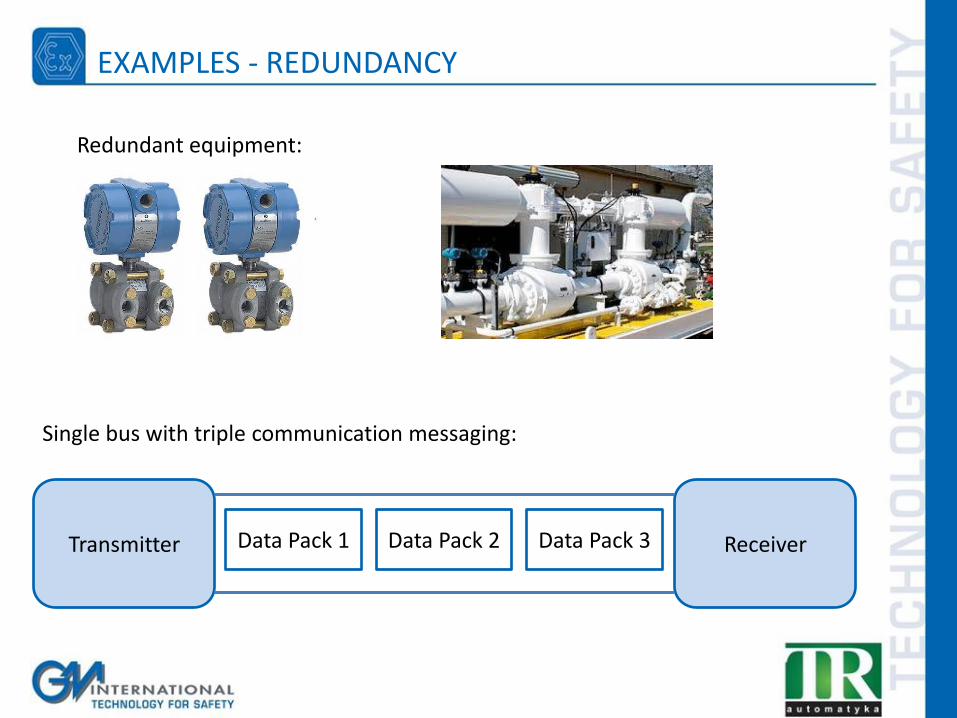
EXAMPLES - REDUNDANCY
Redundant equipment:
Single bus with triple communication messaging:
Transmitter Receiver Data Pack 1 Data Pack 2 Data Pack 3
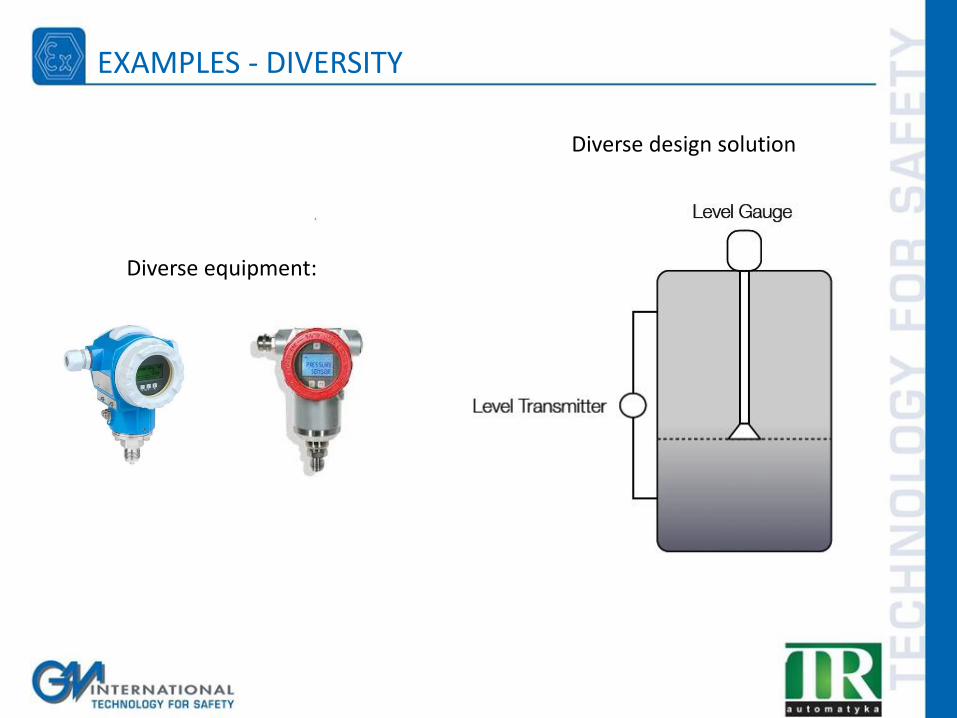
EXAMPLES - DIVERSITY
Diverse equipment:
Diverse design solution
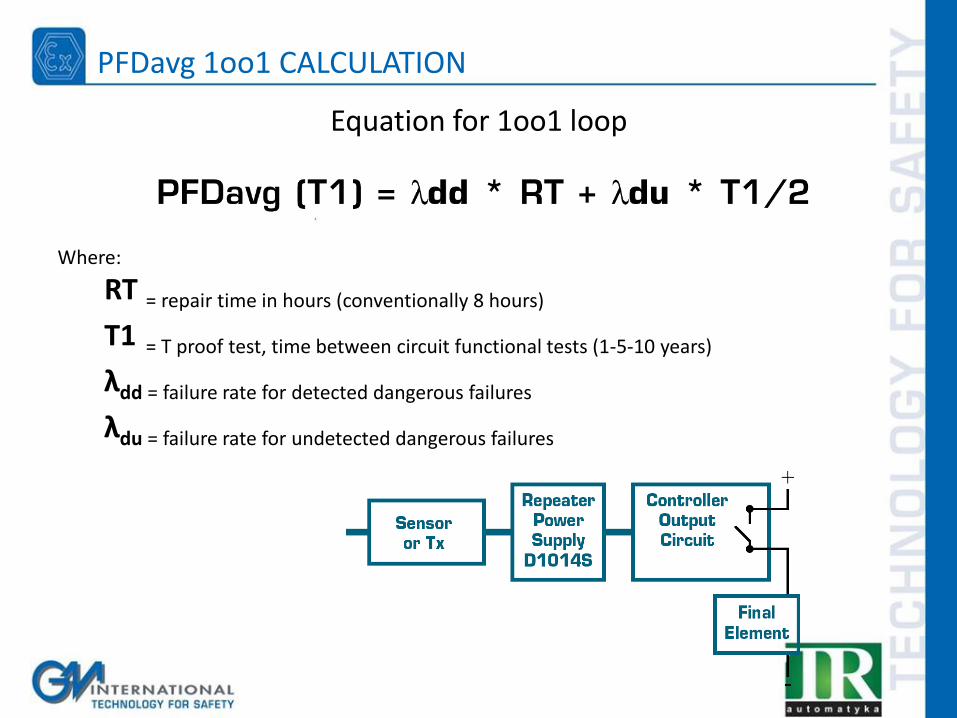
Equation for 1oo1 loop
Where:
RT = repair time in hours (conventionally 8 hours)
T1 = T proof test, time between circuit functional tests (1-5-10 years)
λdd = failure rate for detected dangerous failures
λdu = failure rate for undetected dangerous failures
PFDavg 1oo1 CALCULATION
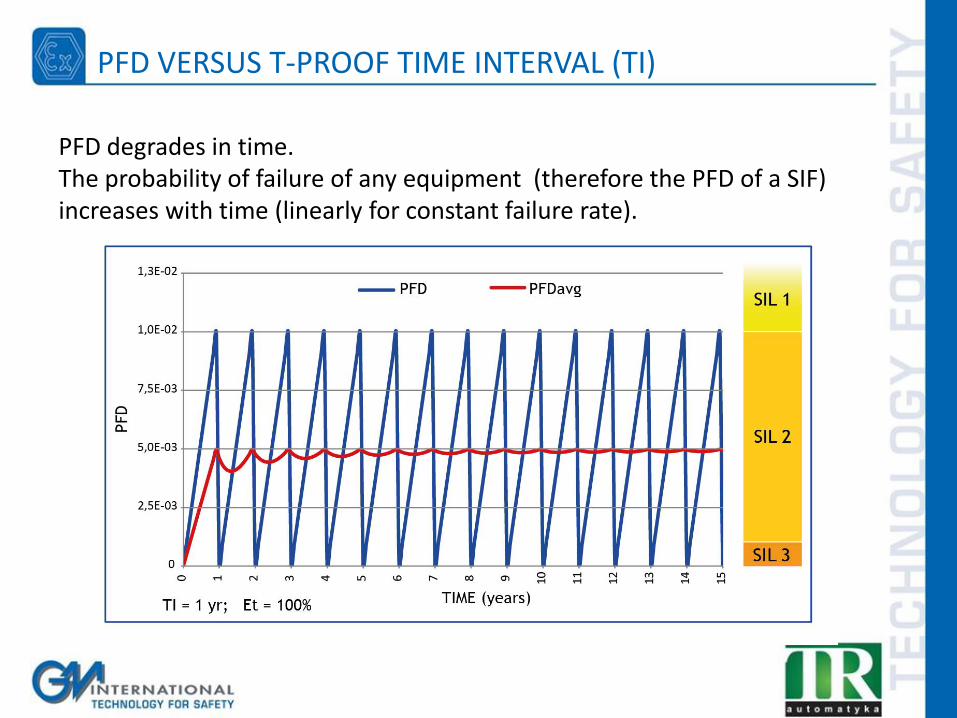
PFD degrades in time. The probability of failure of any equipment (therefore the PFD of a SIF) increases with time (linearly for constant failure rate).
PFD VERSUS T-PROOF TIME INTERVAL (TI)
Since PFD increases with time, its value can be kept under control by actuating maintenance proof tests at certain time intervals.
A periodic test at T-proof interval (as specified by the manufacturer), is capable of identifying any non directly detectable failure mechanisms in the equipment (dangerous undetected failures);
The grade of the test effectiveness affects the value to which the PFDavg is set afterwards.
HOW PFD CHANGES IN TIME
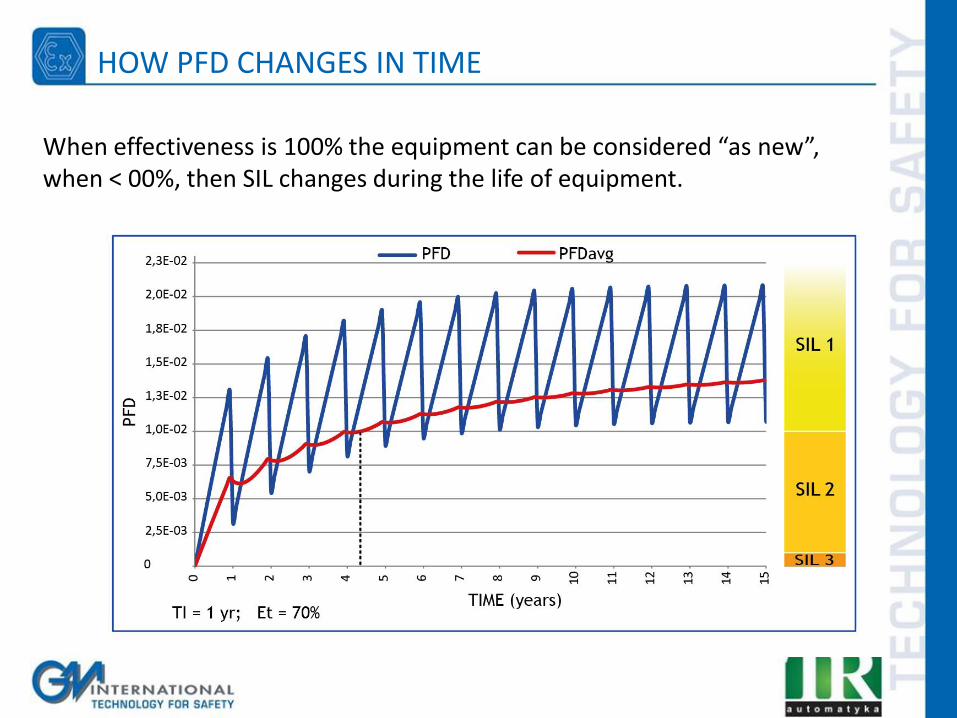
When effectiveness is 100% the equipment can be considered “as new”, when < 00%, then SIL changes during the life of equipment.
HOW PFD CHANGES IN TIME
PERIODIC TEST FOR D5014 – 50%
Steps Action
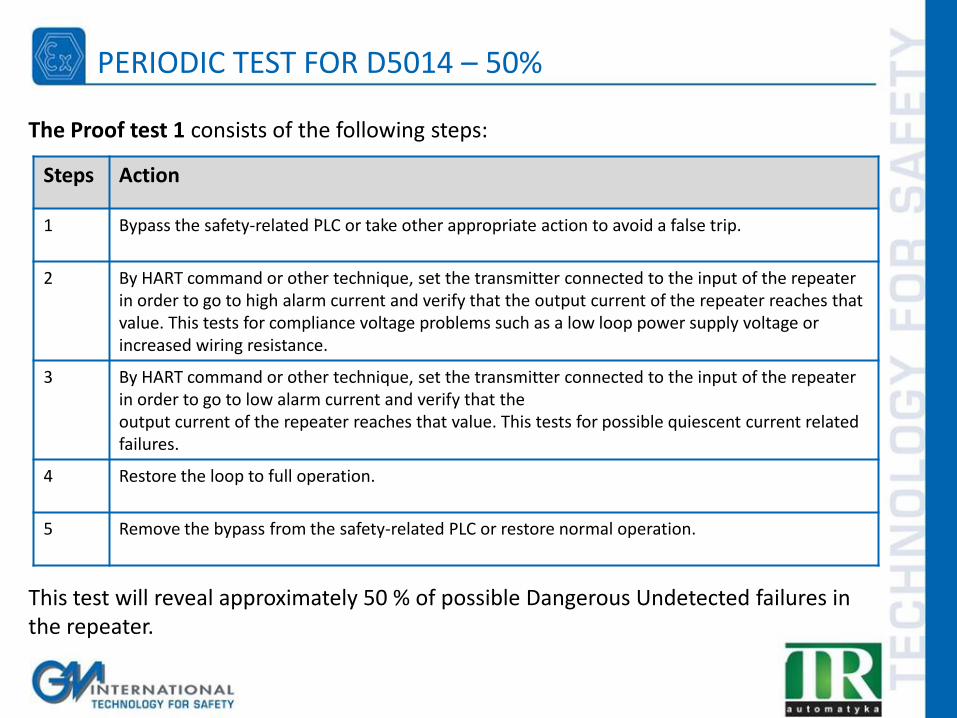
1 Bypass the safety-related PLC or take other appropriate action to avoid a false trip.
2 By HART command or other technique, set the transmitter connected to the input of the repeater in order to go to high alarm current and verify that the output current of the repeater reaches that value. This tests for compliance voltage problems such as a low loop power supply voltage or increased wiring resistance.
3 By HART command or other technique, set the transmitter connected to the input of the repeater in order to go to low alarm current and verify that the output current of the repeater reaches that value. This tests for possible quiescent current related failures.
4 Restore the loop to full operation.
5 Remove the bypass from the safety-related PLC or restore normal operation.
The Proof test 1 consists of the following steps:
This test will reveal approximately 50 % of possible Dangerous Undetected failures in the repeater.
Steps Action
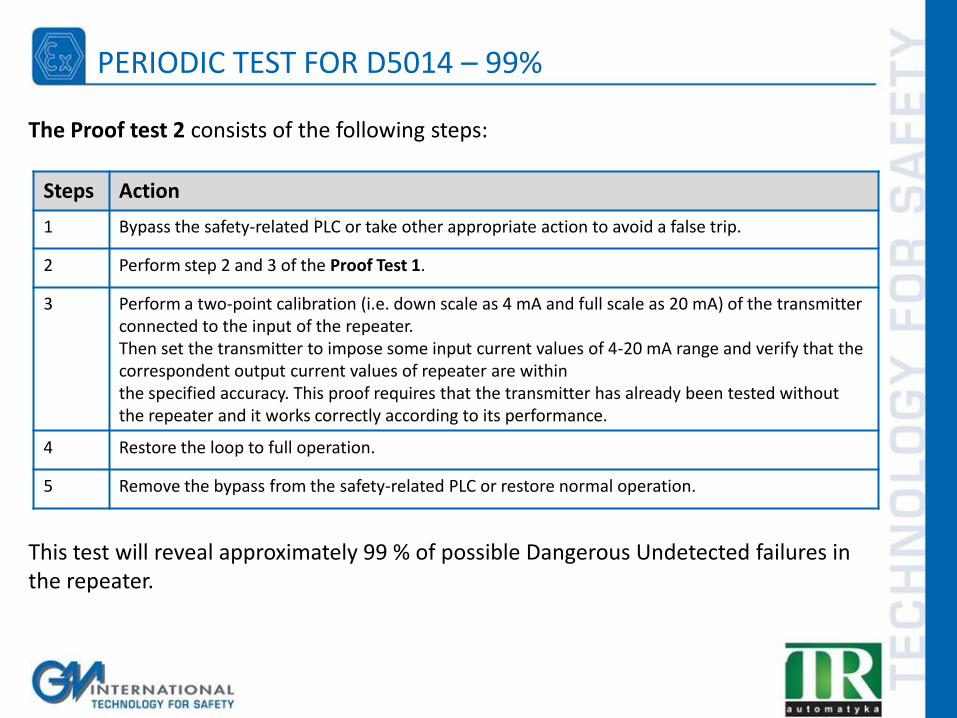
1 Bypass the safety-related PLC or take other appropriate action to avoid a false trip.
2 Perform step 2 and 3 of the Proof Test 1.
3 Perform a two-point calibration (i.e. down scale as 4 mA and full scale as 20 mA) of the transmitter connected to the input of the repeater. Then set the transmitter to impose some input current values of 4-20 mA range and verify that the correspondent output current values of repeater are within the specified accuracy. This proof requires that the transmitter has already been tested without the repeater and it works correctly according to its performance.
4 Restore the loop to full operation.
5 Remove the bypass from the safety-related PLC or restore normal operation.
The Proof test 2 consists of the following steps:
This test will reveal approximately 99 % of possible Dangerous Undetected failures in the repeater.
PERIODIC TEST FOR D5014 – 99%
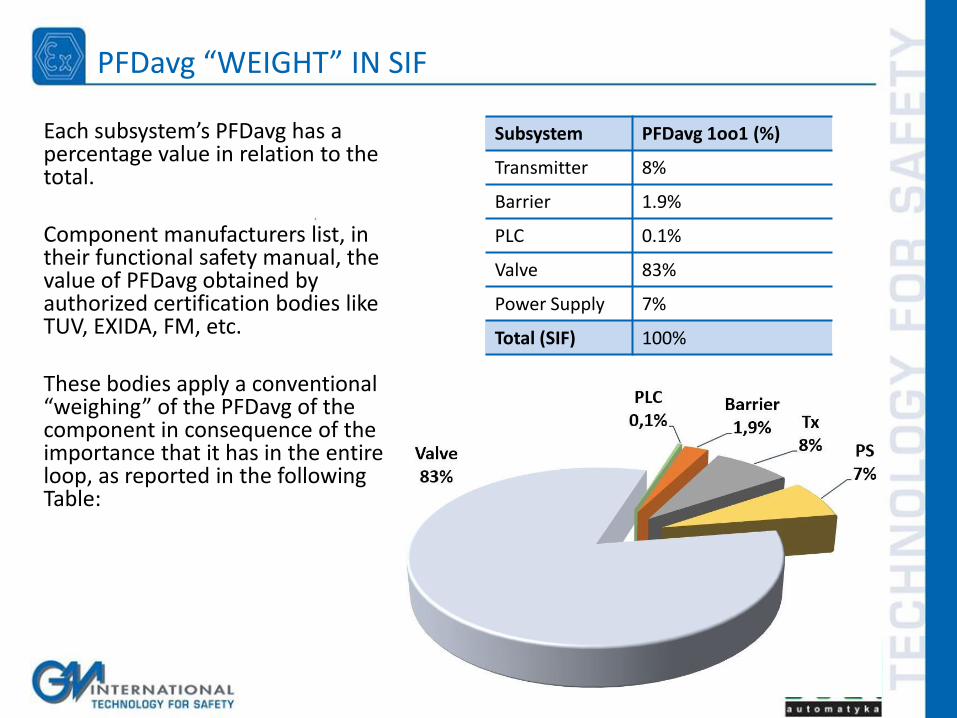
Each subsystem’s PFDavg has a percentage value in relation to the total. Component manufacturers list, in their functional safety manual, the value of PFDavg obtained by authorized certification bodies like TUV, EXIDA, FM, etc. These bodies apply a conventional “weighing” of the PFDavg of the component in consequence of the importance that it has in the entire loop, as reported in the following Table:
PFDavg “WEIGHT” IN SIF
Subsystem PFDavg 1oo1 (%)
Transmitter 8%
Barrier 1.9%
PLC 0.1%
Valve 83%
Power Supply 7%
Total (SIF) 100%
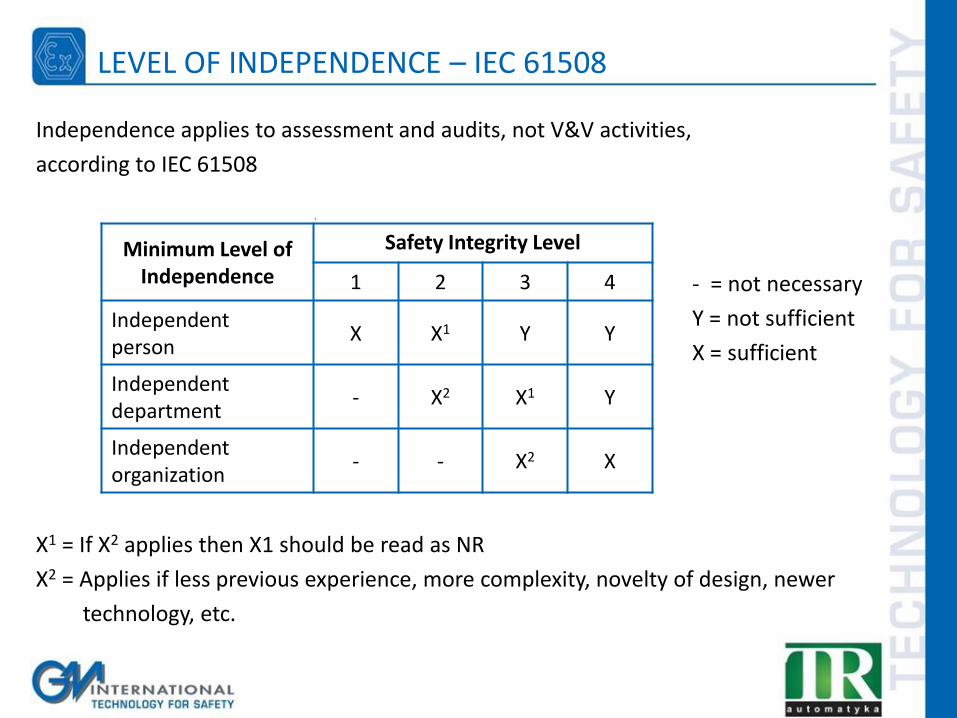
LEVEL OF INDEPENDENCE – IEC 61508
Independence applies to assessment and audits, not V&V activities,
according to IEC 61508
Minimum Level of Independence
Safety Integrity Level
1 2 3 4
Independent person
X X1 Y Y
Independent department
- X2 X1 Y
Independent organization
- - X2 X
- = not necessary
Y = not sufficient
X = sufficient
X1 = If X2 applies then X1 should be read as NR
X2 = Applies if less previous experience, more complexity, novelty of design, newer
technology, etc.
FSE TUV COURSE

FSE TÜV COURSE
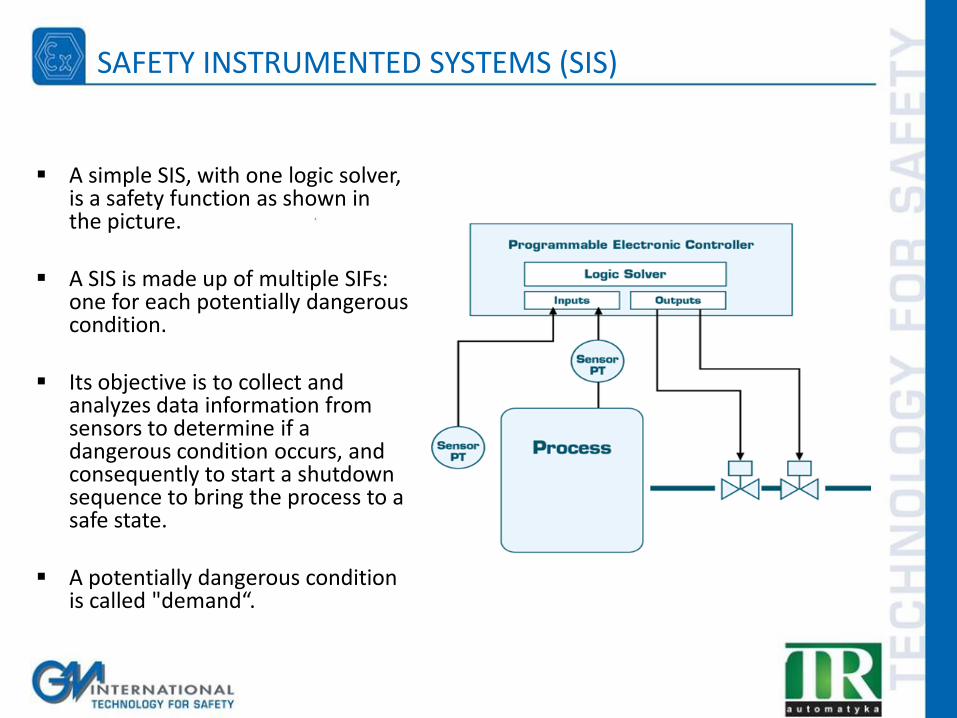
A simple SIS, with one logic solver, is a safety function as shown in the picture.
A SIS is made up of multiple SIFs: one for each potentially dangerous condition.
Its objective is to collect and analyzes data information from sensors to determine if a dangerous condition occurs, and consequently to start a shutdown sequence to bring the process to a safe state.
A potentially dangerous condition is called "demand“.
SAFETY INSTRUMENTED SYSTEMS (SIS)
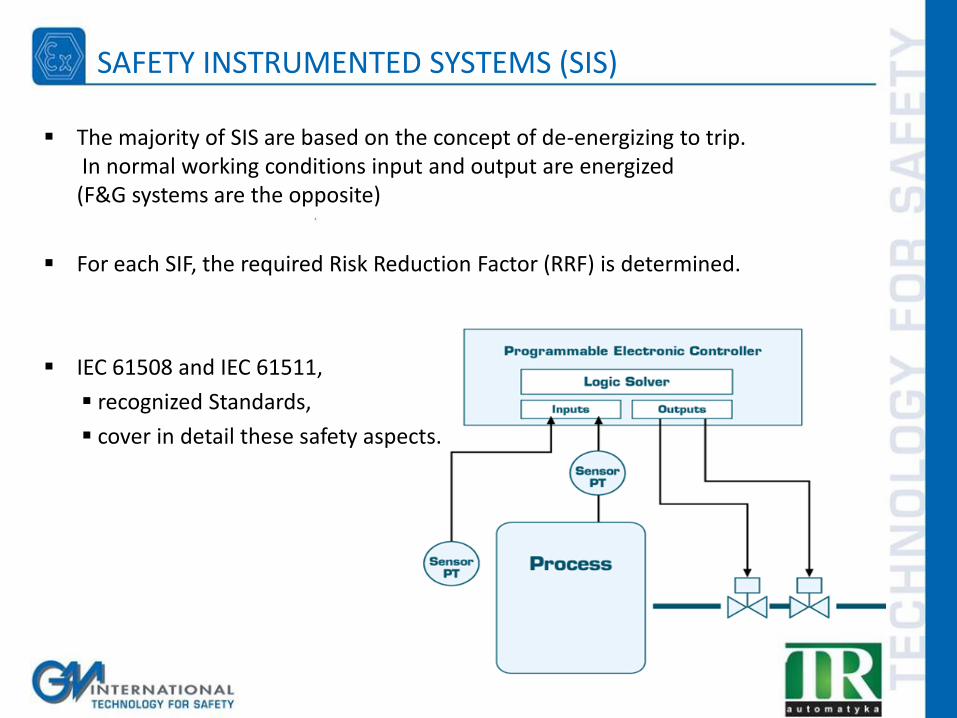
The majority of SIS are based on the concept of de-energizing to trip. In normal working conditions input and output are energized (F&G systems are the opposite)
For each SIF, the required Risk Reduction Factor (RRF) is determined.
IEC 61508 and IEC 61511,
recognized Standards,
cover in detail these safety aspects.
SAFETY INSTRUMENTED SYSTEMS (SIS)

Equation for 1oo1 loop
Where:
RT = repair time in hours (conventionally 8 hours)
T1 = T proof test, time between circuit functional tests (1-5-10 years)
λdd = failure rate for detected dangerous failures
λdu = failure rate for undetected dangerous failures
PFDavg 1oo1 CALCULATION
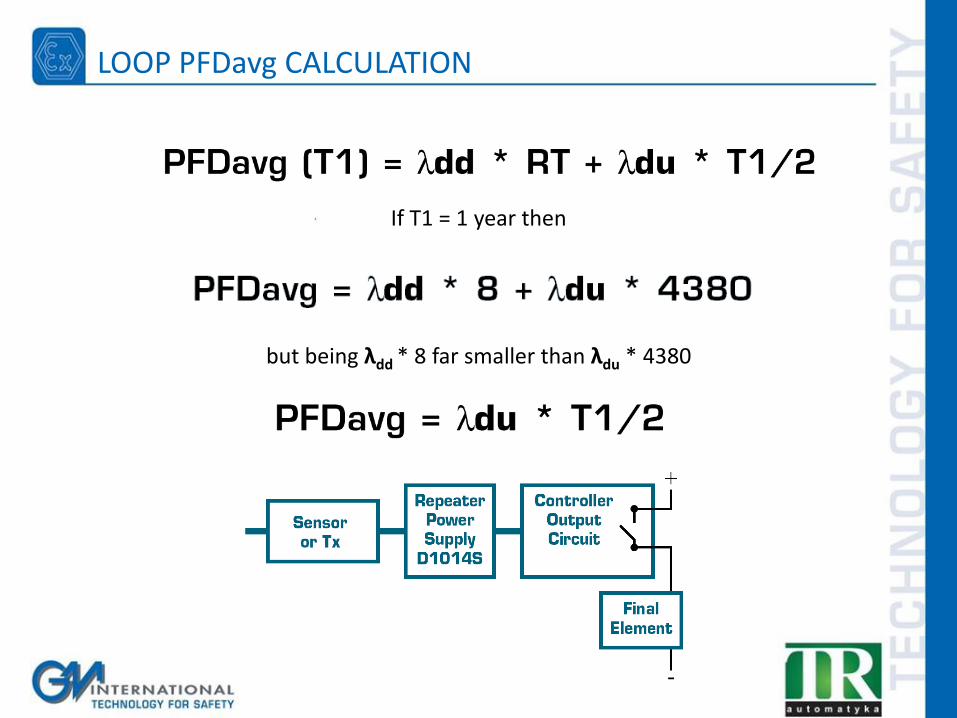
If T1 = 1 year then
but being λdd * 8 far smaller than λdu * 4380
LOOP PFDavg CALCULATION
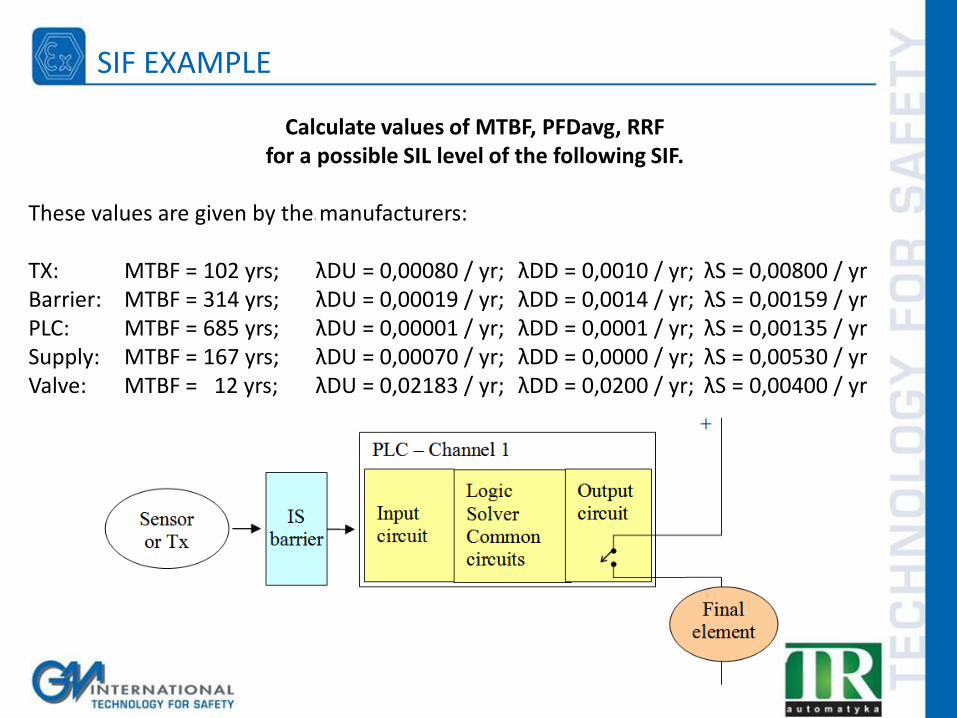
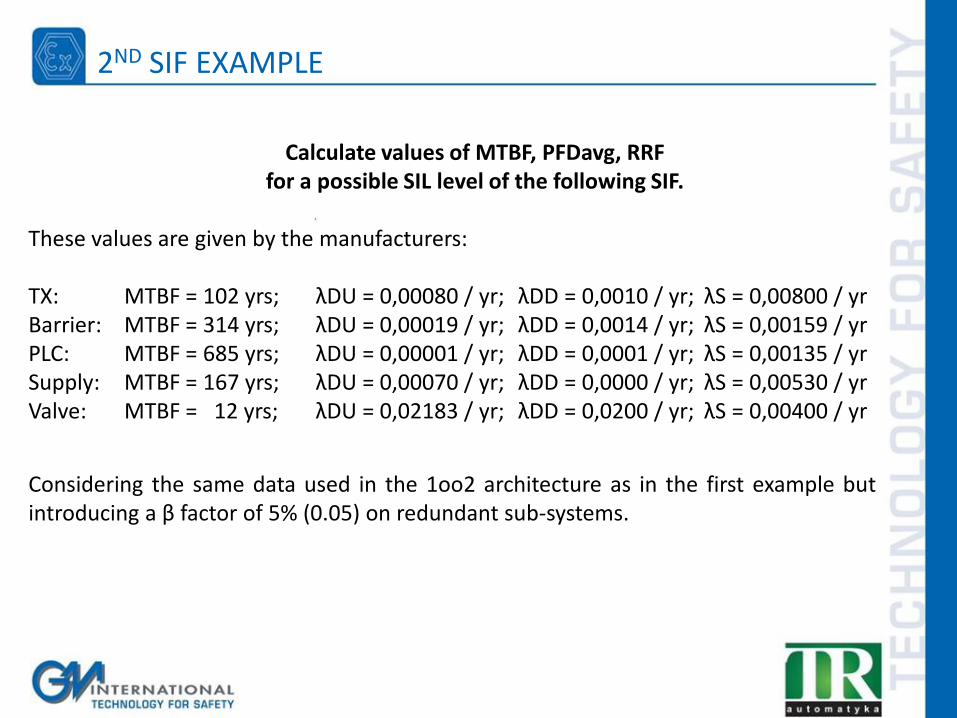
Calculate values of MTBF, PFDavg, RRF for a possible SIL level of the following SIF.
These values are given by the manufacturers: TX: MTBF = 102 yrs; λDU = 0,00080 / yr; λDD = 0,0010 / yr; λS = 0,00800 / yr Barrier: MTBF = 314 yrs; λDU = 0,00019 / yr; λDD = 0,0014 / yr; λS = 0,00159 / yr PLC: MTBF = 685 yrs; λDU = 0,00001 / yr; λDD = 0,0001 / yr; λS = 0,00135 / yr Supply: MTBF = 167 yrs; λDU = 0,00070 / yr; λDD = 0,0000 / yr; λS = 0,00530 / yr Valve: MTBF = 12 yrs; λDU = 0,02183 / yr; λDD = 0,0200 / yr; λS = 0,00400 / yr
SIF EXAMPLE
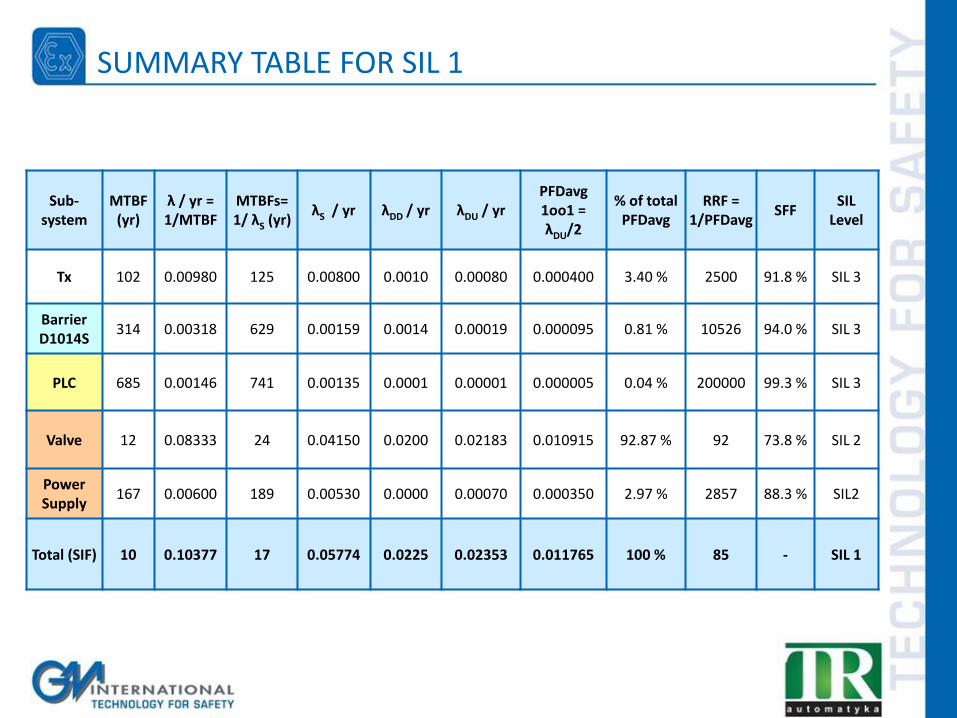
Sub- system
MTBF (yr)
λ / yr = 1/MTBF
MTBFs= 1/ λS (yr)
λS / yr λDD / yr λDU / yr PFDavg 1oo1 = λDU/2
% of total PFDavg
RRF = 1/PFDavg
SFF SIL
Level
Tx 102 0.00980 125 0.00800 0.0010 0.00080 0.000400 3.40 % 2500 91.8 % SIL 3
Barrier D1014S
314 0.00318 629 0.00159 0.0014 0.00019 0.000095 0.81 % 10526 94.0 % SIL 3
PLC 685 0.00146 741 0.00135 0.0001 0.00001 0.000005 0.04 % 200000 99.3 % SIL 3
Valve 12 0.08333 24 0.04150 0.0200 0.02183 0.010915 92.87 % 92 73.8 % SIL 2
Power Supply
167 0.00600 189 0.00530 0.0000 0.00070 0.000350 2.97 % 2857 88.3 % SIL2
Total (SIF) 10 0.10377 17 0.05774 0.0225 0.02353 0.011765 100 % 85 - SIL 1
SUMMARY TABLE FOR SIL 1
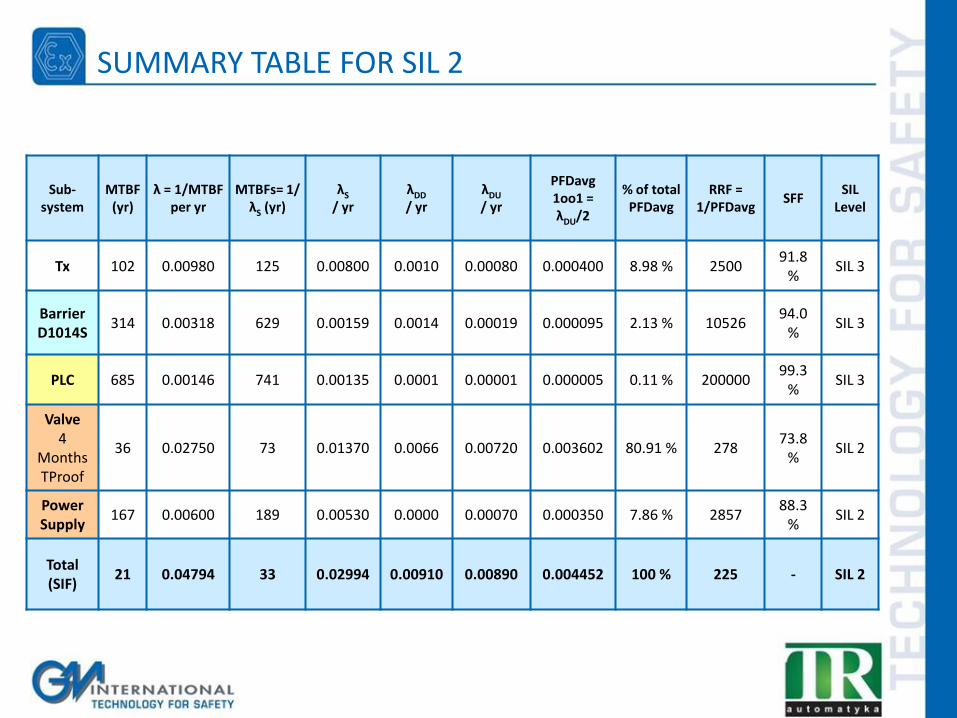
Sub- system
MTBF (yr)
λ = 1/MTBF per yr
MTBFs= 1/ λS (yr)
λS / yr
λDD / yr
λDU / yr
PFDavg 1oo1 = λDU/2
% of total PFDavg
RRF = 1/PFDavg
SFF SIL
Level
Tx 102 0.00980 125 0.00800 0.0010 0.00080 0.000400 8.98 % 2500 91.8
% SIL 3
Barrier D1014S
314 0.00318 629 0.00159 0.0014 0.00019 0.000095 2.13 % 10526 94.0
% SIL 3
PLC 685 0.00146 741 0.00135 0.0001 0.00001 0.000005 0.11 % 200000 99.3
% SIL 3
Valve 4
Months TProof
36 0.02750 73 0.01370 0.0066 0.00720 0.003602 80.91 % 278 73.8
% SIL 2
Power Supply
167 0.00600 189 0.00530 0.0000 0.00070 0.000350 7.86 % 2857 88.3
% SIL 2
Total (SIF)
21 0.04794 33 0.02994 0.00910 0.00890 0.004452 100 % 225 - SIL 2
SUMMARY TABLE FOR SIL 2
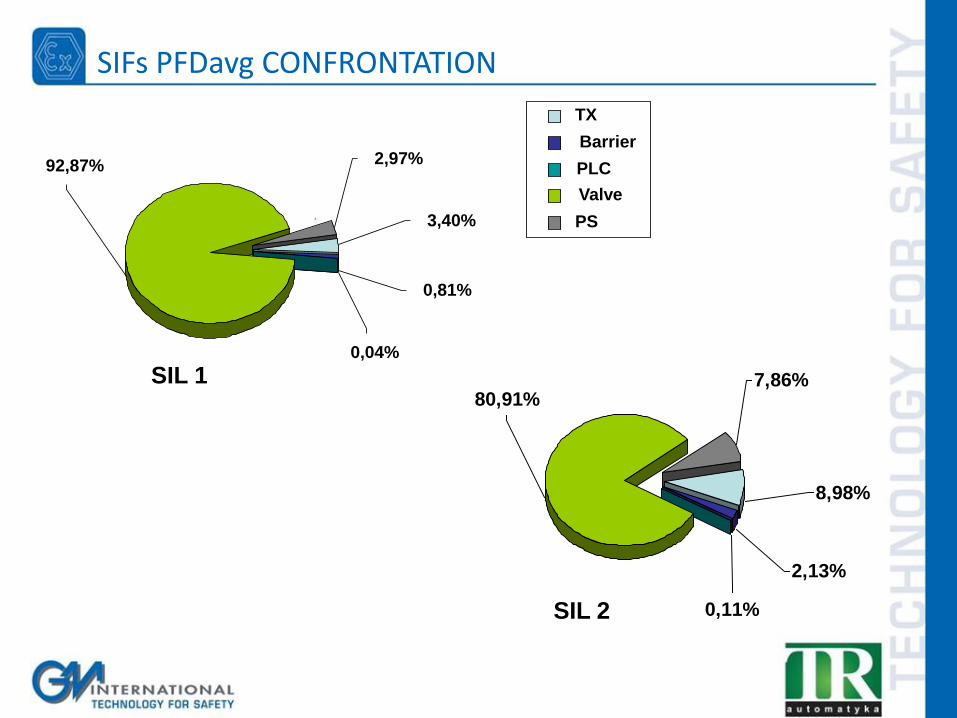
80,91%
8,98%
7,86%
2,13%
0,11%
SIL 1
SIL 2
92,87%
3,40%
2,97%
0,81%
0,04%
TX
Barrier
PLC
Valve
PS
SIFs PFDavg CONFRONTATION
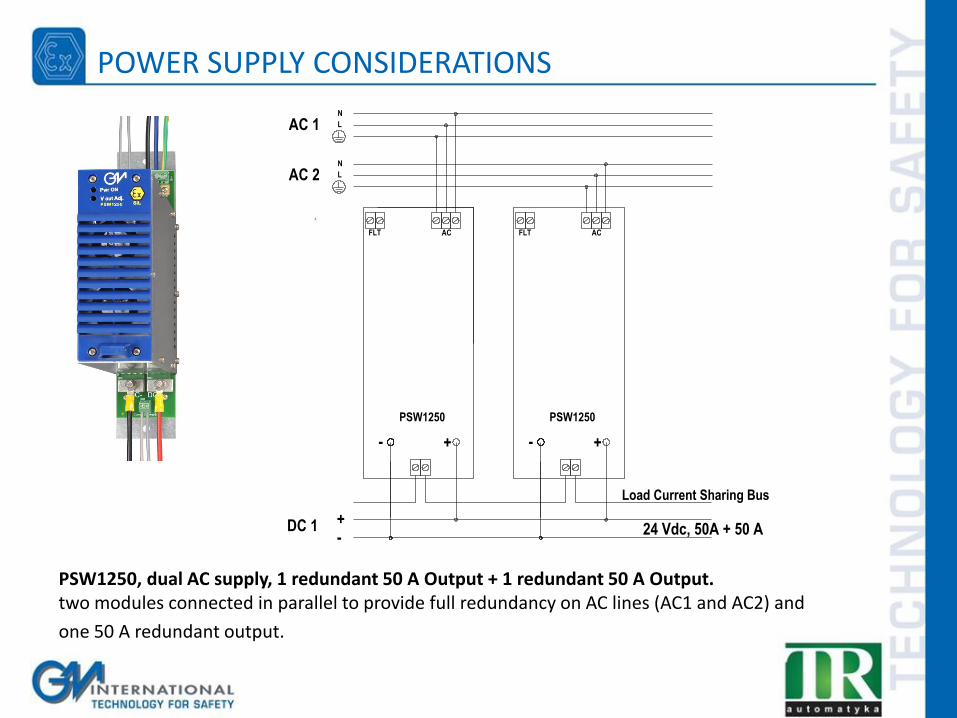
POWER SUPPLY CONSIDERATIONS
AC 1
AC 2
L
N
L
N
-+DC 1 24 Vdc, 50A + 50 A
FLTFLT AC AC
- +
PSW1250 PSW1250
- +
Load Current Sharing Bus
PSW1250, dual AC supply, 1 redundant 50 A Output + 1 redundant 50 A Output. two modules connected in parallel to provide full redundancy on AC lines (AC1 and AC2) and
one 50 A redundant output.
POWER SUPPLY CONSIDERATIONS
Safe state for a 24 VDC Power Supply is an output voltage within the range of 20-30 VDC.
Dangerous state is an output voltage below 20 VDC or greater than 30 VDC, because with voltage below 20 VDC the instrumentation could work out of specifications, while voltage greater than 30 VDC (f.e. 50 VDC) may destroy all the instrumentation supplied.
SIL Certification warrants the user that PFDavg is suitable for the SIL level specified (f.e. SIL 2),
the multiple overvoltage protections has a very low failure rate, and the possibility to increase SIL level with one or two redundancy.
Typically SIL level for NE of a single power supply is SIL 2 and SIL 3 with one redundancy, while for ND applications the supply is SIL 1 and SIL 2 with one redundancy. For SIL 3 applications a second redundancy is required.
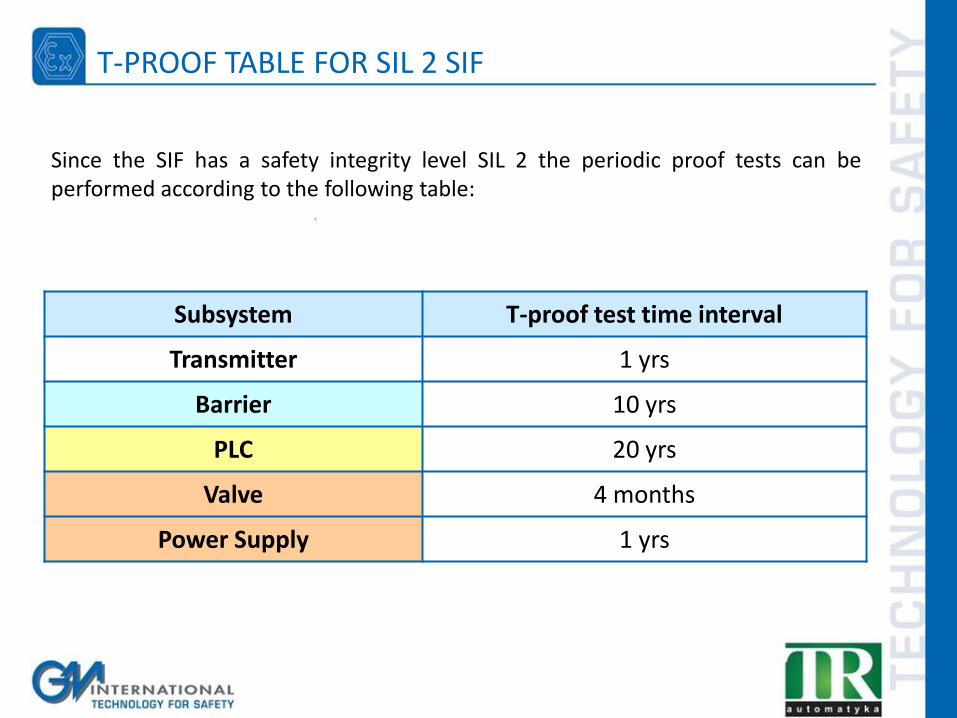
Since the SIF has a safety integrity level SIL 2 the periodic proof tests can be performed according to the following table:
Subsystem T-proof test time interval
Transmitter 1 yrs
Barrier 10 yrs
PLC 20 yrs
Valve 4 months
Power Supply 1 yrs
T-PROOF TABLE FOR SIL 2 SIF
Calculate values of MTBF, PFDavg, RRF for a possible SIL level of the following SIF.
These values are given by the manufacturers: TX: MTBF = 102 yrs; λDU = 0,00080 / yr; λDD = 0,0010 / yr; λS = 0,00800 / yr Barrier: MTBF = 314 yrs; λDU = 0,00019 / yr; λDD = 0,0014 / yr; λS = 0,00159 / yr PLC: MTBF = 685 yrs; λDU = 0,00001 / yr; λDD = 0,0001 / yr; λS = 0,00135 / yr Supply: MTBF = 167 yrs; λDU = 0,00070 / yr; λDD = 0,0000 / yr; λS = 0,00530 / yr Valve: MTBF = 12 yrs; λDU = 0,02183 / yr; λDD = 0,0200 / yr; λS = 0,00400 / yr
Considering the same data used in the 1oo2 architecture as in the first example but introducing a β factor of 5% (0.05) on redundant sub-systems.
2ND SIF EXAMPLE
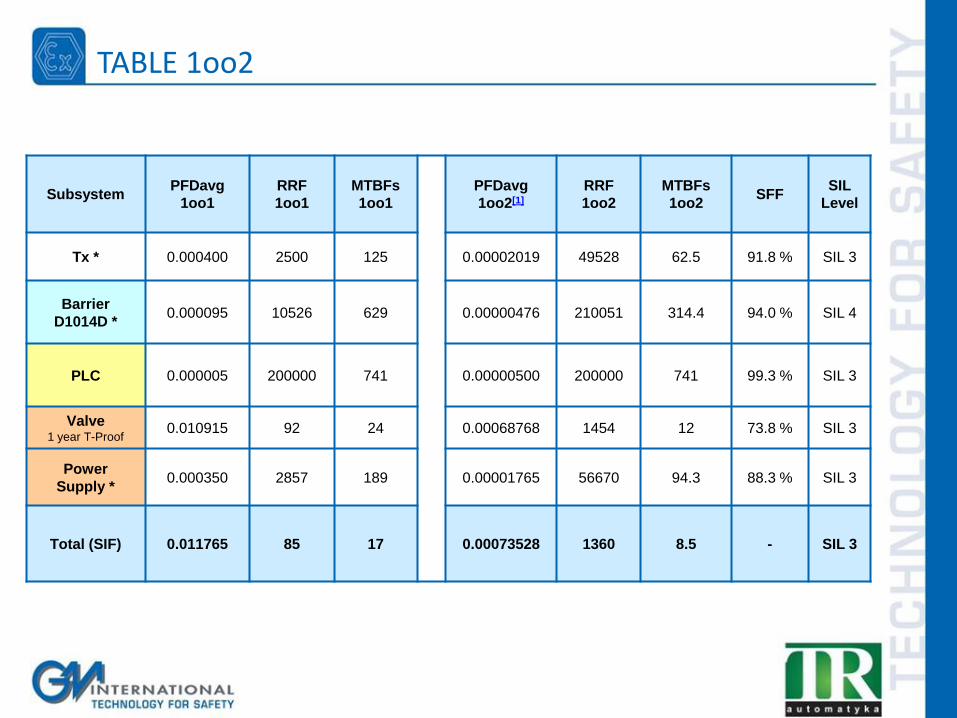
Subsystem PFDavg
1oo1
RRF
1oo1
MTBFs
1oo1
PFDavg
1oo2[1]
RRF
1oo2
MTBFs
1oo2 SFF
SIL
Level
Tx * 0.000400 2500 125 0.00002019 49528 62.5 91.8 % SIL 3
Barrier
D1014D * 0.000095 10526 629 0.00000476 210051 314.4 94.0 % SIL 4
PLC 0.000005 200000 741 0.00000500 200000 741 99.3 % SIL 3
Valve 1 year T-Proof
0.010915 92 24 0.00068768 1454 12 73.8 % SIL 3
Power
Supply * 0.000350 2857 189 0.00001765 56670 94.3 88.3 % SIL 3
Total (SIF) 0.011765 85 17 0.00073528 1360 8.5 - SIL 3
TABLE 1oo2
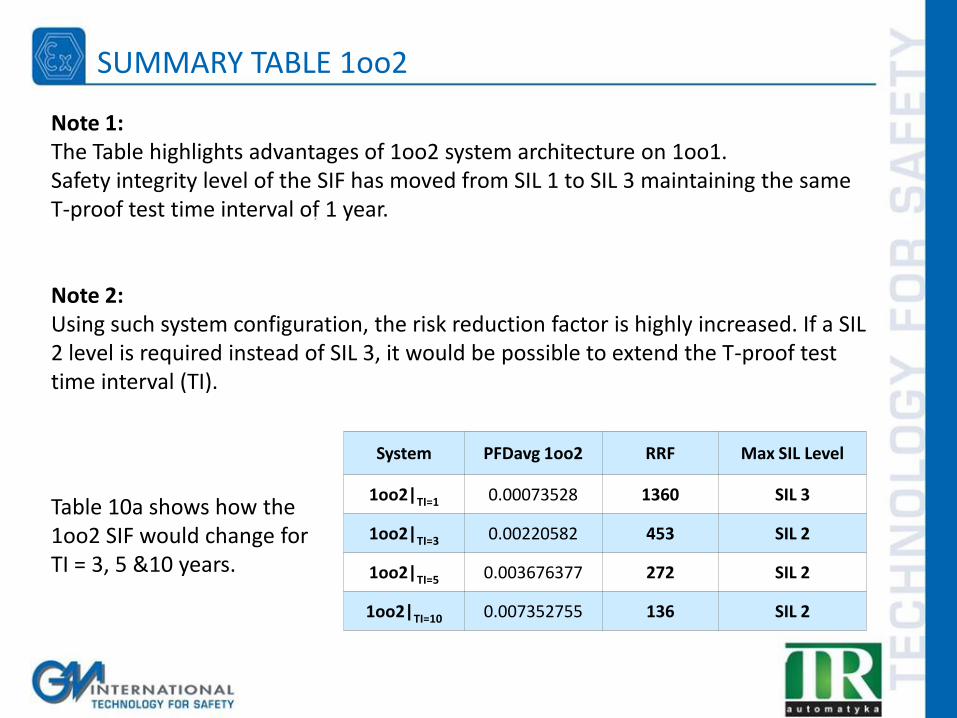
System PFDavg 1oo2 RRF Max SIL Level
1oo2|TI=1 0.00073528 1360 SIL 3
1oo2|TI=3 0.00220582 453 SIL 2
1oo2|TI=5 0.003676377 272 SIL 2
1oo2|TI=10 0.007352755 136 SIL 2
Note 1: The Table highlights advantages of 1oo2 system architecture on 1oo1. Safety integrity level of the SIF has moved from SIL 1 to SIL 3 maintaining the same T-proof test time interval of 1 year. Note 2: Using such system configuration, the risk reduction factor is highly increased. If a SIL 2 level is required instead of SIL 3, it would be possible to extend the T-proof test time interval (TI).
Table 10a shows how the 1oo2 SIF would change for TI = 3, 5 &10 years.
SUMMARY TABLE 1oo2
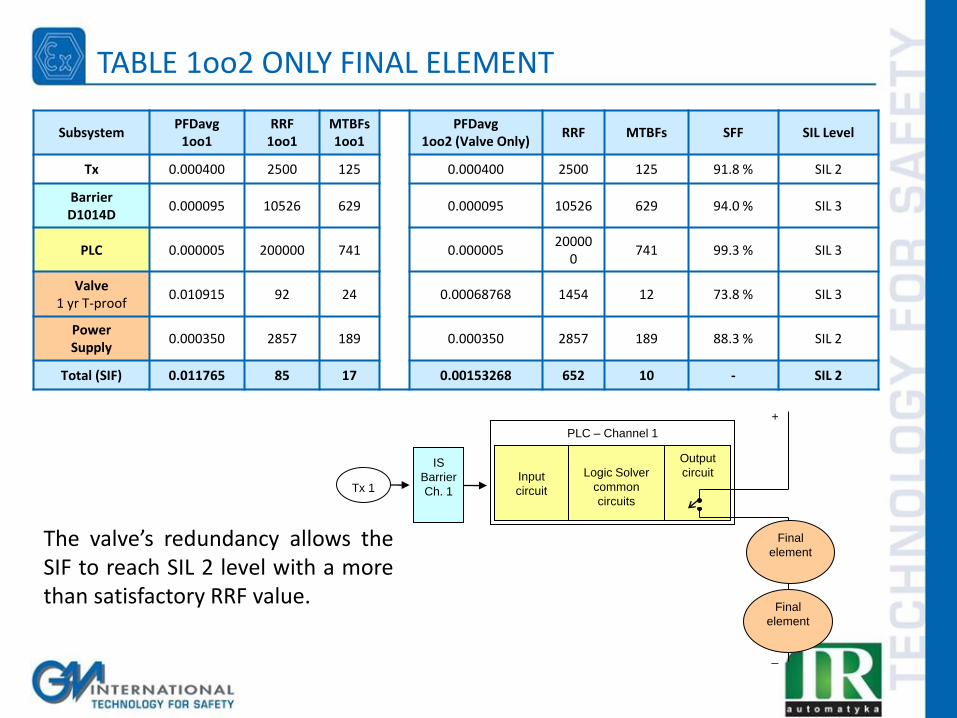
Subsystem PFDavg
1oo1 RRF
1oo1 MTBFs 1oo1
PFDavg 1oo2 (Valve Only)
RRF MTBFs SFF SIL Level
Tx 0.000400 2500 125 0.000400 2500 125 91.8 % SIL 2
Barrier D1014D
0.000095 10526 629 0.000095 10526 629 94.0 % SIL 3
PLC 0.000005 200000 741 0.000005 20000
0 741 99.3 % SIL 3
Valve 1 yr T-proof
0.010915 92 24 0.00068768 1454 12 73.8 % SIL 3
Power Supply
0.000350 2857 189 0.000350 2857 189 88.3 % SIL 2
Total (SIF) 0.011765 85 17 0.00153268 652 10 - SIL 2
PLC – Channel 1
Input
circuit
Logic Solver
common
circuits
Output
circuit
+
_
Final
element
Final
element
Tx 1
IS
Barrier
Ch. 1
The valve’s redundancy allows the SIF to reach SIL 2 level with a more than satisfactory RRF value.
TABLE 1oo2 ONLY FINAL ELEMENT
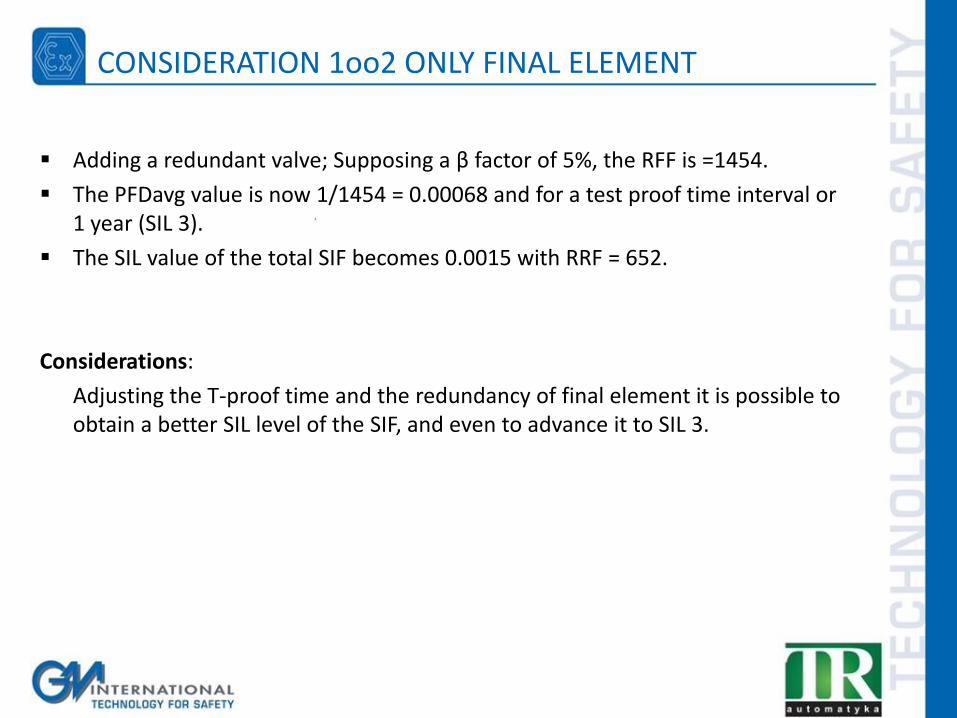
Adding a redundant valve; Supposing a β factor of 5%, the RFF is =1454.
The PFDavg value is now 1/1454 = 0.00068 and for a test proof time interval or 1 year (SIL 3).
The SIL value of the total SIF becomes 0.0015 with RRF = 652.
Considerations:
Adjusting the T-proof time and the redundancy of final element it is possible to obtain a better SIL level of the SIF, and even to advance it to SIL 3.
CONSIDERATION 1oo2 ONLY FINAL ELEMENT
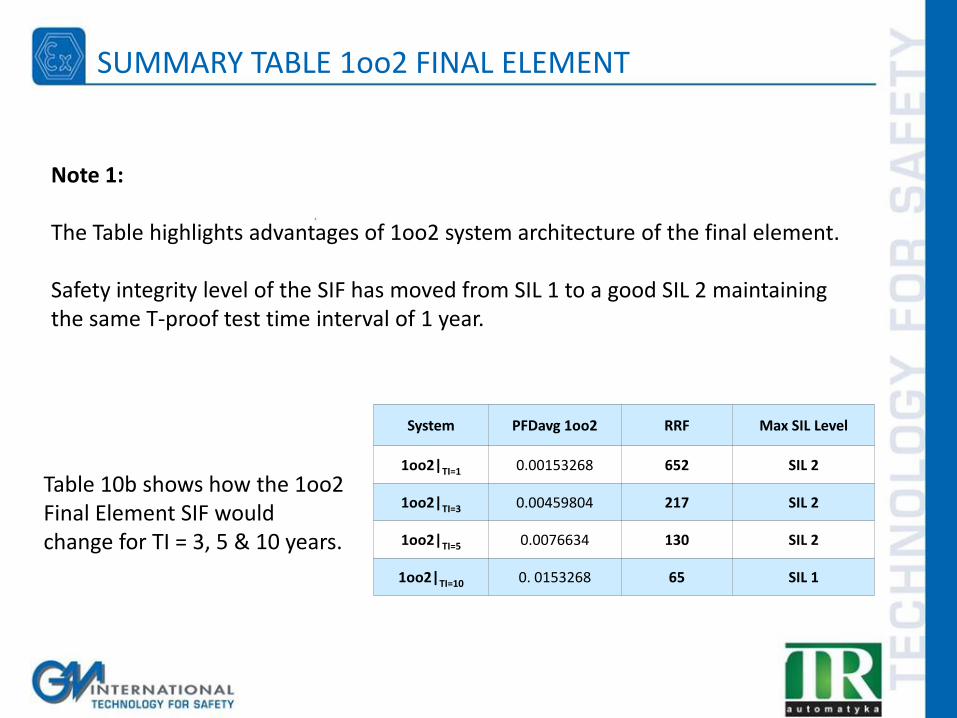
System PFDavg 1oo2 RRF Max SIL Level
1oo2|TI=1 0.00153268 652 SIL 2
1oo2|TI=3 0.00459804 217 SIL 2
1oo2|TI=5 0.0076634 130 SIL 2
1oo2|TI=10 0. 0153268 65 SIL 1
Note 1: The Table highlights advantages of 1oo2 system architecture of the final element. Safety integrity level of the SIF has moved from SIL 1 to a good SIL 2 maintaining the same T-proof test time interval of 1 year.
Table 10b shows how the 1oo2 Final Element SIF would change for TI = 3, 5 & 10 years.
SUMMARY TABLE 1oo2 FINAL ELEMENT
IEC 61511 SOFTWARE
IEC 61511:
Does not differentiate between SIL 1, 2 or 3 software
Lists requirements which are suitable for up to SIL 3
Does not allow SIL 4 software but refers in that case back to IEC 61508
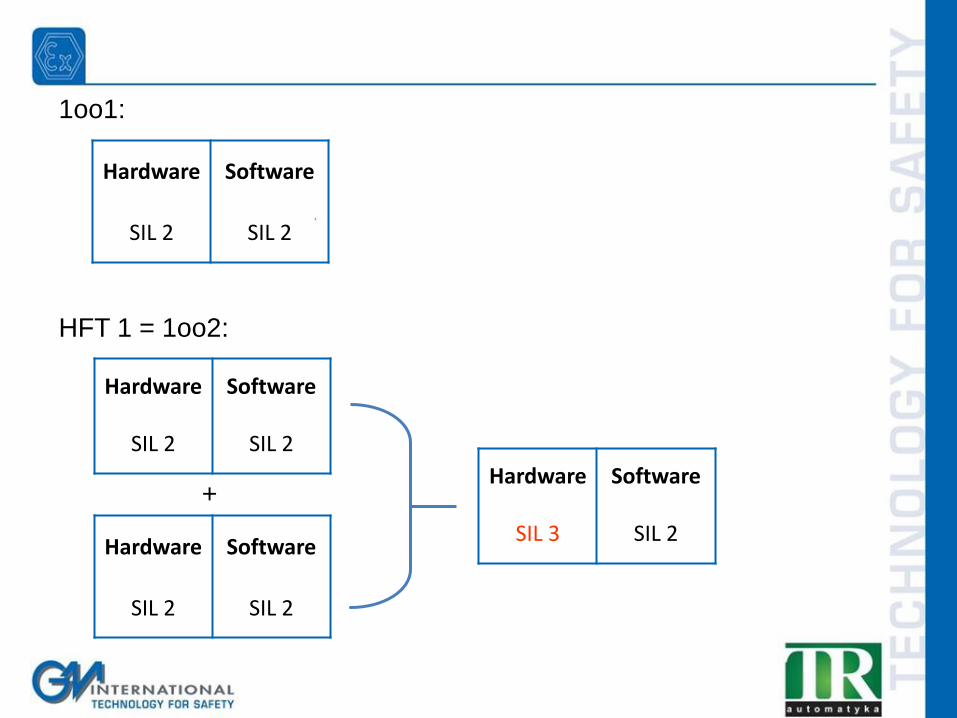
Hardware Software
SIL 2 SIL 2
1oo1:
HFT 1 = 1oo2:
Hardware Software
SIL 2 SIL 2
Hardware Software
SIL 2 SIL 2
+ Hardware Software
SIL 3 SIL 2
SIL rating does not change in time.
FALSE!
SIL integrity levels depend on the probability of failure which increases with time.
TRUE OR FALSE?
Safety Manual must be provided by the instrument manufacturer.
TRUE!
Safety Manual is an integral document to the SIL rating of any component. It defines the assumption behind the
certification and the conditions of the SIL rating as well as provide proper maintenance information.
TRUE OR FALSE?
Two products both claiming SIL 2 offer the same level of safety.
FALSE!
1) PFDavg or RRF value of a SIL level ranges in a factor of 10. Example: SIL 2 means from RRF = 100 to 1000.
2) SIL ratings are time related. Example: SIL 2 rating for 10 yrs differs from SIL 2 for 1 yr.
TRUE OR FALSE?
Periodic test is required to maintain the SIL Level.
TRUE!
Since some failures are undetected in operating conditions (dangerous undetected failures) Tests are required to restore
the SIF in “as-new” condition (effectiveness 100%)
Periodic Tests are essential for maintaining the SIL level.
TRUE OR FALSE?
T-Proof Time Interval are specified by the Plant Maintenance Personnel.
FALSE!
It is specified in the Hardware Specification and is decided by the manufacture and verified by the certification agency.
TRUE OR FALSE?
Component Type (A & B) are defined by the customer (User)..
FALSE!
The component class is defined by the Manufacturer.
TRUE OR FALSE?
Shorter T-proof time intervals improve SIL ratings.
TRUE!
Reducing time intervals between T-proof tests decreases the probability of failure (PFDavg) in time.
Example: SIL 1 for 1 yr may become SIL 2 for 3 months.
TRUE OR FALSE?
PFDavg value of the SIF is equal to the highest of all the SIF components
FALSE!
The PFDavg value of the safety function (SIF) is the SUM of PFDavg values of all its components (subsystems).
TRUE OR FALSE?
SFF % and PFD figures both must match the SIF SIL Requirement .
TRUE!
The SFF value of each of the SIF component must be within the table A or B requirement to claim a given
SIL level.
The SIF total PFD must also match that of the required RRF
TRUE OR FALSE?
It is possible to make software changes without an Impact
Analysis
FALSE! Safety Impact Analysis must be performed for any
hardware or software change in the plant!
TRUE OR FALSE?
SIL 3 equipment can be useful in SIL 2 functions.
TRUE!
Using a higher SIL level than necessary allows to reduce frequency of T-proof tests and has a lower incidence on the
total PFDavg of the SIF.
Example: SIL 3 for 1 yr could become SIL 2 for 10 yrs.
TRUE OR FALSE?
Maintenance must be considered in the design phase.
TRUE!
A safety function under maintenance is unavailable therefore the length of the repair time must be considered.
The improvement obtained applying redundant architectures is temporarily lost.
TRUE OR FALSE?
All failures have the same effect on safety.
FALSE!
Failures can be SAFE or DANGEROUS. The first lead to a spurious trip which does not harm, but
induces a stopping of production.
The second instead will render the safety function unavailable.
TRUE OR FALSE?
MTBF includes time for repair.
TRUE!
MTBF = MTTF + MTTR. For most applications, MTTR is negligible therefore
MTBF ≈ MTTF. However in high demand applications,
even a few hours of unavailability are critical and should be taken into account.
TRUE OR FALSE?
All redundant system architectures improve safety.
FALSE!
Redundant Architectures have different effects on SAFE and DANGEROUS failure rates.
Example: 1oo2 improves dangerous failure rates
but worsens safe failure rates. 2oo2 is the opposite
TRUE OR FALSE?
Safety Manual Provides for T-Proof test procedure but not the test
effectiveness percentage.
FALSE! Test Effectiveness (TE) must be specified along with the
T-proof procedure and must be used in calculating recurring SIL level
TRUE OR FALSE?
SIL level and relating RRF are defined by HSE (Health Safety Executive)
TRUE!
A team composed of Management, Plant, Process, Instrument, Maintenance, Quality Engineers is responsible
for determining RRF factor for each SIF
TRUE OR FALSE?
HSE Engineers have the responsibility to maintain the SIL level during plant
life time
FALSE!
Maintenance Engineer are responsible to maintain the
SIL level as mandated by initial calculations.
For SIL 2 SIFs their work must be reviewed by a separate department. For SIL 3 or 4 SIFs by an external agency.
TRUE OR FALSE?
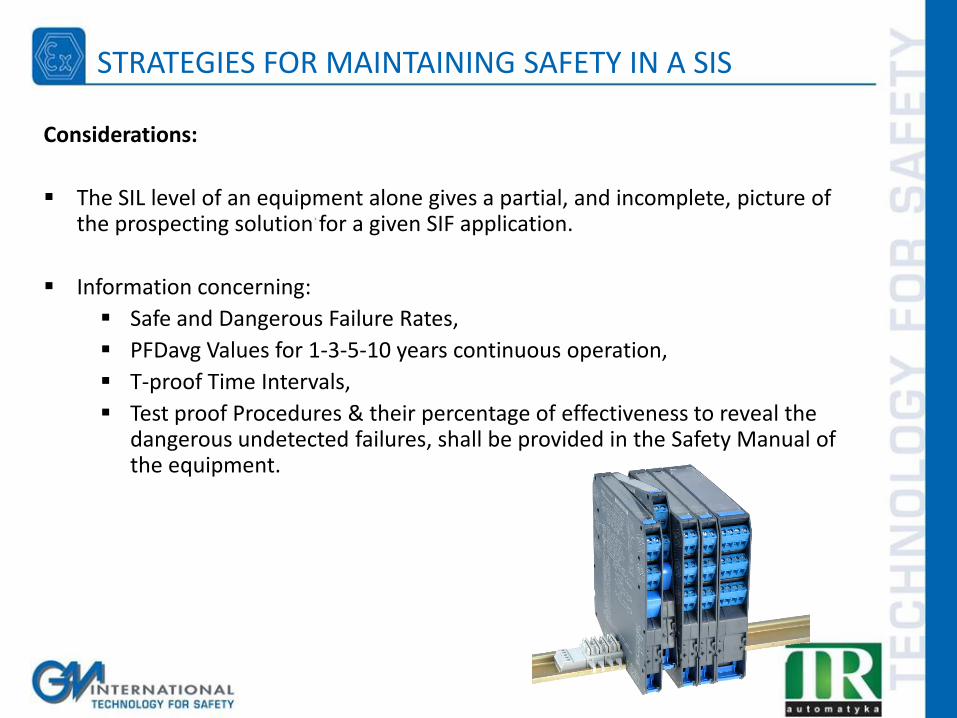
Considerations:
The SIL level of an equipment alone gives a partial, and incomplete, picture of the prospecting solution for a given SIF application.
Information concerning:
Safe and Dangerous Failure Rates,
PFDavg Values for 1-3-5-10 years continuous operation,
T-proof Time Intervals,
Test proof Procedures & their percentage of effectiveness to reveal the dangerous undetected failures, shall be provided in the Safety Manual of the equipment.
STRATEGIES FOR MAINTAINING SAFETY IN A SIS
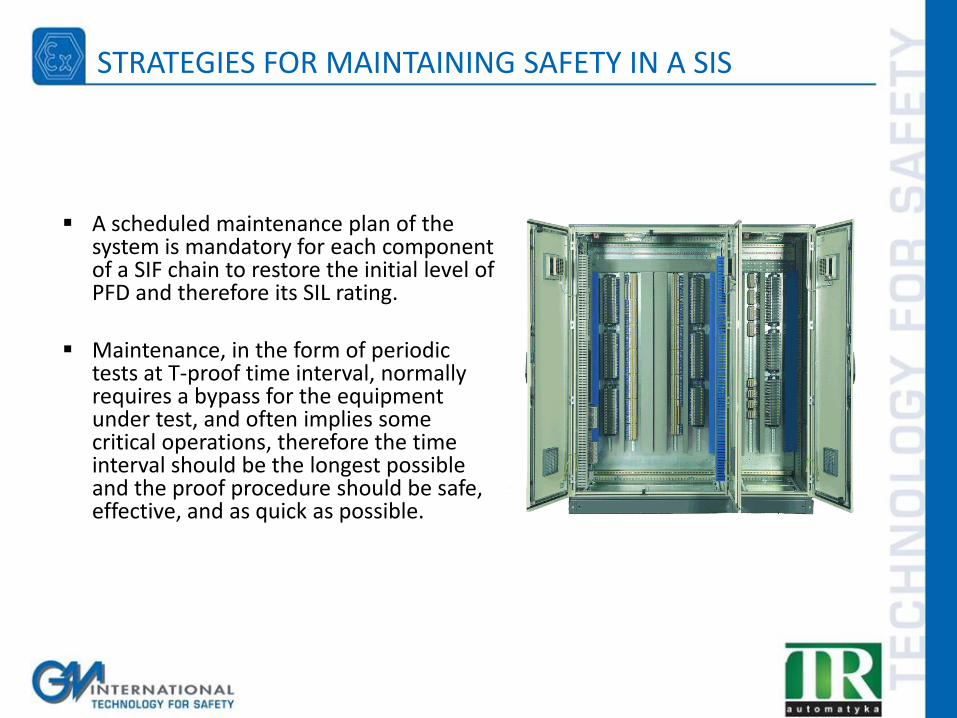
A scheduled maintenance plan of the system is mandatory for each component of a SIF chain to restore the initial level of PFD and therefore its SIL rating.
Maintenance, in the form of periodic tests at T-proof time interval, normally requires a bypass for the equipment under test, and often implies some critical operations, therefore the time interval should be the longest possible and the proof procedure should be safe, effective, and as quick as possible.
STRATEGIES FOR MAINTAINING SAFETY IN A SIS
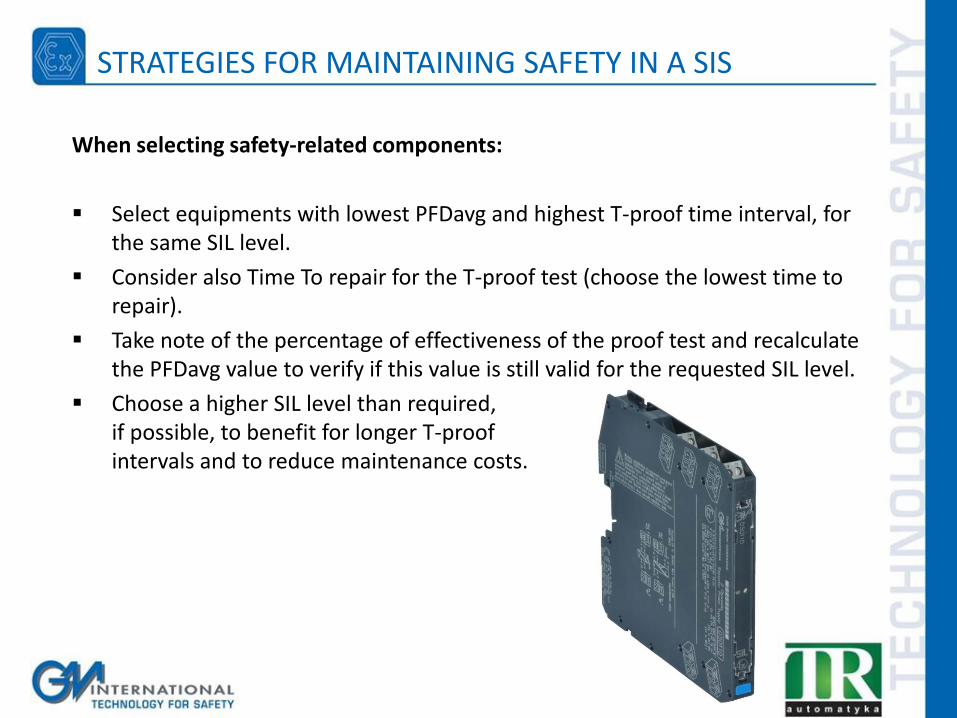
When selecting safety-related components:
Select equipments with lowest PFDavg and highest T-proof time interval, for the same SIL level.
Consider also Time To repair for the T-proof test (choose the lowest time to repair).
Take note of the percentage of effectiveness of the proof test and recalculate the PFDavg value to verify if this value is still valid for the requested SIL level.
Choose a higher SIL level than required, if possible, to benefit for longer T-proof intervals and to reduce maintenance costs.
STRATEGIES FOR MAINTAINING SAFETY IN A SIS
G.M. International s.r.l
Via San Fiorano, 70
20058 Villasanta (Milan)
ITALY
www.gmintsrl.com
TR Automatyka Sp. z o.o. sp k
ul. Lechicka 14
02-156 Warszawa
POLAND
www.trautomatyka.pl