Determining the effect of gradual sugar reduction on ...
124
Determining the effect of gradual sugar reduction on liking of sweetened iced tea A Thesis SUBMITTED TO THE FACULTY OF UNIVERSITY OF MINNESOTA BY Loma B. Inamdar IN PARTIAL FULFILLMENT OF THE REQUIREMENTS FOR THE DEGREE OF MASTER OF SCIENCE Zata M. Vickers February 2020
Transcript of Determining the effect of gradual sugar reduction on ...

Determining the effect of gradual sugar reduction on liking of sweetened iced tea
A Thesis SUBMITTED TO THE FACULTY OF
UNIVERSITY OF MINNESOTA BY
Loma B. Inamdar
IN PARTIAL FULFILLMENT OF THE REQUIREMENTS FOR THE DEGREE OF MASTER OF SCIENCE
Zata M. Vickers
February 2020

© Loma Inamdar 2020

i
ACKNOWLEDGMENTS Thank you to Zata Vickers, who time and time again led me to follow my objective. Your passion for sensory science is incredible and ultimately guided me through all the rabbit holes. The experience of learning from you has been like no other, you love what you do and it is truly an experience to observe your thought process. A highlight of working with you has been your ability to troubleshoot the unexpected while remaining calm. A special thank you for taking the many meetings (scheduled and unscheduled) and your patience. It took some time but I finally understand what you meant by, “sometimes you just have to write it, but you have to write it down.” Thank you to my committee members – Christine Vandongen and Traci Mann. Christine thank you for listening to me ramble on about sugar reduction for the past two years (despite your beliefs), bombard you with statistics questions, and quite honestly questions about life in general. Traci thank you for serving on my committee and for your opinions and advice. Nuala Bobowski thank you sparking my interest in sensory science. You simply mentioned the words, “Would you be interested in sensory science?” which ultimately led me to Zata. Oh, and let us not forget laying the ground work for my research. Thank you to the Healthy Foods, Heathy Lives Institute, the University of Minnesota, and the Sensory Center. Thank you to the “Iced Tea Study” participants without your dedication to the study, I would not have data to write about. To the Sensory Center Undergraduates, Marisa Kwong, Zachary Turnquist, Brigitta Yaputri, William Dao, Taylor Huntley, Caitlin Plate, and Emile Branco. Thank you for spending your summer working on this study and allowing me to refer to this study as my “baby.” Julie Mennella, I have appreciated your guidance, recommendations, and career advice. Thank you to my previous lab members Loran, Ashley, Naomi, and Phoebe. To the Vickers lab, Myungwoo Kang, thank you for spending time mentoring me about the basics of sensory science. Sara Kleba thank you for making me laugh and always keeping it punny. Loren Avalos thank you for sharing the Sensory Center responsibilities and a fresh perspective, “power pose.” Kris Toppi thank you for encouraging me to explore Minnesota. Jennifer Erickson, I deem you my UMN CFANS yoda. Lastly, to my friends, Sarah, Jovi, Justine, Serena, and Neya, you all made sure to send me your motivation via countless phone calls and texts. You inspired me by showing me just how much support friends can give. Thank you for taking the time to motivate me, especially on the days I told myself I couldn’t. Thank you.

ii
DEDICATION
This thesis is dedicated to my family,
Dad thank you for retiring at the same time I started this program; our daily chats helped the transition of moving away from home. Although those chats were to make sure you did not get too bored, they selfishly were spent reassuring me that making mistakes is a part of life and that these are “my learning years.” Mom, you have shown nothing but courage; you came to this country and left your family behind your strength is everything, and there is nothing you wouldn’t do for your kids. My sister, Shaminy, your encouragement and support have meant the most. Your life has not been easy, and yes, nobody’s life is easy. But you made sure I did not struggle the way you did. Whether you liked it or not we have shared a room for most of our lives, and when the elementary school teachers said my reading level wasn’t at the “right level”, you asked me to read to you at night. While I thought it was just cause you were being lazy, you were secretly trying to help me improve my skills, which thankfully it did. When it came time to complete science projects, you helped me make sure they were up to par and thankfully you stopped me before I mailed out my college applications printed out in German. Oh, and let us not forget, you made sure I did not buy a sweater that did not button all the way up. All throughout my life, I have deemed you my “mini mom” because that is what you are. There has never been a day when you did not tell me to follow my dreams, to not listen to my fears, and make my own path. It hasn’t been the easiest path, but I did it! Also, this was one science project you could not help with, when the student becomes the master. Aren’t you proud? These were the inspiring words that you all have repeated in the past two years:
“These are your learning years, so make mistakes, learn, and grow.”
~Bob B. Inamdar
“Set your mind to it and go.”
~Jayshree B. Inamdar
“Sometimes the fear won’t go away, so you have to do it afraid.”
~Shaminy Inamdar (from Jillian Michaels)

iii
ABSTRACT
Overconsumption of sugar has been of great concern because of its association with
health risks like obesity, diabetes, and cardiovascular disease. Surveys conducted by the
National Institute of Health show sugar-sweetened beverages as a primary contributor to
increased sugar consumption. The objectives of this study were threefold: 1) To determine
if and how sugar-sweetened iced tea liking would change over time for a gradual reduction
of sugar group compared to a no reduction of sugar group, 2) To determine if the gradual
reduction of sugar group’s liking will change from the initial to the final taste test and 3)
To determine if the gradual reduction of sugar affects the participant’s lowest acceptable
level, ideal level, and the highest acceptable level of sweetness in iced tea. Sixty-two
participants who consumed sweetened tea at least three times per week were enrolled in
this three-phase study: an initial taste test, a 12-week repeated consumption phase, and a
final taste test. At the initial and final taste tests participants were served teas differing in
sugar content from 0% to 12% added sugar. Participants were divided into a no reduction
or gradual reduction group for the 12-week repeated consumption phase based on their
hedonic sensitivity to sweetness (the difference between overall liking of the 7.7% and 0%
sweetened teas) and their motivation to decrease their dietary sugar intake. The no
reduction group received a 7.7% sugar-sweetened tea for the duration of the 12 weeks. The
gradual reduction group received a tea that was reduced in 10% sucrose increments each
week from the initial 7.7% sugar-sweetened tea. Over time, liking decreased equally for
the no reduction and gradual reduction groups. From the initial taste test to the final taste
test, overall liking ratings decreased for both the no reduction and gradual reduction groups.

iv
The no reduction group’s liking of the 3.1% and 6.1% added sugar teas significantly
decreased from the initial to the final taste test compared to the gradual reduction group’s
liking of the 3.1% and 6.1% added sugar teas. From the initial taste test to the final taste
test the, lowest acceptable, ideal level, and the highest acceptable level of sweetness did
not differ between the no reduction and gradual reduction group. During the repeated
consumption phase, the gradual reduction group’s decrease in liking may have been related
to monotony, as the decrease in liking was equal to the no reduction group.

v
TABLE OF CONTENTS ACKNOWLEDGMENTS ..............................................................................................................................i
DEDICATION .............................................................................................................................................. ii
ABSTRACT ................................................................................................................................................. iii
TABLE OF CONTENTS .............................................................................................................................. v
LIST OF TABLES .................................................................................................................................... viii
LIST OF FIGURES ...................................................................................................................................... x
BACKGROUND ............................................................................................................................................ 1
Chapter 1: Literature Review ...................................................................................................................... 3 1.1 Sweet tastes throughout life ................................................................................................................. 3
1.1.1 Development of sweet taste .......................................................................................................... 3 1.2 Variability in sweet liking .................................................................................................................... 3
1.2.1 Genetics ........................................................................................................................................ 4 1.2.2 Race .............................................................................................................................................. 4 1.2.3 Gender ........................................................................................................................................... 4 1.2.4 Age ................................................................................................................................................ 5 1.2.5 Individual sweet liking status ........................................................................................................ 6 1.2.6 Relationship between sweet liking status determined from sucrose in water solutions and in other sweet foods or sweet beverages .................................................................................................... 6 1.2.7 Alternative approach to measuring individual sweet liking .......................................................... 9
1.3 Sweet liking status and its relationship to sweet food and beverage liking and dietary sugar intake .................................................................................................................................................................... 9 1.4 Repeated exposure and food monotony ............................................................................................ 10
1.4.1 Effect of repeated exposure on liking/pleasantness over time .................................................... 10 1.5 Experimental studies reducing key taste components ...................................................................... 12
1.5.1 Gradual reduction ....................................................................................................................... 12 1.5.2 Comparison of the pre-reduction measurements to post-reduction measurements ..................... 14
Chapter 2: Objectives and Hypotheses ...................................................................................................... 17 Objective 1 ........................................................................................................................................... 17 Objective 2: .......................................................................................................................................... 17 Objective 3 ........................................................................................................................................... 17 Objective 4: .......................................................................................................................................... 17
Chapter 3: Methods – Data collection ....................................................................................................... 18 3.1 Participants ........................................................................................................................................ 18 3.2 Overall Study Design ......................................................................................................................... 18 3.3 Initial taste test ................................................................................................................................... 19
3.3.1 Products ...................................................................................................................................... 19

vi
3.3.2 Added sugar and tea preparation ................................................................................................. 20 3.3.3 Experimental procedure .............................................................................................................. 20
3.4 Repeated consumption phase ............................................................................................................ 23 3.4.1 Products ...................................................................................................................................... 23 3.4.2 Experimental Procedures ............................................................................................................ 23
3.5 Final taste test .................................................................................................................................... 27 3.5.1 Products ...................................................................................................................................... 27 3.5.2 Experimental procedures ............................................................................................................ 27
Chapter 4: Methods - Data Analysis .......................................................................................................... 29 4.1 Data rescaling .................................................................................................................................... 29
4.1.1 Taste tests .................................................................................................................................... 29 4.1.2 Repeated consumption ................................................................................................................ 30 4.1.3 Calculating the amount consumed to caloric consumption ......................................................... 30
4.2 Initial taste test ................................................................................................................................... 30 4.2.1 Determination of participant’s hedonic sensitivity to sweetness using Lipton added sugar teas 30 4.2.2 Participant assignment to the no reduction or the gradual reduction group ................................ 31
4.3 Repeated consumption phase ............................................................................................................ 33 4.3.1 Determined if and how sugar-sweetened iced tea liking changed over time for the gradual reduction group compared to any trends in the no reduction group. .................................................... 33 4.3.2 Relationship between liking and the amount consumed ............................................................. 34 4.3.3 Relationship between the change in liking from week 1 to week 12 and hedonic sensitivity to sweetness ............................................................................................................................................. 34
4.4 Comparison of the measureaments taken during initial and final taste tests .................................. 35 4.4.1 Overall liking, sweetness, tea flavor, bitterness, and sourness intensities for the Lipton 0%, 1.5%, 3.1%, 6.1%, 7.7%, and 11.7% added sugar teas ........................................................................ 35 4.4.2 Comparison of participants’ lowest acceptable level, ideal level, and highest acceptable level of sweetness ............................................................................................................................................. 36
4.5 Comparisons between the Lipton 7.7% added sugar tea and the two commercially available teas (Pure Leaf and Gold Peak) ...................................................................................................................... 38 4.6 Follow-up questions ........................................................................................................................... 39
Chapter 5: Results ....................................................................................................................................... 40 5.1 Participant retention and grouping ................................................................................................... 40
5.1.1 Balancing participants for hedonic sensitivity to sweetness and motivation to reduce dietary sugar intake .......................................................................................................................................... 41
5.2 Repeated consumption phase ............................................................................................................ 42 5.2.1 Comparison of liking ratings for the no reduction and gradual reduction groups ....................... 42 5.2.2 Thirst ratings, amount of iced tea participants felt like drinking ratings, tiredness ratings, and the amount of iced tea consumed over time ......................................................................................... 44 5.2.3 The relationship between the amount consumed and liking ratings............................................ 54 5.2.4 The relationship between hedonic sensitivity to sweetness and the difference in liking from week 1 to week 12. .............................................................................................................................. 55
5.3 Taste tests ........................................................................................................................................... 57 5.3.1 Effect of the repeated consumption on overall liking from the initial to the final taste test for the Lipton added sugar teas. ...................................................................................................................... 57

vii
5.3.2 Effect of the repeated consumption on sweetness, tea flavor, bitterness, and sourness intensity59 5.3.3 Effect of the repeated consumption on participants’ lowest acceptable, ideal level, and highest acceptable level of sweetness. .............................................................................................................. 67 Table 5.3.3 ........................................................................................................................................... 68 5.3.4 Sweetness intensity, liking, and the lowest acceptable level, ideal level, and highest acceptable level of sweetness ................................................................................................................................ 69
5.4 Comparison between the Lipton 7.7% added sugar, Pure Leaf, and Gold Peak teas ...................... 71 5.4.1 Overall liking, sweetness, tea flavor, bitterness, and sourness intensity comparisons among the Lipton 7.7% added sugar, Pure Leaf, and Gold Peak teas ................................................................... 71 5.4.2 Participants’ responses to the questions about iced tea consumption outside of the study and purpose of the study. ............................................................................................................................ 74
Chapter 6: Discussion ................................................................................................................................. 76 6.1 Hypothesis 1: Gradual reduction and no reduction of sugar will decrease in liking over time. ..... 76
6.1.1 Amount consumed ...................................................................... Error! Bookmark not defined. 6.1.2 Comparison of the amount consumed by the no reduction to the gradual reduction group ........ 76 6.1.3 Does liking measured during taste tests reflect liking measured during repeated consumption?78
6.2 Hypothesis 2: Following the repeated consumption phase, the gradual reduction of sugar group’s liking ratings for lower amounts of added sugar will increase compared to the initial taste test. . Error! Bookmark not defined. 6.3 Hypothesis 3: Gradual reduction of sugar will decrease participants’ ideal level of sweetness in iced tea. .................................................................................................................................................... 77
CONCLUSION ................................................................................................ Error! Bookmark not defined.
REFERENCES ............................................................................................................................................ 82
APPENDICES ............................................................................................................................................. 86

viii
LIST OF TABLES
Table 3.3.1 Sucrose concentrations for the initial and final taste tests .......................................... 20 Table 3.4.1 Sugar concentration of iced tea served during the 12-week repeated consumption for the gradual reduction group (n = 31). Gradual reduction group received weekly 10% reductions in added sugar. ................................................................................................................................... 23 Table 5.1.1 Mean initial hedonic sensitivity to sweetness measured during the initial taste test. Initial includes all participants who enrolled in the study (N = 62); final includes the participants that completed the study (N = 43). ................................................................................................. 41 Table 5.1.2 The number of participants in each motivation category to reduce dietary sugar intake reported during the initial taste test. Initial includes all participants who enrolled in the study (N = 62); final includes the participants that completed the study (N = 43). ......................................... 41 Table 5.2.1 Comparison of weekly mean liking ratings between the no reduction (n = 21) and the gradual reduction (n = 23) groups. No reduction corresponds to the group that received the Lipton 7.7% added sugar each week; gradual reduction corresponds to the group that received tea reduced in sugar each week. Liking was measured on the labeled affective magnitude scale, from the greatest possible dislike (0 points) to greatest possible like (100 points). Mean values represent least square means from the model. Standard errors for the no reduction and gradual reduction groups ranged from 2.8 to 3.0. F and p values represent the comparison of weekly mean liking ratings between the no reduction and gradual reduction groups.......................................... 42 Table 5.2.2 Comparison of weekly thirst ratings between the no reduction (n = 21) and the gradual reduction (n = 23) groups. A maximum of 100 points corresponds to extremely thirsty; a minimum of 0 corresponds to not thirsty at all. Values represent the least square means from the model. Standard errors for the no reduction and gradual reduction groups ranged from 3.8 to 4.1. F and p values represent the comparison of weekly mean thirst ratings between the no reduction and gradual reduction groups. ........................................................................................................ 44 Table 5.2.3 Comparison of weekly mean ratings for the amount participants felt like drinking between the no reduction (n = 21) and the gradual reduction (n = 23) groups. A maximum of 100 points corresponds to A large amount; a minimum of 0 corresponds to none. Values represent the least square means from the model. Standard errors for the no reduction and gradual reduction groups ranged from 4.0 to 4.3. F and p values represent the comparison of weekly mean amount participants felt like drinking ratings between the no reduction and gradual reduction groups. ... 46 Table 5.2.4 Comparison of weekly mean tiredness ratings between the no reduction (n = 21) and the gradual reduction (n = 23) groups. A maximum of 100 points corresponds to Extremely tired, and a minimum of 0 corresponds to not tired at all. Values represent the least square means from the model. Standard errors for the no reduction and gradual reduction groups ranged from 5.3 to 5.7. F and p values represent the comparison of weekly mean tiredness ratings between the no reduction and gradual reduction groups ......................................................................................... 48 Table 5.2.5 Comparison of weekly mean consumption amounts (ml) between the no sugar reduction (n = 21) and the gradual sugar reduction (n = 23) groups. Values represent the least square means from the model. Standard errors for the no reduction and gradual reduction groups ranged from 16.4 to 17.5. F and p values represent the weekly amount consumed by the no reduction and gradual reduction group’s interaction. Shaded rows indicate when the gradual reduction group consumed significantly more than the no reduction group, p values less than 0.05. ............................................................................................................................................... 50 Table 5.2.6 Comparison of weekly mean caloric intake between the no sugar reduction (n = 21) ....................................................................................................................................................... 52

ix
Table 5.3.1 The no reduction and gradual reduction group’s liking ratings from the initial to the final taste test. Values represent the least square means from the model. Standard errors for the no reduction and gradual reduction groups ranged from 4.0 to 4.1. F and p values represent the comparison between the no reduction and gradual reduction groups at the initial and final taste test for each added sugar (%). Shaded rows indicate p values less than 0.05. ............................... 57 Table 5.3.2 The no reduction and gradual reduction groups’ sweetness intensity ratings from the initial to the final taste test. Values represent the least square means from the analysis of variance. Standard errors for the no reduction and gradual reduction groups ranged from 3.1 to 3.2. F and p values represent the comparison between the no reduction and gradual reduction groups at the initial and final taste test for each added sugar level. .................................................................... 59 Table 5.3.3 The no reduction and gradual reduction groups’ tea flavor intensity ratings from the initial to the final taste test. Values represent the least square means from the analysis of variance. Standard errors for the no reduction and gradual reduction groups ranged from 3.2 to 3.1. F and p values represent the comparison between the no reduction and gradual reduction groups at the initial and final taste test for each added sugar level. .................................................................... 61 Table 5.3.4 The no reduction and gradual reduction groups’ bitterness intensity ratings from the initial to the final taste test. Values represent the least square means from the analysis of variance. Standard errors for the no reduction and gradual reduction groups ranged from 2.8 to 2.9. F and p values represent the comparison between the no reduction and gradual reduction groups at the initial and final taste test for each added sugar level. Shaded rows indicate p values less than 0.05. ....................................................................................................................................................... 63 Table 5.3.5 The no reduction and gradual reduction groups’ sourness intensity ratings from the initial to the final taste test. Values represent the least square means from the analysis of variance. Standard errors for the no reduction and gradual reduction groups ranged from 2.0 to 2.1. F and p values represent the comparison between the no reduction and gradual reduction groups at the initial and final taste test for each added sugar level. Shaded rows indicate p values less than 0.05. ....................................................................................................................................................... 65 Table 5.4.1 Comparison between the Lipton 7.7% added sugar, Pure Leaf, and Gold Peak teas. F and p values represent the comparison among the three teas. Shaded rows indicate p values less than 0.05. ........................................................................................................................................ 71 Table 5.4.2 The unedited participant responses from the four participants that included one or all of the three key concepts relating to the question, “What was the purpose of this study?” Bolded words are the key concepts “decrease,” “sugar,” and “over time.” ............................................... 74 Table 5.4.3 A count of responses from the self-assessed question about how often participants consumed iced tea outside of the study. ......................................................................................... 75
x
LIST OF FIGURES
Figure 3.2.1 Overview of the measures collected during each phase, the initial taste test, repeated consumption and final taste test. .................................................................................................... 19 Figure 3.3.1 Nine teas were placed on a tray and ordered left to right for the initial taste test. .... 21 Figure 3.4.1 Weekly iced tea study room set up, Food Science and Nutrition building (left) and McNeal Hall (right)........................................................................................................................ 24 Figure 3.4.2 Participant id numbers were written out on Post-it notes and separated by the no reduction or gradual reduction group as an indication to the server which participant id corresponded to either the no reduction or gradual reduction group. ............................................ 25 Figure 3.4.3 A 355 ml glass of iced tea......................................................................................... 26 Figure 3.4.4 Example ballot sheet and an empty glass of tea left by a participant after completing one of their three weekly sessions at the Food Science and Nutrition location. ............................ 27 Figure 4.2.1 Image of the column headings from the excel file used to balance participants into the no reduction or gradual reduction group. ................................................................................. 32 Figure 5.1.1 Flow chart of recruitment and retention. *One participant from the gradual reduction group did not complete the final taste test and was not included in any of the data analysis comparing the initial and final taste tests. ...................................................................................... 40 Figure 5.2.1 A comparison of mean weekly liking ratings for the no reduction (n = 21) and the gradual reduction (n = 23) groups. Gradual reduction corresponds to the group that received tea reduced in sugar each week; no reduction corresponds to the group that received tea with 7.7% added sugar each week. Liking was measured on the labeled affective magnitude scale with a maximum of 100 points corresponding to the greatest possible like. Corresponding verbal descriptors to the labeled affective magnitude scale are provided on the right. Values are the least square means from the analysis of variance model, and error bars represent standard errors. ...... 43 Figure 5.2.2 A comparison of weekly mean thirst ratings for the no reduction (n = 21) and gradual reduction (n = 23) groups. Thirst ratings were made on a 100-point line scale, a maximum of 100 points corresponding to extremely thirsty and a minimum of 0 corresponding to not at all thirsty. Values are the least square means from the analysis of variance model, and error bars represent standard errors. ....................................................................................................... 45 Figure 5.2.3 Mean ratings for ‘how much iced tea participants felt like drinking right now’ for the no reduction (n = 21) and gradual reduction (n = 23) groups. Ratings were made on a 100-point line scale, a maximum of 100 points corresponding to a large amount and a minimum of 0 corresponding to none. Values are the least square means from the analysis of variance model, and error bars represent standard errors. ........................................................................................ 47 Figure 5.2.4 Mean tiredness ratings for the no reduction (n = 21) and gradual reduction (n = 23) groups. A maximum of 100 corresponds to extremely tired; a minimum of 0 corresponds to not tired at all. Values are the least square means from the analysis of variance model, and error bars represent standard errors. ............................................................................................................... 49 Figure 5.2.5 A comparison of weekly mean consumption amounts between the no reduction (n = 21) and gradual reduction (n = 23) groups. Participants received a 355 ml glass of iced tea; they could drink as much or as little iced tea as they wanted. Values are the least square means from the analysis of variance model, and error bars represent standard errors. ..................................... 51 Figure 5.2.6 Weekly mean caloric intake for the no reduction (n = 21) and gradual reduction (n = 23) groups. Participants in the no reduction group were served approximately 120 calories per 355 ml glass of tea each week. Participants in the gradual reduction group were served a 355 ml glass of tea reduced by 10% of added sugar each week. Participants could drink as much or as

xi
little tea as they wanted. Values are the least square means from the analysis of variance model, and error bars represent standard errors. ........................................................................................ 53 Figure 5.2.7 The average amount each participant consumed each week is plotted on the x-axis, and on the y-axis are participant’s corresponding average weekly liking ratings (N = 44). Liking was measured on the labeled affective magnitude scale with a maximum of 100 points corresponding to the greatest possible like. All participants were asked to drink as much or as little as they wanted of a 355 ml glass of tea. The equation of the trend line is as follows: Liking = 44 + 0.09 * (Amount consumed). .................................................................................................. 54 Figure 5.3.1 Mean overall liking ratings from the initial and final taste tests for the samples ranging in concentration from 0.0% to 11.7% added sugar Lipton teas for the no reduction and gradual reduction groups. Horizontal hatched bars represent the gradual reduction group; vertical bars represent the no reduction group. Unfilled bars represent the initial taste test; solid bars represent the final taste test. Liking was measured on the labeled affective magnitude scale with a maximum of 100 points corresponding to the greatest imaginable like. Corresponding verbal descriptors to the labeled affective magnitude scale are found on the left. Values are least square means from the analyses of variance model, and error bars represent the standard errors. ........... 58 Figure 5.3.2 Mean sweetness intensity ratings for the no reduction and gradual reduction group from the initial and final taste test. Horizontal hatched bars represent the gradual reduction group; vertical bars represent the no reduction group. Unfilled bars represent the initial taste test; solid bars represent the final taste test. Sweetness intensity ratings were measured on the general labeled magnitude scale with a maximum of 100 points corresponding to the strongest possible sensation of any kind. Values are the least square means from the analyses of variance model, and error bars represent the standard errors. ......................................................................................... 60 Figure 5.3.3 Mean tea flavor intensity ratings for the no reduction and gradual reduction group from the initial and final taste test. Horizontal hatched bars represent the gradual reduction group; vertical bars represent the no reduction group. Unfilled bars represent the initial taste test; solid bars represent the final taste test. Tea flavor intensity ratings were measured on the general labeled magnitude scale with a maximum of 100 points corresponding to the strongest possible sensation of any kind. Values are the least square means from the analyses of variance model, and error bars represent the standard errors. ......................................................................................... 62 Figure 5.3.4 Mean bitterness intensity ratings for the no reduction and gradual reduction group from the initial and final taste test. Horizontal hatched bars represent the gradual reduction group; vertical bars represent the no reduction group. Unfilled bars represent the initial taste test; solid bars represent the final taste test. Bitterness intensity ratings were measured on the general labeled magnitude scale with a maximum of 100 points corresponding to the strongest possible sensation of any kind. Values are the least square means from the analyses of variance model, and error bars represent the standard errors. ......................................................................................... 64 Figure 5.3.5 Mean sourness intensity ratings for the no reduction and gradual reduction group from the initial and final taste test. Horizontal hatched bars represent the gradual reduction group; vertical bars represent the no reduction group. Unfilled bars represent the initial taste test; solid bars represent the final taste test. Sourness intensity ratings were measured on the general labeled magnitude scale with a maximum of 100 points corresponding to the strongest possible sensation of any kind. Values are the least square means from the analyses of variance model, and error bars represent the standard errors. ......................................................................................................... 66 Figure 5.3.6 Mean lowest acceptable, ideal level, and highest acceptable level of sweetness for the no reduction and gradual reduction groups from the initial to the final taste test. Circles represent the highest acceptable level of sweetness, squares represent the ideal level of sweetness,

xii
and triangles represent the lowest acceptable level of sweetness. Striped shapes represent the gradual reduction group; solid shapes represent the no reduction group. The lowest acceptable, ideal level, and highest acceptable level of sweetness were measured on the general labeled magnitude scale. ............................................................................................................................. 68 Figure 5.3.7 Mean overall liking, sweetness intensity, and the lowest acceptable level, ideal level, and highest acceptable level of sweetness from the initial and final taste tests for all the Lipton teas. Overall liking was measured on the labeled affective magnitude scale with a maximum of 100-points corresponding to greatest imaginable liking. Sweetness intensity, and the lowest acceptable level, ideal acceptable, and highest acceptable level of sweetness were made on the general labeled affective magnitude scale with a maximum of 100-points corresponding to strongest imaginable sensation of any kind. Open circles represent the mean overall liking from the initial taste test; Solid circles represent the mean overall liking ratings from the final taste test. Open triangles represent the mean sweetness intensity ratings from the initial taste test; solid triangles represent the mean sweetness intensity ratings from the final taste test. Dotted lines going across the scale represent participants’ lowest acceptable, ideal level and highest acceptable level of sweetness. The box between the lowest acceptable level and highest acceptable level of sweetness represents the acceptable range of sweetness. Values are the least square means from the model, and error bars represent the standard error. .................................................................. 70 Figure 5.4.1 Mean overall liking ratings for the Lipton 7.7% added sugar tea, the two commercially available ready-to-drink teas, Gold Peak and Pure Leaf measured at the initial and final taste tests. Lipton 7.7% added sugar tea is represented by solid bars; Pure Leaf tea is represented by dotted bars, and the Gold Leaf tea is represented by horizontal lined bars. Liking was measured on the labeled affective magnitude scale with a maximum of 100 points corresponding to the greatest possible like. Corresponding verbal descriptors to the labeled affective magnitude scale are found on the right. Values are least square means from the analyses of variance model, and error bars represent the standard errors. ................................................... 72 Figure 5.4.2 Mean tea flavor, sweetness, bitterness, and sourness intensity ratings for the Lipton 7.7% added sugar tea, the two commercially available ready-to-drink teas, Gold Peak, and Pure Leaf measured during the initial and final taste tests. Lipton 7.7% added sugar tea is represented by solid bars; Pure Leaf tea is represented by dotted bars, and the Gold Leaf tea is represented by horizontal lined bars. Tea flavor, sweetness, bitterness, and sourness intensity ratings were measured on the general labeled magnitude scale with a maximum of 100 points corresponding to the strongest possible sensation of any kind. Values are the least square means from the analyses of variance model, and error bars represent the standard errors. ................................................... 73 Figure 6.1.1 Mean liking ratings for week 12 of the repeated consumption phase (the 2.4% added sugar tea) and for the 3.1% added sugar tea and the 1.5% added sugar tea served during the final taste test. Liking was measured on the labeled affective magnitude scale with a maximum of 100 points corresponding to the greatest imaginable like. Corresponding verbal descriptors to the labeled affective magnitude scale are found on the left. Values are least square means from the analyses of variance model, and error bars represent the standard errors. ..................................... 80

1
BACKGROUND
Current recommendations by the World Health Organization stipulate added sugar
intake should be reduced by 10% (Brouns, 2015). A major source of added sugar intake is
sugar-sweetened beverages, making up about 9% of consumers daily caloric intake (Malik
et al., 2019). Overconsumption of sugar-sweetened beverages is concerning due to its link
with increasing risks for a number of diseases including dental caries, obesity, type II
diabetes, cardiovascular disease, and stroke (Malik et al., 2019; Wise, Nattress, Flammer,
& Beauchamp, 2016). More recently, Malik et al. (2019) found a positive association
between sugar-sweetened beverage consumption and mortality through cardiovascular
disease. The health risks associated with sugar-sweetened beverage overconsumption
makes the need to decrease sugar-sweetened beverage consumption a public health
priority.
Current recommendations to decrease sugar-sweetened beverage consumption
include drinking diet beverages with nonnutritive sweeteners, replacing sugar-sweetened
beverages with water, or a diet free of sugar-sweetened beverages (California Department
of Public Health & Merchant, 2007). Despite the recommendations, sugar-sweetened
beverages are still a leading source to added sugar consumption (Bailey, Fulgoni, Cowan,
& Gaine, 2018; Rosinger, Herrick, Gahche, & Park, 2017).
In a qualitative comparison of sugar-sweetened beverage consumption over water;
high school students cited the taste and carbonation of sugar-sweetened beverages were
more appealing than water (Hess, Lilo, Cruz, & Davis, 2019). They suggested the sensory

2
attributes that favor sugar-sweetened beverage consumption outweigh the current
recommendations and health risks associated with increased sugar-sweetened beverage
consumption.

3
Chapter 1: Literature Review 1.1 Sweet tastes throughout life
1.1.1 Development of sweet taste
Sweet tastes are innately liked, as observed by studying newborn infants’
acceptance of sucrose-sweetened water (Beauchamp & Cowart, 1987; Desor, Maller, &
Turner, 1973). By observing infants rate of sucking, Desor et al. (1973) examined liking
of sugar-sweetened water in three-day-old infants. Infants given sugar-sweetened water
had an increased sucking rate compared to when they consumed plain water. Crook (1978)
observed the same results when two-day-old infants were given five concentrations of
sucrose in water, ranging from 0.0 M to 0.575 M. Steiner et al. (2001) and Rosenstein and
Oster (1988) found infants expressed positive facial expressions (lip-smacking, sucking
fingers, and tongue protrusions) in the presence of sucrose. Infants innate liking of sweet
tastes signals energy which ultimately is a key to survival (Forestell, 2017; Ventura &
Mennella, 2011; Ventura & Worobey, 2013).
1.2 Variability in sweet liking
Despite inherent liking for sweet tastes, sweet liking is not one size fits all. Many
factors influence sweet liking such as genetic differences, race, gender, and age
(Beauchamp & Cowart, 1987; Mennella, Nolden, & Bobowski, 2018; Reed & McDaniel,
2006; Schiffman, Graham, Sattely-Miller, & Peterson-Dancy, 2000).
4
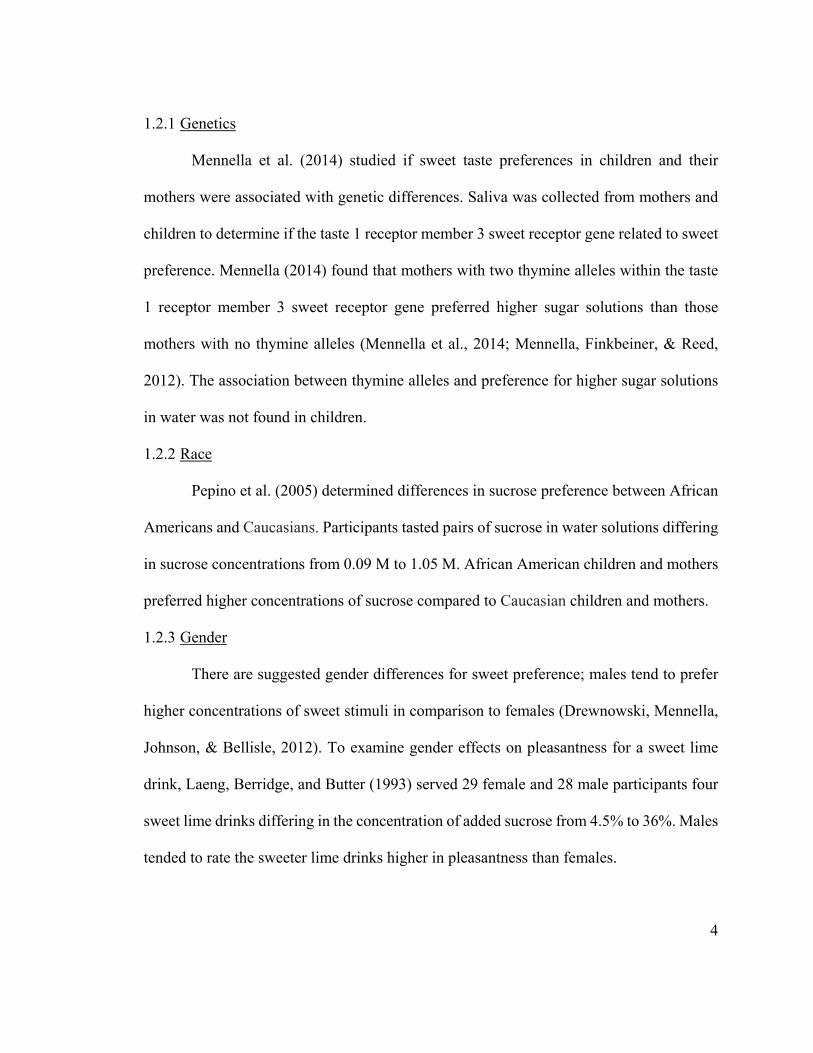
1.2.1 Genetics
Mennella et al. (2014) studied if sweet taste preferences in children and their
mothers were associated with genetic differences. Saliva was collected from mothers and
children to determine if the taste 1 receptor member 3 sweet receptor gene related to sweet
preference. Mennella (2014) found that mothers with two thymine alleles within the taste
1 receptor member 3 sweet receptor gene preferred higher sugar solutions than those
mothers with no thymine alleles (Mennella et al., 2014; Mennella, Finkbeiner, & Reed,
2012). The association between thymine alleles and preference for higher sugar solutions
in water was not found in children.
1.2.2 Race
Pepino et al. (2005) determined differences in sucrose preference between African
Americans and Caucasians. Participants tasted pairs of sucrose in water solutions differing
in sucrose concentrations from 0.09 M to 1.05 M. African American children and mothers
preferred higher concentrations of sucrose compared to Caucasian children and mothers.
1.2.3 Gender
There are suggested gender differences for sweet preference; males tend to prefer
higher concentrations of sweet stimuli in comparison to females (Drewnowski, Mennella,
Johnson, & Bellisle, 2012). To examine gender effects on pleasantness for a sweet lime
drink, Laeng, Berridge, and Butter (1993) served 29 female and 28 male participants four
sweet lime drinks differing in the concentration of added sucrose from 4.5% to 36%. Males
tended to rate the sweeter lime drinks higher in pleasantness than females.

5
1.2.4 Age
Increased liking for sweet tastes occurs in infancy and childhood but decreases in
adulthood. Mennella et al. (2014) found children preferred higher sucrose concentrations
in water compared to mothers. Similar results were found by Desor and Beauchamp (1987);
children aged 11 to 15 years preferred higher sucrose concentrations in water than adults
aged 19 to 25 years. De Graaf and Zandstra (1999) determined the pleasantness ratings of
children, adolescents, and adults using sucrose in water and orangeade. Pleasantness for
increasing amounts of added sugar in water and orangeade decreased with increasing age.
Biological factors influence children’s preference for higher sugar concentrations
over lower sugar concentrations (Coldwell et al., 2009; De Graaf & Zandstra, 1999;
Mennella et al., 2014). Reed and McDaniel (2006) proposed children have a higher
preference for sweet due to the change in caloric requirements during puberty. Coldwell et
al. (2009) determined if puberty was responsible for the increase in sweet preference by
comparing hormone concentration levels and the level of growth and fatness markers
between children grouped by their preference for sugar-sweetened water. Higher levels of
hormone concentrations and markers of growth and fatness are an indication of puberty.
They found children who preferred high sucrose concentrations had higher amounts of the
bone resorption marker than the children that preferred lower sucrose concentrations.

6
1.2.5 Individual sweet liking status
Additionally, there are individual sweet liking patterns that can be demonstrated
using increasing sucrose in water solutions. Pangborn (1970) measured liking for
increasing concentrations of sucrose in water. She found three individual sweet liking
patterns for increasing concentrations of sucrose in water as follows:
1. Individuals whose liking ratings increased as the concentration of sucrose
increased, referred to as sweet likers.
2. Individuals with increased liking up to a certain concentration followed by a
steady decline in liking, referred to as neutrals.
3. Individuals whose liking ratings decreased as the concentration of sucrose
increased, referred to as sweet dislikers.
1.2.6 Relationship between sweet liking status determined from sucrose in water
solutions and in other sweet foods or sweet beverages
Recent methods continue to determine individual sweet liking status using sucrose
in water; however, some studies have shown sweet liking status determined in water does
not predict liking within other sweet foods. Holt et al. (2000) determined sweet liking in
sweet likers and sweet dislikers within two ethnic groups, Caucasian Australians and
Malaysians. Participants rated their sweetness liking of five different levels of sucrose in
water. Sweetness liking ratings of each participant were plotted against the five sucrose
concentrations to categorize participants as sweet likers or sweet dislikers. Participants
whose sweetness liking increased with increasing sucrose levels in water were sweet likers;
participants whose sweetness liking decreased with increasing sucrose levels in water were

7
sweet dislikers. Participants rated their sweetness liking for four levels of added sugar in
orange juice, in custard, and in biscuits. On average, sweet likers had higher liking ratings
for the highest sucrose sample for the orange juice, custard, and biscuit samples. However,
twelve out of the sixteen sweet likers gave lower liking ratings than sweet dislikers for the
high-sucrose orange juice and tended to give lower liking ratings for the high-sucrose
custard and biscuit samples. Perhaps, the liking of sucrose in water solutions may be
disconnected from the liking of other sweet foods.
Methven et al. (Methven, Xiao, Cai, & Prescott, 2016) used rejection thresholds of
varying amounts of sucrose in orange juice and in orange jelly to determine if sweet likers
had a higher sweetness rejection threshold than sweet dislikers. They determined each
participant’s sweet liking status by using a cluster analysis on participants’ liking ratings
of increasing concentrations of sucrose in water. Sweetness rejection thresholds in orange
juice and in jellies were measured by presenting participants with seven different levels of
added sucrose in jellies and in orange juice. Participants were presented with pairs of
samples and chose their preferred sample. Each pair included the lowest added sucrose
level against one of the seven higher levels of added sucrose. Sweet dislikers rejected the
orange juice sample when the sucrose concentration reached the sixth out of the seven
added sucrose levels. No rejection threshold in orange juice was determined for sweet
likers, which was attributed to the lower number of participants categorized as sweet likers.
Additionally, no rejection threshold for the orange jelly was found for either sweet likers
or sweet dislikers. Sweet liking status measured in water, did not relate to rejection

8
thresholds for sweetness in orange jelly for both sweet likers and sweet dislikers or in
orange juice for sweet likers.
Kim et al. (2014), determined sweet liking status using liking ratings of differing
concentrations for sucrose in water solutions and in strawberry juices. A hierarchical
cluster analysis was used to categorize participants, based on their liking for the sucrose in
water solutions and in strawberry juices. The cluster analysis resulted in three distinct sweet
liking groups: 1) Individuals whose liking increased for increasing concentrations of
sucrose in water and in strawberry juice, 2) Individuals whose liking increased to a certain
sucrose concentration for water then decreased, but for strawberry beverages liking
increased with increasing sucrose concentrations, and 3) Individuals whose liking ratings
decreased with increasing concentrations of sucrose in water and in strawberry beverages.
They found two of the three sweet liking patterns for sucrose in water solutions matched
two of the three sweet liking patterns for sucrose in strawberry juices. While there was a
match of sweet liking patterns for sucrose in water and in strawberry juices the sweet liking
patterns would be better measured within the context of the stimulus being tested.
Yang et al. (2019) measured sweet liking status using sucrose in water solutions.
The authors determined the relationship between sweet liking status and liking for three
levels of added sugar in iced tea. Sweet liking status was determined by an agglomerative
hierarchical cluster analysis of participants liking ratings for different levels of sucrose in
water solutions. The cluster analysis resulted in four distinct sweet liking clusters: cluster
1 was classified as high sweet likers, cluster 2 was classified as medium sweet likers,
cluster 3 was classified as low sweet likers, and cluster 4 was classified as unclassified

9
(liking rating for all sucrose in water solutions were about the same). They determined
overall liking ratings for the 13% added sugar iced tea was significantly higher for high
sweet likers than low sweet likers. However, overall liking ratings for the 3% and 8% added
sugar iced teas did not differ among the four sweet liking clusters. The expected liking
patterns based on sweet liker status only applied to the highest added sugar level in iced
tea. Ultimately, individual sweet liker status may be better measured within the context of
the sweet food or beverage being tested.
1.2.7 Alternative approach to measuring individual sweet liking
A possible approach to measure individual sweet liking could be a method used by
Bobowski et al. (2015a) to determine participant’s hedonic sensitivity to salt in tomato
juice. Hedonic sensitivity to salt was measured by taking each participant’s liking
difference between the tomato juices with the lowest and highest salt concentrations. The
higher the hedonic sensitivity to salt the greater the participants liking of the high
concentration of salt in tomato juice. An advantage of this method was liking ratings were
measured within the context of the test stimulus. Thus the limitation of determining sweet
liking status using sucrose in water solutions, can be alleviated by measuring sweet liking
status within the context of the test stimulus.
1.3 Sweet liking status and its relationship to sweet food and beverage liking and dietary
sugar intake
Sweet liking status has been linked to the liking of sweet foods, sweet beverages,
and dietary sugar intake. Kim et al. (2014) determined the relationship between sweet
liking status and participants liking of sweet foods using a 15 cm visual analog scale.

10
Participants rated their liking of 39 foods, 15 sweet foods and 24 savory foods. They found
sweet likers had higher liking ratings for 2 of the 15 sweet foods than sweet dislikers and
neutrals.
Garneau et al. (2018) determined the relationship between sweet liking status and
sugar-sweetened beverage consumption using a beverage food frequency questionnaire.
They determined sweet liking status by clustering participants’ liking ratings for increasing
levels of added sucrose in water solutions. The cluster analysis indicated three distinct
sweet liking clusters, sweet likers, neutrals, and sweet dislikers. The beverage food
frequency questionnaire measured participants frequency intake of beverages including:
water, 100% juice, sweetened juice drinks, milk, regular soda, diet soda, sweetened tea,
and more. Of the 19 beverage categories, sweet likers had a higher frequency for
consuming sweetened tea compared to sweet dislikers and neutrals.
Methven (Methven et al., 2016) determined the relationship between sweet liking
status and dietary sugar intake using a food frequency questionnaire. Results from the food
frequency questionnaire were used to determine participants daily intake from total sugars,
sucrose, and sugars as percent energy intake. Sweet likers tended to have a higher sugar
intake as a percentage of total energy intake than sweet dislikers.
1.4 Repeated exposure and food monotony
1.4.1 Effect of repeated exposure on liking/pleasantness over time
Repeated exposure of liked foods or beverages can result in maintained liking or a
decline in liking over time. Chung and Vickers (2007) determined if repeated consumption
of Earl Grey tea sweetened to an optimum sucrose level would result in decreased liking

11
and increased tiredness over time. During the repeated consumption phase participants in
the optimum sucrose level group attended 19 sessions over a 6-week period. During each
session, participants received 350 ml of tea and consumed as much tea as they liked.
Participants rated their liking of the tea using the labeled affective magnitude scale;
tiredness ratings were measured on a scale from not tired at all to extremely tired. Despite
repeated consumption of the optimally sweetened tea liking ratings did not decrease over
the 19 sessions. Tiredness ratings for the optimal sucrose level group tended to be higher
than the tiredness ratings for the comparison group.
Vickers and Holton (1998) determined if repeated consumption of a strong tea
flavor decreased liking over 20 consumption sessions. Participants attended 20 sessions in
which they consumed as much or as little of a 1300 g serving of iced tea. Liking ratings
were made on a 100-point labeled affective magnitude scale. Liking ratings for the strong
tea flavor did not decrease over time.
Hetherington, Bell and Rolls (2000) determined the course of monotony over time
for chocolate and french fries. Participants were randomly assigned to either the chocolate
or french fry consumption group; they consumed one of the two snacks every day for 15
days. Pleasantness ratings were made after the first bite of the stimuli on the visual analog
scale. Over the 15-day repeated exposure period, pleasantness ratings for chocolate group
significantly declined while pleasantness ratings for french fry group remained the same.
Hetherington, Pirie and Nabb (2002) determined the effect of initial pleasantness
and frequency of consumption on monotony. Bread and butter represented the stimulus
with a low initial pleasantness and frequently consumed; chocolate represented the

12
stimulus with a high initial pleasantness and less frequently consumed. Participants made
pleasantness ratings after the first bite of the stimulus; participants consumed as much or
as little chocolate or bread and butter as they liked. There were 22 repeated consumption
days intertwined with 4 days of ad libitum consumption. Overall there was a decrease in
pleasantness ratings over time. From the first repeated consumption session to the final
repeated consumption session pleasantness ratings decreased by about 20 mm on the 100
mm scale from not at all pleasant to extremely pleasant. Although initial chocolate
pleasantness ratings were high and consumed less frequently than french fries repeated
consumption of chocolate led to a decline in pleasantness.
1.5 Experimental studies reducing key taste components
1.5.1 Gradual reduction
Gradual reduction of key taste components has led to a decline in liking ratings
over time. Bobowski et. al. (2015a) compared liking ratings between two salt reduction
groups over time. Over 16-weeks, a gradual reduction of salt in tomato juice group was
given tomato juice reduced in sodium by 12% increments. They found the gradual
reduction of salt group’s liking ratings decreased over time. As there was a decrease of
liking over time, what remains unknown is how that decrease in liking compared to a group
that consumed the same level of added salt in tomato juice over time.
Lenne and Mann (Lenne & Mann, 2017) determined the feasibility of gradually
reducing sugar in coffee as a strategy for reducing sugar consumption without decreasing
overall enjoyment. Over two weeks, participants rated their overall enjoyment after
drinking coffee reduced in sugar every two days until they reached a level of no added

13
sugar. The reduced sugar amount was individualized for each participant; each participant's
starting sugar amount was reduced by a factor of 1/6 every two days. The gradual reduction
of sugar led to the decreased overall enjoyment of coffee. Perhaps the decrease in
enjoyment was due to the short intervals between sugar reductions or because the size of
the reduction steps was large enough to be easily detected.
More recently, Lima et al. (2019) studied the effect of gradual sugar reduction on
children’s liking of grape nectars over nine weeks. During the first two weeks of the study,
children received a 10% sugar-sweetened grape nectar which was gradually reduced 4.3%
added sugar by the last week. During the nine-week study, children attended one session a
week, in which they were allowed to drink as much grape nectar as they wanted. After
consuming the grape nectar children rated their overall liking using the 9-point hedonic
scale (anchors: 1 = super bad; 9 = super good). Liking ratings decreased as the amount of
added sugar was gradually reduced overtime; liking ratings were, on average, an 8 for the
first week and decreased to 6.8 by the ninth week. While there was a decrease in liking for
the gradually reduced sugar group, it remains unknown how that decrease in liking
compares to a no reduction of sugar group in which the amount of added sugar does not
change.
A common finding in gradual reduction studies whether they are reducing salt or
sugar was a decrease in liking (Bobowski et al., 2015a; Lenne & Mann, 2017; Lima et al.,
2019). Bobowski (2015a) and Lima (2019) both recommend gradual reduction as a strategy
to reduce salt and sugar, respectively, when compared to an abrupt reduction strategy. An
abrupt reduction means dropping the amount of added salt or sugar to a stimulus within

14
one step. However, what remains unknown was how the decrease in liking compares to a
group receiving a high added sugar level repeatedly over time.
1.5.2 Comparison of the pre-reduction measurements to post-reduction measurements
Hedonic measurements, used to compare the effect of an intervention typically are
made prior to the intervention and compared to those made post intervention, have shown
changes in pleasantness, preference, or overall liking. However, there are also studies in
which the comparison of the pre-reduction measurements to the post-reduction
measurements did not result in any changes. Bertino et al. (1982) determined if salt taste
intensity and pleasantness shifted up or down after a low sodium diet. Participants rated
salt intensity and pleasantness for varying concentrations of salt in water solutions, in
vegetable broth and in crackers. After making salt intensity and pleasantness ratings, a
preference task was used to determine which salt concentration participants would want to
consume most. For the preference task, participants were asked to taste all of the possible
salt concentrations before choosing the sample they wanted to consume most. There were
nine salt concentrations in water and in vegetable broth that ranged from 0.07 M to 1.0 M.
There were five levels of added salt in crackers that ranged from 0.8% to 3.8%. The study
was broken into two parts, a two-month pre-diet period and a five-month low sodium diet
period. During the two-month pre-diet period participants rated each stimulus twice. The
first month of the low sodium diet participants rated salt intensity and pleasantness for the
nine salt in water solutions. After two months of the low sodium diet period, participants
made salt taste intensity and pleasantness ratings for salt in water, in vegetable broth, and
in crackers. All stimuli were rated one-week apart, thus one week a participant would rate

15
the crackers, the next week the vegetable broth, and lastly the salt in water solutions. During
the low sodium diet, participants in the low sodium diet group had a downward shift in
their pleasantness ratings. From the pre-diet period to the low sodium diet period,
pleasantness ratings shifted down to lower levels of added salt in vegetable broth and in
crackers. Over the low sodium diet period participants preference shifted to lower levels of
added salt in vegetable broth and in crackers.
Wise et al. (2016) determined how dietary sugar reduction affected sweet taste
intensity and pleasantness ratings. In a five-month study, sweet taste intensity and
pleasantness ratings were collected prior to the three-month dietary sugar reduction, during
the three-month dietary sugar reduction, and after the three-month dietary sugar reduction.
During the three-month dietary sugar reduction, participants were instructed to reduce their
dietary sugar intake by 40%. Participants rated sweet taste intensity and pleasantness of
sugar-sweetened beverages and puddings varying in sucrose concentration. Participants’
sweetness intensity ratings increased during the second and third months of the dietary
sugar reduction. During the dietary sugar reduction pleasantness ratings for sugar-
sweetened beverages and puddings did not change. Once participants stopped the low sugar
diet, the effect of increased sweet intensity ratings was no longer observed. The reduced
sugar diet was only for three months, which may not have been long enough to observe
changes in pleasantness ratings, like the decreases in liking for higher salt levels seen by
Bertino et al. (1982).
Bobowski et. al. (2015b) determined whether the repeated consumption of a
reduced sodium tomato juice would increase liking for reduced sodium tomato juices. They

16
also determined whether the gradual reduction of salt in tomato juice shifted the acceptable
range of saltiness down (Bobowski, 2013). An initial taste test was used to measure liking,
salt taste intensity, and the acceptable range of salt for four different levels of salt in tomato
juice. After the initial taste test participants underwent a 16-week repeated consumption
phase; participants consumed a gradually reduced salt in tomato juice by 12% increments
until week 14. During weeks 14 to 16, participants consumed the same reduced level
sodium in tomato juice. After the repeated consumption phase, a final taste test was
conducted to measure liking, salt taste intensity, and the acceptable range of salt for four
different levels of salt in tomato juice. From the initial taste test to the final taste test
participants had increased liking ratings for all four tomato juices. Participants in the
gradual reduction of salt group found the highest level of added salt in tomato juice saltier
than at the start of the study. The comparison of the initial to the final taste test showed no
difference in the acceptable range of saltiness.

17
Chapter 2: Objectives and Hypotheses
Objective 1: To balance participants into two experimental groups, a no reduction of
sugar and a gradual reduction of sugar group, by their hedonic sensitivity for sweetness in
iced tea and their motivation to decrease dietary sugar intake.
Objective 2: To determine if and how sugar-sweetened iced tea liking will change over
time for a gradual reduction of sugar group compared to a no reduction of sugar group.
Hypothesis 1: Gradual reduction and no reduction of sugar will decrease in liking
over time.
Objective 3: To determine if the gradual reduction of sugar group’s liking will change
from the initial taste test to the final taste test for iced tea samples made with lower
amounts of added sugar.
Hypothesis 2: Following the repeated consumption phase, the gradual reduction
of sugar group’s liking ratings for lower amounts of added sugar will increase
compared to the initial taste test.
Objective 4: To determine if gradual sugar reduction affects participants’ lowest
acceptable, ideal level, and highest acceptable level of sweetness in iced tea.
Hypothesis 3: Gradual reduction of sugar will decrease the lowest acceptable,
ideal level, and highest acceptable level of sweetness in iced tea.

18
Chapter 3: Methods – Data collection 3.1 Participants
We recruited and enrolled sixty-two students and staff from the University of
Minnesota’s Sensory Center listserv. Participants were screened based on their availability
to participate in a 14-week longitudinal study, liking and willingness to consume sweetened
iced tea, and reported consuming iced tea at least 3 times per week. Participants who
reported having diabetes or food allergies or food sensitives were excluded from the study
(refer to Appendix A for the screening questionnaire). The University of Minnesota’s
Institutional Review Board approved all recruiting and experimental procedures (refer to
Appendix B for the approval letter). Participants were compensated $10 for the initial taste
test, $5 for completion of three sessions per week for a total of 12 weeks, $10 for the final
taste test, and a bonus of $50 for those participants who completed at least 33 out of 36
sessions and the initial and final taste tests.
3.2 Overall Study Design
The study was divided into three phases: an initial taste test, the 12-week repeated
consumption phase, and a final taste test (Figure 3.2.1). Participants were asked to refrain
from drinking sweetened iced tea outside of the weekly consumption sessions. All testing
took place in the sensory center facilities in McNeal Hall and the Food Science and

19
Nutrition building on the University of Minnesota’s St. Paul campus. The duration of the
study lasted from May 22, 2018 to August 21, 2018.
3.3 Initial taste test
3.3.1 Products
The range of sucrose concentrations in iced tea was chosen to represent the range
of sucrose concentrations found in commercially available iced teas. During the taste test,
a total of nine teas were served to participants. Seven of the nine teas were made using
Lipton™ decaffeinated black tea (Unilever, Englewood Cliffs, NJ), granulated Crystal
Sugar® (Coveris, Sibley, Iowa), and purified water (Kandiyohi™ Premium Water,
Minneapolis, MN). The remaining two samples were commercially available products,
readily found in local grocery stores in the Twin Cities area, Target® and Cub® Foods, Gold
Peak® sweet tea, (Coca-Cola ® Company, Atlanta, GA) and Pure Leaf® sweet tea, (Lipton,
New York, NY).
Initial taste test • Overall liking • Sweentess, tea flavor,
bitterness, and sourness intensities
• Lowest acceptable, ideal level, and highest acceptable level of sweentess
12-week, repeated consumption phase
• 3 sessions / week • Measured thirst, amount
participants felt like drinking, liking, and tiredness
• Amount of tea consumed
Final taste test • Overall liking • Sweentess, tea flavor,
bitterness, and sourness intensities
• Lowest acceptable, ideal level, and highest acceptable level of sweentess
Figure 4.2.1 Overview of the measures collected during each phase of the
experimental study: the initial taste test, repeated consumption and final taste test.

20
3.3.2 Added sugar and tea preparation
The iced teas were brewed using Lipton tea and varied in the amount of added
sucrose (Table 3.3.1).
Table 4.3.1 Sucrose concentrations for the initial and final taste tests
Tea Added sugar (%)
Lipton
0 1.5 3.1 6.1 7.7 11.7
Pure Leaf 7.7 Gold Peak 8.8
The six Lipton teas were made following the package instructions. We started by
bringing 1.2 L of water to a rolling boil, which took approximately 10 – 15 minutes. After
the water was boiled, the stockpot was removed from the stovetop and 12 tea bags were
steeped in the boiled water for 5 minutes. The tea bags were then removed, the sugar was
added, and stirred until dissolved. The remaining 1.2 L of room temperature water was
added to the tea and sugar mixture to make up a total of 2.4 L. We repeated this process
for each sample except the sample without sugar (refer to Appendix C for the iced tea
preparation protocol). The Lipton brewed teas were refrigerated in 2.5 L amber glass jars
one day before the taste test.
3.3.3 Experimental procedure
Each participant received a tray with nine teas, a cup of water, and a napkin (Figure
3.3.1). Each tea was served to participants in 2 oz. plastic soufflé cups, coded with its
random 3-digit number. Teas were served from the refrigerator at approximately 40° F.

21
Figure 4.3.1 Nine teas were placed on a tray and ordered left to right for the initial taste test.
The 7.7% added sugar tea matched the amount of sucrose found in Pure Leaf sweet
tea. We choose to match the level of added sugar to that of a lead-selling ready-to-drink
iced tea in the United States, Pure Leaf sweet tea (Mintel, 2018). The Lipton 11.7% added
sugar tea was matched to Pure Leaf extra sweet tea. Participants were served nine teas
during the taste test; eight teas were balanced among participants for order and carryover
effects. Participants received the Lipton 7.7% added sugar tea twice during the taste test,
once at the start of the taste test and then again as one of the eight teas served in balanced
order.
Participants were instructed as follows, “You will be evaluating a total of 9 iced tea
samples for several attributes. Please verify that you are evaluating the correct sample
number before tasting each sample, and you may rinse your mouth with water between
samples” (Refer to Appendix D for the initial taste test questionnaire). Participants were
instructed to drink about half of the tea and then evaluate the tea for overall liking using
the labeled affective magnitude scale (LAM), ranging from greatest imaginable dislike to
greatest imaginable like (Schutz & Cardello, Armand, 2001). Participants took additional

22
tastes of the teas as needed to evaluate tea flavor, sweetness, bitterness, and sourness
intensities using the general labeled magnitude scale (gLMS) (Bartoshuk et al., 2003)
ranging from no sensation to strongest imaginable sensation of any kind.
After rating all nine teas, participants rated their lowest acceptable level, ideal level,
and highest acceptable level of sweetness using the general labeled magnitude scale. The
same questions were repeated for tea flavor, bitterness, and sourness to distract participants
from sweetness being the study focus (See Appendix D for acceptable sweetness scales).
All ratings were made using SIMS 2000 Sensory Evaluation Software (Sensory Computer
Systems, Morristown, NJ).
Upon completing all ratings on SIMS 2000 participants answered a questionnaire
regarding, their motivation to consume a diet low in calories, fats, sugars, salt, “junk food,”
“fast food,” and a diet higher in fruits and vegetables, organic foods, and whole grains (See
Appendix E for the questionnaire). While the main focus of the questionnaire was to
determine participants’ motivation to reduce their dietary sugar intake, we asked about all
types of foods to distract participants from sweetness being the study focus. Participants
answered their level of motivation to “Consume a diet low in sugar” and could select one
of the following options: “highly motivated, somewhat motivated, neither motivated nor
unmotivated, somewhat unmotivated, and not motivated at all.”

23
3.4 Repeated consumption phase
3.4.1 Products
Teas were similarly made as the teas for the taste tests but in larger batches. Larger
batchers were made to serve 355 ml of iced tea, three times a week for sixty-two
participants. Teas were made twice a week, every Sunday and Wednesday at both testing
locations, the Food Science and Nutrition Building room 97 and the McNeal Hall
preparation kitchen Room 164.
3.4.2 Experimental Procedures
Each week the no reduction of sugar group (referred to as no reduction group)
received 7.7% added sugar tea. The gradual reduction of sugar group (gradual reduction
group) received the 7.7% added sugar tea for the first week, after which the level of added
sugar was reduced by 10% of the previous week's iced tea every week (Table 3.4.1).
Table 4.4.1 Sugar concentration of iced tea served during the 12-week repeated consumption for the gradual reduction group (n = 31). Gradual reduction group received weekly 10% reductions in added sugar.
Week Added sugar (%) 1 7.7 2 6.9 3 6.2 4 5.6 5 5.0 6 4.5 7 4.1 8 3.7 9 3.3 10 3.0 11 2.7 12 2.4

24
Batches of iced tea made Sunday were served Monday, Tuesday, and Wednesday
and batches made Wednesday were served Thursday and Friday. Iced tea batches were
made separately for each location (See Appendix F for weekly preparation instructions).
On the days of testing, 355 ml glasses of iced tea were poured an hour before each test
session and then stored in the refrigerator.
Participants received iced tea three times per week at one of two locations on the
St. Paul University of Minnesota campus, room 1 in the Food Science and Nutrition
building or room 155 in McNeal Hal (Figure 3.4.1). Each room was decorated to simulate
a comfortable testing environment. A morning session was held in the Food Science and
Nutrition building from 9:00 am to 11:00 am and an afternoon session was held in McNeal
Hall from 1:00 pm to 4:00 pm. Participants chose which time and location they wanted to
complete their once daily, three times per week sessions.
Figure 4.4.1 Weekly iced tea study room set up, Food Science and Nutrition building (left)
and McNeal Hall (right).

25
During each session, of the repeated consumption phase, two research assistants
greeted and served participants. The greeter directed participants to sign-in and handed
them a paper ballot. The greeter remained in the testing room until the end of the session.
The greeter used the participants id number to inform the server of the participants arrival.
The server used the participants id number, which was associated with either the
gradual reduction group or no reduction group. Each preparation area was set-up with Post-
it® notes with each participants’ id number and separated by the gradual reduction or no
reduction group (Figure 3.4.2).
Figure 4.4.2 Participant id numbers were written out on Post-it notes and separated by
the no reduction or gradual reduction group as an indication to the server which
participant id corresponded to either the no reduction or gradual reduction group.
Once the server was notified of the participant’s ID number, the server determined which
group the participant belonged to and removed the corresponding glass of tea from the
refrigerator (Figure 3.4.3).

26
Figure 4.4.3 A 355 ml glass of iced tea.
The paper ballot sheet handed to participants was used to measure two questions
before drinking any tea and two questions after drinking the tea. The two questions before
drinking their tea were: “How thirsty are you right now?” and “How much iced tea do you
feel like drinking right now?” The “How thirsty are you right now?” question was
measured on a line scale, the left most end represented not thirsty at all and the right-most
end represented Extremely thirsty. The “How much iced tea do you feel like drinking right
now?” question was measured on a line scale; the left-most end represented none and the
right-most end represented A large amount.
After they drank as much iced tea as they wanted, they completed two more
questions: “How much do you like the iced tea you just drank?” and “To what extent are
you tired of drinking this iced tea?” Liking for the iced tea was measured using the label
affective magnitude scale, the left-most end represented the greatest possible dislike and
the right-most end represented greatest possible like. The question “To what extent are you
tired of drinking this iced tea?” was measured on a line scale; the left-most end represented
Not tired at all and the right-most end represented Extremely tired. The greeter or server

27
would collect the participants’ ballot sheet and iced tea glass (Figure 3.4.4). We recorded
the amount of iced tea consumed during each session by pouring any remaining tea into a
500 ml graduated cylinder. The amount consumed was determined by taking the initial
amount of iced tea (355 ml) and subtracting the amount left after consumption.
Figure 4.4.4 Example ballot sheet and an empty glass of tea left by a participant after
completing one of their three weekly sessions at the Food Science and Nutrition location.
3.5 Final taste test
3.5.1 Products
The stimuli and procedures used during the final taste test were identical to that
used in the initial taste test (Table 3.3.1).
3.5.2 Experimental procedures
Final taste test took place approximately one week after participants had
completed their last repeated consumption session. During the final taste test, participants
answered two post-study follow up questions (See Appendix G for the final taste test
questionnaire). To determine if participants detected the decrease in sugar concentration
during the repeated consumption, we asked participants, “What do you think this study was

28
about?” To determine if participants had consumed sweetened iced tea outside of the study
they answered the question, “Other than the iced tea you consumed as part of this study
how often during the past 12 weeks did you consume sweetened ice tea outside of this
study?”, participants selected one of the following responses: never, 1 time/month, 2 – 3
times/month, 3 – 4 times/month, 1-2 times/week.

29
Chapter 4: Methods - Data Analysis 4.1 Data rescaling
In order to maintain consistency between the taste tests and the repeated
consumption phase, all scales were rescaled to 100-point scales.
4.1.1 Taste tests
Participants rated overall liking on a 120-point labeled affective magnitude (LAM)
scale. In order to rescale the LAM scale to a 100-point scale, we multiplied each
participant’s ratings by a factor of 0.83. Rescaled values for the verbal descriptors on the
LAM scale were as follows: 0 = greatest imaginable dislike; 10 = dislike extremely; 20 =
dislike very much; 31.3 = dislike moderately; 43.8 = dislike slightly; 50 = neither like nor
dislike; 56.3 = like slightly; 67.5 = like moderately; 79.4 = like very much; 90.6 = like
extremely; 100 = greatest imaginable like.
Participants rated sweetness intensity, lowest acceptable level of sweetness, ideal
level of sweetness, and highest acceptable level of sweetness on a 150-point general labeled
magnitude (gLM) scale. Each participant’s ratings made on the gLM scale were multiplied
by a factor of 0.67. Rescaled values for the associated verbal descriptors along the gLM
scale were as follows: 0 = no sensation; 1.4 = barely detectable; 6.1 = weak; 17.2 =
moderate; 35.4 = strong; 53.3 = very strong; 100 = strongest imaginable sensation of any
kind.

30
4.1.2 Repeated consumption
Participants rated overall liking on a 160 mm LAM scale on paper ballots. The
ratings were measured in millimeters with a ruler from the left end of the scale, to the right
end of the participant’s mark. The scale was rescaled to 100 mm by multiplying
participant’s overall liking ratings by a factor of 0.63. Participants rated thirst, how much
iced tea they felt like drinking, and tiredness of drinking iced tea, on 129 mm scales; all
three scales were rescaled to 100 mm by multiplying each participant’s ratings by a factor
of 0.78.
4.1.3 Calculating the amount consumed to caloric consumption
From the amount consumed, weekly caloric consumption was calculated with a
SAS data step. One gram of sugar is equal to four calories of sugar (FDA, 2015). See
Appendix J for the weekly caloric intake calculations.
4.2 Initial taste test
4.2.1 Determination of participant’s hedonic sensitivity to sweetness using Lipton added
sugar teas
Following the procedures of Bobowski and colleagues (Bobowski et al., 2015a),
we determined each participant’s hedonic sensitivity to sweetness. To determine each
participant’s hedonic sensitivity to sweetness, we subtracted a participant’s overall liking
for the 0% added sugar Lipton tea from their overall liking of the 7.7% added sugar Lipton
tea. The more positive the liking differences were between the 7.7% tea and the 0% tea,
the higher the hedonic sensitivity to sweetness and the more the individual liked the 7.7%
tea more than the 0% tea.

31
4.2.2 Participant assignment to the no reduction or the gradual reduction group
Participants were assigned to one of two groups, a no reduction or gradual reduction
group using their hedonic sensitivity to sweetness values as follows (Figure 4.2.1):
Step 1: Overall liking ratings for the 7.7% and 0% added sugar teas were exported to
Microsoft® Excel.
Step 2: Each participant’s hedonic sensitivity to sweetness was calculated in an empty
column labeled ‘hedonic_sensitivity_ (7.7% - 0%).’
Step 3: We added a column labeled ‘initial randomization’ and used the Excel RAND
function to generate random numbers between 0 and 1 for each participant.
Step 4: The random numbers generated were then copied and pasted as values to a
column labeled ‘fixed value randomization.’
Step 5: An empty column adjacent to the fixed randomization column was labeled
‘reduction group’; the two possible groups were either no reduction or gradual
reduction.
Step 6: We then sorted the file by hedonic sensitivity, from the smallest value to the
greatest value.
Step 7: Vertically adjacent participants were paired from the fixed randomization
column as follows:
• Participants with smaller values were assigned to the gradual reduction group.
• Participants with higher values were assigned to the no reduction group.
Step 8: Assignment of participants into either group was checked by taking the average
hedonic sensitivity to sweetness for the no reduction and gradual reduction group.

32
Figure 5.2.1 Image of the column headings from the excel file used to balance participants
into the no reduction or gradual reduction group.
Additionally, we totaled participant’s self-reported motivations to reduce dietary sugar
intake between the no reduction and gradual reduction groups. There were five possible
responses to the motivation questionnaire which were divided into three motivation groups:
highly, somewhat, and unmotivated to reduce their dietary sugar intake.
1) ‘Highly motivated’ participants responded that they were “highly motivated” to
reduce their dietary sugar intake on the initial taste test questionnaire.
2) ‘Somewhat motivated’ participants responded that they were “somewhat
motivated” to reduce their dietary sugar intake.
3) ‘Unmotivated’ participants responded that they were either one of the following
responses: “neither motivated nor unmotivated, somewhat unmotivated and not
motivated at all.”

33
4.3 Repeated consumption phase
4.3.1 Determined if and how sugar-sweetened iced tea liking changed over time for the
gradual reduction group compared to any trends in the no reduction group.
We analyzed liking ratings using a repeated measures analysis of variance
(ANOVA) with an autoregressive covariance structure for week and Kenward-Rogers
degrees of freedom approximation (SAS, version 9.4, SAS Institute Inc., Cary, NC). Liking
(Like) was the dependent variable with judge (participant) as the random predictor. Group,
week, and the interaction of group by week were the fixed predictors. We tested the mean
weekly liking differences between the no reduction and gradual reduction groups by
measuring the simple effects of the group by week interaction.
/*Liking ratings: Determining the comparison for liking ratings between the no reduction and gradual reduction groups.*/ proc mixed data=xxx.weeklytasting; class group judge week; model like= group|week /ddfm=kr; random intercept / subject=judge; repeated / subject=judge type=AR(1); LSmeans group week /diff slice=week; ODS output diffs=diffslike; ODS output lsmeans=lsmlike6July; run;
The same analysis as above was used for thirst, how much each participant felt like
drinking, tiredness, the amount of iced tea participants consumed, and the caloric
consumption. Tiredness, thirst, how much iced tea participants felt like drinking, the
amount of iced tea participants consumed, and the caloric consumption were the dependent
variables with judge (participant) as the random predictor. The fixed predictors were group,
week, and the interaction of group by week. See Appendix G for each dependent variable.

34
4.3.2 Relationship between liking and the amount consumed
A linear regression was used to determine the relationship between liking and
amount consumed. Each observation point represents a participant’s mean weekly liking
rating and the mean weekly amount consumed.
/* Determining the relationship between liking and the amount consumed.*/ proc reg data=xxx.R26June; model like = amountconsumed_ml; run;
4.3.3 Relationship between the change in liking from week 1 to week 12 and hedonic
sensitivity to sweetness
A linear regression was used to determine the relationship between the difference
in liking between week 1 and week 12 and hedonic sensitivity to sweetness. Each
observation point represents the difference between participant’s mean week 1 and week
12 liking and the initial hedonic sensitivity to sweetness.
/*Relationship between the change in liking from week 1 to week 12 and hedonic sensitivity to sweetness.*/
proc reg data = xxx.senswtdiffwk;
by group; model Week_1___Week_12_liking=hedonic_sensitivity__100__0__; run;

35
4.4 Comparison of the measureaments taken during initial and final taste tests 4.4.1 Overall liking, sweetness, tea flavor, bitterness, and sourness intensities for the
Lipton 0%, 1.5%, 3.1%, 6.1%, 7.7%, and 11.7% added sugar teas
The Lipton 7.7% added sugar tea presented first and the two commercially available
teas were removed from the Lipton tea analyses. In the model, the sugar concentrations
were referred to as added_sugar. The analyses determined if there were any changes of
overall liking, sweetness, tea flavor, bitterness, and sourness intensities from the initial
taste test and final taste test.
We used a mixed model analysis of variance to compare overall liking, sweetness,
tea flavor, bitterness, and sourness intensities at the initial and final taste tests. Overall
liking, sweetness, tea flavor, bitterness, and sourness intensities were the dependent
variables with judge (participant) as the random predictor. The fixed predictors were group
(no reduction and gradual reduction), taste test (initial and final), added_sugar (the 6 added
sugar Lipton teas), and the interactions of group by taste test, taste test by added_sugar,
group by added_sugar, and taste test by group by added_sugar. The reported means were
the least square means from the ANOVA model. This model was repeated for sweetness,
tea flavor, bitterness, and sourness intensity ratings as the dependent variables. See
Appendix H for the SAS code for each dependent variable
/*To determine if there were differences from the initial and final taste tests for overall liking, sweetness, tea flavor, bitterness, and sourness intensity ratings for the Lipton 0%, 1.5%, 3.1%, 6.1%, 7.7%, and 11.7 added sugar teas.*/
proc mixed data=xxx.tastetestall122July; class group judge tastetest added_sugar; model overalllike = group|tastetest|added_sugar/ ddfm=kr; random intercept / subject=judge;

36
LSmeans tastetest added_sugar group tastetest*group tastetest*added_sugar group*added_sugar tastetest*group*added_sugar / diff slice=added_sugar; ODS output diffs=doverall; ODS output lsmeans=lsmeansoverall; run;
4.4.2 Comparison of participants’ lowest acceptable level, ideal level, and highest
acceptable level of sweetness
We determined the effects of repeated tea consumption on participants’ lowest
acceptable, ideal level, and highest acceptable level of sweetness. We used a mixed model
analysis of variance. The lowest acceptable level, ideal level, and the highest acceptable
level of sweetness were the dependent variables. Judge (participant) was the random
predictor; group (no reduction and gradual reduction), taste test (initial and final), and
group by taste test interaction were fixed predictors. See Appendix H for the SAS code for
each dependent variable.
/*To determine if the gradual reduction and no reduction group’s lowest acceptable level of sweetness, differed from the initial taste test to the final taste test */ proc mixed data=xxx.acceptableswt;
class group judge tastetest; model lowsweet = group|tastetest/ ddfm=kr; random intercept / subject=judge; LSmeans group tastetest group*tastetest; ODS output lsmeans=lsmeansacceptswt; run;
We used the lowest acceptable level, ideal level, and highest acceptable level of
sweetness means from the initial taste test and final taste tests to determine which Lipton
added sugar teas belonged to the acceptable range of sweetness. The acceptable range of
sweetness was between the lowest acceptable level of sweetness and the highest level of

37
sweetness. The lowest acceptable, ideal level, and highest acceptable level of sweetness
were collapsed across taste tests and groups. The lowest acceptable, ideal level, and highest
acceptable level of sweetness were plotted with the sweetness intensity for the six added
sugar Lipton teas. The overall liking ratings measured at the initial taste test and final taste
test for the six sucrose concentrations in Lipton tea were also added to the plot.

38
4.5 Comparisons between the Lipton 7.7% added sugar tea and the two commercially
available teas (Pure Leaf and Gold Peak)
This model only included the Lipton 7.7% added sugar tea and the two
commercially available teas (Gold Peak and Pure Leaf). The Lipton 7.7% added sugar tea
presented to all participants first was removed from the analyses, along with the five other
Lipton teas. In the model, tea type referred to the Lipton 7.7% added sugar, Pure Leaf, and
Gold Peak teas.
We used a mixed model analysis of variance to compare the Lipton 7.7% added
sugar tea, Pure Leaf, and Gold Peak teas for the following attributes: overall liking,
sweetness, tea flavor, bitterness, and sourness. using a mixed model analysis of variance.
The dependent variables were overall liking, sweetness, tea flavor, bitterness, and sourness
intensity ratings. Judge (participant) was the random predictor and the fixed predictors
were group (no reduction and gradual reduction), taste test (initial and final), tea type
(Lipton 7.7% added sugar, Pure Leaf, and Gold Peak), and the interactions of group by
taste test, taste test by tea type, group by tea type, and taste test by group by tea type. To
determine if there were differences among the Lipton 7.7% added sugar, Pure Leaf, and
Gold Peak teas a pairwise comparisons post-hoc Bonferroni’s test was used to test the
differences between the least square means. The pairwise comparisons included
comparisons among the three teas for each of the following attributes: overall liking,
sweetness, bitterness, tea flavor, and sourness intensity. See Appendix H for the SAS code
for each dependent variable.

39
/*Overall liking and sweetness intensity comparing the commercial samples with the 7.7% Lipton tea sample*/
proc mixed data=xxx.tastetestall19july; class group judge tastetest teatype; model overalllike = group|tastetest|teatype/ ddfm=kr; random intercept / subject=judge; LSmeans tastetest teatype group tastetest*group tastetest*teatype group*teatype tastetest*group*teatype / adjust=Bon adjdfe=row diff slice=teatype; ODS output diffs=dcomlike; ODS output lsmeans=lsmeanscomlike; run;
4.6 Follow-up questions
We evaluated participants’ responses to “What do you think this study was about?”
we grouped the responses into two categories, correct and not correct. A correct answer
included one or all of the following key concepts, “over time,” “sugar,” and “decrease.”
A frequency count of the number of times participants in the no reduction and
gradual reduction groups consumed sweetened tea outside of the 12-week repeated
consumption phase was calculated.

40
Chapter 5: Results 5.1 Participant retention and grouping
Throughout the study nineteen participants withdrew for the following reasons:
four participants withdrew due to vacation, five withdrew due to schedule conflicts, three
participants withdrew due to unknown reasons, and seven participants did not complete 33
of the 36 weekly sessions (Figure 5.1).
Screened (N = 92)
No reduction (n = 31)
Consented (N = 62)
Gradual reduction (n = 31)
Dropouts: n = 11 Non-compliance: n = 9 No reason: n = 2
Dropouts: n = 8 Non-compliance: n = 7 No reason: n = 1
Completion of study and final analysis
Completed study (n = 23)*
Completed study (n = 21)
Figure 6.1.1 Flow chart of recruitment and retention. *One participant from the gradual reduction
group did not complete the final taste test and was not included in any of the data analysis comparing
the initial and final taste tests.

41
5.1.1 Balancing participants for hedonic sensitivity to sweetness and motivation to reduce
dietary sugar intake
We balanced participants for hedonic sensitivity after the initial taste test, but due
to the 31% attrition, the balance for hedonic sensitivity to sweetness was no longer present
by the final taste test (Table 5.1.1). The initial self-reported motivation to reduce dietary
sugar intake remained balanced by the final taste test (Table 5.1.2).
Table 6.1.1 Mean initial hedonic sensitivity to sweetness measured during the initial
taste test. Initial includes all participants who enrolled in the study (N = 62); final
includes the participants that completed the study (N = 43).
No reduction Gradual reduction
Initial (n = 31) Final (n = 21) Initial (n = 31) Final (n = 22)
17 18 15 11
Table 6.1.2 The number of participants in each motivation category to reduce dietary
sugar intake reported during the initial taste test. Initial includes all participants who
enrolled in the study (N = 62); final includes the participants that completed the study
(N = 43).
Motivation to reduce
dietary sugar intake
No reduction Gradual reduction
Initial
(n = 31)
Final
(n = 21)
Initial
(n = 31)
Final
(n = 22)
Highly 11 8 7 6
Somewhat 14 9 17 13
Unmotivated 6 4 7 3

42
5.2 Repeated consumption phase
5.2.1 Comparison of liking ratings for the no reduction and gradual reduction groups
Liking ratings for both the no reduction and gradual reduction groups significantly
decreased over time (F(week) = 3.81, p < 0 .001), but liking ratings did not differ between
the groups (F(group) = 0.08, p = 0.776). Liking for the no reduction and gradual reduction
groups decreased equally [(F(groupbyweek) = 0.81, p = 0.625, Table 5.2.1, Figure 5.2.1].
Table 6.2.1 Comparison of weekly mean liking ratings between the no reduction (n = 21) and the gradual reduction (n = 23) groups. No reduction corresponds to the group that received the Lipton 7.7% added sugar each week; gradual reduction corresponds to the group that received tea reduced in sugar each week. Liking was measured on the labeled affective magnitude scale, from the greatest possible dislike (0 points) to greatest possible like (100 points). Mean values represent least square means from the model. Standard errors for the no reduction and gradual reduction groups ranged from 2.8 to 3.0. F and p values represent the comparison of weekly mean liking ratings between the no reduction and gradual reduction groups.
Week
Mean liking ratings Statistics
No reduction Gradual reduction F(group) p
1 68 71 0.64 0.425
2 68 69 0.10 0.751
3 66 67 0.08 0.779
4 64 68 0.64 0.426
5 65 69 0.88 0.349
6 63 65 0.46 0.497
7 65 65 0.01 0.935
8 62 64 0.34 0.561
9 65 63 0.24 0.623
10 61 60 0.00 0.945
11 63 63 0.00 0.964
12 64 60 1.05 0.308

43
Figure 6.2.1 A comparison of mean weekly liking ratings for the no reduction (n = 21) and
the gradual reduction (n = 23) groups. Gradual reduction corresponds to the group that
received tea reduced in sugar each week; no reduction corresponds to the group that
received tea with 7.7% added sugar each week. Liking was measured on the labeled
affective magnitude scale with a maximum of 100 points corresponding to the greatest
possible like. Corresponding verbal descriptors to the labeled affective magnitude scale are
provided on the right. Values are the least square means from the analysis of variance
model, and error bars represent standard errors.
0
10
20
30
40
50
60
70
80
90
100
1 2 3 4 5 6 7 8 9 10 11 12
Liki
ng
Weekno reduction gradual reduction
Neither like/dislike
Dislike moderately
Like slightly
Like very much
Greasest possible dislike
Greatest possible like
Dislike extremely
Dislike very much
Like moderately
Dislike slightly
Like extremely

44
5.2.2 Thirst ratings, amount of iced tea participants felt like drinking ratings, tiredness
ratings, and the amount of iced tea consumed over time
Participants’ thirst ratings in both the no reduction and gradual reduction groups
decreased over time (F(week) = 3.35, p < 0.001). Thirst ratings did not differ between the no
reduction and gradual reduction groups (F(group) = 0.13, p = 0.718). The decrease in thirst
ratings for the no reduction and gradual reduction groups did not differ [(F(groupbyweek) =
0.77, p = 0.669), Table 5.2.2 and Figure 5.2.2].
Table 6.2.2 Comparison of weekly thirst ratings between the no reduction (n = 21) and the
gradual reduction (n = 23) groups. A maximum of 100 points corresponds to extremely thirsty;
a minimum of 0 corresponds to not thirsty at all. Values represent the least square means from
the model. Standard errors for the no reduction and gradual reduction groups ranged from 3.8
to 4.1. F and p values represent the comparison of weekly mean thirst ratings between the no
reduction and gradual reduction groups.
Week Thirst Statistics
No reduction Gradual reduction F(group) p
1 59 60 0.03 0.873 2 58 57 0.04 0.836 3 53 58 0.94 0.335 4 52 54 0.10 0.759 5 52 55 0.41 0.525 6 52 53 0.03 0.875 7 53 55 0.07 0.790 8 46 54 1.86 0.175 9 52 52 0.00 0.969 10 48 51 0.16 0.686 11 48 50 0.06 0.807 12 53 49 0.70 0.403

45
Figure 6.2.2 A comparison of weekly mean thirst ratings for the no reduction (n = 21) and
gradual reduction (n = 23) groups. Thirst ratings were made on a 100-point line scale, a
maximum of 100 points corresponding to extremely thirsty and a minimum of 0
corresponding to not at all thirsty. Values are the least square means from the analysis of
variance model, and error bars represent standard errors.
0
10
20
30
40
50
60
70
80
90
100
1 2 3 4 5 6 7 8 9 10 11 12
Thirs
t
Week No reduction Gradual reduction
Not at all thirsty
Extremelythirsty

46
Participants’ ratings for the amount of iced tea they felt like drinking decreased
significantly over time for both the no reduction and gradual reduction groups (F(week) =
6.99, p < 0.001); the decrease did not differ significantly between the no reduction and
gradual reduction groups (F(group) = 0.31, p = 0.582). The decrease in the amount
participants felt like drinking ratings for the no reduction and gradual reduction groups did
not differ [(F(groupbyweek) = 0.89, p = 0.546), Table 5.2.3 and Figure 5.2.3].
Table 6.2.3 Comparison of weekly mean ratings for the amount participants felt like drinking
between the no reduction (n = 21) and the gradual reduction (n = 23) groups. A maximum of 100
points corresponds to A large amount; a minimum of 0 corresponds to none. Values represent
the least square means from the model. Standard errors for the no reduction and gradual reduction
groups ranged from 4.0 to 4.3. F and p values represent the comparison of weekly mean amount
participants felt like drinking ratings between the no reduction and gradual reduction groups.
Week Amount participants’ felt liking drinking Statistics
No reduction Gradual reduction F(group) p
1 58 54 0.42 0.520 2 58 55 0.15 0.698 3 51 54 0.26 0.613 4 47 50 0.27 0.602 5 46 53 1.46 0.230 6 43 47 0.52 0.472 7 46 52 1.22 0.273 8 42 49 1.17 0.283 9 44 46 0.09 0.763
10 41 45 0.35 0.553 11 42 44 0.18 0.676 12 44 45 0.01 0.922

47
Figure 6.2.3 Mean ratings for ‘how much iced tea participants felt like drinking right now’
for the no reduction (n = 21) and gradual reduction (n = 23) groups. Ratings were made on
a 100-point line scale, a maximum of 100 points corresponding to a large amount and a
minimum of 0 corresponding to none. Values are the least square means from the analysis
of variance model, and error bars represent standard errors.
0
10
20
30
40
50
60
70
80
90
100
1 2 3 4 5 6 7 8 9 10 11 12
Am
ount
par
ticip
ants
felt
like
drin
king
WeekNo reduction Gradual reduction
None
A large amount

48
Tiredness ratings increased over time for both the no reduction and gradual
reduction groups (F(week) = 7.96, p < 0.001). The no reduction group tended to have higher
tiredness ratings than the gradual reduction group. However, there was no significant
difference in tiredness ratings between the no reduction and gradual reduction groups
[(F(group) = 1.43, p = 0.238, Figure 5.2.4]. The increase in tiredness ratings for the no
reduction and gradual reduction groups did not differ [F(groupbyweek) = 0.48, p = 0.914, Table
5.2.4].
Table 6.2.4 Comparison of weekly mean tiredness ratings between the no reduction (n = 21)
and the gradual reduction (n = 23) groups. A maximum of 100 points corresponds to Extremely
tired, and a minimum of 0 corresponds to not tired at all. Values represent the least square means
from the model. Standard errors for the no reduction and gradual reduction groups ranged from
5.3 to 5.7. F and p values represent the comparison of weekly mean tiredness ratings between
the no reduction and gradual reduction groups
Week Tired Statistics
No reduction Gradual reduction F(group) p
1 29 19 1.56 0.216 2 35 28 0.80 0.375 3 38 34 0.33 0.569 4 45 36 1.44 0.234 5 44 31 2.68 0.106 6 44 37 0.84 0.363 7 39 33 0.68 0.412 8 47 34 2.77 0.100 9 45 39 0.62 0.433
10 49 41 0.84 0.362 11 47 38 1.35 0.250 12 49 44 0.37 0.543

49
Figure 6.2.4 Mean tiredness ratings for the no reduction (n = 21) and gradual reduction (n
= 23) groups. A maximum of 100 corresponds to extremely tired; a minimum of 0
corresponds to not tired at all. Values are the least square means from the analysis of
variance model, and error bars represent standard errors.
0
10
20
30
40
50
60
70
80
90
100
1 2 3 4 5 6 7 8 9 10 11 12
Tire
d
WeekNo reduction Gradual reduction
not tired at all
Extremely tired

50
Weekly consumption amounts significantly decreased over time (F(week) = 14.58, p
< 0.001). The gradual reduction group tended to consume more tea than the no reduction
group; however, the amount consumed did not differ significantly between the two groups
(F(group) = 2.97, p = 0.092). The amount consumed by the gradual reduction group was
significantly higher than the no reduction group during weeks six, eight, and eleven (Table
5.2.5). The decrease in the amount consumed for the no reduction and gradual reduction
groups did not differ [(F(groupbyweek) = 1.02, p = 0.425), Table 5.2.5 and Figure 5.2.5].
Table 6.2.5 Comparison of weekly mean consumption amounts (ml) between the no sugar
reduction (n = 21) and the gradual sugar reduction (n = 23) groups. Values represent the least
square means from the model. Standard errors for the no reduction and gradual reduction groups
ranged from 16.4 to 17.5. F and p values represent the weekly amount consumed by the no
reduction and gradual reduction group’s interaction. Shaded rows indicate when the gradual
reduction group consumed significantly more than the no reduction group, p values less than
0.05.
Week Amount consumed (ml) Statistics
No reduction Gradual reduction F(group) p 1 255 277 0.87 0.353 2 256 272 0.47 0.496 3 249 276 1.26 0.266 4 234 270 2.32 0.133 5 238 271 1.93 0.169 6 205 253 4.04 0.048 7 217 262 3.49 0.066 8 193 246 5.01 0.028 9 202 234 1.80 0.183
10 174 217 3.30 0.073 11 176 229 5.02 0.028 12 195 214 0.65 0.422

51
Figure 6.2.5 A comparison of weekly mean consumption amounts between the no
reduction (n = 21) and gradual reduction (n = 23) groups. Participants received a 355 ml
glass of iced tea; they could drink as much or as little iced tea as they wanted. Values are
the least square means from the analysis of variance model, and error bars represent
standard errors.
150
160
170
180
190
200
210
220
230
240
250
260
270
280
290
300
1 2 3 4 5 6 7 8 9 10 11 12
Am
ount
con
sum
ed (m
l)
WeekNo reduction Gradual reduction

52
Caloric intake from tea consumption significantly decreased over time (F(week) =
13.24, p = < 0.001). As expected, the gradual reduction group consumed significantly
fewer calories than the no reduction group (F(group) = 68.16, p < 0.001). The calories
consumed by the gradual reduction group significantly differed from the no reduction
group each week from week five to week twelve. The gradual reduction group’s caloric
intake was significantly less than the no reduction group’s caloric intake [(F(groupbyweek) =
13.28, p < 0.001), Table 5.2.6 and Figure 5.2.8].
Table 6.2.6 Comparison of weekly mean caloric intake between the no sugar reduction (n = 21)
and the gradual sugar reduction (n = 23) groups. Values represent the least square means from
the model. Standard errors for the no reduction and gradual reduction groups ranged from 4.1 to 4.4. F and p values represent the weekly amount consumed by the no reduction and gradual
reduction group’s interaction. Shaded rows indicate p values less than 0.05.
Week Calories consumed Statistics No reduction Gradual reduction F(group) p
1 78 85 1.24 0.270 2 78 75 0.31 0.577 3 76 69 1.65 0.203 4 72 61 3.51 0.065 5 73 55 9.46 0.003 6 63 46 8.08 0.006 7 67 43 15.86 <0.001 8 59 36 14.69 <0.001 9 62 31 27.02 <0.001 10 53 26 21.37 <0.001 11 54 25 24.06 <0.001 12 60 21 40.70 <0.001

53
Figure 6.2.6 Weekly mean caloric intake for the no reduction (n = 21) and gradual
reduction (n = 23) groups. Participants in the no reduction group were served
approximately 120 calories per 355 ml glass of tea each week. Participants in the gradual
reduction group were served a 355 ml glass of tea reduced by 10% of added sugar each
week. Participants could drink as much or as little tea as they wanted. Values are the least
square means from the analysis of variance model, and error bars represent standard errors.
0
10
20
30
40
50
60
70
80
90
100
110
120
1 2 3 4 5 6 7 8 9 10 11 12
Am
ount
of c
alor
ies c
onsu
med
Week
No reduction Gradual reduction

54
5.2.3 The relationship between the amount consumed and liking ratings
Each participant’s average weekly amount of tea consumed was plotted against
participants’ average weekly liking ratings to determine the relationship between the
amounts consumed and liking ratings. There were eighty time points in which participants’
average weekly consumption was 355 ml. The more tea participants consumed, the higher
the liking ratings for the tea [(r2 = 0.31, p < 0.001), Figure 5.2.9].
The equation of the regression was: Liking = 44 + 0.09 * (amount consumed)
Figure 6.2.7 The average amount each participant consumed each week is plotted on the x-axis,
and on the y-axis are participant’s corresponding average weekly liking ratings (N = 44). Liking
was measured on the labeled affective magnitude scale with a maximum of 100 points
corresponding to the greatest possible like. All participants were asked to drink as much or as little
as they wanted of a 355 ml glass of tea. The equation of the trend line is as follows: Liking = 44 +
0.09 * (Amount consumed).
0
10
20
30
40
50
60
70
80
90
100
20 40 60 80 100 120 140 160 180 200 220 240 260 280 300 320 340 360
Liki
ng
Amount cosuumed (ml)

55
5.2.4 The relationship between hedonic sensitivity to sweetness and the difference in liking
from week 1 to week 12.
The hedonic sensitivity to sweetness was not related to the difference in liking for
either the no reduction or gradual reduction groups (No reduction group: r2 = 0.05, p =
0.90, Figure 5.2.1 and Gradual reduction group: r2 = 0.10, p = 0.10 Figure 5.2.2).
Figure 6.2.8 Difference in the mean week 1 and week 12 liking ratings for each participant in the
no reduction group (n = 18) were plotted against each participant’s initial hedonic sensitivity to
sweetness. The top of the graph indicated liking ratings decreased from week 1 to week 12; the
bottom half of the graph indicated liking ratings increased from week 1 to week 12. Change in
liking from week 1 to week 12 = 0.11(Hedonic sensitivity to sweetness) + 0.52.
-40
-20
0
20
40
60
80
-100 -80 -60 -40 -20 0 20 40 60 80 100
Cha
nge
in li
king
from
wee
k 1
to w
eek
12
Hedonic sensitivity to sweetness
Liking ratings decreased from week 1 to week 12
Liking ratings increased from week 1 to week 12

56
Figure 6.2.9 Difference in the mean week 1 and week 12 liking ratings for each participant in the
gradual group (n = 21) were plotted against each participant’s initial hedonic sensitivity to
sweetness. The top of the graph indicated liking ratings decreased from week 1 to week 12; the
bottom half of the graph indicated liking ratings increased from week 1 to week 12. Change in
liking from week 1 to week 12 = 0.23(Hedonic sensitivity to sweetness) + 8.9.
-40
-20
0
20
40
60
80
-100 -80 -60 -40 -20 0 20 40 60 80 100
Cha
nge
in li
king
from
wee
k 1
to w
eek
12
Hedonic sensitivity to sweetness
Liking ratings decreased from week 1 to week 12
Liking ratings increased from week 1 to week 12

57
5.3 Taste tests
5.3.1 Effect of the repeated consumption on overall liking from the initial to the final taste
test for the Lipton added sugar teas.
Overall liking decreased from the initial taste test to the final taste test [(F(tastetest)
= 12.04, p = 0.001), Table 5.3.1, Figure 5.3.1)]. Liking ratings from the initial to the final
taste test decreased more for the no reduction group than the gradual reduction for the 3.1%
and 6.1% added sugar teas (F(groupbytastetest3.1%added sugar) = 3.91, p = 0.009,
F(groupbytastetest6.1%added sugar) = 3.10, p = 0.027, Table 5.3.1, Figure 5.3.1). For all the other
added sugar teas the liking ratings did not differ between the groups or between the taste
tests (Table 5.3.1, Figure 5.3.1).
Table 6.3.1 The no reduction and gradual reduction group’s liking ratings from the initial
to the final taste test. Values represent the least square means from the model. Standard
errors for the no reduction and gradual reduction groups ranged from 4.0 to 4.1. F and p
values represent the comparison between the no reduction and gradual reduction groups
at the initial and final taste test for each added sugar (%). Shaded rows indicate p values
less than 0.05. No reduction Gradual reduction
Statistics Added
sugar (%) Taste test Taste test
Initial Final Initial Final F(groupbytastetest) p 0 46 43 46 46 0.15 0.932
1.5 50 48 52 48 0.21 0.889 3.1 61 43 53 48 3.91 0.009 6.1 61 47 59 51 3.10 0.027 7.7 60 56 55 55 0.37 0.772 11.7 49 46 48 44 0.27 0.847

58
Figure 6.3.1 Mean overall liking ratings from the initial and final taste tests for the samples
ranging in concentration from 0.0% to 11.7% added sugar Lipton teas for the no reduction
and gradual reduction groups. Horizontal hatched bars represent the gradual reduction
group; vertical bars represent the no reduction group. Unfilled bars represent the initial
taste test; solid bars represent the final taste test. Liking was measured on the labeled
affective magnitude scale with a maximum of 100 points corresponding to the greatest
imaginable like. Corresponding verbal descriptors to the labeled affective magnitude scale
are found on the left. Values are least square means from the analyses of variance model,
and error bars represent the standard errors.
0
10
20
30
40
50
60
70
80
90
100
0 1.5 3.1 6.1 7.7 11.7
Liki
ng
Added sugar (%)Gradual, initial Gradual, final No reduction, initial No reduction, final
Neither like/dislike
Dislike moderately
Like slightly
Like very much
Greatest imaginable dislike
Greatest imaginable like
Dislike extremely
Dislike very much
Like moderately
Dislike slightly
Like extremely

59
5.3.2 Effect of the repeated consumption on sweetness, tea flavor, bitterness, and
sourness intensity
Sweetness intensity ratings did not differ from the initial taste test to the final taste
test nor did they differ between the no reduction and gradual reduction groups [(F(tastetest) =
0.8, p = 0.369), (F(group) = 0.0, p = 0.945), Table 5.3.2]. Sweetness intensity from the initial
to the final taste tests did not differ between the no reduction and gradual reduction groups
[(F(groupbytastetest) = 0.85, p = 0.358), Table 5.3.2, Figure 5.3.2)].
Table 6.3.2 The no reduction and gradual reduction groups’ sweetness intensity ratings
from the initial to the final taste test. Values represent the least square means from the
analysis of variance. Standard errors for the no reduction and gradual reduction groups
ranged from 3.1 to 3.2. F and p values represent the comparison between the no reduction
and gradual reduction groups at the initial and final taste test for each added sugar level. No reduction Gradual reduction
Statistics Added sugar (%)
Taste test Taste test
Initial Final Initial Final F(groupbytastetest) p 0 3 2 2 3 0.03 0.992
1.5 6 2 4 2 0.38 0.767 3.1 8 5 8 6 1.11 0.345 6.1 21 26 19 25 0.25 0.859 7.7 37 33 34 40 1.30 0.275 11.7 57 63 57 60 1.24 0.294

60
Figure 6.3.2 Mean sweetness intensity ratings for the no reduction and gradual reduction
group from the initial and final taste test. Horizontal hatched bars represent the gradual
reduction group; vertical bars represent the no reduction group. Unfilled bars represent the
initial taste test; solid bars represent the final taste test. Sweetness intensity ratings were
measured on the general labeled magnitude scale with a maximum of 100 points
corresponding to the strongest possible sensation of any kind. Values are the least square
means from the analyses of variance model, and error bars represent the standard errors.
0
10
20
30
40
50
60
70
80
90
100
0.0 1.5 3.1 6.1 7.7 11.7
Swee
tnes
s int
ensi
ty
Added sugar (%)
Gradual reduction, initial Gradual reduction, final No reduction, initial No reduction, final
strongest imaginable sensation of any kind
very strong
strong
moderate
weak
no sensationbarely detectable

61
The Lipton teas did not differ in tea flavor intensity between the no reduction and
gradual reduction groups nor was there a difference from the initial to the final taste test
[(F(group) = 0.13, p = 0.725, F(tastetest) = 0.13, p = 0.714)]. Tea flavor intensity from the initial
to the final taste tests did not differ between the no reduction and gradual reduction groups
[(F(tastetestbygroup) = 2.68, p = 0.102), Table 5.3.3, Figure 5.3.3)].
Table 6.3.3 The no reduction and gradual reduction groups’ tea flavor intensity ratings
from the initial to the final taste test. Values represent the least square means from the
analysis of variance. Standard errors for the no reduction and gradual reduction groups
ranged from 3.2 to 3.1. F and p values represent the comparison between the no reduction
and gradual reduction groups at the initial and final taste test for each added sugar level. No reduction Gradual reduction
Statistics Added sugar (%)
Taste test Taste test
Initial Final Initial Final F(groupbytastetest) p 0 27 23 30 23 1.42 0.237
1.5 22 30 23 24 1.59 0.192 3.1 20 20 25 16 1.57 0.198 6.1 19 19 20 19 0.02 0.996 7.7 18 17 21 18 0.44 0.723
11.7 9 15 12 17 1.40 0.242

62
Figure 6.3.3 Mean tea flavor intensity ratings for the no reduction and gradual reduction
group from the initial and final taste test. Horizontal hatched bars represent the gradual
reduction group; vertical bars represent the no reduction group. Unfilled bars represent the
initial taste test; solid bars represent the final taste test. Tea flavor intensity ratings were
measured on the general labeled magnitude scale with a maximum of 100 points
corresponding to the strongest possible sensation of any kind. Values are the least square
means from the analyses of variance model, and error bars represent the standard errors.
0
10
20
30
40
50
60
70
80
90
100
0.0 1.5 3.1 6.1 7.7 11.7
Tea
flavo
r int
ensi
ty
Added sugar (%)
Gradual reduction. initial Gradual reduction, final No reduction, initial No reduction, final
very strong
strong
moderate
barely detectableweakno sensation
strongest imaginable sensation of any kind

63
Bitterness intensity for the added sugar teas did not differ between the no reduction
and gradual reduction groups (F(group) = 0.1, p = 0.817). Bitterness intensity increased from
the initial to the final taste test (F(tastetest) = 15.6, p < 0.001). Bitterness ratings from the
initial to the final taste test increased more for the no reduction group than for the gradual
reduction group for the 1.5% added sugar tea [(Fgroupbytastetest1.5%addedsugartea = 3.00, p =
0.031), Table 5.3.4, Figure 5.3.4]. For all the other added sugar teas the bitterness intensity
ratings did not differ between the groups or between the taste tests (Table 5.3.4, Figure
5.3.4).
Table 6.3.4 The no reduction and gradual reduction groups’ bitterness intensity ratings
from the initial to the final taste test. Values represent the least square means from the
analysis of variance. Standard errors for the no reduction and gradual reduction groups
ranged from 2.8 to 2.9. F and p values represent the comparison between the no reduction
and gradual reduction groups at the initial and final taste test for each added sugar level.
Shaded rows indicate p values less than 0.05. No reduction Gradual reduction
Statistics Added sugar (%)
Taste test Taste test
Initial Final Initial Final F(groupbytastetest) p 0 20 28 23 23 1.70 0.166
1.5 14 22 15 22 3.00 0.031 3.1 11 18 14 20 2.30 0.077 6.1 7 14 8 13 1.98 0.117 7.7 8 9 10 10 0.08 0.973 11.7 5 4 5 5 0.04 0.987

64
Figure 6.3.4 Mean bitterness intensity ratings for the no reduction and gradual reduction
group from the initial and final taste test. Horizontal hatched bars represent the gradual
reduction group; vertical bars represent the no reduction group. Unfilled bars represent the
initial taste test; solid bars represent the final taste test. Bitterness intensity ratings were
measured on the general labeled magnitude scale with a maximum of 100 points
corresponding to the strongest possible sensation of any kind. Values are the least square
means from the analyses of variance model, and error bars represent the standard errors.
0
10
20
30
40
50
60
70
80
90
100
0.0 1.5 3.1 6.1 7.7 11.7
Bitt
erne
ss in
tens
ity
Added sugar (%)Gradual reduction. initial Gradual reduction, final No reduction, initial No reduction, final
strongest imaginable sensation of any kind
very strong
strong
moderate
no sensationbarely detectableweak

65
Sourness intensity increased from the initial to the final taste test (F(tastetest) = 20.0,
p < 0.001). Sourness intensity ratings from the initial to the final taste test increased more
for the no reduction group than the gradual reduction group for the 1.5%, 3.1% and 6.1%
added sugar teas [(F(tastetestbygroup1.5%addedsugartea) = 2.95, p = 0.033),
F(tastetestbygroup3.1%addedsugartea) = 5.31, p = 0.001), F(tastetestbygroup6.1%addedsugartea) = 3.95, p =
0.003=9), Table 5.3.5, Figure 5.3.5]. For all the other added sugar teas the sourness
intensity ratings did not differ between the groups or between the taste tests (Table 5.3.5,
Figure 5.3.5).
Table 6.3.5 The no reduction and gradual reduction groups’ sourness intensity ratings from the initial to the final taste test. Values represent the least square means from the analysis of variance. Standard errors for the no reduction and gradual reduction groups ranged from 2.0 to 2.1. F and p values represent the comparison between the no reduction and gradual reduction groups at the initial and final taste test for each added sugar level. Shaded rows indicate p values less than 0.05.
No reduction Gradual reduction Statistics
Added sugar (%) Taste test Taste test
Initial Final Initial Final F(groupbytastetest) p 0 10 11 7 8 0.70 0.553
1.5 7 12 5 5 2.95 0.033 3.1 6 14 5 8 5.31 0.001 6.1 5 11 4 8 3.95 0.009 7.7 6 9 3 6 1.37 0.252 11.7 6 5 4 5 0.19 0.906

66
Figure 6.3.5 Mean sourness intensity ratings for the no reduction and gradual reduction
group from the initial and final taste test. Horizontal hatched bars represent the gradual
reduction group; vertical bars represent the no reduction group. Unfilled bars represent the
initial taste test; solid bars represent the final taste test. Sourness intensity ratings were
measured on the general labeled magnitude scale with a maximum of 100 points
corresponding to the strongest possible sensation of any kind. Values are the least square
means from the analyses of variance model, and error bars represent the standard errors.
0
10
20
30
40
50
60
70
80
90
100
0.0 1.5 3.1 6.1 7.7 11.7
Sour
ness
inte
nsity
Added sugar (%)Gradual reduction. initial Gradual reduction, final No reduction, initial No reduction, final
strongest imaginable sensation of any kind
very strong
strong
moderate
barely detectableweakno sensation

67
5.3.3 Effect of the repeated consumption on participants’ lowest acceptable, ideal level,
and highest acceptable level of sweetness.
The lowest acceptable level of sweetness did not differ between the no reduction
and gradual reduction groups (F(group) = 0.76, p = 0.388). From the initial to the final taste
test, the participants’ lowest acceptable level of sweetness did not differ (F(tastetest) = 0.83,
p = 0.367). From the initial to the final taste test the lowest acceptable level of sweetness
did not differ between the no reduction and gradual reduction groups [(F(groupbytastetest) =
0.42, p = 0.519), Table 5.3.3, Figure 5.3.6].
The ideal level of sweetness did not differ between the no reduction and gradual
reduction groups (F(group) = 0.37, p = 0.546). From the initial to the final taste test, the
participants’ ideal of sweetness did not differ (F(tastetest) = 0.32, p = 0.574). From the initial
to the final taste test the ideal level of sweetness did not differ between the no reduction
and gradual reduction groups [(F(groupbytastetest) = 1.38, p = 0.247), Table 5.3.3, Figure 5.3.6].
The highest acceptable level of sweetness did not differ between the no reduction
and gradual reduction groups (F(group) = 0.03, p = 0.866). From the initial to the final taste
test, the participants’ highest acceptable level of sweetness did not differ (F(tastetest) = 0.97,
p = 0.331). From the initial to the final taste test the highest acceptable level of sweetness
did not differ between the no reduction and gradual reduction groups [(F(groupbytastetest) =
0.50, p = 0.483), Table 5.3.3, Figure 5.3.6].

68
Table 6.3.3 Lowest acceptable, ideal level, and highest acceptable levels of sweetness at the
initial and final taste tests. Values represent the least square means. Standard errors ranged from
2.5 to 3.2. Ratings were made on the general labeled magnitude scale. F and p values represent
the acceptable level of sweetness between the no reduction and gradual reduction groups from
the initial to the final taste test. Taste test
Statistics Level of
sweetness No reduction Gradual reduction
Initial Final Initial Final F(groupbytastetest) p Lowest 8 8 10 12 0.42 0.519 Ideal 21 18 17 18 1.38 0.247
Highest 30 26 28 27 0.50 0.483
Figure 6.3.6 Mean lowest acceptable, ideal level, and highest acceptable level of sweetness for
the no reduction and gradual reduction groups from the initial to the final taste test. Circles represent
the highest acceptable level of sweetness, squares represent the ideal level of sweetness, and
triangles represent the lowest acceptable level of sweetness. Striped shapes represent the gradual
reduction group; solid shapes represent the no reduction group. The lowest acceptable, ideal level,
and highest acceptable level of sweetness were measured on the general labeled magnitude scale.
A maximum of 100 points corresponded to the strongest possible sensation of any kind and a
minimum of 0 points corresponded to no sensation.
Lowest Lowest
IdealIdeal
HighestHighest
0
10
20
30
40
Initial Final
Leve
l of s
wee
tnes
s
Taste test
strong
moderate
weak
no sensationbarely dectectable

69
5.3.4 Sweetness intensity, liking, and the lowest acceptable level, ideal level, and highest
acceptable level of sweetness
Participants’ acceptable range of sweetness was between 9 – 28 on the gLMS;
ranging between weak and slightly above moderate. Participants ideal level of sweetness
was 18.5 on the general labeled magnitude scale, slightly below moderate (Figure 5.3.7).
During the initial taste test the sweetness intensity for the Lipton 6.1% added sugar tea fell
within the participants acceptable range of sweetness, however, for the final taste test the
sweetness intensity for the 6.1% added sugar Lipton tea was above the acceptable range of
sweetness. The sweetness intensity for the 0% and 1.5% added sugar Lipton teas were
below the acceptable range of sweetness; sweetness intensity for the 7.7% and 11.7% added
sugar Lipton tea was above the acceptable range of sweetness (Figure 5.3.7).

70
Figure 6.3.7 Mean overall liking, sweetness intensity, and the lowest acceptable level,
ideal level, and highest acceptable level of sweetness from the initial and final taste tests
for all Lipton teas. Overall liking was measured on the labeled affective magnitude scale
with a maximum of 100-points corresponding to greatest imaginable liking. Sweetness
intensity, and the lowest acceptable level, ideal acceptable, and highest acceptable level of
sweetness were made on the general labeled affective magnitude scale with a maximum of
100-points corresponding to strongest imaginable sensation of any kind. Open circles
represent the mean overall liking from the initial taste test; solid circles represent the mean
overall liking ratings from the final taste test. Open triangles represent the mean sweetness
intensity ratings from the initial taste test; solid triangles represent the mean sweetness
intensity ratings from the final taste test. Dotted lines going across the scale represent
participants’ lowest acceptable, ideal level and highest acceptable level of sweetness. The
box around the lowest acceptable level and highest acceptable level of sweetness represents
the acceptable range of sweetness. Values are the least square means from the model, and
error bars represent the standard error.
0
10
20
30
40
50
60
70
80
90
100
0
10
20
30
40
50
60
70
80
90
100
0 1.5 3.1 6.1 7.7 11.7
Swee
tnes
s int
ensi
ty
Ove
rall
likin
g
Added sugar (%)
Overall liking initial Overall liking final Sweet intensity initial Sweet initensity final
Highest acceptable level
Ideal acceptable level
Lowest acceptable level

71
5.4 Comparison between the Lipton 7.7% added sugar, Pure Leaf, and Gold Peak teas
5.4.1 Overall liking, sweetness, tea flavor, bitterness, and sourness intensity comparisons
among the Lipton 7.7% added sugar, Pure Leaf, and Gold Peak teas
We found no differences of overall liking ratings among the Lipton 7.7% added
sugar, Pure Leaf, and Gold Peak teas [(F(teatype) = 0.27, p = 0.761), Table 5.3.8, Figure
5.4.1]. Pure Leaf and the Lipton 7.7% added sugar teas were rated highest in sweetness
intensity compared to the Gold Peak tea [(F(teatype) = 21.29, p < 0.001), Figure 5.3.8]. Gold
Peak tea was rated highest in tea flavor, bitterness, and sourness intensity compared to the
other Lipton 7.7% added sugar and Pure Leaf teas [(Fteaflavor(teatype) = 13.47, p < 0.001),
(Fbitterness(teatype) = 12.75, p < 0.001), (Fsourness(teatype) = 28.45, p < 0.001), respectively), Figure
5.3.8].
Table 6.4.1 Comparison between the Lipton 7.7% added sugar, Pure Leaf, and Gold
Peak teas. F and p values represent the comparison among the three teas. Shaded rows
indicate p values less than 0.05.
Attributes Teas Statistics
Lipton 7.7% added sugar Pure Leaf Gold Peak F p
Overall liking 57a 58a 58a 0.27 0.761 Tea flavor 19b 17b 25a 13.47 < 0.001 Sweetness 36a 41a 27b 21.29 < 0.001 Bitterness 9b 6b 13a 12.75 < 0.001 Sourness 6b 5b 14a 28.45 < 0.001 abLetters within a row differing indicate post-hoc Bonferroni comparisons with a p < 0.02.

72
Figure 6.4.1 Mean overall liking ratings for the Lipton 7.7% added sugar tea, the two
commercially available ready-to-drink teas, Gold Peak and Pure Leaf, measured at the
initial and final taste tests. Lipton 7.7% added sugar tea is represented by solid bar; Pure
Leaf tea is represented by dotted bar, and the Gold Leaf tea is represented by horizontal
lined bar. Liking was measured on the labeled affective magnitude scale with a maximum
of 100 points corresponding to the greatest possible like. Corresponding verbal descriptors
to the labeled affective magnitude scale are found on the right. Values are least square
means from the analyses of variance model, and error bars represent the standard errors.
0
10
20
30
40
50
60
70
80
90
100
Lipton 7.7% added sugar Pure Leaf Gold Peak
Ove
rall
likin
g
Teas
Like slightly
Like moderately
Like very much
Like extremely
Greatest possible like
neither like nor dislike
Greatest possible dislike
Dislike extremely
Dislike very much
Dislike moderately
Dislike slightly

73
Figure 6.4.2 Mean tea flavor, sweetness, bitterness, and sourness intensity ratings for the
Lipton 7.7% added sugar tea, the two commercially available ready-to-drink teas, Gold
Peak, and Pure Leaf measured during the initial and final taste tests. Lipton 7.7% added
sugar tea is represented by solid bar; Pure Leaf tea is represented by dotted bar, and the
Gold Leaf tea is represented by horizontal lined bar. Tea flavor, sweetness, bitterness, and
sourness intensity ratings were measured on the general labeled magnitude scale with a
maximum of 100 points corresponding to the strongest possible sensation of any kind.
Values are the least square means from the analyses of variance model, and error bars
represent the standard errors.
0
10
20
30
40
50
60
70
80
90
100
Tea flavor Sweetness Bitterness Sourness
Inte
nsity
ratin
gs
Attributes
Lipton 7.7% added sugar Pure Leaf Gold Peak
strongest imaginablesensation of any kind
weak
no sensationbarely detectable
very strong
strong
moderate

74
5.4.2 Participants’ responses to the questions about iced tea consumption outside of the
study and purpose of the study.
A total of four participants correctly identified the purpose of this study question,
one from the no reduction group and three from the gradual reduction group. Each
participant’s response related to the following key concepts, “decrease,” “sugar,” and “over
time” (Table 5.5.1, a complete table of the responses can be found in Appendix J).
Table 6.4.2 The unedited participant responses from the four participants that included one or all of the three key concepts relating to the question, “What was the purpose of this study?” Bolded words are the key concepts “decrease,” “sugar,” and “over time.”
Group Responses
No reduction
how much iced tea one could tolerate in a week(joking) My guess would be: tolerable levels of sweetness, reducing sugar intake with sweetened non-carbonated beverages
Gradual reduction
The degree to which patientst-victmis-subjects become accustomed to, inurred to various flavor components. I`m convinced you varied sweetness and sourness through teh summer to see if my responses remained cnsuistsent. I`m also convincved this erposnes woudlbe mroe interpretable if tyou had spellc gecker here. I am a louty typist
Gradual reduction
I think this study was about the amount of sweetner added to the tea and if over time a person would not want to continue to drink the sweetened beverage.
Gradual reduction
I noticed that the sweetness levels of the iced tea changed over the weeks, so I think the study was to figure out a tester`s ideal level of sweetness, and whether or not testers adapted to higher or lower sweetness levels throughout the study.

75
A majority of the participants, 28 out of the 43 participants, consumed sweetened
iced tea outside of the study less often than once a month or never (Table 5.5.2). Of the
twenty-one no reduction group participants, three consumed iced tea outside of the study
3 or more times a week.
Table 6.4.3 A count of responses from the self-assessed question about how often participants consumed iced tea outside of the study.
Responses No reduction (n = 21)
Gradual reduction (n = 22)
Never 6 13
< 1 a month 3 6
3 times a month but < 4 times a month 6 2
1 - 2 times per week 3 1
3 or more times a week 3 0

76
Chapter 6: Discussion 6.1 Hypothesis 1: Gradual reduction and no reduction of sugar will decrease in liking
over time.
The level of added sugar may not have caused a decrease in liking during the
repeated consumption phase, since both the gradual reduction and no reduction group’s
liking ratings declined similarly, instead the cause may have been monotony. As previous
research has shown, repeated consumption can result in monotony, which causes decreased
liking (Hetherington et al., 2000; Siegel & Pilgrim, 1958). For example, repeated
consumption of chocolate, whether consumed at a fixed amount or variable amount, led to
decreased pleasantness ratings (Hetherington et al., 2002). Similarly, Siegel and Pilgrim
(1958) saw a decline in palatability when participants repeatedly consumed the same diet
over nine lunches and dinners.
6.2 Hypothesis 2: Following the repeated consumption phase, the gradual reduction of
sugar group’s liking ratings for lower levels of added sugar will increase from the initial
to the final taste test.
From the initial to the final taste test, liking for the 3.1% and 6.1% added sugar teas
significantly decreased for the no reduction group compared to the gradual reduction group.
Perhaps the no reduction group’s repeated consumption of the 7.7% added sugar tea
reinforced their liking for the 7.7% added sugar tea resulting in decreased liking for the
3.1% and 6.1% added sugar teas. Similar results were observed by Biguzzi et al. (2015), in
which the no reduction group’s liking ratings from the pre to the post test decreased for the
lowest added sugar biscuit.

77
While sodium reduction studies have shown increased liking for lower levels of
added salt stimuli (Bertino et al., 1982; Bobowski et al., 2015b; Methven, Langreney, &
Prescott, 2012), studies investigating sugar reduction have been unable to observe similar
results (Biguzzi et al., 2015; Wise et al., 2016). The difference in liking observed for
sodium reduction and sugar reduction studies may be due to nutrient differences (Biguzzi
et al., 2015).
6.3 Hypothesis 3: Gradual reduction of sugar will decrease the lowest acceptable, ideal
level, and the highest acceptable level of sweetness in iced tea.
A possible reason no downward shift in the acceptable range of sweetness for the
gradual reduction group was found, is the range of sweetness is affected by the most-liked
level of sugar. At the initial taste test, the gradual reduction group showed no difference in
liking of the 6.1% and 7.7% added sugar teas. At the final taste test, the 7.7% added sugar
tea was the most-liked tea; potentially explaining why without a decrease in the most-liked
added sugar tea there was no downward shift in the acceptable range of sweetness. Similar
results were found by Bobowski (2013) in which, the acceptable range of saltiness in
tomato juice from the initial to the final taste test did not differ as a function of the optimal
liking of salt from the initial to the final taste test.
The no reduction group’s acceptable range of sweetness was maintained from the
initial to the final taste test, perhaps an effect of repeated exposure to the 7.7% added sugar
tea or perhaps the static nature of consumer’s expected sweetness level in sweetened tea.
Despite the no reduction group’s decreased liking at the final taste test for the 3.1% and
6.1% added sugar teas, the 7.7% added sugar tea remained one of the most-liked samples.
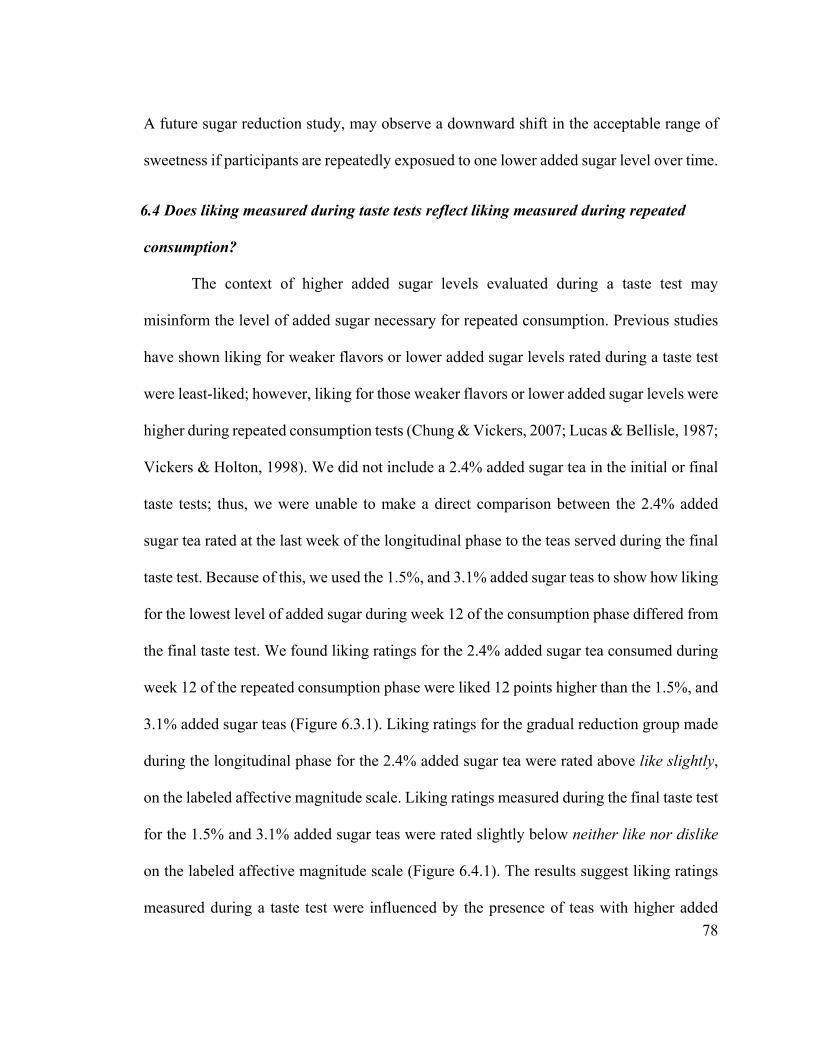
78
A future sugar reduction study, may observe a downward shift in the acceptable range of
sweetness if participants are repeatedly exposued to one lower added sugar level over time.
6.4 Does liking measured during taste tests reflect liking measured during repeated
consumption?
The context of higher added sugar levels evaluated during a taste test may
misinform the level of added sugar necessary for repeated consumption. Previous studies
have shown liking for weaker flavors or lower added sugar levels rated during a taste test
were least-liked; however, liking for those weaker flavors or lower added sugar levels were
higher during repeated consumption tests (Chung & Vickers, 2007; Lucas & Bellisle, 1987;
Vickers & Holton, 1998). We did not include a 2.4% added sugar tea in the initial or final
taste tests; thus, we were unable to make a direct comparison between the 2.4% added
sugar tea rated at the last week of the longitudinal phase to the teas served during the final
taste test. Because of this, we used the 1.5%, and 3.1% added sugar teas to show how liking
for the lowest level of added sugar during week 12 of the consumption phase differed from
the final taste test. We found liking ratings for the 2.4% added sugar tea consumed during
week 12 of the repeated consumption phase were liked 12 points higher than the 1.5%, and
3.1% added sugar teas (Figure 6.3.1). Liking ratings for the gradual reduction group made
during the longitudinal phase for the 2.4% added sugar tea were rated above like slightly,
on the labeled affective magnitude scale. Liking ratings measured during the final taste test
for the 1.5% and 3.1% added sugar teas were rated slightly below neither like nor dislike
on the labeled affective magnitude scale (Figure 6.4.1). The results suggest liking ratings
measured during a taste test were influenced by the presence of teas with higher added

79
sugar levels, so the range effects may have pushed ratings of the lower added sugar teas
downwards.

80
Figure 7.4.1 The gradual reduction group’s mean liking ratings for week 12 of the repeated
consumption phase (the 2.4% added sugar tea) compared to liking ratings for the 3.1% added sugar
tea and the 1.5% added sugar tea served during the final taste test. Liking was measured on the
labeled affective magnitude scale with a maximum of 100 points corresponding to the greatest
imaginable like. Corresponding verbal descriptors to the labeled affective magnitude scale are
found on the right. Values are the least square means from the analyses of variance model, and
error bars represent the standard errors.
0
10
20
30
40
50
60
70
80
90
100
Final 1.5% Final 3.1% Week 12 2.4%
Liki
ng
Added sugar
Neither like/dislike
Dislike moderately
Like slightly
Like very much
Greasest possible dislike
Greatest possible like
Dislike extremely
Dislike very much
Like moderately
Dislike slightly
Like extremely

81
Chapter 7: Conclusion
During the repeated consumption phase both the gradual reduction and no reduction
groups equally declined in liking, thirst, the amount participant’s felt liking drinking, and
the amount consumed. Repeated consumption increased tiredness ratings for both the no
reduction and gradual reduction groups, and the no reduction group tended to have higher
tiredness ratings than the gradual reduction group. Additionally, the no reduction group
tended to consume less tea than the gradual reduction group. Liking for the 3.1% and 6.1%
added sugar teas significantly decreased from the initial to the final taste test for both the
no reduction and gradual reduction groups. From the initial to the final taste test, there was
no difference in sweetness or tea flavor intensity, nor was there a difference in sweetness
and tea flavor ratings between the no reduction or gradual reduction groups. From the initial
to the final taste tests bitterness and sourness intensities increased for both groups. The
acceptable range of sweetness did not differ between the initial and final taste test for the
no reduction or gradual reduction group. Overall liking did not differ between the Lipton
7.7% added sugar tea and the two commercially available teas. The Gold Peak tea was
rated higher in tea flavor, bitterness, and sourness intensity; the Lipton 7.7% added sugar
and Pure Leaf teas were rated highest for sweetness intensity.

82
REFERENCES
Bailey, R. L., Fulgoni, V. L., Cowan, A. E., & Gaine, P. C. (2018). Sources of added sugars in young children, adolescents, and adults with low and high intakes of added sugars. Nutrients, 10(1). https://doi.org/10.3390/nu10010102
Bartoshuk, L. . M., Duffy, V. . B., Fast, K., Green, B. . G., Prutkin, J., & Snyder, D. . J. (2003). Labeled scales (e.g., category, Likert, VAS) and invalid across-group comparisons: what we have learned from genetic variation in taste. Food Quality and Preference, 14(2), 125–138. https://doi.org/10.1016/S0950-3293(02)00077-0
Beauchamp, G. K., & Cowart, B. J. (1987). Development of Sweet Taste. In J. Dobbing (Ed.), Sweetness (pp. 127–140). London: Springer London. https://doi.org/10.1007/978-1-4471-1429-1_9
Bertino, M., Beauchamp, G. K., & Engelman, K. (1982). Long-term reduction in dietary sodium alters the taste of salt. The American Journal of Clinical Nutrition, 36(6), 1134–1144. https://doi.org/10.1093/ajcn/36.6.1134
Biguzzi, C., Lange, C., & Schlich, P. (2015). Effect of sensory exposure on liking for fat- or sugar-reduced biscuits. Appetite, 95, 317–323. https://doi.org/10.1016/j.appet.2015.07.001
Bobowski, N. (2013). A longitudinal comparison of two salt reduction strategies and acceptability of a low sodium food.
Bobowski, N., Rendahl, A., & Vickers, Z. (2015a). A longitudinal comparison of two salt reduction strategies: Acceptability of a low sodium food depends on the consumer. Food Quality and Preference, 40(PB), 270–278. https://doi.org/10.1016/j.foodqual.2014.07.019
Bobowski, N., Rendahl, A., & Vickers, Z. (2015b). Preference for salt in a food may be alterable without a low sodium diet. Food Quality and Preference, 39, 40–45. https://doi.org/10.1016/j.foodqual.2014.06.005
Brouns, F. (2015). WHO Guideline: “Sugars intake for adults and children” raises some question marks. Agro Food Industry Hi-Tech, 26(4), 34–36. https://doi.org/978 92 4 154902 8
California Department of Public Health, & Merchant, N. (2007). Rethink Your Drink. Department of Healthy and Human Services, (27), 15–15. Retrieved from https://www.cdph.ca.gov/programs/cpns/Pages/RethinkYourDrink.aspx
Chung, S. J., & Vickers, Z. (2007). Influence of sweetness on the sensory-specific satiety and long-term acceptability of tea. Food Quality and Preference, 18(2), 256–264. https://doi.org/10.1016/j.foodqual.2005.12.002
Crook, C. K. (1978). Taste perception in the newborn infant. Infant Behavior and Development, 1(1), 52–69. https://doi.org/10.1016/S0163-6383(78)80009-5
De Graaf, C., & Zandstra, E. H. (1999). Sweetness intensity and pleasantness in children, adolescents, and adults. Physiology and Behavior, 67(4), 513–520. https://doi.org/10.1016/S0031-9384(99)00090-6
Desor, J. A., Maller, O., & Turner, R. E. (1973). Taste in acceptance of sugars by human infants. Journal of Comparative and Physiological Psychology, 84(3), 496–501. https://doi.org/10.1037/h0034906

83
Drewnowski, A., Mennella, J. A., Johnson, S. L., & Bellisle, F. (2012). Sweetness and Food Preference. The Journal of Nutrition, 142(6), 1142S-1148S. https://doi.org/10.3945/jn.111.149575
FDA. (2015). Nutrition Facts Label: Sugars. Retrieved from https://www.accessdata.fda.gov/scripts/InteractiveNutritionFactsLabel/factsheets/Sugars.pdf
Forestell, C. A. (2017). Flavor Perception and Preference Development in Human Infants. Annals of Nutrition and Metabolism, 70(3), 17–25. https://doi.org/10.1159/000478759
Garneau, N. L., Nuessle, T. M., Mendelsberg, B. J., Shepard, S., & Tucker, R. M. (2018). Sweet liker status in children and adults: Consequences for beverage intake in adults. Food Quality and Preference, 65(July 2017), 175–180. https://doi.org/10.1016/j.foodqual.2017.10.005
Hess, J. M., Lilo, E. A., Cruz, T. H., & Davis, S. M. (2019). Perceptions of water and sugar-sweetened beverage consumption habits among teens, parents and teachers in the rural south-western USA. Public Health Nutrition, 22(8), 1376–1387. https://doi.org/10.1017/S1368980019000272
Hetherington, M. M., Bell, A., & Rolls, B. J. (2000). Effects of repeat consumption on pleasantness, preference and intake. British Food Journal, 102(7), 507–521. https://doi.org/10.1108/00070700010336517
Hetherington, M. M., Pirie, L. M., & Nabb, S. (2002). Stimulus satiation: Effects of repeated exposure to foods on pleasantness and intake. Appetite, 38(1), 19–28. https://doi.org/10.1006/appe.2001.0442
Holt, S. H. ., Cobiac, L., Beaumont-Smith, N. ., Easton, K., & Best, D. . (2000). Dietary habits and the perception and liking of sweetness among Australian and Malaysian students: A cross-cultural study. Food Quality and Preference, 11(4), 299–312. https://doi.org/10.1016/s0950-3293(99)00076-2
Kim, J. Y., Prescott, J., & Kim, K. O. (2014). Patterns of sweet liking in sucrose solutions and beverages. Food Quality and Preference, 36, 96–103. https://doi.org/10.1016/j.foodqual.2014.03.009
Laeng, B., Berridge, K. C., & Butter, C. M. (1993). Pleasantness of a Sweet Taste during Hunger and Satiety: Effects of Gender and “Sweet Tooth.” Appetite, 21(3), 247–254. https://doi.org/10.1006/appe.1993.1043
Lenne, R. L., & Mann, T. (2017). Reducing sugar use in coffee while maintaining enjoyment: A randomized controlled trial. Journal of Health Psychology, 135910531772345. https://doi.org/10.1177/1359105317723452
Lima, M., Ares, G., & Deliza, R. (2019). Comparison of two sugar reduction strategies with children: Case study with grape nectars. Food Quality and Preference, 71(July 2018), 163–167. https://doi.org/10.1016/j.foodqual.2018.07.002
Lucas, F., & Bellisle, F. (1987). The measurement of food preferences in humans: Do taste-and-spit tests predict consumption? Physiology and Behavior, 39(6), 739–743. https://doi.org/10.1016/0031-9384(87)90259-9
Malik, V. S., Li, Y., Pan, A., De Koning, L., Schernhammer, E., Willett, W. C., & Hu, F.

84
B. (2019). Long-Term Consumption of Sugar-Sweetened and Artificially Sweetened Beverages and Risk of Mortality in US Adults. Circulation, 139(18), CIRCULATIONAHA.118.037401. https://doi.org/10.1161/CIRCULATIONAHA.118.037401
Mennella, J. A., Finkbeiner, S., Lipchock, S. V., Hwang, L. D., & Reed, D. R. (2014). Preferences for salty and sweet tastes are elevated and related to each other during childhood. PLoS ONE, 9(3), 1–9. https://doi.org/10.1371/journal.pone.0092201
Mennella, J. A., Finkbeiner, S., & Reed, D. R. (2012). The proof is in the pudding: Children prefer lower fat but higher sugar than do mothers. International Journal of Obesity, 36(10), 1285–1291. https://doi.org/10.1038/ijo.2012.51
Mennella, J. A., Nolden, A. A., & Bobowski, N. (2018). Measuring Sweet and Bitter Taste in Children: Individual Variation due to Age and Taste Genetics. Pediatric Food Preferences and Eating Behaviors. Elsevier Inc. https://doi.org/10.1016/B978-0-12-811716-3.00001-4
Methven, L., Langreney, E., & Prescott, J. (2012). Changes in liking for a no added salt soup as a function of exposure. Food Quality and Preference, 26(2), 135–140. https://doi.org/10.1016/j.foodqual.2012.04.012
Methven, L., Xiao, C., Cai, M., & Prescott, J. (2016). Rejection thresholds (RjT) of sweet likers and dislikers. Food Quality and Preference, 52, 74–80. https://doi.org/10.1016/j.foodqual.2016.03.012
Mintel. (2018). Executive Summary Tea and Other Hot Drinks. Pangborn, R. M. (1970). Individual variation in affective responses to taste stimuli.
Psychonomic Science, 21(2), 125–126. https://doi.org/10.3758/BF03335798 Pepino, M. Y., & Mennella, J. A. (2005). Factors contributing to individual differences in
sucrose preference. Chemical Senses, 30 SUPPL.(suppl 1), 319–320. https://doi.org/10.1093/chemse/bjh243
Reed, D. R., & McDaniel, A. H. (2006). The human sweet tooth. BMC Oral Health, 6(SUPPL. 1), 1–13. https://doi.org/10.1186/1472-6831-6-S1-S17
Rosenstein, D., & Oster, H. (1988). Differential Facial Responses to Four Basic Tastes in Newborns Author ( s ): Diana Rosenstein and Harriet Oster Differential Facial Responses to Four Basic Tastes in Newborns. Child Development, 59(6), 1555–1568. https://doi.org/10.1111/j.1467-8624.1988.tb03683.x
Rosinger, A., Herrick, K., Gahche, J., & Park, S. (2017). Sugar-sweetened Beverage Consumption Among U.S. Adults, 2011-2014. NCHS Data Brief, (270), 1–8. Retrieved from http://www.ncbi.nlm.nih.gov/pubmed/28135185
Schiffman, S. S., Graham, B. G., Sattely-Miller, E. A., & Peterson-Dancy, M. (2000). Elevated and sustained desire for sweet taste in African-Americans: A potential factor in the development of obesity. Nutrition, 16(10), 886–893. https://doi.org/10.1016/S0899-9007(00)00403-2
Schutz, H. G., & Cardello, Armand, V. (2001). A labeled affective magnitude (LAM) scale for assessing food liking/disliking. Journal of Sensory Studies, 16(2), 117–159. https://doi.org/10.1111/j.1745-459X.2001.tb00293.x
Siegel, P., & Pilgrim, F. (1958). The Effect of Monotony on the Acceptance of Food

85
Author. American Journal of Psychology, 71(4), 756–759. Retrieved from https://primo.lib.umn.edu/permalink/f/dkvf4l/TN_proquest1289823616
Steiner, J. E., Glaser, D., Hawilo, M. E., & Berridge, K. C. (2001). Comparative expression of hedonic impact: affective reactions to taste by human infants and other primates. Neuroscience & Biobehavioral Reviews, 25(1), 53–74. https://doi.org/10.1016/S0149-7634(00)00051-8
Ventura, A. K., & Mennella, J. A. (2011). Innate and learned preferences for sweet taste during childhood. Current Opinion in Clinical Nutrition and Metabolic Care, 14(4), 379–384. https://doi.org/10.1097/MCO.0b013e328346df65
Ventura, A. K., & Worobey, J. (2013). Early influences on the development of food preferences. Current Biology, 23(9), R401–R408. https://doi.org/10.1016/j.cub.2013.02.037
Vickers, Z., & Holton, E. (1998). A comparison of taste test ratings, repeated consumption, and postconsumption ratings of different strengths of iced tea. Journal of Sensory Studies, 13(2), 199–212. https://doi.org/10.1111/j.1745-459X.1998.tb00083.x
Wise, P. M., Nattress, L., Flammer, L. J., & Beauchamp, G. K. (2016). Reduced dietary intake of simple sugars alters perceived sweet taste intensity but not perceived pleasantness. American Journal of Clinical Nutrition, 103(1), 50–60. https://doi.org/10.3945/ajcn.115.112300
Yang, Q., Kraft, M., Shen, Y., MacFie, H., & Ford, R. (2019). Sweet Liking Status and PROP Taster Status impact emotional response to sweetened beverage. Food Quality and Preference, 75(November 2018), 133–144. https://doi.org/10.1016/j.foodqual.2019.02.016

86
APPENDICES
Appendix A: Qualtrics® online screener .................................................................................... 87 Appendix B: Institutional Review Board approval letter ........................................................ 89 Appendix C: Taste test sample preparation protocol ............................................................... 91 Appendix D: Initial taste test SIMS questionnaire ................................................................... 93 Appendix E: Motivation to reduce dietary sugar intake .......................................................... 98 Appendix F: Weekly taste test questionnaire .......................................................................... 100 Appendix G: SAS code for the longitudinal taste test ............................................................ 101 Appendix H: SAS code for the initial and final taste tests ..................................................... 103 Appendix J: Calculation of the number of calories consumed .............................................. 107 Appendix K: Full unedited comment list from participants when asked about the purpose of the study during the final taste test .......................................................................................... 108

87
Appendix A: Qualtrics® online screener
We are recruiting MEN and WOMEN who like and are willing to consume iced tea for a study on diet and taste to commence on X day, X month X day of the week. The test will be conducted at the University of Minnesota in the Department of Food Science and Nutrition and in McNeal Hall. To participate in the study, we would ask you to do the following things:
- Attend an initial taste test session on X day, X month X day of the week and a final test session on X day, X month X day of the week where you will be asked to consume several samples of tea and answer a short survey about your opinions of the tea.
- Consume a 6-8-oz serving of iced tea three times per week, between Monday and
Friday in either the Department of Food Science and Nutrition or McNeal Hall over 12 weeks (May 20th – August 20th, 2018). You may choose when you would like to complete your 3 test sessions each week but must limit yourself to no more than one session per day. You will answer a short survey at each visit about your opinions of the tea.
Each test session will take no more than 20-30 minutes. Because of the frequency that participants will be required to attend test sessions, we think this study would be easiest for those working in or near the Department of Food Science and Nutrition or McNeal Hall on the St. Paul campus. You will be compensated $10 for completing the initial taste test session, $10 for completing the final taste test session, and $75 for completing the 12-week portion of the study — a bonus of $50.00 for completing both taste tests and three visits each week for 12 weeks. If you are interested in taking part in this study, please answer the questions in this survey. Your information will be evaluated to see if you qualify to be part of the study. We will contact you in the next week to schedule you to begin the study. You may choose not to participate, even if you have qualified. All information you provide is strictly confidential. Please enter your email address: _____________ Do you have any food allergies or sensitives? ___ Yes

88
___ No Do you have diabetes? ___ Yes ___ No What is your age?
� 18 to 24 years old � 25 to 34 years old � 35 to 44 years old � 45 to 54 years old � 55 years old or older
What is your gender? ___ Male ___ Female Do you have any food allergies or sensitives? ___ Yes ___ No Do you like and are willing to consume sweetened iced tea? ___ Yes ___ No How often do you consume iced tea? ☐ None ☐ 1 to 6 times/week ☐ 1 time/day ☐ 2 times/day ☐ 4 or more times/day We will get back to you to let you know if you have qualified for the test and, if so, let you know details for study completion. If you have any questions about the study, please respond to this e-mail Thank you! *If you would like to be removed from this email list, please reply to this email with ‘remove’ in the subject line.

89
Appendix B: Institutional Review Board approval letter
EXEMPTION DETERMINATION May 8, 2018 Zata Vickers 612-624-2257 [email protected]
Dear Zata Vickers: On 5/8/2018, the IRB reviewed the following submission:
Type of Review: Initial Study
Title of Study: Determining the impact of a gradual sugar reduction on the acceptability of sugar-sweetened beverage
Investigator: Zata Vickers IRB ID: STUDY00003373
Sponsored Funding: None Grant ID/Con Number: None Internal UMN Funding: None
Fund Management Outside University:
None
IND, IDE, or HDE: None Documents Reviewed with this Submission:
• Initial and Final Taste Test Questionnaire, Category: Other; • Iced Tea Study Protocol, Category: IRB Protocol; • Iced Tea Study Recruitment Screener, Category: Recruitment Materials; • Iced Tea Study Consent Form, Category: Consent Form; • Longitudinal Questionnaire-Iced Tea Study, Category: Other
The IRB determined that this study meets the criteria for exemption from IRB review. To arrive at this determination, the IRB used “WORKSHEET: Exemption
The image part with relationship ID rId42 was not found in the file.

90
(HRP-312).” If you have any questions about this determination, please review that Worksheet in the HRPP Toolkit Library and contact the IRB office if needed.
This study met the following category (ies) for exemption:
• (6) Taste and food quality evaluation and consumer acceptance studies, (i) if
wholesome foods without additives are consumed or (ii) if a food is consumed that contains a food ingredient at or below the level and for a use found to be safe, or agricultural chemical or environmental contaminant at or below the level found to be safe, by the Food and Drug Administration or approved by the Environmental Protection Agency or Food Safety and Inspection Service of the Department of Agriculture
Ongoing IRB review and approval for this study is not required; however, this determination applies only to the activities described in the IRB submission and does not apply should any changes be made. If changes are made and there are questions about whether these activities impact the exempt determination, please submit a Modification to the IRB for a determination.
In conducting this study, you are required to follow the requirements listed in the Investigator Manual (HRP-103), which can be found by navigating to the HRPP Toolkit Library on the IRB website.
For grant certification purposes, you will need these dates and the Assurance of Compliance number which is FWA00000312 (Fairview Health Systems Research FWA00000325, Gillette Children's Specialty Healthcare FWA00004003).
Sincerely,
Clinton Dietrich, MA, CIP IRB Analyst
We value feedback from the research community and would like to hear about your experience. The link below will take you to a brief survey that will take a minute or two to complete. The questions are basic, but your responses will help us better understand what we are doing well and areas that may require improvement. Thank you in advance for completing the survey.
Even if you have provided feedback in the past, we want and welcome your evaluation.
https://umn.qualtrics.com/SE/?SID=SV_5BiYrqPNMJRQSBn

91
Appendix C: Taste test sample preparation protocol
Wash hands prior to preparing Iced Tea samples Materials: Lay out the following supplies in kitchen
□ 6 - 2.5 L Glass bottles (see back kitchen, Need to Wash out before using to prepare samples)
□ 6 – 12-oz translucent cups for weighing out sucrose (Either in the storage room in the office or Tupperware on back counter near the distilled water)
□ Tablespoon for measuring out Sucrose □ 2 Graduated Cylinder to measure distilled water □ 2 bottles of Pure Leaf Tea □ 2 bottles of Gold Peak Tea □ Count out 56 tea bags
Label Glassware + Translucent cups: � Date � Percent sweetened iced tea solution you are making � g/L
Table 1: Preparation for Iced Tea Samples
Iced Tea
Distilled Water (L) Sucrose (g) 3- digit codes for 2-oz cups
117% Sweetened Tea 1.5 175.50 461
76.7% Sweetened Tea* 3.0 230.10 365, 208
61.4% Sweetened Tea 1.5 92.04 764
30.7% Sweetened Tea 1.5 46.02 602
15.3% Sweetened Tea 1.5 23.01 591
0% Sweetened Tea 1.5 0 196
Pure Leaf 968
Gold Peak 803

92
*76.7% Iced tea is doubled because it will be served twice
Procedure for Making Sweetened Iced Tea
1. Measure 750 L of distilled water using a graduated cylinder ( 500 ml + 250 ml) □ Note: if making the 76.7% sweetened Iced Tea use 1.5 L of distilled water
2. Pour into a pot on the stove 3. Bring water to a boil (approximately 5 - 10 minutes) 4. Pour hot water into Pitcher 5. Place 8 of the Lipton decaf tea bags into the pitcher with hot water and allow to
steep for 5 minutes (use timer) □ Note: if making the 76.7% sweetened Iced Tea use 16 bags of tea
6. Add sucrose that matches the sweetened iced tea sample you are 7. Stir until sucrose is dissolved 8. Add the additional 750 mL of distilled water 9. Place Iced tea into Respective Labeled Jar 10. Lid and place in refrigerator until finished with other solutions
Once all iced tea samples are completed pour 30 ml (halfway full in a coded 2-oz cup) Place on a labeled tray with 3-digit code Similarly pour Commercial Iced Tea samples into their respective coded cups

93
Appendix D: Initial taste test SIMS questionnaire Page 1

94

95

96

97

98
Appendix E: Motivation to reduce dietary sugar intake
Email Address: ____________________ Panel ID #: ______________
1. If yes, please indicate which of the following items you are restricting as part of your diet (check all that apply):
☐ Calories ☐ Fat ☐ Carbohydrates ☐ Salt ☐ Sugar
2. Please check the most appropriate box next to each question to rate your motivation to do the following:
Consume a diet lower in calories ☐ Highly motivated ☐ Somewhat motivated ☐ Neither motivated nor unmotivated ☐ Somewhat unmotivated ☐ Not motivated at all Consume a diet lower in fat ☐ Highly motivated ☐ Somewhat motivated ☐ Neither motivated nor unmotivated ☐ Somewhat unmotivated ☐ Not motivated at all Consume a diet lower in sugar ☐ Highly motivated ☐ Somewhat motivated ☐ Neither motivated nor unmotivated ☐ Somewhat unmotivated ☐ Not motivated at all Consume a diet lower in salt ☐ Highly motivated ☐ Somewhat motivated ☐ Neither motivated nor unmotivated ☐ Somewhat unmotivated ☐ Not motivated at all

99
Eat less ‘junk food’ ☐ Highly motivated ☐ Somewhat motivated ☐ Neither motivated nor unmotivated ☐ Somewhat unmotivated ☐ Not motivated at all Eat less fast food ☐ Highly motivated ☐ Somewhat motivated ☐ Neither motivated nor unmotivated ☐ Somewhat unmotivated ☐ Not motivated at all Eat more fruits and vegetables ☐ Highly motivated ☐ Somewhat motivated ☐ Neither motivated nor unmotivated ☐ Somewhat unmotivated ☐ Not motivated at all Eat more organic foods ☐ Highly motivated ☐ Somewhat motivated ☐ Neither motivated nor unmotivated ☐ Somewhat unmotivated ☐ Not motivated at all Eat more whole grains ☐ Highly motivated ☐ Somewhat motivated ☐ Neither motivated nor unmotivated ☐ Somewhat unmotivated ☐ Not motivated at all
Thank you! Once completed please pass the questionnaire through the window to receive payment. Please sign the receipt and pass it through the window before leaving. Thank you for your participation in the iced tea study!

100
Appendix F: Weekly taste test questionnaire
Welcome to the Iced Tea Study! Before drinking your iced tea, please take a moment to answer two questions by marking a line on each scale: How thirsty are you right now?
How much iced tea do you feel like drinking right now?
You may now drink as much of the iced tea as you wish. After drinking the iced tea please answer the questions on the next page by marking a line on each scale: How much do you like the iced tea you just drank? To what extent are you tired of drinking this iced tea?
Not at all tired Extremely tired
Gre
ates
t Pos
sibl
e Li
ke
Like
Ext
rem
ely
Like
Ver
y M
uch
Like
Mod
erat
ely
Like
Slig
htly
Nei
ther
Lik
e N
or D
islik
e
Dis
like
Slig
htly
Dis
like
Mod
erat
ely
Dis
like
Very
Muc
h
Dis
like
Extre
mel
y
Gre
ates
t Pos
sibl
e D
islik
e
Not at all thirsty Extremely thirsty
None A large amount

101
Appendix G: SAS code for the longitudinal taste test
/*Liking ratings: Determining the comparison for liking ratings between the no reduction and gradual reduction groups.*/
proc mixed data=xxx.weeklytasting; class group judge week; model like= group|week /ddfm=kr; random intercept / subject=judge; repeated / subject=judge type=AR(1); LSmeans group week group*week/diff slice=week; ODS output diffs=diffslike; ODS output lsmeans=lsmlike6July; run;
/*Determining thirst, how much iced tea participants feel like drinking, tiredness, and the amount of iced tea consumed by the no reduction and gradual sugar reduction groups (group), week, and group by week */
proc mixed data=xxx.ITST9OCT; class group judge week; model thirsty = group|week / ddfm=kr; random intercept / subject=judge; repeated / subject=judge type=AR(1); LSmeans group|week/ diff slice=week; ODS output diffs=diffsthirst; ODS output lsmeans=lsmthirst4FEB; run;
proc mixed data=xxx.ITST9OCT; class group judge week; model want= group|week / ddfm=kr; random intercept / subject=judge; repeated / subject=judge type=AR(1); LSmeans group|week/ diff slice=week; ODS output diffs=diffswant; ODS output lsmeans=lsmwant4FEB; run;
/*Tiredness ratings: Determining the comparison for tiredness ratings between the no reduction and gradual reduction groups. The AIC was 13583.8*/
proc mixed data=xxx.weeklytasting; class group judge week; model tired = group|week / ddfm=kr; random intercept / subject=judge;

102
repeated / subject=judge type=AR(1); LSmeans group|week/ diff slice=week; ODS output diffs=diffstired; ODS output lsmeans=lsmtired6July;
run; /*Determining the comparison for the amount consumed (ml) between the no reduction and gradual reduction groups covaried with liking. */ proc mixed data=xxx.weeklytasting; class group judge week; model amtconsumedml = group|week like / ddfm=kr; random intercept / subject=judge; repeated / subject=judge type=AR(1); LSmeans group*week / diff slice=week; ODS output diffs=diffscon; ODS output lsmeans=lsmamtcon6July run; /*Determining the comparison for the number of calories consumed between the no reduction and gradual reduction groups covaried with liking.*/ proc mixed data= xxx.weeklytasting; class group judge week; model amt_cal = group|week like / ddfm=kr; random intercept / subject=judge; repeated / subject=judge type=AR(1); LSmeans group*week / diff slice=week; ODS output diffs=diffscallik; ODS output lsmeans=lsmamtcallik6July run; /*Determining the relationship between liking and the amount consumed (ml)*/
proc reg data = xxx.weeklytasting; model like =amtconsumedml; run;

103
Appendix H: SAS code for the initial and final taste tests
/*To determine if the gradual reduction and no reduction group’s lowest acceptable level of sweetness, differed from the initial taste test to the final taste test */ proc mixed data=xxx.acceptableswt;
class group judge tastetest; model lowsweet = group|tastetest/ ddfm=kr; random intercept / subject=judge; LSmeans group tastetest group*tastetest; ODS output lsmeans=lsmeansacceptswt; run; /* To determine if the gradual reduction and no reduction group’s ideal level of sweetness, differed from the initial taste test to the final taste test*/
proc mixed data=xxx.acceptableswt; class group judge tastetest; model idealsweet = group|tastetest/ ddfm=kr; random intercept / subject=judge; LSmeans group tastetest tastetest*group / adjust=Bon adjdfe=row diff; ODS output diffs=dlikett1; ODS output lsmeans=lsmeansidealswt; run;
/* To determine if the gradual reduction and no reduction group’s highest acceotable level of sweetness, differed from the initial taste test to the final taste test*/
proc mixed data=xxx.acceptableswt; class group judge tastetest; model highsweet = group|tastetest/ ddfm=kr; random intercept / subject=judge; LSmeans group tastetest tastetest*group / adjust=Bon adjdfe=row diff slice=group; ODS output diffs=dlikett1; ODS output lsmeans=lsmeanshighswt; run;
/*To determine if there were differences from the initial and final taste tests for overall liking, sweetness, tea flavor, bitterness, and sourness intensity ratings for the Lipton 0%, 1.5%, 3.1%, 6.1%, 7.7%, and 11.7% added sugar teas.*/
proc mixed data=xxx.tastetestall122July; class group judge tastetest added_sugar; model overalllike = group|tastetest|added_sugar/ ddfm=kr; random intercept / subject=judge;

104
LSmeans tastetest added_sugar group tastetest*group tastetest*added_sugar group*added_sugar tastetest*group*added_sugar / diff slice=added_sugar; ODS output diffs=doverall; ODS output lsmeans=lsmeansoverall; run; proc mixed data=xxx.tastetestall122July; class group judge tastetest added_sugar; model sweetintensity = group|tastetest|added_sugar/ ddfm=kr; random intercept / subject=judge; LSmeans tastetest added_sugar group tastetest*group tastetest*added_sugar group*added_sugar tastetest*group*added_sugar / diff slice=added_sugar; ODS output diffs=dswt; ODS output lsmeans=lsmeansswt; run; proc mixed data=xxx.tastetestall122July; class group judge tastetest added_sugar; model teaflavorintensity = group|tastetest|added_sugar/ ddfm=kr; random intercept / subject=judge; LSmeans tastetest added_sugar group tastetest*group tastetest*added_sugar group*added_sugar tastetest*group*added_sugar / diff slice=added_sugar; ODS output diffs=dtea; ODS output lsmeans=lsmeansteaf; run; proc mixed data=xxx.tastetestall122July; class group judge tastetest added_sugar; model bitterintensity = group|tastetest|added_sugar/ ddfm=kr; random intercept / subject=judge; LSmeans tastetest added_sugar group tastetest*group tastetest*added_sugar group*added_sugar tastetest*group*added_sugar / diff slice=added_sugar; ODS output diffs=dbitter; ODS output lsmeans=lsmeansbitt; run; proc mixed data=xxx.tastetestall122July;

105
class group judge tastetest added_sugar; model sournintensity = group|tastetest|added_sugar/ ddfm=kr; random intercept / subject=judge; LSmeans tastetest added_sugar group tastetest*group tastetest*added_sugar group*added_sugar tastetest*group*added_sugar / diff slice=added_sugar; ODS output diffs=dsour; ODS output lsmeans=lsmeansour; run;
/*Overall liking and sweetness intensity comparing the commercial samples with the 7.7% Lipton tea sample*/
proc mixed data=xxx.tastetestall19july; class group judge tastetest teatype; model overalllike = group|tastetest|teatype/ ddfm=kr; random intercept / subject=judge; LSmeans tastetest teatype group tastetest*group tastetest*teatype group*teatype tastetest*group*teatype / adjust=Bon adjdfe=row diff slice=teatype; ODS output diffs=dcomlike; ODS output lsmeans=lsmeanscomlike; run; proc mixed data=xxx.tastetestall19july; class group judge tastetest teatype; model sweetintensity = group|tastetest|teatype/ ddfm=kr; random intercept / subject=judge; LSmeans tastetest teatype group tastetest*group tastetest*teatype group*teatype tastetest*group*teatype / adjust=Bon adjdfe=row diff slice=teatype; ODS output diffs=dcomswt; ODS output lsmeans=lsmeanscomswt; run; proc mixed data=xxx.tastetestall19july; class group judge tastetest teatype; model teaflavorintensity = group|tastetest|teatype/ ddfm=kr; random intercept / subject=judge;

106
LSmeans tastetest teatype group tastetest*group tastetest*teatype group*teatype tastetest*group*teatype / adjust=Bon adjdfe=row diff slice=teatype; ODS output diffs=dcomtea; ODS output lsmeans=lsmeanscomtea; run; proc mixed data=xxx.tastetestall19july; class group judge tastetest teatype; model sournintensity = group|tastetest|teatype/ ddfm=kr; random intercept / subject=judge; LSmeans tastetest teatype group tastetest*group tastetest*teatype group*teatype tastetest*group*teatype / adjust=Bon adjdfe=row diff slice=teatype; ODS output diffs=dcomsour; ODS output lsmeans=lsmeanscomsour; run; proc mixed data=xxx.tastetestall19july; class group judge tastetest teatype; model bitterintensity = group|tastetest|teatype/ ddfm=kr; random intercept / subject=judge; LSmeans tastetest teatype group tastetest*group tastetest*teatype group*teatype tastetest*group*teatype / adjust=Bon adjdfe=row diff slice=teatype; ODS output diffs=dcombit; ODS output lsmeans=lsmeanscombit; run;

107
Appendix J: Calculation of the number of calories consumed
Caloric intake was calculated using the following equation:
There are 4 calories in 1 g of sugar (FDA, 2015). Participants were served 355 ml
of iced tea each week, the no reduction group received 27 grams of sugar per 355 ml of
glass for all 12-weeks. Post-consumption weights were measured in order to determine
how much iced tea participants consumed at the end of each session.
No reduction group (week 1 to week 12) and Gradual reduction groups at week 1
Caloric intake = [(amount consumed (ml)) *27 grams of sugar / 355 ml) * 4 calories/ 1 g)]
Gradual reduction group at week 2
Caloric intake = [(amount consumed (ml)) *24.5 grams of sugar / 355 ml) * 4 calories/ 1
g)]
Caloric intake measurements were reduced by 10% each week.

108
Appendix K: Full unedited comment list from participants when asked about the purpose
of the study during the final taste test Group Comment
No reduction It`s about a marketing research on new flavor of ice tea.To have participants select the best flavor for the ice tea products.
Gradual reduction
The degree to which patientst-victmis-subjects become accustomed to, inurred to various flavor components. I`m convinced you varied sweetness and sourness through teh summer to see if my responses remained cnsuistsent. I`m also convincved this erposnes woudlbe mroe interpretable if tyou had spellc gecker here. I am a louty typist
Gradual reduction relative sweetness, bitterness, of tea and how it affects liking ohea
No reduction Seeing how preferences for ice tea (ice tea flavor, sweetness, bitterness and sour notes) change over time when you are regularily drinking it.
Gradual reduction Whether tea tastes would remain consistent over time - maybe also the difference in liking between being offered a large quantity of tea vs a small sample
Gradual reduction I enjoyed drinking the tea. Most of the time, it tasted like the same moderate tea flavor. I liked the flexibility of showing up too.
No reduction consistancy of my liking of tea
No reduction
The study is very fabulous and practicial, it let me enjoy delicious drinks everyday during summer. Ice tea is my favourite beverage from my childhood, because it is more cooling, and sweeter than the regular red tea. On the other hand, it is healther than the soda.
Gradual reduction
Beverage temperature seemed to be a potential factor, but also none of the beverages actually tasted like tea, just sugar water or occasionally water-water, so I`m guessing it may also have been something to do with sugar, or maybe perceived sweetness since sometimes it tasted more like honey vs other sweeteners.
Gradual reduction How your taste change over a course of time? Gradual reduction What people will do for $5?
Gradual reduction
Ithought the initial taste test was to determine our personal preferences for tea and then the weekly testings were used to see if we would get tired of our tea if we drank it too often. I`m not so sure anymore though, as I felt that the tea I was served changed over time.
No reduction I realized I like sweet tea better but not too sweet. I like teas in general (from hot to cold, sweet to non-sweet) so I enjoyed being part of the study. I think I had the best (ideal for me) ice tea during this study (such as sample #364 today.
Gradual reduction The use of different sweetners. Gradual reduction when we would get tired of drinking iced tea
No reduction Assessing consumers` sensitivity toward various traits. Some consumers are more sensitive toward certain tea profiles (e.g., sweetness) than other profiles (e.g., sourness).

109
Gradual reduction how thirst might affect taste
Gradual reduction They made the study convienent with diff locations. A lot of the teas I received durning the weeks all seemed to be very similar in flavor bitter and no sweetness to them.
No reduction sweetness and strength of tea flavor
No reduction I enjoyed tasting all the different flavors of ice tea. Some were way too sweet, others were very good. I would be interested in knowing how much sugar is in each type of tea.
No reduction how much iced tea one could tolerate in a week(joking) My guess would be: toelrable levels of sweeteness, reducing sugar intake with sweetened non-carbonated beverages
Gradual reduction I think this study was about the amount of sweetner added to the tea and if over time a person would not want to continue to drink the sweetened beverage.
Gradual reduction What people will do for money. How much sugar or sweetness affects people`s decision on what tastes good.
Gradual reduction How satisfied a person is with different levels of sweetness of tea. Gradual reduction I`m not sure, but during the study the tea was often quite weak. No reduction Determining how people like iced tea to taste.
Gradual reduction It seemed like a psychological study or just a study on senses (bitter vs sweet taste) since there was not a major effort made to achieve a good flavor. Sometimes the `tea` just tasted like sugar water.
Gradual reduction I think it has something to do with how much the quantity of sugar affects the amount tea the study group is willing to drink.
No reduction Sensing sweetness levels in tea No reduction No responses
No reduction I have no idea....perhaps to test consistency of responses, to test ability to detect difference between bitter and sour
Gradual reduction The taste of sweet tea, as it applies to sweetness, bitterness and being sour. No reduction Finding ideal levels of the different tastes in ice tea. Gradual reduction I think the study was about the variation of opinions from day to day.
No reduction I think this study was to try and determine the most favorable attribute of iced tea to the majority of people so that `the perfect` iced tea could be designed.
No reduction No responses
No reduction Either sweetener or persistance of study participants due to financial incentive.
No reduction Hmm! I think maybe about developing tolerance/habit to increasing sweetness over time...
Gradual reduction I noticed that the sweetness levels of the iced tea changed over the weeks, so I think the study was to figure out a tester`s ideal level of sweetness, and whether or not testers adapted to higher or lower sweetness levels throughout the study.
No reduction Ideal level of tea sweetness and sourness for most consumers.

110
No reduction This study was about our preferences. Which level of sweetness bittness sourness and ice tea flavor do we like more.
Gradual reduction Attempting to determine the ideal taste qualities in commercial iced tea in a population of participants.
No reduction Ice tea preference based on different combinations of bitterness, sweetness, and tea flavour intensity.