Determining the Critical Path - Ron Winter ConsultingIf you choose to use Total Float to define the...
20
Determining the Actual Critical Path By Ron Winter Ron Winter Consulting LLC January 15, 2004 Abstract: This paper will present an analytical, stepwise method for objectively determining what the CPM schedule says was the critical path for last update period. This procedure is simple enough to be applied by any competent Scheduler using the schedule and scheduling software normally used and a spreadsheet for taking interim and final notes. This ‘manual’ method is applicable for small to middle-size schedules over a monthly update period. The method presented here will answer the simplest, most basic piece of information every Scheduler should obtain with a schedule update; “What activities were actually on the Critical Path last update period?” A sample project is used to demonstrate the process directly. This manual process is the basis for the operation of the automated software tool called, “As- Built Critical Path” in the SA Pro software series. Introduction The simplest, most basic piece of information every Scheduler should obtain with a schedule update is, “What activities were actually on the Critical Path last update period?” This information goes to the heart of whether delays were ‘Project Delays,’ extending the total project duration or merely using up available float. Project Delays will have to be accounted for. If the Owner was responsible for the Project Delay, then this might require a contract extension and/or Extended Overhead costs. If the Contractor was responsible, then potential Liquidated Damages will be considered if the project is not accelerated. This simple list of actual critical activities for the past update period is almost never accumulated until after the project is complete. In many cases, this list is a ‘smoking gun’ just waiting for discovery. The problem is that Schedulers are not taught how to determine this fact. Perhaps no one is ‘taught.’ This information is derived by Delay Analysts who are in many ways, self-taught after years of experience. The techniques used are varied and not well documented. Not surprisingly, sometimes the results of two different Analysts over the same material do not exactly match. What is needed is a precise, procedural method for determining the actual critical path of a schedule using the As-Built schedule and actual start and finish dates.
-
Upload
vuongkhanh -
Category
Documents
-
view
218 -
download
3
Transcript of Determining the Critical Path - Ron Winter ConsultingIf you choose to use Total Float to define the...
Determining the Actual Critical Path
By Ron Winter Ron Winter Consulting LLC
January 15, 2004 Abstract: This paper will present an analytical, stepwise method for objectively determining what the CPM schedule says was the critical path for last update period. This procedure is simple enough to be applied by any competent Scheduler using the schedule and scheduling software normally used and a spreadsheet for taking interim and final notes. This ‘manual’ method is applicable for small to middle-size schedules over a monthly update period. The method presented here will answer the simplest, most basic piece of information every Scheduler should obtain with a schedule update; “What activities were actually on the Critical Path last update period?” A sample project is used to demonstrate the process directly. This manual process is the basis for the operation of the automated software tool called, “As-Built Critical Path” in the SA Pro software series.
Introduction The simplest, most basic piece of information every Scheduler should obtain with a schedule update is, “What activities were actually on the Critical Path last update period?” This information goes to the heart of whether delays were ‘Project Delays,’ extending the total project duration or merely using up available float. Project Delays will have to be accounted for. If the Owner was responsible for the Project Delay, then this might require a contract extension and/or Extended Overhead costs. If the Contractor was responsible, then potential Liquidated Damages will be considered if the project is not accelerated. This simple list of actual critical activities for the past update period is almost never accumulated until after the project is complete. In many cases, this list is a ‘smoking gun’ just waiting for discovery. The problem is that Schedulers are not taught how to determine this fact. Perhaps no one is ‘taught.’ This information is derived by Delay Analysts who are in many ways, self-taught after years of experience. The techniques used are varied and not well documented. Not surprisingly, sometimes the results of two different Analysts over the same material do not exactly match. What is needed is a precise, procedural method for determining the actual critical path of a schedule using the As-Built schedule and actual start and finish dates.

This method should be accurate and the results replicatable. This should be an analytical analysis requiring no subjective decisions. This paper will present an analytical, stepwise method for objectively determining what the CPM schedule says was the critical path for last period. This is not a quick procedure, but for normal-sized schedules of 500 activities and over a limited period of one month, this procedure should not take more than one hour to accomplish. If you don’t have an hour to dedicate to the question of, “What was critical last month?” then perhaps you are too busy. Why is it so hard to determine what the actual critical path was? The problem lies with the fact that completed activities do not have float. Once an activity is 100% complete, there is no way to compute the float for that activity. Planned activities in the future have early start and early finish dates, and thus we can compute their float values. Kenji Hoshino has proposed a simple [1] look-ahead method using planned activity float. He proposes that non-delay claims experts can use the predicted critical path from each successive update period and sort of ‘paste each period together’ to create a montage of predicted critical paths. He says that this method is a simple and easy way to estimate the actual critical path for the entire project. This may be a good approximation of the actual critical path, but this technique only explains what was supposed to happen, not what actually did happen. Basing each update period on what was predicted to happen in the upcoming period may produce the correct results, but it may not as well. If things always went as expected, then delay analysis would not be as difficult a task as it really is. What we need is an accurate, guaranteed method of determining what the actual critical path was for the past period.
A Simple Algorithm Over the years, I have developed and perfected a technique for determining the actual critical path of any CPM schedule. It does not require intuition or advanced mathematics. (Well, actually it does use advanced mathematics but it leaves all of that to the CPM software to do.) All that is needed is A CPM schedule, the computer and software to read the schedule and compute the CPM for you and perhaps a spreadsheet program to tabulate your steps and results. The theory behind this algorithm is the most basic tenet of CPM, namely
“You only really know the actual criticality of any activity on the data date of the schedule.”

Any criticality information for activities that finished before the data date is lost as they do not show any total float. Any knowledge of the actual criticality of activities that are scheduled to occur after the data date is only a guess because the future is unknown; things may change from planned. But on the actual date that the status was taken (the ‘data date’,) we are as sure as we will ever will be of what activities were on the critical path. So our algorithm will make use of this fact. We will adjust the status of every activity in the schedule and move the data date backwards one step at a time. We will then recompute the CPM (actually we will leave this to the computer to do) and then look to see what activities were on the critical path for that date. When we have stepped backwards in time to the data date of the previous schedule update, we will quit the process and summarize our findings. In reality, there are a few more issues to be considered. Our analysis will take place in 5 distinct steps,
Step 1 – Normalization, Step 2 – Set up the Initial Conditions, Step 3 – List all Activities to be Destatused, Step 4 – Stepwise Destatusing of the Schedule, Step 5 – Summarize the Results.
The word, “Destatus” is used here to denote the procedure that is the opposite of adding status to a schedule. It refers to the practice of removing status from selected activities and moving the data date of the schedule to an earlier time period to match the change in status. I have used the software program Primavera Project Planner (P3) to perform the CPM calculations required. I also used P3 to produce the reports that I needed to provide me with the specific activity information required. An Excel spreadsheet was used to hold the completed work list and final results.
Step 1 – Normalization. In Engineering Studies, we use the term “Normalization” to identify the work necessary to prepare your data for analysis. Kenji Hoshino [1] calls the step, “Schedule Rectification”. The dictionary defines rectification as,
rec-ti-fy: to put right, to set right by computation and mechanical adjustment.
Mr. Hoshino listed the following steps as appropriate for schedule rectification,

1. Remove unnecessary constraints to include
Redundant, project-wide constraints Purely preferential start constraints Purely preferential finish constraints Float constraints (Zero Free Float & Zero Total Float)
2. Minimize the use of multiple calendars
Check for holidays and other non-work days
3. Revise anomalous lags
FS lag larger that the threshold duration used for near-critical. SS lag larger than the predecessor duration FF lag larger than the successor duration SF lag larger than the successor & predecessor durations
combined FS negative lag whose absolute value is greater than the
predecessor’s Normalization can include converting the data so that it is all in the same units of measure. Sometimes, normalization means removing extraneous data that does not pertain to the study or would hinder analysis. In our case, normalization refers to removing extraneous activity constraints. First make a working copy of your schedule and remove the constraints. Only those constraints specifically called out in the contract should be left in the schedule to be analyzed. Constraints left in your schedule must be justified by specific passages in your contract. Any constraint left in the schedule during the upcoming analysis can cause your entire analysis to be invalidated, should a ruling body deny the reasonableness of its inclusion. Any constraints left in your schedule during analysis should also be as non-restrictive as possible. Let me list some examples.
Does your contract state, “Under all conditions and under any eventuality including the consideration of cause and effect, a certain (named) event will complete not before and not after a certain, specified date”? If not, do not use Mandatory Constraints because that is what they mean. Does you contract penalize finishing a specified event early in the same way that it specifies that you may not finish it late? If not, then do not use a Start On or Finish On Constraint.

Under most rational contract conditions, if you leave a constraint in your analysis schedule, it should be a Start-No-Earlier-Than or a Finish-No-Later-Than constraint, as appropriate. You should also delete any Zero Free Float and Zero Total Float constraints as well. The analysis will clearly be affected by such constraints. Be prepared to formally document why you left each constraint in your analysis schedule. Under no circumstances should any Expected Finish constraints be left in the schedule. This is true even if the activity is complete and the Expected Finish constraint is no longer active. As we destatus the schedule, the activity may become active and this constraint could seriously throw-off our findings. The P3 report Selection Criteria for this report would be for all of the following conditions to be true,
Constraint NE (blank) Constraint NE Start milestone Constraint NE Finish milestone Constraint NE Hammock activity
Keep the Constraints Report to document your modifications to the working schedule.
[Figure 1 – Constraints Report] In addition to deleting constraints, we need to document the current CPM computation settings of your working schedule. At this point, some Analysts would state that you should not change any CPM settings but just document and use the current settings. Other Analysts would argue that any analysis is meaningless unless you use meaningful CPM settings. (I suspect that some Analysts perform their analysis both ways and use the one that gives them the ‘best’ answer.) The CPM settings that must be set/documented are as follows:
• Retained Logic or Logic Override (‘Retained Logic’ gives the most meaningful answer,)
• Interruptible or Continuous Activities (the ‘correct’ setting depends upon how the job was worked,)
• Define critical path using Total Float or Longest Path.
----- ----- ---- ---- - --- ---------- ------------------------------------------------ -------- -------- ACTIVITY ORIG REM ACTIVITY DESCRIPTION SCHEDULED ID DUR DUR CAL % START FINISH ----- ----- ---- ---- - --- ---------- ------------------------------------------------ -------- -------- 19160 10 10 2 0 CREEK DIVERSION & DEWATER 15APR99* 24APR99 CONSTRAINT 15APR99

If you choose to use Total Float to define the critical path, then you need to document the following settings,
• Define Total Float using early dates, late dates, or the worse case, • Define the critical path as any activity with zero or lower total float or just
having the lowest total float value. I personally recommend that if you change any settings, that you use Retained Logic, Interruptible Activities, and Longest Path. Regardless of your decisions, you should document the settings that you used in your analysis. An easy way to document these settings is to ‘take a picture of it.’ To do this, bring-up the P3 schedule CPM settings by selecting “Tools / Schedule / Options.” With the General Tab selected, hold down the ‘Alt’ key and press the “Print Screen” button. This will capture the picture to the Windows Clipboard. Now, open up your work processor, click where you want to place the picture and then select “Edit /Paste”. The picture should look like the following,
[Figure 2 – CPM Calculation Options]
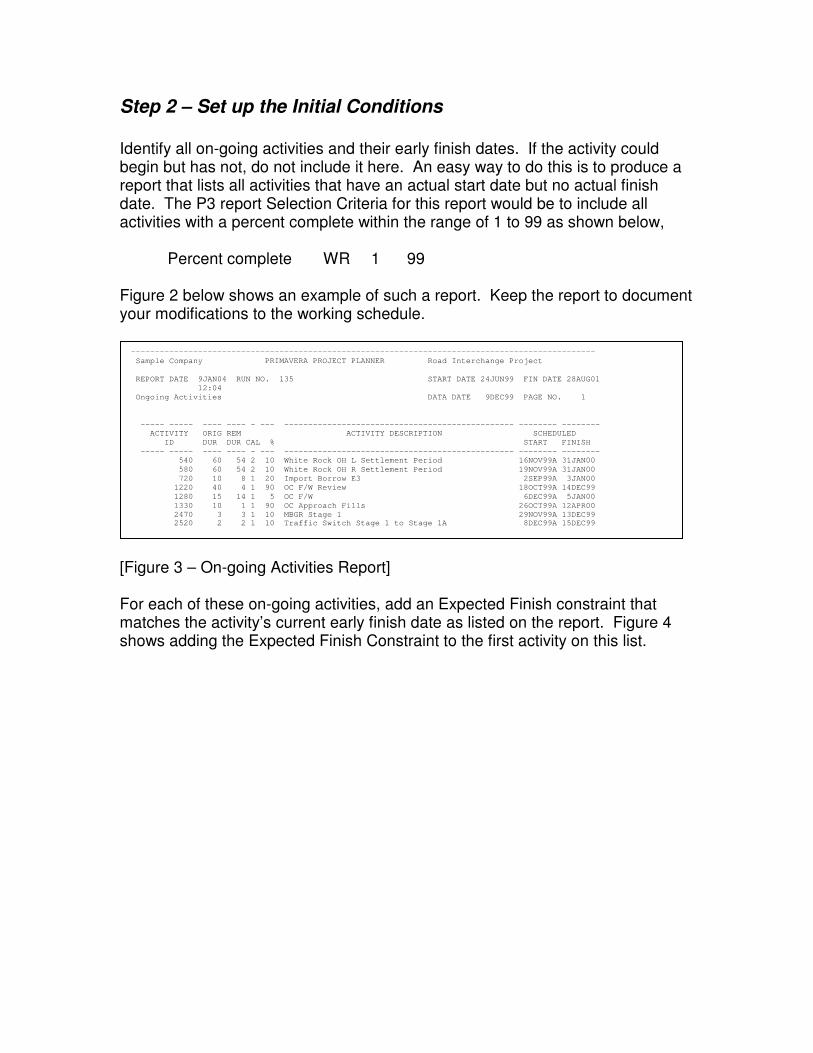
Step 2 – Set up the Initial Conditions Identify all on-going activities and their early finish dates. If the activity could begin but has not, do not include it here. An easy way to do this is to produce a report that lists all activities that have an actual start date but no actual finish date. The P3 report Selection Criteria for this report would be to include all activities with a percent complete within the range of 1 to 99 as shown below,
Percent complete WR 1 99 Figure 2 below shows an example of such a report. Keep the report to document your modifications to the working schedule.
[Figure 3 – On-going Activities Report] For each of these on-going activities, add an Expected Finish constraint that matches the activity’s current early finish date as listed on the report. Figure 4 shows adding the Expected Finish Constraint to the first activity on this list.
------------------------------------------------------------------------------------------------- Sample Company PRIMAVERA PROJECT PLANNER Road Interchange Project REPORT DATE 9JAN04 RUN NO. 135 START DATE 24JUN99 FIN DATE 28AUG01 12:04 Ongoing Activities DATA DATE 9DEC99 PAGE NO. 1 ----- ----- ---- ---- - --- ------------------------------------------------ -------- -------- ACTIVITY ORIG REM ACTIVITY DESCRIPTION SCHEDULED ID DUR DUR CAL % START FINISH ----- ----- ---- ---- - --- ------------------------------------------------ -------- -------- 540 60 54 2 10 White Rock OH L Settlement Period 16NOV99A 31JAN00 580 60 54 2 10 White Rock OH R Settlement Period 19NOV99A 31JAN00 720 10 8 1 20 Import Borrow E3 2SEP99A 3JAN00 1220 40 4 1 90 OC F/W Review 18OCT99A 14DEC99 1280 15 14 1 5 OC F/W 6DEC99A 5JAN00 1330 10 1 1 90 OC Approach Fills 26OCT99A 12APR00 2470 3 3 1 10 MBGR Stage 1 29NOV99A 13DEC99 2520 2 2 1 10 Traffic Switch Stage 1 to Stage 1A 8DEC99A 15DEC99

[Figure 4 – Add Expected Finish Constraints]
Step 3 – List all Activities to be Destatused. Now get a list of all activities that are active now or had an actual start of completion last update period. Our example uses the update period of 10NOV99 through 10DEC99. The P3 report Selection Criteria for this report would be to include all activities as shown below,
Percent complete WR 1 99 Actual finish GT 09NOV99
Figure 3 below shows an example of such a report. Keep the report to document your modifications to the working schedule.

[Figure 3 – Activities Active 10NOV99 – 09DEC99] Now, you are able to create your spreadsheet work list. Using the above list, make a list of all dates in the update period (including the data date) in the first column of your spreadsheet. Next to each date, list the Activity ID of any activity that had an actual start on that date. In the next column, list the Activity ID of any activity that had an actual finish on that date. Label the fourth column “Critical and Active”. This is where we will document the current critical activity for that date. Figure 4 below shows an example of such a report. Keep this spreadsheet open on your computer as you run your analysis. It will direct your actions and you will place your results here as well.
------------------------------------------------------------------------------------------------- Sample Company PRIMAVERA PROJECT PLANNER Road Interchange Project REPORT DATE 8JAN04 RUN NO. 136 START DATE 24JUN99 FIN DATE 28AUG01 9:52 Activities Active 10NOV99 - 09DEC99 DATA DATE 9DEC99 PAGE NO. 1 ----- ----- ---- ---- - --- ------------------------------------------------ -------- -------- ACTIVITY ORIG REM ACTIVITY DESCRIPTION SCHEDULED ID DUR DUR % START FINISH ----- ----- ---- ---- - --- ------------------------------------------------ -------- -------- 530 1 0 100 White Rock OH L Release F/W 16NOV99A 16NOV99A 540 60 54 10 White Rock OH L Settlement Period 16NOV99A 31JAN00 560 15 0 100 White Rock OH R Deck 15OCT99A 15NOV99A 570 1 0 100 White Rock OH R Release F/W 19NOV99A 19NOV99A 580 60 54 10 White Rock OH R Settlement Period 19NOV99A 31JAN00 590 7 0 100 White Rock OH L&R Approach Slabs Stage 1 10NOV99A 24NOV99A 600 6 0 100 White Rock OH L&R Rails 11NOV99A 26NOV99A 720 10 8 20 Import Borrow E3 2SEP99A 3JAN00 940 5 0 100 Road Ex AM14 77+04 to 14 82+71 Rt 3NOV99A 23NOV99A 1220 40 4 90 OC F/W Review 18OCT99A 14DEC99 1260 15 0 100 OC Abutments 19SEP99A 1DEC99A 1270 12 0 100 OC Columns 29OCT99A 1DEC99A 1280 15 14 5 OC F/W 6DEC99A 5JAN00 1330 10 1 90 OC Approach Fills 26OCT99A 12APR00 1390 1 0 100 Pick up Stage 1 K-Rail OC 26OCT99A 10NOV99A 1400 1 0 100 Set Stage 2 K-Rail OC 26OCT99A 10NOV99A 1970 20 20 2 Signals Underground E @ E2 12JAN00 8FEB00 2360 4 0 100 Structure Backfill OH Abut 9NOV99A 11NOV99A 2470 3 3 10 MBGR Stage 1 29NOV99A 13DEC99 2480 1 0 100 AC Dike Stage 1 29NOV99A 29NOV99A 2490 2 0 100 Striping & Markers Stage 1 21NOV99A 6DEC99A 2510 2 0 100 Roadside Signs Stage 1 2DEC99A 8DEC99A 2520 2 2 10 Traffic Switch Stage 1 to Stage 1A 8DEC99A 15DEC99

[Figure 4 – Initial Spreadsheet Worksheet]
Step 4 – Stepwise Destatusing of the Schedule We are now ready to repeat the interactive process to determine the actual critical path. There are six steps that must be performed in sequence for each date in question. Once the six steps are performed, you start over again until you run out of dates.

Step 4a – Identify the current, active critical activities. You now need to look at your schedule and identify the activity or activities that are active (already started or could start but have not) and critical (depending on your definition of critical path.) Defining your definition of the critical path is a very important step and must not be changed part-way through your analysis. You could decide to include all activities with negative total float. In my opinion, this is a poor choice as it may include less-critical items than project-critical and it may not select any activities at all. You may want to include only those activities with the lowest total float value. This is the common definition but sometimes ‘fails’ when activities have different calendars, interruptible activities, or constraints. You may wish to use Longest Path as the determination of As-Built Criticality. This is my normal choice although some argue that it is incomplete as it does include forward-constraints but does not consider backward-constraints. Remember, we are only going to list the current (active) critical activity, not the entire list of all critical activities. This list will not include any activities that have finished before the data date and will not include any activities on the critical path that have not started as yet unless there is no logical reason why they haven’t started. The fourth column will list all activities that are on the critical or longest path that are in-progress or that have no outstanding predecessors preventing them from starting. If you filter for Longest Path/Total Float and then sort by early start you should be able to just look at your schedule on the screen and determine this information. Refer to Figure 5 for such an example.

[Figure 5 – Schedule showing Longest Path sorted by Early Start] We place the Activity IDs of those activities in the fourth column of our spreadsheet across from the current data date. In this example, the current and critical activity is Activities 2470. See Figure 6.

[Figure 6 – Critical & Active] Initially, your schedule shows the status as of the original data date of your schedule. Later in this analysis, the data date and activity status will have been adjusted and new information should appear.
Step 4b – Choose Your Next Data Date We do not destatus the schedule at this point; we merely choose what date we will use for our next data date. You can decide to be thorough and just choose the date one day earlier than the current data date. If you do this, be prepared for some odd results when you compute the critical path on weekends and holidays. This is due to the fact that critical working-day calendar activities may be inactive on weekends, leaving the critical path work to less critical activities using 7-days per week calendars.

I have found that a modified approach works well here and speeds up the process. It is reasonable to assume that if no activity had an actual start or actual finish on any given date, that the critical path could not have changed and that it is safe to skip that date and look for the next earliest date that contains an actual date. This assumption is not absolutely accurate but only for some really rare cases. Referring to our example spreadsheet, the next earlier actual date is an Actual Finish on 8DEC99, so we will move the data date back one day to 8DEC99.
Step 4c – Remove Actual Finish Dates For the new data date selected, look in the third column of your spreadsheet to see if any activities are listed there with Actual Finish dates for that date. If so, manually look-up those activities in your work schedule (see Figure 7.)
[Figure 7 – Activity 2510] First we remove the actual finish indicator for this activity. In place of the Actual Finish date, add an Expected Finish constraint to each activity with that finish date as the Expected Finish Date. This is made easier to do because P3 automatically puts the current early finish date in the Expected Finish box for you. Click on the OK button. See Figure 8.

[Figure 8 – AS removed and XF Added]
Step 4d – Change and Recompute the CPM Recompute the CPM schedule using the new data date chosen. Press the F9 key, enter the new date (8DEC99) and press the Schedule Now button as shown in Figure 9.
[Figure 9 – Recompute the CPM using the New Date] You only need to do this computation so that the program will recompute the new remaining duration at this time. You will not be using the other results of the CPM calculation at this point.

Step 4e – Remove Actual Start Dates For the new data date selected, look in the second column of your spreadsheet to see if any activities are listed there with Actual Start dates for that date. If so, manually look-up those activities in your work schedule and remove their actual start indicators. Figure 10 shows the actual start date for Activity 2520 that must be removed.
[Figure 10 – Remove Actual Starts] Also remove any Expected Finish constraints for that activity. This is very important. Up to now, we have been maintaining the actual finish date as the early finish date. At this point, all actual work has been realized. From now on, this finish date will remain the same number of workdays from the early start date. If the early start date ‘drifts’ backward in time, then so should he early finish date. Our example does not have an Expected Finish constraint to remove this time. Later, we will see this. Once complete, click on the OK button like in Figure 11.
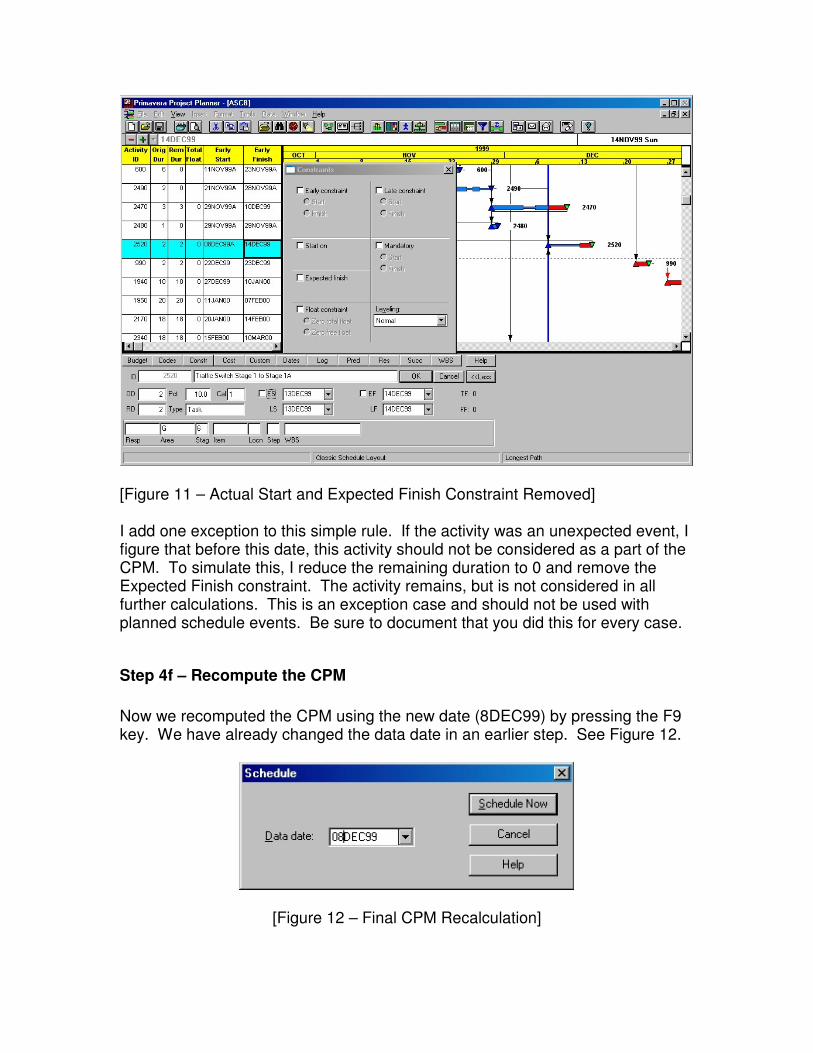
[Figure 11 – Actual Start and Expected Finish Constraint Removed] I add one exception to this simple rule. If the activity was an unexpected event, I figure that before this date, this activity should not be considered as a part of the CPM. To simulate this, I reduce the remaining duration to 0 and remove the Expected Finish constraint. The activity remains, but is not considered in all further calculations. This is an exception case and should not be used with planned schedule events. Be sure to document that you did this for every case.
Step 4f – Recompute the CPM Now we recomputed the CPM using the new date (8DEC99) by pressing the F9 key. We have already changed the data date in an earlier step. See Figure 12.
[Figure 12 – Final CPM Recalculation]

Re-run the Longest Path filter to make sure that all new activities are captured. Figure 13 shows us doing this function.
[Figure 13 – Re-run the Filter] We have finished the first iteration and must go back to Step 4a to continue. End this process after you have reached the top of your spreadsheet chart.
Step 5 – Summarize the Results Once complete, you will have a list of activities that were on the As-Built critical path. See Figure 14 for the completed spreadsheet.

[Figure 14 – Completed Spreadsheet] Now we need to summarize this information and make it more readable. Starting at the bottom of the fourth column of the spreadsheet, look upward to a point where the list changes. Figure 15 shows my summary of the As-Built Critical Path for the time period of 10NOV99 through 9DEC99.
For the time period of 9DEC99 through 27NOV99 the following was critical and active, Activity 2470. For the time period of 26NOV99 through 12NOV99 the following were critical and active, Activity 600. For the time period of 11NOV99 through 10NOV99 the following were critical and active, Activity 560.

[Figure 15 – As-Built Critical Path Summary]
Reality Check Does this technique guarantee that the activities identified as being on the critical path were actually, in reality on the critical path last update period? No, it only identifies the activities that the schedule says were on the critical path. The schedule may be incorrect. The original logic may have been faulty or the work plan changed for that which was planned. It may have missed important new events that occurred but were not added. The status may have been entered incorrectly. These are all things that a professional Delay Analyst would look for to validate the schedule. No algorithm is going to tell you more than what the schedule knows to be facts. But this isn’t the point to be made here. It is terribly important that given any particular schedule, that the user be able to determine what the schedule says was on the critical path, and to be able to do so in a repeatable, scientific analysis that yields the same, defensible results every time it is used. Besides, in most cases the original CPM schedule is used unaltered by both sides of the dispute. The Contractor’s Analysts use the schedule unaltered because the Contractor has already certified its correctness and to change things now might weaken instead of strengthen the case. The Owner’s Analysts tend to use the unaltered schedule because it is then a common base of reference that won’t be questioned by the other side (you can’t complain about your own schedule.) Every change made to the schedule by the Owner’s Analyst will be held up to scrutiny and possible rejection by the court. Rejection of a change could cause the entire analysis to be rejected.
Conclusion I have just described to you how anyone with a scheduling program can ‘manually’ destatus a CPM schedule and reveal the actual critical path over any update period. This procedure works on any schedule and requires no special training other than following the procedures listed here. It is the only method known to devise the actual critical path using a simple stepwise procedure. Footnotes [1] Hoshino. “Catching the Elusive As-Built Critical Path,” by Kenji P. Hoshino. 46th Annual Meeting of AACE International at Portland, June 25, 2002, CDR.08.