Determining the Correlation Between Hemoglobin Levels and ...
39
Cedarville University DigitalCommons@Cedarville Master of Science in Nursing eses School of Nursing 8-2014 Determining the Correlation Between Hemoglobin Levels and the Quality of Life of Adolecents and Young Adults on Hemodialysis: A Descriptive Correlational Study Carlisa Waldman Cedarville University, [email protected] Follow this and additional works at: hp://digitalcommons.cedarville.edu/nursing_theses Part of the Nursing Commons is esis is brought to you for free and open access by DigitalCommons@Cedarville, a service of the Centennial Library. It has been accepted for inclusion in Master of Science in Nursing eses by an authorized administrator of DigitalCommons@Cedarville. For more information, please contact [email protected]. Recommended Citation Waldman, Carlisa, "Determining the Correlation Between Hemoglobin Levels and the Quality of Life of Adolecents and Young Adults on Hemodialysis: A Descriptive Correlational Study" (2014). Master of Science in Nursing eses. 11. hp://digitalcommons.cedarville.edu/nursing_theses/11
Transcript of Determining the Correlation Between Hemoglobin Levels and ...

Cedarville UniversityDigitalCommons@Cedarville
Master of Science in Nursing Theses School of Nursing
8-2014
Determining the Correlation BetweenHemoglobin Levels and the Quality of Life ofAdolecents and Young Adults on Hemodialysis: ADescriptive Correlational StudyCarlisa WaldmanCedarville University, [email protected]
Follow this and additional works at: http://digitalcommons.cedarville.edu/nursing_theses
Part of the Nursing Commons
This Thesis is brought to you for free and open access byDigitalCommons@Cedarville, a service of the Centennial Library. It hasbeen accepted for inclusion in Master of Science in Nursing Theses by anauthorized administrator of DigitalCommons@Cedarville. For moreinformation, please contact [email protected].
Recommended CitationWaldman, Carlisa, "Determining the Correlation Between Hemoglobin Levels and the Quality of Life of Adolecents and Young Adultson Hemodialysis: A Descriptive Correlational Study" (2014). Master of Science in Nursing Theses. 11.http://digitalcommons.cedarville.edu/nursing_theses/11

DETERMINING THE CORRELATION BETWEEN HEMOGLOBIN LEVELS AND
THE QUALITY OF LIFE OF ADOLECENTS AND YOUNG ADULTS ON
HEMODIALYSIS: A DESCRIPTIVE CORRELATIONAL STUDY.
A thesis submitted in partial fulfillment
of the requirements for the degree of
Master of Science in Nursing
By
CARLISA WALDMAN
A.D.N. The Christ College of Nursing and Health Sciences, 2008
B.S.N. University of Cincinnati, 2011
2014
Cedarville University

iii
Abstract
Background: End stage renal disease is a permanent condition where the kidneys are
unable to function at a level acceptable to sustain life. Dialysis or kidney transplantation
are some of the treatments available to maintain patients’ health and well-being. The
prevalence of adolescent and young adult patients living with end stage renal disease
(ESRD) is increasing. According to the United States Renal Data System (2013), there are
over 7,500 patients ages 19 years or younger with ESRD. More than 1,400 of these
patients are receiving hemodialysis, this is a national increase of 10.1% for this age group
from 2000 (USRDS, 2013). According to Network #9 (Ohio, Indiana, and Kentucky) of
The Renal Network (2013), in 2012 there was 138 patients newly diagnosed with ESRD
aged 0-24 years. Network #9 also reports 346 ESRD disease patients receiving
hemodialysis as treatment for their disease. Many factors such as anemia, fatigue, and
treatments have been studied and identified as having an impact on quality of life in
adults. But these factors have not been studied in relation to ESRD and its treatment and
the impact on an adolescent’s and young adults’ quality of life (QOL). One of these
factors is anemia identified as decreased hemoglobin levels. Decreased hemoglobin levels
have been associated with decreased energy level and fatigue which can affect quality of
life. Exploring hemoglobin levels and their effect on the quality of life of adolescents and
young adults is important, as adolescence is a stressful time regardless of health status.
Objective: The purpose of this study was to explore how the quality of life of adolescents
and young adults (age 13-23) receiving hemodialysis for treatment of end stage renal
disease have been affected by their disease and treatment. This research study sought to
examine the correlation between hemoglobin levels during treatment and patients’
perceived fatigue levels and quality of life. The research question which was being asked

iv
was: Do higher hemoglobin levels correspond to a perceived higher quality of life in
adolescents and young adults?
Method: The PedsQLTM
End Stage Renal Disease Module version 3 Teen Report
questionnaire was used to evaluate the perceived QOL of those patients receiving
hemodialysis at Cincinnati Children’s Hospital Medical Center (CCHMC). A retrospective
audit of questionnaires and hemoglobin levels was completed on patients between the ages
of 13-23 from October 1, 2011 to September 30, 2013. Means and standard deviations
were obtained on hemoglobin levels, fatigue scores and quality of life scores. A Pearson’s
R coefficient was used to determine if a correlation exists between hemoglobin levels and
a patient’s perceived QOL.
Relevance: Understanding quality of life and factors influencing QOL is relevant to
nurses and other practitioners in order to provide holistic care to their patients. Nurses
need to understand the common factors and then assess each individual to determine if
these factors exist for their patients. In this way the nurse can address these factors and
implement strategies to help improve their patients QOL while they are undergoing
hemodialysis for their ESRD.

v
Table of Contents
Page
List of figures vi
List of tables vii
Chapters
1 Introduction and Literature Review 1
2 Theoretical Model 7
3 Methodology 11
4 Results 15
5 Discussion 19
Appendix
A Letter of research support 24
B Cedarville IRB approval 25
C CCHMC IRB approval 26
D PedsQLTM
questionnaire 29

vi
List of Figures
Page
Figure 1 Conceptual model of health-related quality of life. 8

vii
List of Tables
Page
Table 1 Gender of participants 15
Table 2 Age of participants 15
Table 3 Attrition 16
Table 4 PedsQLTM
total score and hemoglobin level correlation 16
Table 5 General Fatigue sub score and hemoglobin level correlation 17

1
Chapter 1- Introduction and Literature Review
Introduction
Chronic renal disease is a progressive and irreversible reduction of renal function
in which kidneys are unable to keep metabolic and fluid balance in the body, (National
Kidney Foundation, 2013). Patients with end stage renal disease (ESRD) need many forms
of treatment and at some time in their disease progress may eventually need renal
replacement therapy. Choices for renal replacement therapy include kidney
transplantation, hemodialysis or peritoneal dialysis. Of these therapies, hemodialysis is the
most commonly used. Both the disease process and the renal replacement therapy can
have an effect on the patient’s quality of life.
According to the United States Renal Data System (2013), there are over 7,500
patients ages 19 years or younger with ESRD. More than 1,400 of these patient are
receiving hemodialysis, this is a national increase of 10.1% for this age group from 2000
(USRDS, 2013). The Renal Network is a national not-for-profit organization which
monitors quality of dialysis care. Network 9 monitors states of Indiana, Kentucky, and
Ohio. The Renal Network reports that in Network 9 there has been an increase of 138
patients, aged 0-24, newly diagnosed with Chronic End Stage Renal Disease in 2012.
Network 9 also report 346 patients aged 0-24 are receiving hemodialysis as treatment for
their disease.
The impact of ESRD and its treatment on an adolescent’s and young adults’ quality
of life (QOL) has not been well studied. Exploring the responses of adolescents is
important, as adolescence is a stressful time regardless of health status, due to the changes
which are occurring with physical maturation, brain development, increased peer
interactions and drive for independence (Casey, Jones, Levita, Libby, Pattwell, Ruberry,

2
Soliman, & Somerville, 2010). While QOL has been studied in the adult population
receiving hemodialysis little has been done in the area of adolescents and young adults.
Due to an increasing number of adolescents and young adults with ESRD who are
receiving hemodialysis issues of QOL need to be evaluated. The purpose of this study was
to begin to fill this gap by focusing on the adolescent and young adult population.
An individual whose life is dependent on hemodialysis may have their whole life
situation disrupted because of frequent trips to the dialysis unit for maintenance
hemodialysis, frequent laboratory procedures, dietary restrictions and medication therapy
(Clarkson & Robinson, 2010). These factors may also cause many concerns and stress for
adolescents and young adults (Baskale & Baser, 2011). Baskale and Baser also identify
“physical activity limitations because of fatigue” (2011, p. 420). One of the contributing
factors to fatigue may be anemia or decreased hemoglobin levels. Ziegert, Fridlund, &
Lindell (2009) noted the time restrictions are a common concern because of the travel time
to and from the dialysis unit and time spent on the dialysis machine, which can be 3 to 4
hours for each treatment, 3 to 4 times per week.
The purpose of this research study was to determine the impact the disease process
and treatment may play on the quality of life of adolescents and young adult patients living
with end stage renal disease. This was to be accomplished by evaluating hemoglobin
levels and patients reported fatigue and quality of life and determining any possible
correlations. It is hoped by understanding adolescents’ and young adults perceptions, this
information can help nurses to provide care which contributes to the improvement of their
quality of life.

3
Literature review
A literature review was conducted using CINHAL, Cochrane and Medline. Peer
reviewed articles within the last 10 years were included. Key search words included
hemodialysis, dialysis, renal replacement therapy, end stage renal disease, chronic kidney
disease, adolescents, and quality of life.
Incidence and Prevalence
According to the United States Renal Data System (2012) the five year survival
rate is 34% for individuals on hemodialysis. According to DaVita (2014), hemodialysis is
the process of mechanically cleaning the blood. The blood is removed from the body, via a
central venous catheter or vascular access, and circulated through a dialyzer. During this
process, the blood is filtered through a semi-permeable membrane which removes waste
products and excess fluid, and electrolytes are balanced. The clean blood is then return to
the body. Other potential treatments for ESRD include peritoneal dialysis and kidney
transplantation. Kidney transplantation offers patients with end stage renal disease the
“greatest potential for increased longevity and enhance quality of life” (Griva, 2012, p.
813). Yet many patients do not qualify for transplantation due to recent cancer, untreatable
heart disease or psychiatric illness, active substance abuse or compliance with current
dialysis treatments (Barnes-Jewish, 2014).
There is evidence in the literature which shows living with a chronic and life
threatening illness impacts one’s quality of life (Schick Makaroff, 2012). One of the
common themes in the literature related to ESRD is living with the restrictions which
accompany kidney failure (Clarkson & Robinson, 2010, Bayhakki & Hattakit, 2012 &
Kastouni, Sarantopoulou & Alivanis, 2010). Restrictions focus on time required for
dialysis, restrictions on diet and fluids, dependence on caregivers, inability to go to school,

4
work, or travel and medical costs. These restrictions have been noted as being associated
with a lower quality of life in adults. Griva (2012) acknowledges these restrictions were
used to sustain life and maintain optimal health to provide the patient with the best chance
at receiving kidney transplantation. Hagren, Pettersen, Lutzen & Clyne (2005) stated that
“suffering was related to the sense of loss of freedom, dependence on the hemodialysis
machine as a life-line, and reliance on caregivers” (p. 295). Schick Makaroff (2012)
acknowledges many chronic illnesses can cause fatigue and this is not exclusive to ESRD.
In addition to chronic illnesses, there are many other causes of fatigue and anemia is just
one of those causes.
Hemoglobin and anemia
As kidney function deteriorates, so does its ability to produce erythropoietin, which
results in anemia (Clarkson & Robinson, 2010, Koshy & Geary, 2008). Anemia is defined
as a hemoglobin level less than 12.1 g/dL for females and 13.8 g/dL for males (NKF
KDOQI, 2006). Erythropoietin is produced in the kidneys and responsible for stimulating
red blood cell production (Koshy & Geary, 2008). The National Kidney Foundation
Kidney Disease Outcomes Quality Initiative (NKF KDOQI) recommends the hemoglobin
target for ESRD patient be 11.0-12.0 g/dL (2007). This is lower than the recommend level
for healthy females which is 12.1-15.1 g/dL, and males which is 13.8-17.2 g/dL. This
recommendation was established by NKF KDOQI (2007) because of the associated risk of
increase morbidity and mortality and risk of cardiac events seen with higher hemoglobin
levels in adults. They also acknowledge the evidence of increase risk of cardiovascular
death and coronary artery calcification in children although there are no current studies
including adolescents and young adults. According to Koshy & Geary, (2006)
hemodialysis patients are also at risk for iron deficiency anemia due to chronic blood loss.

5
This blood loss is from repeated blood sampling, blood loss through the dialyzers and
tubing and the shortened life span of the red blood cell.
Anemia and quality of life
The most common symptom of anemia is fatigue (National Heart, Lung, and Blood
Institute, 2012). Jhamb, Weisbord, Steel, & Unruh (2009) found that fatigue is the most
common complaint of patient receiving long term renal replacement therapy with an
occurrence as high as 60-97% of patients with 94% of patients willing to receive
additional treatments if there would be an associated increase in energy level (Jhamb et.
al., 2009). Fatigue in dialysis patients can be multi-factorial. Some of the factors
contributing to fatigue can be “anemia, malnutrition, uremia, dialysis inadequacy,
hyperparathyroidism, coexisting chronic disorders, sleep disorders, depression, side effects
of medication, dietary and fluid restrictions and physical inactivity” (Jhamb et. al., 2009,
p. 355). Fatigue impacts the daily activity of dialysis patients (Bossola Vulpio & Tazza,
2011). Bossola, Vulpio and Tazza (2011) found fatigue to be is one of four symptoms
which can deteriorate the quality of life, the others being pain, lack of well-being and
depression. End stage renal disease and its treatment may have a significant impact on the
quality of life affecting a patient’s social and psychological well-being (Anees, Hameed,
Mumtaz, Ibrahim, & Khan, 2011). Although there are many contributing factors, this
study examined the relationship between anemia as evidenced by hemoglobin levels and
stated fatigue scores and quality of life.
Conclusion
There are a significant number of adolescents and young adults with end stage
renal disease. Many of these adolescents and young adults are replacing the kidney
function and maintaining their health with hemodialysis. End stage renal disease and it
6
treatment of hemodialysis contributes to and increase risk of a low hemoglobin. Low
hemoglobin or anemia is related to an increase in fatigue and which can affect the quality
of life. Most research has focused on quality of life of adults. There is a gap in the
literature related to the adolescent and young adult population of hemodialysis. With a
growing population of adolescents and young adults living with end stage renal disease,
research needs to be expanded to include this population. This study hoped to begin to fill
this gap by focusing on adolescents and young adults.

7
Chapter 2 - Theoretical Model
Wilson and Cleary (1995) developed a model to describe the relationship between
patient outcomes and health related quality of life. The model was developed to show the
different health domains which all have an impact on affecting health related quality of
life relationship. At the time this model was developed Wilson and Cleary did not believe
there was a model that described the relationship between clinical variable and health
status measures. They developed this model to bridge this gap.
Ferrans, Zerwic, Wilbur and Larson (2005) (Figure 1) modified the original Wilson
and Cleary model to clarify the elements of health related quality of life and the
relationships among them. According to this model, there are four domains which
combine to affect overall quality of life. These domains are: biological function,
symptoms, functional status, and general health perceptions. Characteristics of the
individual and of the environment influence all of these determinants as well as quality of
life. Characteristics of the individual are categorized as demographics, developmental,
psychological, and biological factors that influence health outcomes (Ferrans et. al., 2005).
These characteristics include sex, age, ethnicity, cognitive process, and genetically linked
characteristics. For the purpose of this study, characteristics of the individual obtained
were age, race and sex. Characteristics of the environment are described as social or
physical factors in the person’s life which affects health. Environment characteristics
include, marriage or family status, social, culture and neighborhood. Environmental
characteristics were not evaluated in this study.
Wilson and Cleary’s (1995) model included factors of biological and physiological
variables, symptoms, functional status, and general health symptoms leading to overall
quality of life. Characteristics of the environment and of the individuals affect all the

8
Figure 1. Ferrans, C., Zerwic, J., Wilbur, J. Larson, J. (2005). Conceptual model of health-related quality of life
domains related to quality of life except the biological and physiological variables. The
biological and physiological factors were shown to only affect the overall quality of life,
but did not have an influence on. The arrows leading to each of the factors are labeled.
Non-medical factors were included but only showed effect on the overall quality of life.
The revised version showed the characteristics of the environment and characteristics of
the individual as also affecting the biological function. The non-medical factors were
eliminated because these factors were thought to be included into the characteristics of the
individual or environment. The labels on each of the arrows were removed because it may
be limiting. Ferrans et. al. (2005) also recognized that although the arrows are pointing one
direction, they can be reversed showing effect in either direction. While this study is
looking at one of the factors which may influence quality of life, there are many other
factors which play a role in overall quality of life. Ferrans et. al. (2005) model was chosen
for this study because it was all inclusive in the multiple factors which can influence an
adolescent and young adult’s quality of life.

9
Domains:
Biological function includes the dynamic processes which supports life (Ferrans et.
al., 2005). Biological function comes from metabolism of cell and organ systems and can
be measured with laboratory test, physical assessments and medical diagnoses. Alterations
in biological function can impact all the subsequent determinants of quality of life. For this
study biological function was measured by laboratory documentation of serum
hemoglobin levels obtained through chart audits.
The next domain of the revised Wilson and Cleary model is symptoms. Symptoms
are defined as “a patient’s perception of an abnormal physical, emotional, or cognitive
state, which can be categorized as physical, psychological or psychophysical” (Ferrans
et.al., 2005 p. 339). Symptoms are related to biological function but they can be different
in individual patients with the same disease. For this study the symptom assessed was
fatigue and was measured by the results of the General Fatigue section of the PedsQLTM
End Stage Renal Disease Module version 3 Teen Report.
Functional status is the next domain. According to Ferrans et. al. (2005) functional
status has been defined broadly as the ability to perform tasks. These domains of
functioning are often measured as physical function, social function, role function, and
psychological function. Functional status is often influenced by biological function and
symptoms. Functional status was not evaluated in this study.
The next level of the model is general health perceptions. Ferrans et. al (2005)
describes general health perceptions are a representation of all health concepts together.
They are also subjective in nature. This is the level which is typically measured with a
Likert scale ranging from poor to excellent.

10
The final component of the model is overall quality of life. Wilson and Cleary
(1995) characterized this as how satisfied or dissatisfied someone is with different aspects
of life that are important as a whole. Quality of life is subjective and individualized. For
the purpose of this study the overall score of the PedQLTM
End Stage Renal Disease
Module version 3 Teen Report was considered to be the patients’ quality of life.
The model depicts a one direction flow of influencing factors toward quality of
life. However the author acknowledges these arrows only represent the typical pathway,
but it is probable that any arrow could point the opposing direction representing the
complexity of the interactions between the various factors affecting quality of life.
Overall quality of life is a person’s sense of overall satisfaction or dissatisfaction of
areas of their life that is important to them (Ferrans et. al., 2005). Many factors contribute
to adolescents and young adults with ESRD treated with hemodialysis overall quality of
life. One of the factors in the biological domain is the hemoglobin levels and one of the
factors in the symptom domain is fatigue. Therefore the purpose of this study was to
evaluate the effects of hemoglobin level and fatigue on the overall quality of life.
11
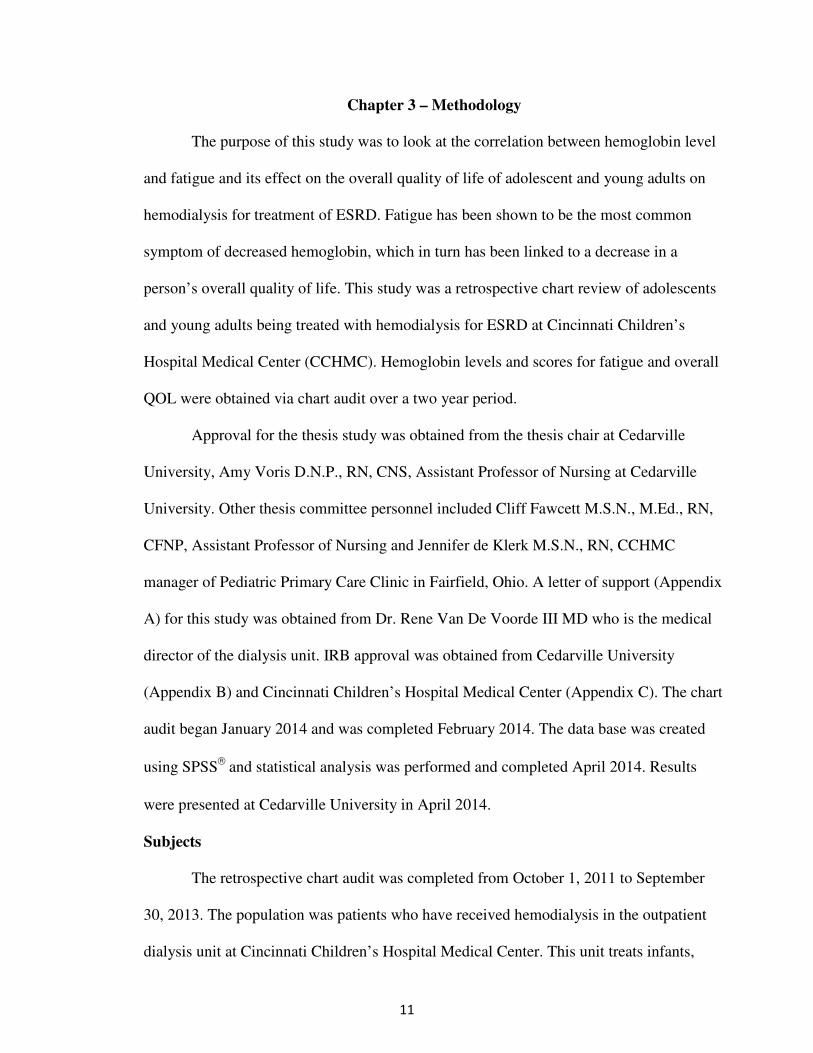
Chapter 3 – Methodology
The purpose of this study was to look at the correlation between hemoglobin level
and fatigue and its effect on the overall quality of life of adolescent and young adults on
hemodialysis for treatment of ESRD. Fatigue has been shown to be the most common
symptom of decreased hemoglobin, which in turn has been linked to a decrease in a
person’s overall quality of life. This study was a retrospective chart review of adolescents
and young adults being treated with hemodialysis for ESRD at Cincinnati Children’s
Hospital Medical Center (CCHMC). Hemoglobin levels and scores for fatigue and overall
QOL were obtained via chart audit over a two year period.
Approval for the thesis study was obtained from the thesis chair at Cedarville
University, Amy Voris D.N.P., RN, CNS, Assistant Professor of Nursing at Cedarville
University. Other thesis committee personnel included Cliff Fawcett M.S.N., M.Ed., RN,
CFNP, Assistant Professor of Nursing and Jennifer de Klerk M.S.N., RN, CCHMC
manager of Pediatric Primary Care Clinic in Fairfield, Ohio. A letter of support (Appendix
A) for this study was obtained from Dr. Rene Van De Voorde III MD who is the medical
director of the dialysis unit. IRB approval was obtained from Cedarville University
(Appendix B) and Cincinnati Children’s Hospital Medical Center (Appendix C). The chart
audit began January 2014 and was completed February 2014. The data base was created
using SPSS
and statistical analysis was performed and completed April 2014. Results
were presented at Cedarville University in April 2014.
Subjects
The retrospective chart audit was completed from October 1, 2011 to September
30, 2013. The population was patients who have received hemodialysis in the outpatient
dialysis unit at Cincinnati Children’s Hospital Medical Center. This unit treats infants,

12
children and young adults from the 0-23 years of age. Due to the fact young adults’ ages
19-23 are treated in the child and adolescent environment, the inclusion age was 13-23
years old. Seventeen patient questionnaire and lab values from the same time frame were
reviewed. An inclusion criterion was patients with end stage renal disease on
hemodialysis, 13-23 years of age. At times, outpatients may have been admitted to
inpatient status and then back to outpatients. Therefore questionnaires were missing on
several patients due to the fact questionnaires were not obtained during inpatient
hospitalizations. Patients less than 13 years of age or patients diagnosed with acute renal
failure were excluded.
Design
This is a descriptive correlational study. The researcher reviewed patient
demographic information, hemoglobin levels and the PedsQLTM
End Stage Renal Disease
Module.
Measurement tools
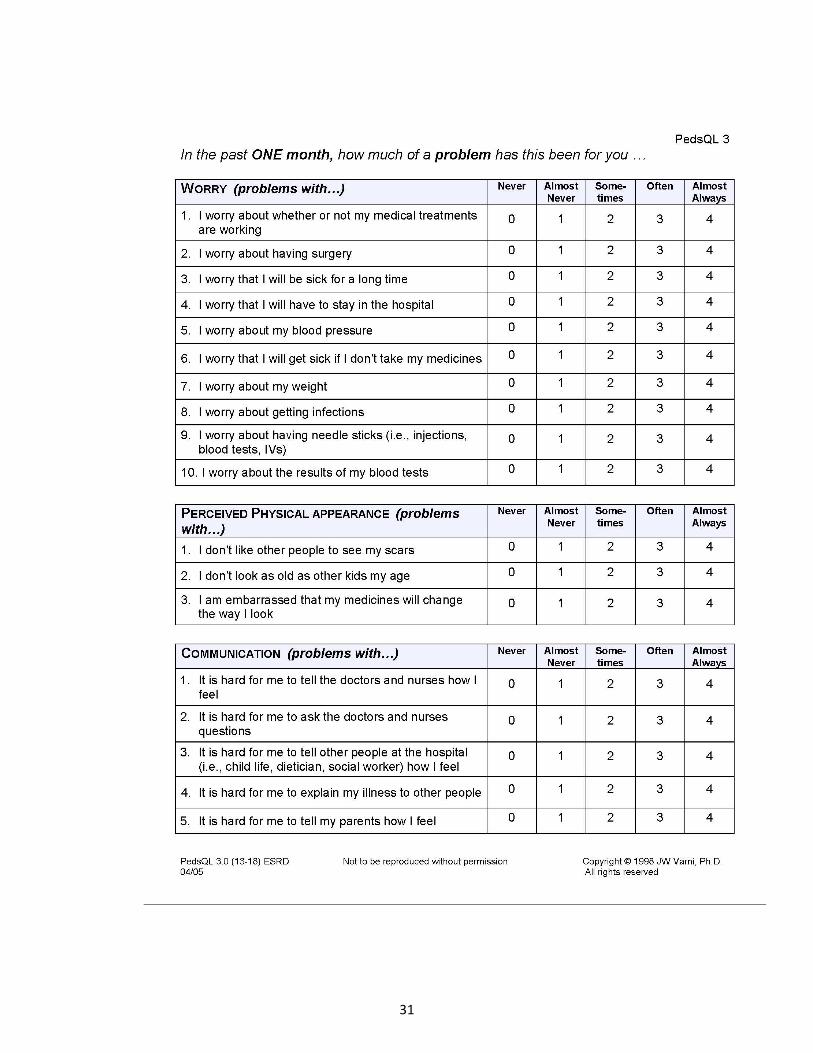
The PedsQLTM
End Stage Renal Disease Module version 3 Teen Report (Appendix
D) was the questionnaire used for this study. This was the questionnaire currently being
used by the outpatient hemodialysis unit. It was developed to evaluate the quality of life of
adolescents living with end stage renal disease, including those being treated with
hemodialysis. The PedsQLTM
End Stage Renal Disease Module Teen version was created
for teens 13-18 years of age, however at CCHMC the young adult (19-23) population
completes the same questionnaire. The questionnaire has 34 items and uses a 5 point
Likert scale. The scale ranges from 0 (never) to 4 (almost always). The questionnaire is
composed of seven domains: (1) General Fatigue (4 items), (2) About My Kidney Disease
(5 items), (3) Treatment Problems (4 items), (4) Family and Peer Interactions (3 items), (5)

13
Worry (10 items), (6) Perceived Physical Appearance (3 items), and (7) Communication
(5 items). Scoring was accomplished by adding the selected number for each item in a
section to give a sub sore for that section. The quality of life score was determined by the
sum of all the scored items on the questionnaire. Reliability of the PedsQLTM
, as reported
by Goldstein, Graham, Warrady, Seikaly, McDonald, Burwinkle, Limbers, and Varni,
“exceeded the minimum reliability standard of 0.70” (2008, p. 288) and construct validity
was 0.94. All hemodialysis patients at CCHMC are asked to fill out the questionnaire
twice a year, however completing the questionnaire is voluntary. CCHMC has a limited
license to use the PedsQLTM
only for clinical purposes. Hemoglobin values were collected
corresponding to the date each questionnaire was collected. Hemoglobin levels are
routinely collected from each patient on a monthly basis. One hemoglobin value recorded
just prior to the completion of the questionnaire was collected. Demographic information
collected included age, sex, and race.
Procedure for data collection
A retrospective chart audit from October 1, 2011 through September 30, 2013 was
completed. Values for hemoglobin levels were obtained from the patient’s electronic
medical record. Hard copy of the PedsQLTM
End Stage Renal Disease Module version 3
Teen Report (ages 13-18) was reviewed. The score for each question on the questionnaire
was collected as well as the total score. A subtotal of the General Fatigue section was also
calculated. A total of forty-seven questionnaire were reviewed. Nine of those
questionnaires were missing more than fifty percent of the scores for the questions.
Therefore those 9 questionnaires were excluded from the total quality of life and
hemoglobin correlation. All forty-seven questionnaires contained completed scores for the

14
General Fatigue section therefore all forty-seven questionnaires were included in the
general fatigue and hemoglobin correlation.
Data analysis
Mean and standard deviation of patient demographics, hemoglobin level, and
general fatigue score and overall quality of life score were calculated. Pearson’s
correlational was run between hemoglobin levels and quality of life score, and hemoglobin
level and general fatigue sub score.
Ethical considerations
Patient data was coded and each patient was designated by a number. Only the
principal investigator had access to each patient name in relation to the number assigned.
Data was transcribed to a paper form. This paper included only the patient number and did
not include any patient identifiers. Social workers from the dialysis unit at CCHMC gave
the questionnaires to the parents of patients under 18 years of age. Consent was assumed
when questionnaires are completed and returned to the social worker. As this was a
retrospective chart audit, consent was not required from patients to be included in this
study. Research finding and statistics are reviewed in the next chapter.

15
Chapter 4 – Results
The purpose of this study was to examine the relationship between hemoglobin
levels and general fatigue and quality of life scores of adolescents and young adults on
hemodialysis for treatment of end stage renal disease. This was a retrospective chart audit
over a two year time period from October 1, 2011 and September 30, 2013. There were a
total of five data collection points: Fall of 2011, Spring of 2012, Fall of 2012, Spring of
2013, and Fall of 2013. A convenience sample was used from Cincinnati Children’s
Hospital and Medical Center.
The study included 17 patients. Of the 17 patients, there was 6 males (35.3%) and
11 females (64.7%) (Table 1). Ages ranged from 14 to 23 years, (age 14-18, N=11 65%,
age 19-23, N=6, 35%) (Table 2). Race included African American (N=6, 35%), Caucasian
(N=10, 59%) and Hispanic (N=1, 6%). The total number of questionnaires completed by
each patient ranged from 1 to 5 based on admission and discharge from the dialysis unit.
Of the 17 patents, 5 patients remain in the unit, 5 patients were transferred to an adult unit,
2 patients moved away from the center, 1 patient was transitioned to peritoneal dialysis,
and 4 patients received a kidney transplant (Table 3).
Table 1. Gender of participants
Gender N= (%)
Male 6 (35.3%)
Female 11 (64.7%)
Table 2. Age of participants
Age (years) N= (%)
14-18 11 (65%)
19-23 6 (35%)

16
Table 3. Attrition
Reason for leaving unit N=
Transferred to adult unit 5
Moved away from center 2
Transitioned to peritoneal dialysis 1
Received kidney transplant 4
Still in unit 5
There were a total of 47 questionnaires. There were nine questionnaires which
were missing more than 50% of the data and were not included in the correlation. A 1-
tailed Pearson’s correlation was ran on the 38 completed questionnaires examining the
relationship between the PedsQLTM
quality of life total score and the hemoglobin level
from the corresponding time frame (Table 4), with a Pearson’s r significance of p<0.05.
The total score was calculated by taking the sum of the score for the 34 questions on the
questionnaire. The total possible score on the PedsQLTM
ranged from 0-136, with zero
being the best quality of life rating. The scores ranged from 22-97. The mean quality of
Table 4. PedsQLTM
total score and Hemoglobin levels
Time Participants Hemoglobin
Levels
Quality of Life
Scores
r P
(N) M (SD) M (SD)
Fall 2011 8 11.34 (1.31) 49.13 (22.47) -0.1 0.41
Spring 2012 10 10.63 (2.23) 50.00 (22.96) 0.21 0.28
Fall 2012 10 10.98 (1.51) 49.70 (22.38) 0.37 0.15
Spring 2013 6 10.30 (1.95) 46.67 (17.24) -0.29 0.29
Fall 2013 4 11.68 (1.75) 51.50 (9.26) 0.5 0.25
Significance *p>0.05
17
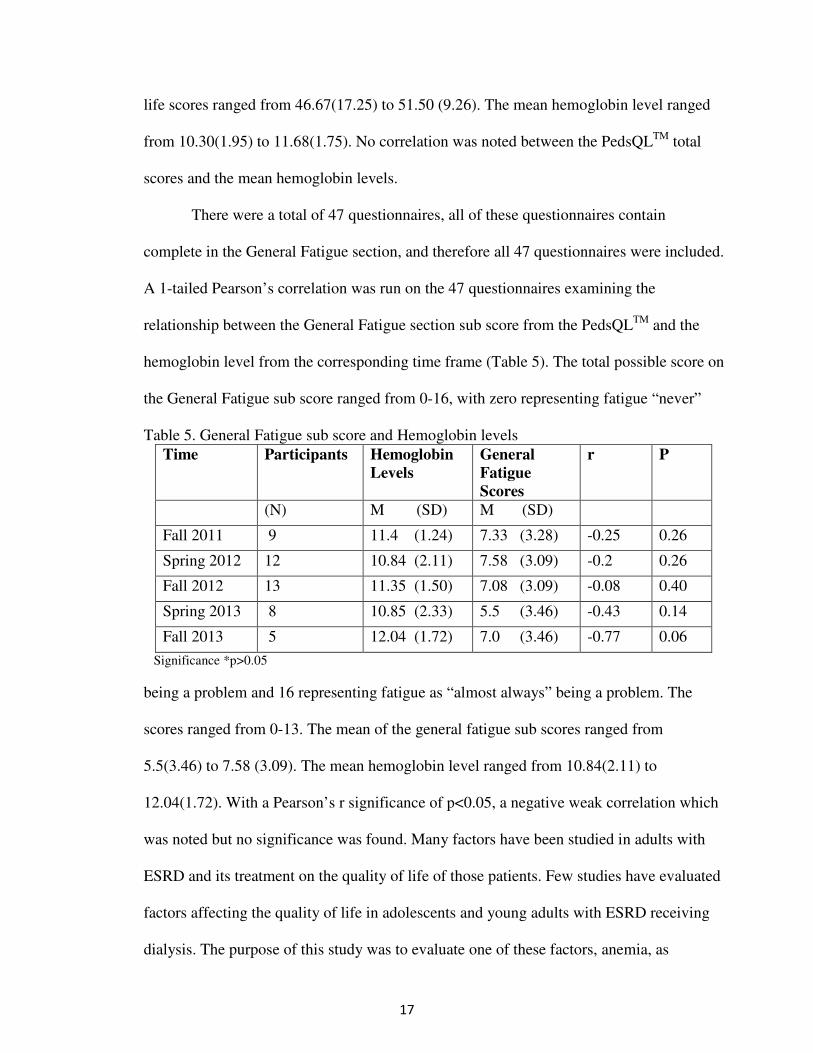
life scores ranged from 46.67(17.25) to 51.50 (9.26). The mean hemoglobin level ranged
from 10.30(1.95) to 11.68(1.75). No correlation was noted between the PedsQLTM
total
scores and the mean hemoglobin levels.
There were a total of 47 questionnaires, all of these questionnaires contain
complete in the General Fatigue section, and therefore all 47 questionnaires were included.
A 1-tailed Pearson’s correlation was run on the 47 questionnaires examining the
relationship between the General Fatigue section sub score from the PedsQLTM
and the
hemoglobin level from the corresponding time frame (Table 5). The total possible score on
the General Fatigue sub score ranged from 0-16, with zero representing fatigue “never”
Table 5. General Fatigue sub score and Hemoglobin levels
Time Participants Hemoglobin
Levels
General
Fatigue
Scores
r P
(N) M (SD) M (SD)
Fall 2011 9 11.4 (1.24) 7.33 (3.28) -0.25 0.26
Spring 2012 12 10.84 (2.11) 7.58 (3.09) -0.2 0.26
Fall 2012 13 11.35 (1.50) 7.08 (3.09) -0.08 0.40
Spring 2013 8 10.85 (2.33) 5.5 (3.46) -0.43 0.14
Fall 2013 5 12.04 (1.72) 7.0 (3.46) -0.77 0.06
Significance *p>0.05
being a problem and 16 representing fatigue as “almost always” being a problem. The
scores ranged from 0-13. The mean of the general fatigue sub scores ranged from
5.5(3.46) to 7.58 (3.09). The mean hemoglobin level ranged from 10.84(2.11) to
12.04(1.72). With a Pearson’s r significance of p<0.05, a negative weak correlation which
was noted but no significance was found. Many factors have been studied in adults with
ESRD and its treatment on the quality of life of those patients. Few studies have evaluated
factors affecting the quality of life in adolescents and young adults with ESRD receiving
dialysis. The purpose of this study was to evaluate one of these factors, anemia, as

18
evidenced by decreased hemoglobin levels, and its effect on their quality of life. No
correlation between the PedsQLTM
overall score and mean hemoglobin levels was noted.
There was a weak negative correlation between the General Fatigue sub score, but the
results were not significant. The next chapter will discuss research needs related to the
results obtained from this study.

19
Chapter 5 - Discussion
There are an increasing number of adolescents and young adults with ESRD who
are receiving hemodialysis. The impact of end stage renal disease and its treatment on an
adolescent’s and young adults’ quality of life has not been well researched. Most research
in the area of ESRD and quality of life has focused on adults. Exploring the responses of
adolescents is important, as adolescence is a stressful time regardless of health status, due
to the changes which are occurring with physical maturation, brain development, increased
peer interactions and drive for independence (Casey et. al., 2010). Research has shown
fatigue to be the primary symptom of anemia or a low hemoglobin level and fatigue may
affect one’s quality of life. Therefore the purpose of this study was to examine the
relationship between hemoglobin levels and general fatigue and quality of life scores of
adolescents and young adults on hemodialysis for treatment of end stage renal disease.
Limitations
Many limitations may have affected the results of this study. One of the limitations
of this study was the small convenience sample. This small sample may have affected the
statistics of this study, with the resulted insignificance noted. Fatigue was the only
symptom evaluated by this study as measured by hemoglobin and its effects on quality of
life, yet as stated earlier there are many other factors which can affect quality of life. Only
one hemoglobin level which was collected prior to the questionnaire was used. Collecting
more serial hemoglobin levels throughout the course of dialysis may have shown a
correlation. Patient with end stage renal disease often have several other comorbidities
which were not evaluated by this study which may have affected a patients perceived
QOL. As questionnaires were completed during dialysis treatment, scoring of quality of
life may have been affected by the side effects of the treatment that particular day. This
20
study evaluated only one of many factors which affect overall quality of life and fatigue
may not be the sole influence of decreasing quality of life. Each of the many factors which
affect quality of life may not be enough to reflect significance alone, however the
accumulative effect of all of the factors affect the quality of life.
Future research
Future recommendations for research would be to repeat the same study with the
ability to publish the results using the PedsQLTM
, and repeating the same study with a
larger population. The PedsQLTM
is only collected twice a year but a more frequent
collection may provide a more accurate picture of quality of life. One hemoglobin level
prior to the PedsQLTM
collection was used to calculate the correlations, but obtaining all
hemoglobin level in each time period may have provided a more accurate reflection of
hemoglobin level and fatigue. Each factor which may affect quality of life alone may not
be enough to significantly affect quality of life, but the accumulating impact of multiple
factors may be more significant. Future research could include collecting more frequent
PedsQLTM
questionnaires and hemoglobin levels. Additional research could also include
factors from the other domains which affect quality of life.
Understanding quality of life and factors influencing QOL is relevant to nurses and
other practitioners in order to provide holistic care to their patients. Nurses need to
understand the common factors and then assess each individual to determine if these
factors exist for their patients. In this way the nurse can address these factors and
implement strategies to help improve their patients QOL while they are undergoing
hemodialysis for their ESRD.
21
References
Anees, M., Hameed, F., Mumtaz, A., Ibrahim, M., & Khan, M., (2011). Dialysis-related
factors affecting quality of life in patients on hemodialysis. Iranian Journal of
Kidney Diseases, 5 (1), 9-14.
Barnes-Jewish Hospital, (2014). Kidney Transplant, FAQS for Kidney Recipients.
Retrieved on May 9, 2014 from http://www.barnesjewish.org/transplant/kidney-
transplant/recipient-FAQ.
Baskale, H., & Baser, G., (2011). Living with haemodialysis: The experience of
adolescents in Turkey. International Journal of Nursing Practice 17, 419-427.
Bayakki, & Hathakit, U., (2012). Lived experiences of patient on hemodialysis: A meta-
synthesis. Nephrology Nursing Journal, 39 (4), 295-304.
Bossola, M., Vulpio, C., & Tazza, L., (2011). Fatigue in chronic dialysis patients.
Seminars in Dialysis, 24 (5), 550-555.
Casey, B., Jones, R., Levita, L., Libby, V, Pattwell, S., Ruberry, E., Soliman, F., &
Somerville, L., (2010). The storm and stress of adolescence: Insight from human
imaging and mouse genetics. Developmental Psychobiology 52(3), 225-235.
Clarkson, K., & Robinson, K., (2010). Life on dialysis: A lived experience. Nephrology
Nursing Journal, 37(1) 29-35.
DaVita, (2014). What is Hemodialysis? Available at http://www.davita.com/treatment-
options/hemodialysis/in-center-hemodialysis/what-is-hemodialysis?/t/5594.
Accessed March 1, 2014.
Ferrans, C., Zerwic, J., Wilbur, J. Larson, J., (2005). Conceptual model of health-related
quality of life. Journal of Nursing Scholarship 37(4), 336-342.

22
Goldstein, S., Graham, N., Warrady, B., Seikaly, M., McDonald, R., Burwinkle, T.,
Limbers, C., & Varni, J., (2008). Measuring health-related quality of life in
children with ESRD: Performance of the generic and ESRD-specific instrument of
the Pediatric Quality of Life Inventory (PedsQLTM
). American Journal of Kidney
Disease 51(2), 285-297.
Griva, K., Davenport, A., Harrison, M., & Newman, S., (2012). The impact of treatment
transitions between dialysis and transplantation on illness cognitions and quality of
life – A prospective study. British Journal of Health Psychology 17, 812-827.
Hagren, B., Pettersen, I., Lutzen, K., & Clyne, N., (2005). Maintenance haemodialysis
patients’ experience of their life situation. Journal of Clinical Nursing 14, 294-300.
Jhamb, M., Weisbord, S., Steel, J., & Unruh, M., (2008). Fatigue in patients receiving
maintenance dialysis: A review of definitions, measures and contributing factors.
American Journal of Kidney Disease, 52(2), 353-365.
Kastrouni, M., Sarantopoulou, A., Alivanis, P., (2010). Quality of life of Greek patients
with end stage renal disease undergoing haemodialysis. Journal of Renal Care,
36(3), 126-132.
Koshy, S., & Geary, D., (2006). Anemia in children with chronic kidney disease. Pediatric
Nephrology, 23: 209-219.
National Heart, Lung and Blood Institute, (2012). What are the signs and symptoms of
anemia? US Department of Health and Human Services. Accessed October 15,
2013 from http://www.nhlbi.nih.gov/health/health-topics/topics/anemia/signs.html.
National Kidney Foundation, (2013). About chronic kidney disease. Accessed April 6,
2014 from https://www.kidney.org/kidneydisease/aboutckd.cfm.

23
National Kidney Foundation Kidney Disease Outcomes Quality Initiative, (2007). KDOQI
Clinical Practice Guideline and Clinical Practice Recommendations for Anemia in
Chronic Kidney Disease: 2007 Update of Hemoglobin Target. National Kidney
Foundation. Accessed October 15, 2013 from
http://www.kidney.org/professionals/KDOQI/guidelines_anemia/ped21.htm.
Renal Network, Network 9, (2013). ESRD incidence – One year statistics. Available at
http://www.therenalnetwork.org/data/resources/AR2012/2012
AR_table1nw09.pdf. Accessed March 20, 2014.
Renal Network, Network 9, (2013). ESRD Dialysis prevalence – One year statistics.
Available at http://www.therenalnetwork.org/data/resources/AR2012/2012
AR_table2nw09.pdf. Accessed March 20, 2014.
Schick Makaroff, K., (2012). Experiences of kidney failure: A qualitative meta-synthesis.
Nephrology Nursing Journal 39(1), 21-29.
United States Renal Data System (USRDS), 2013 Annual Data Report: Atlas of chronic
kidney disease and end stage renal disease in the Unites States. Available at
http://www.usrds.org/2013/pdf/v2_ch1_13.pdf. Accessed March 20, 2014.
Wilson, I. & Cleary, P., (1995). Linking clinical variables with health-related quality of
life: A conceptual model of patient outcomes. Journal of the American Medical
Association, 273(1), 59-65.
Ziegert, K., Fridlund, B, & Lindell, E., (2009). “Time for dialysis as time to live”:
Experiences of time in everyday life of the Swedish next of kin of hemodialysis
patients. Nursing and Health Sciences, 11, 45-50.

24
APPENDIX A

25
APPENDIX B

26
APPENDIX C
27

28

29
APPENDIX D

30
31