
Determining the Causes of the Rising South African ... the Causes of the Rising South African...
37
Determining the Causes of the Rising South African Unemployment Rate: An Age, Period and Generational Analysis Rulof Burger 1 and Dieter von Fintel 2 Working Paper Number 158 1 St Antony’s College, Oxford University and Department of Economics, Stellenbosch University ([email protected]) 2 Department of Economics, Stellenbosch University: ([email protected] )
Transcript of Determining the Causes of the Rising South African ... the Causes of the Rising South African...
Determining the Causes of the Rising South African
Unemployment Rate: An Age, Period and Generational Analysis
Rulof Burger1 and Dieter von Fintel2
Working Paper Number 158
1 St Antony’s College, Oxford University and Department of Economics, Stellenbosch University ([email protected]) 2 Department of Economics, Stellenbosch University: ([email protected])

Determining the Causes of the Rising South AfricanUnemployment Rate:
An Age, Period and Generational Analysis
Rulof Burger∗and Dieter von Fintel†
December 9, 2009
Abstract
This paper takes advantage of the wealth of cross-sectional household surveys conductedafter South Africa’s political transition, in order to gain insights into the causes of the accel-eration in the already high unemployment rate. A synthetic panel dataset is constructed todecompose unemployment and other labour market outcomes into cyclical, generational andlife-cycle effects. This dynamic view isolates which groups are at risk across the period andallows a more nuanced understanding of the longrun and shortrun impacts. Our results indicatethat the higher unemployment rates faced by the young are predominantly due to the disadvan-tage of entering the labour market more recently, rather than being attributable to their age.We furthermore isolate what has driven this longrun increase in labour market participation. Inparticular, higher educational attainment and household formation decisions across generationsfuel labour supply among the more recent entrants. We find some correspondence between thecyclical variation in unemployment and the business cycle. This suggests that jobless growthis not a relevant feature of the South African labour market. This paper confirms many of thecauses of unemployment that are postulated in the literature. The dynamic nature of this studyhas furthermore allowed the separation of short-run and long-run aspects of unemployment. Thedecomposition approach adopted here has uncovered the linkages between the schooling systemand the labour market across all generations, but, in particular, has isolated why the youngestgenerations have exhibited such distinct risks. The surge in labour supply amongst most recentgenerations (those aged 20 in 1995) can be explained by rapid exit rates from the educationsystem resulting from overage enrolment policies enacted in the post-apartheid period. This haspushed individuals into the labour market prematurely and without the adequate skills to beabsorbed into the workplace. The importance of the generational aspects of unemployment rel-ative to life cycle and business cycle impacts suggests that policies should address the structuralissues affecting each of these birth cohorts, rather than focussing on age groups per se
1 IntroductionSince the political transition in 1994, South Africa has witnessed the acceleration of its already highunemployment rate. Rising unemployment is a source of considerable concern to both policymakersand labour market participants. However in the absence of panel data, the dynamic aspects of thisphenomenon remain largely unexplored at the microeconomic level. To understand the underlyingforces at play, to explain adequately how South Africa reached a persistently high level of unemploy-ment and to establish which factors have caused unemployment to grow further still, a long-termperspective ought to be adopted. Indeed, it is necessary to uncover why different groups’ labour
∗St Antony’s College, Oxford University and Department of Economics, Stellenbosch University ([email protected])†Department of Economics, Stellenbosch University ([email protected])
1

market experiences diverge in light of political, demographic and policy changes that have shapedthe broader economy over time.South Africa’s racially divided past impacted most facets of life, including the labour market
and the education system. These imbalances have been tackled on the policy front, in order toequalise opportunities relating to labour market entry and access to similar education for all popu-lation groups. However, these policies have not had the desired impact. Indeed, while educationalattainment is gradually converging across racial groups for the most recent birth cohorts, the pre-viously disadvantaged remain the most severely affected by rising unemployment. The consensus ofthe recent literature pins the reasons for a rise in unemployment to large numbers of new entrantsin the face of relatively slower absorption. While the reasons for these particular trends have beenexplored extensively in a comparative static sense, a truly dynamic perspective should colour theforces that have driven the surge in unemployment. The role of changing household compositionand higher educational attainment explain why participation rates of previously marginalised groupshave converged on so-called insiders in the long run. However, the most recent additional surge inunemployment and participation is not entirely accounted for by these factors.The rise in unemployment, corresponding with a robust economic upswing since 1999, has elicited
allegations of “jobless growth” amongst policy makers and labour unions. On the other hand,many commentators argue that tighter labour legislation to protect the interests of the marginalisedhave had unintended impacts on the willingness of firms to absorb more labour (IMF, 2009: 14).However, employment growth has not been insubstantial during this upswing. Nevertheless, recentlabour market entrants are still more vulnerable to unemployment. Given the strong potentialfor persistence and labour market scarring for entrants, this trend is concerning for the long-termprospects of this particular generation.Indeed, previous studies have emphasised the strong age dimension to the increases in both un-
employment and participation over time. However, cross section data does not distinguish effectivelythe impacts experienced by various generations at different stages in the life cycle (by implication,also in different periods). Following generations (different groups of individuals born in the sameyear) across time offers a long-run perspective on the labour market. The approach allows us tocompare groups at similar points in their working lives, but that started their careers in differentpolitical, demographic and socioeconomic environments. Furthermore, the analysis of short-run fluc-tuations is enabled by the time dimension, so that the labour responses to the business cycle can beestablished for different population groups.The approach followed here allows us to distinguish between the short-run and long-run factors,
and establishes which are more important. Given the absence of nationally representative paneldata for the period of interest, this paper constructs a synthetic panel to identify the pure age,time and birth cohort correlates of unemployment, participation, employment and wages. By fol-lowing the mean characteristics of groups of individuals born in the same year from a pre-specifiedsub-population, the cohort panel methodology used in this study is suited ideally to tease out moreinformation regarding the causes of the recent increase in unemployment. In particular, we decom-pose unemployment into business cycle, generational and life cycle impacts by the Deaton (1997)methodology. This method entails using a zero restriction on the time coefficients to identify themodel: the benefit is that they can be interpreted as business cycle variation, however other re-strictions could yield different results. The analysis of other labour market indicators disentanglesthe picture further, suggesting which racial groups and generations entered the labour market fasterthan they were absorbed.This paper confirms many of the explanations for rising unemployment offered in the growing
literature, but offers a nuanced view to understand the additional risks experienced by the mostrecent generations of labour market entrants. It is tempting to assume that these generations en-tered the labour market in greater numbers as a result of high expectations under the new politicaldispensation. However, alternative causes are exposed here. In particular, post-apartheid schoolenrolment policies are explored. Learners that were too old for their grade were removed from the
2

mainstream public education system, with the intention of transition into adult education alterna-tives. However, this policy had the impact of pushing young (predominantly black) individuals intothe labour market without the relevant skills, rather than continuing with necessary training thatis required for eventual absorption into the workplace. This paper illustrates the concerning impactthat this policy had on the youngest cohorts of entrants.The rest of the study is structured as follows. Section 2 briefly reviews the literature that
pertains to the post-transition labour market. Section 3 outlines the methodological and data issuesencountered in extracting a long-term view from the microdata. Furthermore, a theoretical outline ofthe interlinkages between groups’ labour market experiences places the empirical approach in context.Section 4 uses a decomposition proposed by Deaton (1997) to apportion a rising unemployment rateto the separate impacts of i) the business cycle, ii) the usual lifecycle variation in unemploymentprobability experienced by all workers, and iii) the difference in labour market prospects betweenworkers from different generations. This analysis is then extended to further uncover the observabletrends. Firstly, the groupings are refined to follow more homogenous groups that are known to havedifferent labour market experiences over the period. Separate race and gender analyses are conductedto achieve this richer picture. Secondly, the same decomposition is applied to the participationand employment rates, on one hand, and to wages on the other, to isolate the role of both long-term and short-term supply and demand factors, as well as potential rigidities in explaining risingunemployment. Finally, in section 5, controls are included to determine the extent to which changesin the participation rate were caused by changes in the observable characteristics of the labour forceover time. Section 6 concludes the study.
2 The Post-Apartheid South African Labour Market
2.1 Rising unemployment
South Africa currently has one of the highest unemployment rates internationally. This is theculmination of a long-term, yet steady rise in unemployment that started as early as the 1970s(Seeking and Natrass 2006), but which has rapidly accelerated in the post-apartheid period. Giventhe aggravation of this already concerning trend, policymakers and researchers have re-focussedtheir attention on explaining the evolution of the labour market in the post-1994 period. Highereconomic growth compared to the previous decade, greater levels of educational attainment andthe reversal of discriminatory policies all created the expectation that labour market prospectswould have improved over this period for the majority of the population. Instead, the ranks of theunemployed have grown, which has prompted allegations that the economy had entered a period of“jobless growth”. However, these assertions required deeper understanding and verification. Labourmarket analysis has been facilitated greatly by the introduction of Statistics South Africa’s (StatsSA) large sample householdlevel surveys on an annual basis since 1993, at a bi-annual frequencyfrom 2000 to 2007 and quarterly since 2008. In particular, the correlates, levels and trends inunemployment can now be established with greater certainty. The importance of the questions athand, combined with the supply of better data, has resulted in a burgeoning literature studying thepost-transition South African labour market. However, many of these studies have only been ableto offer a comparativestatic view of the developments over this period.Many recent studies focussing on the post-apartheid era (Banerjee et al. (2006), Burger and
Woolard (2005), Branson and Wittenberg (2007)) have emphasised the role of the rapid increase inlabour market participation in driving unemployment upwards, rather than the demand for labourwhich remained comparatively stable over the same period. This then removes the focus from a“jobless growth” scenario, but begs the question of which factors initiated an exodus into a perhapssaturated labour market. Casale and Posel (2002) explore the gender aspect of the increase inparticipation, and find that the 1995-1999 period has been characterised by a “feminisation” of thelabour force. This was driven by rapid entry amongst previously inactive women, particularly among
3

the black cohort. They explore a number of hypotheses in explaining this trend, and conclude thatit was attributable mainly to higher levels of educational attainment, a decline in the proportionof married women, and a decrease in the share of women who live in households with employedmen. Ntuli (2007) uses a decomposition approach to study the same phenomenon, and finds thatthe increase in participation is attributable completely to a change in the behavioural responses ofwomen, as opposed to changes in their individual characteristics. More specifically, the increasein participation is shown to correspond to the changing responses of African women to levels ofeducation (apart from the increase in attainment among this group) and higher rates of entry atsimilar ages to previous generations. This suggests that women expected a higher return to theirproductive characteristics over this period. Age is known to play an important role in the labourmarket and this result is therefore consistent with studies that find that the current youth cohorthas borne the brunt of the unemployment increase (Mlatsheni & Rospabe 2002).This is difficultto explain, given the higher levels of education attained on average by more recent labour marketentrants.While educational attainment explains the rise in labour supply, the literature has been relatively
silent regarding the role of the educational policy environment in explaining this massive shift intothe labour market. Shortly after the political transition, the Department of Education proposed anew strategy to reduce the large numbers of over-age learners in schools (Republic of South Africa,1995, par 33). Learners that were more than two years older than the normal age for their gradewere subsequently restricted from attending that grade for another year (WCED, 2003). This waspursued in an attempt to lighten the burden of high repetition rates in schools, particularly in thecontext of high pupil-teacher ratios in disadvantaged schools. Indeed, Guluza & Hoadley (1998: 6)highlight that South African youths tend to stay in school for long periods beyond their normal age(as opposed to having a situation with a large “out of school” youth cohort) which has severe financialimplications for the education system. While this policy intended to normalise the age profile oflearners in schools, it may have pushed many younger individuals into the labour market earlier thanwould otherwise have been the case in the past. Given that South Africa’s constitution guaranteesall learners a basic level of education, the implementation of this policy has been intricate. Theintention was for this group rather to be absorbed into alternative Further Education and Training(FET) colleges outside of the schooling system, where they would gain appropriate skills to be ableto enter the labour market (Republic of South Africa, 1995, par 36). This measure was imposed tomaintain the basic right to education as enshrined in the constitution. However, Guluza & Hoadley(1998) suggest that by the time the over-age policy was put forward, the “FET alternative” wasinaccessible, both in terms of remoteness and travelling costs, so that betterlocated schools remaineda more suitable alternative for many of these individuals. By 2003, Asmal (2003) suggested thatthe uptake of learners into the Further Education and Training (FET) system still did not meetthe authorities’ objectives: not only were numbers low, but the quality of the education on offer inFET colleges remained in question. A dilemma arose, so that while it was necessary to introducethe over-age policy to improve the functioning of usual schools, the alternatives were not suitableto absorb over-aged learners. The result is that the Department of Education had, by 1998, notyet implemented officially the over-age policy that was allowed by the South African Schools Act(Guluza & Hadley, 1998). Nevertheless, a shift in focus towards normalising the age profile wasclearly a policy prerogative, even if not formalised. By 2003, however, individual provinces hadalready adopted these directives, as the FET system was promoted (WCED, 2003).Due to the higher repetition rates in historically black schools, this policy should by implication
have affected black learners (both men and women) more directly than white learners. Burger andVan der Berg (2007) show that although there were still some overaged learners in the school system,their numbers decreased sharply between 1996 and 2003. The 21% decline in matric candidatesbetween 1997 and 2003 is also an indication that the reach of this directive was indeed extensive(Burger & Van Der Berg, 2007).Figure A1 in the appendix compares the proportion of relevant age cohorts that are still enrolled
4

in any form of education from 1995 to 2007. For all ages above 18 (the normal schoolleaving age),enrolment rates have declined, though the full effect is only noticable at the turn of the century.This is because the over-age policy was not prescribed immediately after its proposal. Nevertheless,it is evident that schools progressively stopped admitting or retaining over-aged learners in theirschools. These figures conceal movements between the school and FET systems. Figures A2 andA3 disentangle these flows for 1999 to 2007 (the period for which these data are available). It isevident that much of the decline in net enrolment is a result of a reduction in the proportion of the20-27 age cohorts still in school in later years. These large flows out of the schooling system are notmatched by similar increases in (non-university) college enrolments, though mild improvements areevident. As a result, large undereducated groups from younger generations have exited the schoolingsystem, but not entered the FET sector as was hoped. This leaves a large cohort of individuals thatwould by the historical trend have remained in school, but which has now been forced into thelabour market without the education required to attain success in the workplace. As discussedbelow, low skill attainment by this group hinders absorption in a skills-biased economy. Evidentlythese impacts may explain partially why the brunt of recent unemployment growth has affected theyoungest generations most severely.Coupled with the increases in the size of the labour force, the relatively slow post-transition
growth in employment opportunities contributed to the increase in unemployment. Usually thissituation has been ascribed to changes in the structure of production and skill-biased technologicalchange (Banerjee et al. (2007), Bhorat and Hodge (1999)). Consequently, demand for unskilledor semi-skilled workers (who are in abundant supply) decreased, whilst demand for highly skilledworkers (for whom the unemployment rate was already low) increased.Alternatively, the cause for the slow growth in employment could be ascribed to the enactment
of tighter labour market legislation which endowed trade unions with greater bargaining power andincreased the coverage of minimum wages. Lewis (2001) studies wage trends since the 1970s andconcludes that unskilled and semi-skilled workers have been “priced out” of the market due to theprocess of wage compression: this has increased their wages relative to those of more skilled workers.However, studies that have considered wage trends in the post-apartheid era (Burger and Yu (2007),Woolard and Woolard (2004), Banerjee et al. (2006)) all conclude that the increase in unemploymentcoincided with a decrease in the real wages of unskilled and semi-skilled workers. It therefore seemsunlikely that wage increases could have contributed to the rising unemployment rate. However,Banerjee et al. (2006: 4) still believe that the labour market was characterised by “institutionalconstraints that kept wages from declining as much as they might have [in the face of a large surplusof unskilled workers].”
2.2 Towards a dynamic view of the South African labour market
Most studies of South African labour market trends follow a comparative static approach by com-paring outcomes across two cross sections. This is a result of the infancy of panel data in thiscountry. By following this approach, many of the underlying dynamics of the labour market areignored. To bridge this gap in the absence of the appropriate data, many studies have followedcohorts over time rather than individuals. Groups of individuals born in the same year are likelyto share many attributes that can affect their labour market experiences: they are likely to havereceived a similar quality of education, to have faced the same economic opportunities when theyfirst chose to invest in education and similarly at the time of labour market entry. Further, these“generations” may have been instilled with similar norms and perceptions regarding issues such asthe perceived trade-off between household and market production, and particularly gender roles. Ifthere is a strong cohort-specific component to these and other unobservable characteristics, then thelabour market outcomes for a specific birth cohort (a group of individuals born in the same year)may differ systematically from those of cohorts born earlier or later. These effects may be picked uperroneously in age or time effects in studies that do not control for these cohort-specific differences.
5

Regarding the potential importance of cohort-specific effects, Burger and Woolard (2005) find thatalthough the unemployment rate has risen across all age groups between 1995 and 2002, the unem-ployment rate for any birth cohort remained remarkably stable over this period. This suggests thatno group of individuals suffered an increase in its probability of being unemployed over time. Rather,recent entrants had a much higher probability of being unemployed from the outset, which persistedthroughout their working lives. Together, this explains the typical convex age-unemployment profileobserved in cross sections. Birth cohort panels are ideally suited to disentangle the changes thatoccur over time, over the life cycle or across birth cohorts.To the best of the authors’ knowledge, Grün (2003) undertook the first study to analyse South
African labour market dynamics using cohort-level household survey data. She specifically imple-mented the decomposition proposed by Deaton (1997) that is also used in this study. Her analysistraced the average log of hourly wages for different South African birth cohorts and populationgroups, and found that those birth cohorts born earlier receive lower average earnings even aftercontrolling for the life-cycle pattern of wages.Branson and Wittenberg (2007) exploit birthcohort variation in the repeated cross sections,
but focus on the change in the unemployment rate. They start by comparing the age profiles of theemployment and the non-participation rates for African men and women across the different OctoberHousehold Survey (OHS) and Labour Force Survey (LFS) datasets. They observe an exceptionallylarge increase in the participation rates of women between the 1998 OHS and the September 2000LFS. The study then proceeds to compare the unemployment, non-participation and employmentrates for different birth cohorts across the survey years from 1995 to 2005. Their results show thatyounger cohorts of Africans entered the labour market sooner than their older counterparts, butthat their age-employment profiles remained similar to those of older generations. This scenariois consistent with the faster exit rates of learners from the school system, though their study doesnot explore this aspect. The combined result is a higher unemployment rate for more recent labourmarket entrants, who are absorbed into the labour market only at ages typical for all generations.Their semi-parametric analysis stops short of identifying the parts of these birthcohort level changesthat can be attributed to time, age and generational effects, or of controlling for the differences inaverage values of observable characteristics of the different birth cohorts.The current analysis addresses some of these outstanding questions, and ventures to explain more
of these observations by parametric methods that control for other factors, following Deaton (1997).By isolating the pure age, cohort and time effects, decomposition results also provide a uniqueperspective on a number of labour market questions, such as the responsiveness of employmentgrowth to fluctuations in aggregate demand, or how changes in labour demand and supply affectedindividuals from successive birth cohorts across the different races and genders. The isolation ofthese effects provides vital information regarding the potential causes of labour market trends. Isthe increase in unemployment driven by a move along the lifecycle profile, or is it rather a problemthat will afflict younger generations throughout their working lives? The answer to this questionentails different policy approaches in addressing unemployment.
3 Methodology and data
3.1 Past methods
The increased scrutiny of South African labour market data has revealed a number of shortcom-ings that restrict the ability of such studies to draw causal inferences regarding the determinants ofunemployment. Firstly, problems regarding data quality complicate the comparability of successivecross-sections. Secondly, even with the highest quality cross-sectional data, the importance of un-observed individuallevel characteristics in determining labour market outcomes raises endogeneityconcerns. In this regard, the lack of a nationally representative labour market panel dataset span-ning the late 1990s — the period during which unemployment rose most rapidly — is particularly
6
problematic.The KwaZulu Natal Income Dynamics Study (KIDS) is a panel of individuals that spans the
period of interest, but samples from only one province and from two of South Africa’s four populationgroups. As a result, it cannot claim to be representative of the labour market as a whole. On the otherhand, the Labour Force Survey panel dataset is more representative of the national labour market,but has only been released as a panel for a period that covers the two-and-a-half years betweenMarch 2001 and September 2003. This dataset therefore does not provide information for the periodmarked by the sudden unemployment increase. This leaves only the series of independently sampledcross-sectional October Household Surveys, supplemented by the subsequent Labour Force Surveysto understand labour market dynamics in the period of interest.Much of the literature has therefore settled for comparative static analysis, by contrasting the
1995 OHS as the earliest reliable post-apartheid cross section with some point later in time (forexample Oosthuizen & Bhorat 2005, Casale and Posel 2005, Kingdon and Knight 2005). Differencesin questionnaire design and sampling methodology, as well as the inconsistent derivation of labourmarket measures across surveys complicate direct comparisons of these surveys. However, taking alonger-term perspective by constructing birthcohort panels mitigates some of these concerns. Usingall of the available survey rounds, rather than just two end-points, also makes it easier to identifythe effects of survey-specific measurement or sampling errors by introducing time dummies for eachof the cross sections.
3.2 Birth-Cohort Panel Estimators
Using all of the Stats SA cross-sectional datasets to construct a birthcohort panel allows us to studymany of the dynamic features underlying the increase in unemployment. By following the meancharacteristics of groups of individuals born in the same year from a pre-specified sub-population(they may or may not be the same individuals in different surveys), it is possible to trace lifecycleeffects, in addition to the impact of businesscycle fluctuations and longer-term structural trendson labour market outcomes. Following groups instead of individuals has merits and drawbacks.The pseudo-panel approach allows a dynamic picture of the labour market to unfold, which is nototherwise possible from a set of cross sections. Unlike individuallevel panel data this methodologydoes not, however, follow the same individuals over time, but rather analyses the dynamics of“look alikes” (to use Deaton’s (1985: 110) terminology). As with individual panels, it is possible tocontrol for much of the unobserved heterogeneity that plague typical labour market studies. Whereasattrition bias is a concern with individuallevel panel data, this issue is of little concern when usingcohortlevel panel data. This is because a set of individuals who meet the grouping criteria appearin each survey, despite the effects of migration, non-response and the dissolution of households.A panel of semi-aggregated data allows for a richer analysis than either cross-sectional com-
parisons or pure time series data can offer: it is possible to lend a dynamic perspective to theinvestigation, yet maintain a breakdown of the composition of the variables under considerationacross different sections of the population. Deaton (1997: 117) applauds the use of cohort datafor providing a meeting point between disaggregated microeconomic information and the macroeco-nomic movement in variables. These properties are exploited in this paper, by “disentangling thegenerational from life-cycle components” (Deaton 1997: 117), which is not possible in either thecrosssection or time series domains. At the same time, partial aggregation across groups does noteliminate the possibility of determining the correlates of variables under analysis. This methodologydoes not, however, provide an instrument to study individual transitions from one state to another(such as moving from the discouraged worker status to being an active searcher or finding employ-ment), as is the case with pure panel data. The cohort-level aggregation required for constructingcohort panels also entails discarding much of the individual-specific variation in the variables ofinterest, which implies a loss of estimator accuracy relative to those obtained from an individualpanel dataset.
7

If the data generating process for some labour market outcome, , can be accurately characterisedby the two-way fixed effects model at an individual level, then for a typical individual observed atperiod , the following will hold:
it = xitβ + μi + τ t + vit for i = 1, . . . , N, t = 1, . . . T (1)
where χit is a vector of observable characteristics, μi and τ τ represent the effect of person-specificand time-specific unobservables repsectively, and captures the remaining unobservable factors thatcan vary over both time and individuals. The two-way fixed effects estimator (which is arrived atby including individual and time dummy variables in a pooled OLS regression) provides consistent
estimates of the model coefficients, β, as N →∞,as long as E³x0
itvit
´= 0.
However, since we are not using an individual-level panel dataset, we have to consider the cohortequivalent of the above data generating process. Taking population means for those individuals incohort C (i) = c yields:
y·ct = x·ctβ + μ·ct + τ t + v·ct for c = 1, . . . , C, t = 1, . . . , T (2)
where y·ct = E [yit | C (i) = c] and similarly for x·ct, μ·c, v
·ct . Estimating equation (E2) with cohort-
level data differs from the individual level estimation of equation (E1) in a number of ways. Firstly,whereas the regressors and dependent variable in (E1) are perfectly observed (assuming these vari-ables are measured without error), we cannot observe the population means of the variables in (E2)but use the sample means instead, as follows:
yct = xctβ + μct + τ t + νct for c = 1, . . . , C, t = 1, . . . , T (3)
where yct = 1Nct
N
Σi=1
yit1 (C (i) = c),1 (·) is the indicator function, Nct =N
Σi=11 (C (i) = c), and xct, μct
and vct are defined analogous to yct. The two-way fixed effects estimator of (E3) (that is, using anOLS regression including both birth cohort and time dummies as explanatory variables) only provide
consistent estimates of β as C →∞, Nct →∞ if E³x0
ctvct
´= 0 , which is implied by the identifying
assumption for the individual fixed effects estimators and the assumption of independent sampling.However, using sample rather than population means amounts to the introduction of measurementerror, which automatically leads to attenuation bias in the fixed effects estimate of β. Some of theestimators that have been proposed to address this shortcoming are discussed below. However, itbears noting that this problem is circumvented if each cohort is constructed with a large number ofindividuals in each period, so that the sample average of the regressors provide sufficiently accurateestimates for the population means by invoking the law of large numbers. Whereas the consistencyof the individual fixed effects estimator requires that N tends to infinity, the cohort estimator nowalso requires Nct that tend to infinity for these reasons.A second issue that arises from estimating (E3) rather than (E1) is that whereas individual fixed
effects are time invariant by definition, the cohort sample average of these effects is unlikely to sharethe same property (Baltagi, 2005: 193): since the cohort sample consists of (quite possibly) differentindividuals in adjacent periods, the sample average of the individual fixed effects, μct , may varyover time. This problem is similar to the measurement error problem referred to above, and ceasesto matter as Nct →∞ . More problematically, the population means of the cohort fixed effects, μct,need not be time invariant since large non-random groups of individuals can always enter and exitfrom the cohort through mass immigration, emigration or death. We assume that entry and exit israndom, in which case the expected value of the cohort fixed effects will also be time invariant. Thisassumption is less heroic than the assumption of random attrition in individual level panels, sinceindividuals who non-randomly migrate within South Africa are likely to attrit from an individualpanel but remain in the sampling frame of a birthcohort panel. A third difference between the
8

individual and cohort-level panel data estimators is that much of the variation in the regressors isdiscarded: whereas the individual level fixed effects estimator considers all of the variation in xit,the cohort regression only exploits the variation in x·ct, which is strictly smaller for all cohorts. Ifmuch of the variation in the regressors occurs within rather than across cohorts, then the coefficientestimates from the cohort panel become inefficient relative to those obtained from an individuallevelfixed effects regression. The cost of controlling for time-invariant heterogeneity when individualpanel data is unavailable is therefore a potentially substantial reduction in estimator efficiency. Thegroups that are followed here are chosen to be as homogenous as possible, so that differences occuracross cohorts as opposed within cohorts. Particularly, the large labour market differences acrossrace and gender prompt separate groupings of our unit of observation along these dimensions.A number of authors have proposed estimators that explicitly address the attenuation bias that
arises from using sample means of groups rather than population means. Deaton’s (1985) seminalwork proposed an adjusted fixed effects estimator, which scales each cohort by the square root ofits constituent size and adjusts for the covariance structure of the means. Inoue (2005) addressesthis issue, along with efficiency and inferential concerns, by way of a GMM estimator, which alsoaccounts for cohort size in each period in the weighting matrix. These estimators are more com-plicated to implement, and may not result in considerable consistency gains. In practise, appliedresearchers often choose to ignore measurement error issues: it has been shown that with 100 or moreobservations within each cohort, bias is minimal and adjustments can be safely ignored (Verbeek andNijman, 1992). In order for the standard fixed effects estimators to be applied to birthcohort data,it is therefore important to construct cohorts so that each contains a sufficient number of underly-ing observations. Since the attenuation bias tends towards zero as the number of observations percohort grows to infinity, we face a trade-off between the benefit of additional degrees of freedom inour cohort-level regression analysis (by increasing the number of cohorts, each with fewer members)against mitigating the errors-in-variables problem by choosing larger, but fewer cohorts.
3.3 Age Period Cohort Decompositions of labour market status
One of the benefits of cohort data, as mentioned above, is that it enables the researcher to discernbetween life-cycle, generational and cyclical macroeconomic components of the dependent variable ofinterest. Deaton (1997: 123-127) outlines how a simple least squares dummy variable regression canfeasibly decompose dependent variables into these respective elements. Time dummies are includedto capture time-specific shocks or sampling error in a specific period,τ t whereas the inclusion ofbirthyear dummies provides estimates of the unobservable “generational fixed effects” for the variouscohorts, μc. The third set of dummies represents age and isolates the typical life-cycle pattern ofthe dependent variable. This entails estimating the following model
yct = ak + μct + τ t + νct for c = 1, . . . , C, t = 1, . . . , T (4)
where αk is the age effect (common to all cohorts and time periods) associated with the age k ofcohort c in year t. In practise this decomposition poses an identification problem; since a person’sage is the difference between the current year and their birth year, these three variables are perfectlymulticollinear. One way to circumvent this problem is to perform a simple transformation on theyear dummies, so that the time effects are restricted to be orthogonal to time itself (Deaton, 1997:126). This restriction is intuitively appealing if the time effects are considered to represent businesscycle effects, since short-run fluctuations in aggregate demand are often considered to average tozero in the long-run. In the regression analysis below, one age and one cohort dummy are omitted asreference groups, while a set of T − 2 new time dummies (omitting the first two years) are createdby the proposed transformation:
τ ·t = τ t − [(t− 1) τ2 − (t− 2) τ1] t = 3, . . . , T
9
The time effects for the first and second years can be recovered subsequently by way of the zerorestriction.This decomposition methodology has been applied to compare racial and gender differentials in
South African wages, though only with OHS data (Grün, 2004). In this paper, we apply the sametechnique to South African unemployment, participation and employment rates, as well as the log ofreal hourly wages. In section 5 we also move beyond the simple decomposition by controlling for a setof observable characteristics in an attempt to better isolate the sources of the massive labour marketshifts. It is important to note that the decomposition technique employed here ignores interactionsbetween the separate components, but provides more clarity than crosssection evidence is able to.Figure 1 compares the unemployment rate of two cross sections (October 1995 and September
2007) for individuals of different ages. This picture suggests that the age-unemployment profile hasremained largely unchanged, but that labour market circumstances have deteriorated uniformly forall age groups. It also clearly demonstrates the strong age dimension of unemployment. It is not clearhowever, whether this shift is attributable to generational differences between the two cohorts, ordue to changes that occurred over time. Pseudo-panel decompositions fill this gap in a more crediblemanner. Results reported below suggest a flatter age profile for younger individuals compared to thecross-section evidence, with more importance accorded to cohort changes in explaining the recentincrease in unemployment among the young.Most of the individual labour market outcomes that we consider in sections 4 and 5 (labour
market participation, employment and unemployment) are binary variables so that the sample meansof the dependent variables, yct, represent the respective rates of each variable for the relevant cohorts.The decomposition analysis in section 4 estimates model (E4) and therefore merely traces out thelife cycle, business cycle and birthcohort effects for each of these variables. Since we do not controlfor any observable characteristics other than age in the first regressions, the resulting coefficientestimates reflect the time, life cycle or cohort-specific variation of the dependent variable, withoutregard for the causes of these trends. The first set of analyses is therefore largely descriptive innature. In section 5 a range of observable characteristics are introduced as controls, to narrow downthe factors that could have caused the observed trends.
3.4 A model to interpret the components of the decompositions
In an oversimplified textbook model of the labour market (with search costs), wages adjust toshifts in labour supply and demand, so that the only unemployment in equilibrium is frictional.Although labour supply and demand cannot be observed directly, shifts in these curves presumablyaffect the labour force participation and employment rates respectively. In determining whether asimultaneous increase in both participation and employment was caused by an exogenous increasein labour supply or demand, it may be instructive to also observe the change in wages: an increasein wages suggests that labour demand increased, whereas a decrease in wages implies an increase inlabour supply.This model becomes more complex if we allow for wage rigidities and adjustment costs. If wages
are not responsive to changes in the unemployment rate, then these initial changes can persist, andpossibly even become permanent. Additionally, if the costs of adjusting the size of the workforceare substantial, then absorption is less responsive to changes in the actual demand for labour. Thepresence of frictions, wage rigidities or adjustment costs can mean that an individual’s employmentstatus or wage rate may reflect not just current labour market conditions, but the conditions thathave prevailed throughout the individual’s working life. In this case the cost of any adverse shifts inthe demand for labour will be borne disproportionately by the more recent labour market entrants.This is important for the interpretation of our decomposition results, since long-term time trendsmay be reflected as cohort effects.The unemployment rate for any cohort depends on the participation decisions of its members,
as well as the employment decisions made by firms. In fact, the unemployment rate (μc) of cohort c
10

in period t can be expressed in terms of the cohort employment (ect) and participation (pct) rates:
μc = 1−ectpct
Increases in the unemployment rate within a cohort is the direct result of a decrease in itsemployment rate, an increase in its labour force participation rate, or a combination of the two.Although labour supply and demand can shift for a number of reasons, such shifts also implydifferent changes in the participation and employment rates, as well as wages. Furthermore, theeffects of the different determinants of labour supply and demand are unlikely to vary uniformlyacross all of the dimensions of the data (age, time, birth cohorts, race and gender). By applying thedecomposition methodology discussed in section 3.1 to the participation rate, the employment rateand hourly wages, for each of the race and gender combinations, it may be possible to identify moreaccurately why labour demand and supply changed in the period under consideration.We will now discuss some of the most likely shifts in labour demand and supply over the period
under consideration, and how these shifts are expected to induce variation across time, age, birthcohorts, race and gender, in order to facilitate the interpretation of our decomposition results insections 4 and 5.
3.4.1 Expected Wage Age, Cohort and Year Trends
Wages are assumed to be a function of the marginal revenue product of workers (which shouldincrease in aggregate demand and decrease in labour supply), as well as the characteristics of wagesetting institutions. According to equation (3.4) the average log hourly wage rate for cohort c inperiod can be represented as
wct = awk + μwc + τwt + νwct for c = 1, . . . , C, t = 1, . . . , T (5)
where awk + μwc and τwt now represent the wage age, cohort and time effects, νwct is the remaining
error term, and the w superscripts are used to distinguish these effects from their counterparts forother labour market outcomes.Although this study only considers formal sector workers in calculating the average cohort wage,
it is still possible that the improved capturing of low-income employment activities over the OHSyears may induce an artificial downward trend in wages over the 1995 to 2000 period. Wages arealso expected to respond to the changes in aggregate demand, and the magnitude of the wagetimeeffects can therefore be used to gauge the extent of wage rigidity over the business cycle. The SouthAfrican Reserve Bank identified the third quarter of 19991 as the start of an upswing phase in theSouth African economy (SARB, 2006: S159). We therefore expect decreases in wages between 1995and 1999, and increases between 1999 and 2007 (though lags might appear).According to Mincer’s (1962) seminal study of on-the-job training, the productivity of workers
is expected to be concave in labour market experience, which should be reflected in our estimatesof the wageage profile. If experience and education are complementary in production then theproductivity of those with lower levels of education may start to decline earlier in their workinglives. Furthermore, the age differentials in wages reflect any mismatches in supply and demandthat occur over the life cycle, assuming that wagesetting institutions allow wages to adjust to thesefactors.The wagecohort effects are expected to capture cohort-specific differences in labour productivity,
such as differences in the average quantity or quality of education. Long-run time trends in labourdemand or supply may also be reflected in the cohort effects if the labour market is characterised by a
1This period falls shortly before the period when the OHS of 1999, which is included in this analysis, was enumer-ated. Therefore we do not only realise a change in the economic climate but a change in survey design at the sametime. Nevertheless, the period following 1999 delivers a consistent picture (such as rising wages), which suggests it isnot likely that this can be attributed only to survey design.
11

high degree of wage or employment rigidities. For example, if an unexpected decrease in the demandfor unskilled labour occurs, and high firing costs and downward wage rigidities preclude the firmfrom either adjusting wages of current unskilled employees downward or retrenching unskilled worker,then older cohorts of unskilled workers benefit from both higher wages and a higher employmentprobability than those who entered the labour market more recently.
3.4.2 Expected Employment Age, Cohort and Year Trends
A person is employed if she chooses to participate in the labour market, receives a satisfactory joboffer (in other words a wage offer that exceeds her reservation wage) and if worker separation hasnot yet occurred. Given the oversupply of workers in South Africa, changes in the employment rateare considered to reflect mainly changes in the demand for labour. The probability of receiving a joboffer and the offered wage are both expected to depend mainly on labour productivity and aggregatedemand considerations.The cohort c employment rate in period t, ect, can be expressed similarly to wages in equation
(E5). Employment-year effects indicate the effect of aggregate demand fluctuations on employment,although it may also reflect any remaining differences in how employment was measured acrosssurveys after omitting informal sector workers. This cycle is therefore indicative of whether employ-ment was indeed responsive to economic growth, and provides evidence on whether “jobless growth”did indeed arise in the post-apartheid era. Branson and Wittenberg (2007) note that formal sectoragricultural employment was over-captured in the 1995 OHS for black men, so we expect to observethese inconsistencies in our employment-year effects.The pattern of labour productivity that is expected to induce a concave age-wage profile should
also result in the employment age effects increasing rapidly early in life, and then levelling off ordecreasing as workers approach retirement age. This decline should be sooner and sharper for thosewith lower levels of education.The employment-cohort effects should reflect cohort-specific productivity factors (such as the
average quality and quantity of education), and should be similar to the wage-cohort effects un-less wage-setting institutions or large shifts in supply pull the wagecohort members in a differentdirection. As with the wage-cohort effects, it is possible that long-term trends in labour demandwill be reflected in the employment-cohort effects if these trends are combined with high workforceadjustment costs or wage rigidities.
3.4.3 Expected Participation Age, Cohort and Year Trends
Turning now to the participation rate decomposition, it is assumed that an individual chooses to bea labour market participant if the discounted expected utility of job search exceeds the discountedexpected utility of inactivity. This decision depends primarily on the costs and benefits of job search,including the probability of receiving a job offer, the expected wage offer, the cost of looking forwork and the attractiveness of opportunities outside of the labour market. The participation rate ofcohort c in period t, pct, can also be written as the sum of its age, cohort, time and error componentsas in equation (E5) for wages.The improved capturing of low-income activities may have also raised the participation rate over
time, as many subsistence workers would have been classified as inactive rather than employed inearlier surveys. However, time effects are more likely to reflect the impact of the business cycleon participation than is the case for employment. Shifts in aggregate demand affect participationmainly via their effect on employment (as captured by the employment rate time effects), wages(represented by the wage-time effects) and non-labour market incomes. Assuming that employment,wages and non-labour market incomes all vary pro-cyclically, the participation-time effects maytherefore reveal which of the “discouraged job seeker” or “added worker” hypotheses are more validin the South African labour market.
12

The participation-age effects are expected to reflect firstly the life-cycle pattern in employmentand wages; the returns to job search should increase rapidly early in the working life but startto decrease towards retirement age. But the desire to work need not be aligned perfectly withlabour productivity, and it is possible that changes in an individual’s household responsibilities(itself determined by the changing probability of being married, having children, or simply living in ahousehold with more dependents, amongst other things) over the life cycle result in the participationpattern that deviates from those observed for employment and wages.Participation-cohort effects should reflect the differences in labour productivity (and hence the
returns to job search) across cohorts, but may also be affected by changing perceptions and culturalnorms, that alter the psychological cost of job search. Such shifts may have increased the desirabilityof labour market employment relative to engaging in household production. The trend towardshigher participation rates for younger cohorts is expected to be even more rapid for women, whoalso face the decreasing probability of being brought up according to stereotypical gender roles.The factors considered by Casale and Posel (2002) to explain the feminisation of the labour force,particularly the decreasing marriage rates and changing household composition, are all likely to bereflected in the participation-cohort effects.Another factor that could have affected the participation decision of different cohorts is the
availability of attractive outside labour market opportunities. Many young individuals choose toinvest in their education rather than to enter the labour market immediately, due to the perceivedbenefits that accrue to this investment later in life. However, the changes in the school systemdescribed in section 2 would have restricted access of overaged learners to the school system, andlimit this choice. The affected cohorts would therefore have been more inclined to enter the labourmarket. As noted in section 2, black men and women are more likely to be affected by this changein education policy, which is presumably reflected in their participation-cohort effects.
3.5 Data description
Given that this paper is primarily concerned with changes in the South African unemploymentrate over time, differences in measurement, sampling or data capturing may affect intertemporalcomparability. The most troublesome comparability issue is the change in sample and questionnairedesign that Stats SA progressively implemented in an attempt to improve data reliability. Thesechanges are almost certain to distort the true unemployment trend when comparing the measuresof unemployment across surveys. The effect of these changes is particularly evident in the improvedcapturing of workers engaged in low-income activities and the large fluctuations in the recordingof agricultural employment (Casale & Posel, 2002). Although the determinants of informal sectoremployment are of considerable importance in their own right, the problems with comparing theseactivities across surveys leads us to restrict our attention to formal sector employment. For thisreason we do not include informal sector workers amongst the employed in our calculation of thecohort employment and unemployment rates. It should be noted that since all informal sectorworkers are now counted as unemployed, our “formal sector unemployment rate” is higher thanunemployment rates estimated in the conventional way (as demonstrated from the comparison inFigure 2 below). Our analysis can therefore not speak to any issues that pertain to job gains orlosses in the informal economy. Furthermore, Kingdon and Knight (2006), by showing that thenon-searching unemployed more closely represent discouraged work-seekers than the voluntarilyunemployed, present convincing evidence that the broad definition of unemployment is a moreaccurate measure of the adequacy with which the economy is providing employment opportunitiesfor the labour force in South Africa. This motivates our use of this definition of the labour forcethroughout this paper. In calculating the average cohort wages, we follow Burger and Yu (2006)by dropping informal sector workers, the self-employed and those earning more than R1 million peryear to track a consistent series.We use the 1995 to 1999 annual October Household Surveys (OHS), as well as the September
13

rounds of the Labour Force Surveys (LFS) from 2000 to 2007. By omitting the February-Marchround of the Labour Force Surveys, we eliminate potential seasonal fluctuations, and also allow thetime dummies to represent business cycle effects or other surveyspecific differences in measurement.Until September 2004, the LFS datasets were released with probability weights based on the
1996 Census, but the subsequent LFS probability weights were derived from the 2001 Census. In2005 Stats SA re-weighted all the LFSs that originally used the 1996 Census according to the 2001Census, in order to aid comparability across surveys. We make use of these re-weighted datasets.All the OHSs remain weighted according to the 1996 Census.In creating the cohort panel, we average variables over individuals who share the same birth
year. A “birth-year” variable is constructed by subtracting an individual’s age from the year inwhich the survey was conducted. This variable does not correspond perfectly to the actual birthyear of individuals, since all individuals born between the day on which they were surveyed and 31December will be assigned the birth year that follows their year of birth. This is unlikely to affectour analysis in any substantial way. The empirical analysis first proceeds without controls to tracepure cohort, age and year effects, before controls are introduced in section 5.
3.5.1 Control Variables
We control for the variation in levels of education across groups and generations. Since cohortemployability can be affected by the distribution of education rather than just its mean, we opt fora flexible specification that allows for a differential effect of the different levels of education. Thecohort sample proportions were constructed by averaging over four dummy variables that indicatedwhether each person had primary, incomplete secondary, complete secondary or tertiary education.Individuals with NTC I, NTC II qualifications (or who held any post-school certificate or diploma)but have not completed Grade 12 are considered to have incomplete secondary education. Individualswho held an NTC III qualification are counted as having complete secondary education.Furthermore, we consider the impact of different marriage rates across cohorts, the proportion
of each cohort that forms their own households (this is relevant for the female decompositions), andthe average number of household members that are unemployed for each of the cohorts. Each ofthese variables attempts to explain the long-term rise in participation, which is known to dominatethe rise in unemployment.However, much of the most recent acceleration in unemployment is controlled for by the pro-
portion of each cohort that is economically inactive and in education. Differences in this measureacross cohorts capture the impact of the overage learner policy implemented in the post-apartheideducation system.
4 Decomposition of labour market outcomes, without con-trols
4.1 Decomposition by birth cohort
The empirical analysis commences by grouping individuals of all genders and races born in thesame year into birth cohorts in each of the cross sections, and applying the decomposition techniquesuggested by Deaton (1997) to the cohort averages of the unemployment rate. Table 1 shows asummary of the constructed cohorts. Different numbers of individuals are used in the constructionof the variables of interest. This is because unemployment rates only cover the economically activepopulation, while the other variables are averaged over the entire working-age population.In the calculation of unemployment rates, 31 cohort observations contain fewer than 100 sampled
labour force participants — the acceptable threshold required to ignore sampling errors (as in section3.2.). Since the average number of participants per cohort is 789, only a small number of cohorts
14

potentially suffer from measurement error. The inconsistency that arises from using conventionalfixed-effects estimators on grouped data is therefore unlikely to play an important role in drivingthe results. In order to check the robustness of the results of the conventional fixed-effects (FE)estimator, we also perform the decomposition using the GMM estimator suggested by Inoue (2005),which explicitly adjusts for differences in cohort sample sizes and should be consistent even whenusing smaller cohort samples. In section 4.1.1 the cohort unemployment rate is regressed on a setof age dummies representing the ages of 15 to 65, a set of birth cohort dummies for the birth years1930 to 1992 and on 11 transformed year dummies.
4.1.1 Decomposition of unemployment rate
Figure 3 presents the decomposition of the unemployment rate into age, cohort and year effects. Theset of trends in figure 3.1 depicts the unemployment rates experienced by every third birth cohortat different ages. For example, one line represents the unemployment rates for the birth cohort aged15 in 1995 (and hence born in 1980) for all the years from 1995 to 2007. The curve directly to itsright tracks the unemployment rates experienced at different ages by the group born in 1977. Thesetwo trajectories can be compared to show how the unemployment rates for these two groups differedat the same ages. The fact that most of the lines in figure 3.1 are above those directly to theirright means that individuals born more recently generally experience higher unemployment ratesthan those born earlier. It is also worth noting that the only reason for any overlap in the curves(and hence in the unemployment experiences of individuals of different cohorts) is the decline inunemployment experienced by most cohorts in the last few years of the period covered.Figure 3.4 reveals an 11 percentage point increase in cyclical unemployment between 1995 and
2001 — mainly the result of the 8 percentage point increase between 1995 and 19972 — followedby a steady decline for the remainder of the period. This suggests that there is a high degree ofcorrespondence between the unemployment rate and the business cycle, although it appears to lagthe cycle by about a year or two. The extent to which this variation is due to the changes in laboursupply or demand will be studied in section 4.2.The birth cohort effects in figure 3.3 reveal that the probability of being unemployed grew
steadily for more recent labour market entrants, confirming the analysis of Branson & Wittenberg(2007). This is a troubling finding, since it predicts that — abstracting from cyclical effects — thereshould be sustained increases in unemployment, as cohorts with low unemployment rates exit thepopulation of working age and are replaced by ones with high unemployment propensities. Thesecohort effects are more important in magnitude compared to either the unemployment time or ageeffects. Although these results clearly indicate the importance of the generational aspect of theincrease in unemployment, it cannot tell us whether this increase was due to shifts in the demandor the supply of labour. These issues will be explored when decomposing the employment andparticipation rates in section 4.2.Figure 3.2 plots the unemployment effects across the average life cycle. It can be observed
that the probability of being unemployed decreases gradually until the age of 40, after which pointolder workers are increasingly likely to be unemployed. The benefit of using this decompositionis immediately apparent when comparing figure 3.2 with the age-unemployment profiles in figure1. The cross-sectional age-unemployment profiles lead one to believe that the probability of beingunemployed does not change much between the ages of 40 and 65, whereas the cohort panel ageprofiles demonstrate that these groups are more likely to face unemployment as they grow older. Themisleading inference drawn from figure 1 is caused by the fact that in a crosssectional dataset theolder individuals are also members of birth cohorts that entered the labour market earlier and witha lower unemployment rate faced by their particular generation. From a cross-sectional perspectivethe age and cohort effects are indistinguishable.
2This large increase may be the result of better capturing of low-income activity.
15
Understanding the dynamic nature of the South African labour market, and implementing effec-tive labour market policies, requires a careful distinction between generational and lifecycle effects.In particular, these results suggest that much of the unemployment experienced by recent labourmarket entrants stems from their specific experiences, and is not attributable to their youth (ascompared with the early circumstances of other birth cohorts). By implication, should this cohortimpact remain throughout the life cycle, persistent unemployment is likely to arise among this group,with only little relief associated with maturity. The potential for labour market scarring among themost recent labour market entrants is therefore severe (Arulampalam et. al., 2000).The results from the Inoue (2005) GMM estimator are almost identical to those obtained from the
FE regression, which confirms our earlier suspicion that adjusting for cohort sizes does not providea substantial improvement in the accuracy of our estimates.
4.2 Decompositions by birth cohort, race and gender
In this section we further disaggregate our cohorts by population group and gender. To simplify theanalysis, and to avoid problems associated with small cohort sizes, the focus will fall on comparingthe black and white population groups only. Table 2 highlights the construction of these cohortsin the various time periods. Since a high proportion of white cohorts now consist of fewer thanthe 100 observations required to ensure consistency without adjusting for cohort sizes, we should bewary of drawing strong conclusions based on these cohorts alone. However, the smaller variation ofmost variables within this population group suggests that using these small samples to represent thecohort population averages in each period could not be as problematic as might be expected. Indeed,the implementation of the GMM estimator (not shown), produces an almost identical picture to thatobtained from the simpler FE estimator, so that the latter approach suffices.
4.2.1 Decomposition of unemployment rate
Figure 4 shows the decomposition of the cohort unemployment rates by population group and gender.The raw unemployment rate (figure 4.1) is generally quite low for white men and women comparedto the higher rates for black men, and the even higher rates for black women3. Youth unemploymentcan be seen to be more of a problem, and persists until older ages, for black labour force participants,although white unemployment shows a sudden spike (and a high degree of volatility) at ages youngerthan 25.The unemployment age effects displayed in figure 4.2 differ noticeably between the four groups.
The black male age profile shows a large decrease in the unemployment rate between the ages of 15and 35, after which it starts to increase again. This is similar to the age effects observed for thepopulation as a whole in figure 3.2. The unemployment age effects for black female labour forceparticipants reveal a similar pattern, although the unemployment rate is uniformly higher and lesssensitive over the life cycle compared to black men. The unemployment rates are lower for whitemen and women throughout their working lives, and except for a decrease in unemployment betweenthe ages of 15 and 25, appear to be largely unaffected by age.Figure 4.3 reports the unemployment birth-cohort effects for the various groups. Black men from
more recently born cohorts experienced a large increase in their likelihood of unemployment relativeto older generations, compared to the slower increase for black women. Except for the sharp increasein unemployment birth-cohort effects amongst the most recent white birth cohorts — a pattern thatmay well reflect little more than the estimator inaccuracy driven by the small sample sizes for thesecohorts — the unemployment birth-cohort effects are fairly stable across generations for white menand women.
3These unemployment rates appear implausibly high, but are a result of the “formal sector unemployment” rateused in this analysis. Black females are most likely to be engaged in informal activity, which has been considered as“unemployed” in this analysis.
16

Time effects for the different groups (displayed in figure 4.4) all show that unemployment in-creased in the economic downswing and decreased in the upswing. The unemployment rates for blackmen and women were however, far more responsive to fluctuations in aggregate demand. Down-swings do not affect the white population as severely as the black population, suggesting that theyare employed in more secure positions. The unemployment year effects for black men and womenalso show a sharp increase between 1995 and 1997, whereas this increase is absent for white menand women.
4.2.2 Decomposition of employment, participation and wage rates
Performing the same decomposition on the other labour market outcomes allows us to shed light onthe components of the increase in South African unemployment. The results of the participation,employment and wage rate decomposition are presented in Figures 5, 6 and 7 respectively.Figure 5.1 reveals that participation is inversely U-shaped over the life cycle for all race groups
and both genders, regardless of generation; the likelihood of participation increases between theages of 15 and 25 and then starts to decrease again around the age of 50. For both race groups,participation is substantially higher for males than for females, but the high variability across age,time and demographic groups makes it difficult to identify other trends from the raw data.The age effects from the decomposition of participation are presented in figure 5.2. The initial
increase in participation rates occurs approximately three years earlier in the lifecycle of white malesand females compared to their black counterparts. This can be explained by the fact that whiteindividuals are more likely to enter the labour market while still enrolled at educational institutionsand do not stay in school as long (Wittenberg, 2002). Young white individuals are therefore linkedto the labour market at a much earlier stage than their black counterparts, even if only in a part-time capacity. Early linkage into the labour market is likely to reduce the probability of futureunemployment (Arulampalam et. al., 2000). After the age of 30 the age profiles are remarkablysimilar, with a gradual decline occurring around the age of 55 for all four groups.Figure 5.3 plots the participation-cohort effects, which show that — unlike the participation
pattern over the life cycle — the generational experiences of the various race and gender groupsdiffered markedly. Amongst the oldest birth cohorts, it is clear that male participation is much higherthan female participation (for both races) and that black participation is slightly lower than whiteparticipation (for both genders). Two trends are discernable from the cohort effects. Firstly, for thosecohorts born before 1975 (aged 20 in 1995) the female participation rates converged on those of malesfor both racial groups. This occurred due to a very gradual increase in participation across morerecently born male cohorts, whereas the younger female cohorts experienced a more rapid increasein participation. This reflects the feminisation of the labour market over these generations (Casale& Posel, 2002). Secondly, whereas these increases appear to level off for white men and women bornafter 1975, the participation rates for black men and women born between 1975 and 1982 acceleratesomewhat, with some stabilisation for those born after 1982. The youngest generations of blacks forthe first time have higher participation rates than their white counterparts, signifying a clear shiftin labour supply decisions among this group. These groups represent labour market entrants (age20) in the period 1995 to 2002, who are the first cohorts to be affected by the implementation of theover-aged schooling policies. Subsequent sections expose this effect more clearly.The participation-year effects are plotted in figure 5.4, and show that participation increased
between 1995 and 2000 and decreased subsequently. Similarly to the case of unemployment, theexperience of the white population is less sensitive to changes in the business cycle. This stabilitycontrasts with the greater volatility experienced particularly by black females, who are most likelyto exit the labour market in upswings. These groups are most likely comprised of “added workers”.Figure 6 reports the results of the employment rate decomposition. Figure 6.1 reveals that
the probability of being employed is inversely U-shaped over the life cycle for all groups, but thatthese rates are generally the highest for white men, the lowest for black women and more moderate
17

for black men and white women. The employment-age effects in figure 6.2 partly reproduce thelife-cycle pattern observed in figure 6.1, but now also reveal important distinctions between thedifferent race and gender groups. The early-life increase in employment is more rapid for white menand women than the more gradual and much more gradual increases observed for black men andwomen respectively. The early employment experience of the white groups therefore matches theirparticipation profiles, suggesting that young whites enter the labour market early in response todemand for their skills. A higher peak in employment rates emerges for both white men and womencompared to black men and women. Although the employment probability declines at older agesfor all groups, this turning point and the rate of decline varies between the groups. Specifically, thisdecrease occurs earlier and more rapidly for black men than for any of the other three groups. Thecomposite picture suggests that the initially poor employment prospects for black women do notimprove much over the life cycle, while progression is distinctly possible for young white groups.The cohort trends (figure 6.3) also show very different patterns across race and gender. White
men experience a fairly stable employment-birth cohort profile, except for a slight increase across thegenerations born between 1930 and 1950, and a marginal decrease for those born after 1975. Morerecent white women entrants, on the other hand, show an increasing probability of being employed,so that the male and female employment rates converge for the white population group. Althoughthis gender convergence can also be observed for the black population group, this occurs due to astable black female cohort profile combined with a decreasing employment trend for more recentlyborn black males. Therefore, while gender convergence results within both population groups, racialdivergence in absorption has occurred for the youngest generations.Finally, figure 6.4 shows the employment-year effects from the decomposition. The year effects
for black men and, to a lesser degree, black women decrease greatly between 1995 and 1997 (despiteincreased capturing of low-income employment over this period), followed by a period of relativestability before starting to increase at an accelerating rate after 2004. The notion of “jobless growth”is therefore not a reality in South Africa. It is evident, however, that employment is less elastic tothe cycle than participation, so that most of the cyclicality in unemployment is driven by the latter.The employment-year effects for white workers show almost no trend, as with participation.The final decomposition is performed on the log of the real hourly wages, and presented in figure
7. Average hourly log wages are plotted in figure 7.1, and reveal that wages increase over the lifecycle, and are generally higher for white males and females than for black men and women. Figure7.2 plots the life cycle wage effects and shows that the average wage rate is a concave function of agefor all groups, increasing rapidly for young workers and more gradually for older workers. Wagesare higher for white men than for white women, whose wages are in turn higher than those of blackmen and women. The pattern of wage-cohort effects (figure 7.3) is relatively stable for all groups.More recent labour market entrants from all four groups experience a slightly higher wage relativeto older cohorts. This concurs with the results of Grün (2004) using only a short series of crosssections.The wage-year effects in figure 7.4 show that the wages of black men and women decreased
sharply before 2002 and increased rapidly thereafter. White wages reveal a similar time pattern,albeit with much less variation. Wages are, however, more closely related to the business cycle thanemployment, though with a lag. In the short run, therefore, the economy adjusted via changes inthe wage structure, while in the long run adjustments in employment appear more important. It isevident that wages have remained fairly rigid across generations, with differences between the racespersisting to the youngest generations. The surplus of black labour of the most recent generationshas not been accommodated by a decline in wages, but rather by falling employment rates.We now attempt to interpret the different components of the participation, employment and
wage decompositions, and offer some explanations for the observed patterns, as they relate to theincrease in the overall unemployment rate.Starting with the various age effects, employment and wages can be seen to follow a concave
life-cycle pattern which is consistent with Mincer’s (1962) theory of on-the-job training, but whereas
18

the employment likelihood levels off or even starts to decrease later in life, the expected wage ratedoes not decrease in age for any of the groups. One interpretation of this is that labour productiv-ity appears to increase rapidly early in the working life, before levelling off or even decreasing asworkers near retirement age. Downward wage rigidities, however, preclude wages from reflecting thisdecreasing productivity so that the burden of adjustment falls solely on employment. The increasedlabour market rewards to job search (early in the working life) also induce an increase in labourforce participation.There are important disparities between the shapes of these trends across the different groups,
however. The increase in the participation rate at young ages is more gradual for black men andwomen than for whites, suggesting that these groups take longer to leave the school system andto make the transition into the labour market4. This discrepancy is even more pronounced for theearly-life increase in employment, indicating that black workers take longer to be absorbed into theworkforce. This explains why the unemployment rate over the life cycle declines more slowly atearly ages for black than for white workers. Another important distinction between the groups isin the decline in labour productivity that occurs later in life; black men and women experience adecline in employment which occurs earlier in life than for white workers. This may well be due tothe fact that black workers are disproportionately represented amongst the less skilled occupationswhere labour productivity starts to decline at earlier ages. While the employment-age profiles of thedifferent groups follow very dissimilar patterns later in life, the participation-age profiles later in lifeare almost identical across groups. The share of individuals who express a desire to work remainshigh for all race and gender groups, but only starts to drop off around the late 50s. For whiteworkers the declines in participation and employment move in lock-step, so that older workers do notexperience a change in the probability of unemployment. For black workers, however, employmentstarts decreasing much earlier than participation, which increases the likelihood of unemploymentat older ages. It appears that wages do not adjust downward over the life cycle to reflect the declinein productivity. As a result, mismatch in labour supply and demand that occurs at older ages isaddressed by job shedding rather than wage reductions for the black population group.It was noted in section 4.2.1 that the cohort effects represented the largest component of the
variation in the unemployment rate, so that understanding the trends in the participation andemployment cohort effects are of particular importance. Two distinct trends emerge from the par-ticipation profiles. Firstly, for those individuals born between 1930 and 1975 there was a graduallyincreasing likelihood of participation for the more recent labour market entrants of all race andgender groups; this increase was sharper for women than for men. Secondly, black men and womenborn between 1975 and 1982 experienced a sudden additional surge in participation which levelledoff for those born after 1982. No similar effect is seen for white men or women.The first trend is almost certain to reflect the effect of increases in educational attainment across
cohorts, but may also represent slowly changing cultural norms and perceptions of employment, suchas the increasing acceptability for women to take up employment rather than engaging in householdproduction. This trend is consistent with Casale and Posel’s (2002) observation that the labourmarket has undergone a feminisation between 1995 and 1999, although this appears to be part of amuch longer trend. Many of the factors they use to explain the increase in participation for women —such as the decline in the marriage rate, and changes in household composition — may be importantin accounting for this first trend. These factors are, however, unlikely to explain the second moreshort-lived surge, given that these factors are bound to be of a slow-changing nature.The second trend is more difficult to account for. The removal of over-aged learners from the
school system, as discussed in section 2, presents the most credible explanation. When the Depart-ment of Education proposed this policy around 1996, the 1975-1982 birth cohorts would have beenin their late teens and early twenties and are therefore the group most likely to have been affected bythese regulations. This explanation also fits Ntuli’s (2007) finding that the increase in participation
4This result is driven particularly by older generations, where transition out of school was still slower for the blackpopulation compared to the scenario after the implementation of the “over-aged” policies.
19

is due to a change in how African women respond to being in younger age groups or completingdifferent levels of education. Additionally, the share of over-aged learners was much higher for blackthan for white learners, but not very different across genders, which also fits the race and genderdimensions of the second trend. The combination of these two processes explains why participationincreased more for African women than for any of the other groups, since this was the only group tohave been affected by both the long-term and short-term changes. In explaining the sudden increasein unemployment during the late 1990s, it is the first trend, which occurred at exactly the same timeas the school system reform, that is likely to be more important.The shift towards greater labour market participation has not, however, coincided with a decrease
in wages across cohorts. More recent labour market entrants from any of the four groups couldexpect to earn roughly the same formal sector wages (on average) than older generations. Theemployment cohort effects for black men showed a steady decline in the employment probability formore recent labour market entrants. This suggests that black men from younger cohorts faced adecrease in the demand for their services, while simultaneously also increasing their labour supply.The fact that wages for this group were more or less stable across generations suggests that labourmarket institutions precluded a wage decrease from facilitating the absorption of participants intothe ranks of the employed. All of these factors combine to deliver a much higher probability of beingunemployed for black males who entered the labour market more recently. The employment-cohorteffects for black women were more or less constant across generations, but combined with the rapidincrease in the participation amongst more recently born cohorts, the likelihood of being unemployedrose dramatically. The employment-cohort effects also show a strong increase for white women anda mild increase for men, which corresponds to the participation-cohort effects. Younger white menand women therefore find themselves in a very similar position to older cohorts, both in terms oftheir wages and probability of being unemployed. This suggests that sufficient absorption allowedthe white labour market to clear at wages consistent with those of previous generations. A similarwage trend in the black labour market however, precluded the labour market from clearing.The trend of decreasing demand for younger black male workers and a stable demand for younger
black female workers is surprising in light of the increased years of education attained by theseyounger cohorts. The explanation may, however, lie in understanding how this increase was spreadacross cohorts. Recent generations of black men and women are much better educated on average,and the proportion of black men (over the age of 20) who have matric as their highest qualificationincreased from 3% of those born in the 1930s, to 29% of those born in the 1980s (1% and 27%respectively for black women). The increase in the share of black workers who have completeda university degree has been much smaller, however; from 0.4% of black men born in the 1930sto 2.3% born in the 1980s (0.3% and 2.1% of black women). Banerjee et al. (2007) show thatsince 1995 the demand for labour changed to favour graduates, while the demand for those witha completed secondary education or less decreased. The data we have cannot distinguish whetherthis was the result of skill-biased technological change (which primarily benefited those with tertiaryqualifications), or whether the quality of a secondary education actually deteriorated over time.It does seem, however, that the increase in educational attainment achieved by the younger blackcohorts was not great enough given that labour demand had shifted to the highest skills categoriesat the same time. This section of the population “caught up” with the skill requirements thatwere standard for the previous generation, but the requirements expected of the new generation ofworkers had changed. Consequently, this resulted in a decrease in employment rates for youngerblack cohorts. Combined with the increase in participation rates and seemingly rigid wages, thisresulted in rising unemployment rates for more recent black labour market entrants.Finally, as was explained in section 3.3, the cyclical components reflect the response of the various
labour market outcomes to short-run changes in aggregate demand. In addition, these effects absorbany remaining differences in measurement across surveys. The latter are presumably small, giventhat some inconsistencies were removed by omitting informal sector workers from our definition of theemployed. The employment-year effects reveal a mild degree of pro-cyclicality, with all four groups
20

experiencing some increase in employment between 2001 and 20075. This responsiveness to the cycleis, however, not as sharp as for the participation profiles, which gives rise to cyclical unemploymentparticularly for the black cohorts. The effect of the over-capturing of employment in the 1995 OHSand possibly also the 1996 OHS can be observed clearly for black men, and to a lesser extent forblack women. It is therefore difficult to gauge how much employment actually decreased during theeconomic downturn. Substantial increases in employment are only visible from around 2004, almostfive years after the start of the economic upswing. It is possible that high hiring and firing costsmake it difficult or undesirable for firms to alter the sizes of their workforces unless the changesin aggregate demand cumulatively pass a required threshold for noticeable employment generationto occur. This notwithstanding the fact that, between 2001 and 2007, the employment-year effectsshow a more than seven percentage point increase for black men and a more than four percentagepoint increase for black women, which contradicts claims that accelerated economic growth does notlead to any significant employment gains in South Africa.The wage-year effects show that a very (perhaps implausibly) strong correlation between wages
and the business cycle exists. The wages of black men and women drop precipitously between 1995and 2002, before increasing even more rapidly until 2007. It is possible that some part of the initialdecrease in wages reflects the improved capturing of low-paid employment, although our omissionof the informal sector workers should have removed most of this bias. The wages of white workersalso move pro-cyclically, although the degree of change is smaller than for black workers. Theparticipation-year effects are expected to illustrate how workers respond to the cyclical fluctuationin wages and employment (as well as non-labour market income, which should presumably also bepro-cyclical). The participation rate of white males is more or less unaffected by business cyclefluctuations, whereas all other groups were more likely to enter the labour market in the downswing,while withdrawing again during the upswing. The labour supply of black women was the mostsensitive to changes in the cycle, followed by black men and white women. All of this suggeststhat the added worker hypothesis is more relevant in the South African labour market than thediscouraged worker hypothesis. Further, this impact is more likely to affect those living in householdswith lower incomes.
5 Decomposition of labour market outcomes, with controlsUp to this point, the parametric analysis has provided a description of the labour market experi-ences of different groups in different life phases, years and generations. This evidence has effectivelyhighlighted the linkages between supply and demand for different groups in explaining rising unem-ployment. The variation across groups and generations however, requires further explanation. Thissection introduces various control variables to the decompositions to explain some of the phenom-enon highlighted above. Should the generational profiles become more horizontal, this signals thatthe control variables introduced partially explain why labour market entrants born in different erashave such different experiences.Given that much of the most recent rise in unemployment can be attributed to the surge in
the participation rate (most notably for black individuals born after 1975), the focus of this sectionfalls on explaining intergenerational differences in participation patterns. We direct our attention tothe black subpopulation, since the most notable rises in unemployment and participation rates areregistered by this group. In particular, we test the hypothesis that recent labour market entrants’participation decisions are based on their higher educational attainment, lower marital rates (forfemales) and other changes in household structure, as suggested by Casale & Posel (2002). Femalesentering the labour market more recently are more likely to head households, are more educatedand less likely to be married, prompting increases in labour market attachment for these groups.
5This period was covered by the LFS, which has a consistent sampling design, so that this trend is more reliablethan the period prior to that.
21
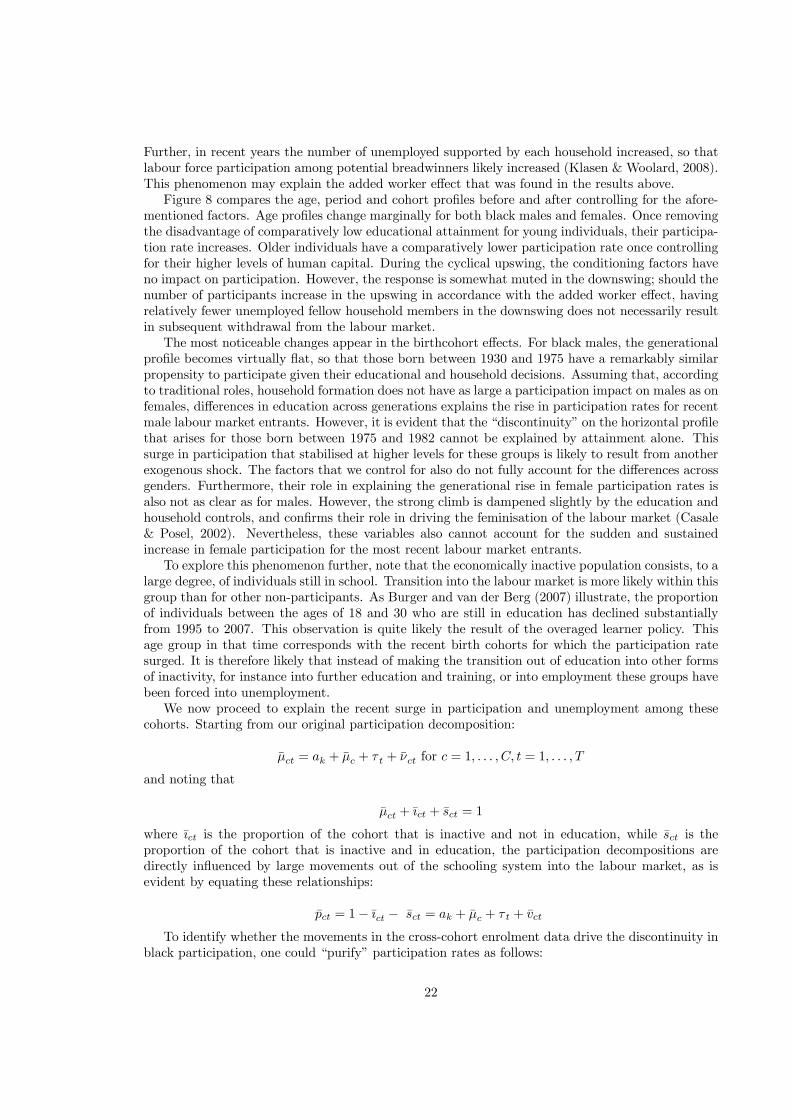
Further, in recent years the number of unemployed supported by each household increased, so thatlabour force participation among potential breadwinners likely increased (Klasen & Woolard, 2008).This phenomenon may explain the added worker effect that was found in the results above.Figure 8 compares the age, period and cohort profiles before and after controlling for the afore-
mentioned factors. Age profiles change marginally for both black males and females. Once removingthe disadvantage of comparatively low educational attainment for young individuals, their participa-tion rate increases. Older individuals have a comparatively lower participation rate once controllingfor their higher levels of human capital. During the cyclical upswing, the conditioning factors haveno impact on participation. However, the response is somewhat muted in the downswing; should thenumber of participants increase in the upswing in accordance with the added worker effect, havingrelatively fewer unemployed fellow household members in the downswing does not necessarily resultin subsequent withdrawal from the labour market.The most noticeable changes appear in the birthcohort effects. For black males, the generational
profile becomes virtually flat, so that those born between 1930 and 1975 have a remarkably similarpropensity to participate given their educational and household decisions. Assuming that, accordingto traditional roles, household formation does not have as large a participation impact on males as onfemales, differences in education across generations explains the rise in participation rates for recentmale labour market entrants. However, it is evident that the “discontinuity” on the horizontal profilethat arises for those born between 1975 and 1982 cannot be explained by attainment alone. Thissurge in participation that stabilised at higher levels for these groups is likely to result from anotherexogenous shock. The factors that we control for also do not fully account for the differences acrossgenders. Furthermore, their role in explaining the generational rise in female participation rates isalso not as clear as for males. However, the strong climb is dampened slightly by the education andhousehold controls, and confirms their role in driving the feminisation of the labour market (Casale& Posel, 2002). Nevertheless, these variables also cannot account for the sudden and sustainedincrease in female participation for the most recent labour market entrants.To explore this phenomenon further, note that the economically inactive population consists, to a
large degree, of individuals still in school. Transition into the labour market is more likely within thisgroup than for other non-participants. As Burger and van der Berg (2007) illustrate, the proportionof individuals between the ages of 18 and 30 who are still in education has declined substantiallyfrom 1995 to 2007. This observation is quite likely the result of the overaged learner policy. Thisage group in that time corresponds with the recent birth cohorts for which the participation ratesurged. It is therefore likely that instead of making the transition out of education into other formsof inactivity, for instance into further education and training, or into employment these groups havebeen forced into unemployment.We now proceed to explain the recent surge in participation and unemployment among these
cohorts. Starting from our original participation decomposition:
μct = ak + μc + τ t + νct for c = 1, . . . , C, t = 1, . . . , T
and noting that
μct + ıct + sct = 1
where ıct is the proportion of the cohort that is inactive and not in education, while sct is theproportion of the cohort that is inactive and in education, the participation decompositions aredirectly influenced by large movements out of the schooling system into the labour market, as isevident by equating these relationships:
pct = 1− ıct − sct = ak + μc + τ t + vct
To identify whether the movements in the cross-cohort enrolment data drive the discontinuity inblack participation, one could “purify” participation rates as follows:
22

pct = sct = 1− ıct = a0
k + μ0
c + τ0
t + v0
ct
where the prime signs indicate that the profiles differ with the new measure.By this assumption, we consider learners in school to have the same labour market status as
other participants. Given the high entry rates into the labour market following the completion ofschool, this assumption is not far-fetched. This construct should furthermore be consistent acrossgenerations (given that all other factors have not changed), provided that the sudden changes ob-served above have only resulted from the movement between these two statuses that are now groupedtogether. If this is indeed the case, then the change in enrolment policy would drive the surge inrecent participation rates.The new decomposition is equivalent to reclassifying non-participants who are currently in edu-
cation as economically active, yet not employed6. This approach is compared to simply introducinga control for the proportion of each cohort that is currently in education and not economically ac-tive7. This is equivalent to the procedure above and supposes that the coefficient of the enrolmentvariable should be -1:
pct = 1− ıct − sct = a0
k + μ0
c + τ0
t + v0
ct
Both approaches yield near-identical results, and the latter is presented here.Figure 9 is the result of adding a control (in addition to the variables accounted for in Figure 8)
for the proportion of non-participants currently in school. It is evident that we do indeed observecohort profiles that are consistent across all birth years. The participation discontinuity is thereforelikely to be driven by faster transitions from the schooling system into the labour market for youngergenerations. This suggests that the option of pursuing further education and training by overagedschool learners has been rejected in favour of entering the labour market. This has compounded thelongerterm effect of rising participation rates, so that this trajectory has intensified resulting in asustained higher level of participation for the most recent labour market entrants. In light of thefact that employment rates for this group have not increased proportionally, enrolment policies havehad the unintended side effect of swiftly adding a large group of individuals to an already steadilyincreasing job queue. For this reason, the current generation of youths does not only face higherunemployment as a result of its age or inexperience, but because of rapid exit from the educationsystem. This has contributed to some of the rise in unemployment in post-apartheid South Africa.This calls for a revision of the approach taken to deal with grade repetition in schools. More
pertinent however, is the question of how to attract overaged learners into FET colleges or anysuitable vehicle that allows them to be prepared for absorption into the workplace. The issue isnot really whether the job queue should be shortened by temporarily keeping individuals outside
6The presumption here is that individuals invest in education to obtain returns in the labour market. Hence, assoon as they exit the education system, they are likely to be re-classified immediately as unemployed participants.In this case the proportion of individuals who together make up both groups is the same across generations, and aconsistent trend should emerge, ceteris paribus. However, the transition from the one status to the other at an earlierage for later generations may artificially inflate the participation rate, whereas on an economic basis little has changedexcept that these individuals no longer attend school. The distinction between the two statuses is therefore onlydependent on timing and not necessarily on real movements in the labour market. This timing, however, is influencedmarkedly by enrollment policies.
7This approach does, however, pose a distinct danger of endogeneity bias, even for the age, period and cohortprofiles. This is because leaving the labour market potentially could initiate a return to the schooling attained, andvisa versa. No suitable instruments are available to account for this bias, and results showing how profiles changeare presented here for descriptive and not causal purposes. The cause we may wish to isolate by controlling for thisvariable is, however, exogenous, as the change in enrollment policy in 1996 is clearly not affected by individual labourmarket decisions. However, the data only starts in 1995, so that we do not have enough information on how quicklyolder generations (that were not affected by this policy) exited the schooling system. We do know that this coefficientshould be -1 based on the equations presented above. Indeed, all regressions yield a coefficient that is not statisticallydifferent from this figure, so that the equations may not be biased. The profiles shown here are therefore likely alsoto be unbiased by including this control.
23

the labour market and inside FET colleges. What is important is that once individuals leave theeducation system that they are equipped with skills relevant to the job market. Ideally, the processof exiting from the education system should not result in large cohorts of youths waiting in the jobqueue, but should instead produce more individuals who can be absorbed into the workplace.
6 ConclusionThe large comparative static literature has established firmly that longrun participation increasescoupled with relatively slower increases in the rates of absorption have driven the rising post-apartheid unemployment rate. This study is among the first that edges towards a dynamic viewusing micro data; this allows an inter-temporal perspective, while maintaining the ability to explainthe observed trends with household and demographic characteristics. The findings of the literatureare confirmed and extended in this context. In particular, we are able to distinguish between lon-grun and shortrun aspects of labour market status by implementing age, period and generationaldecompositions on a series of post1994 cross sections. The Deaton (1997) restriction on time coef-ficients supposes that they capture shortterm business cycle variation in labour market indicators,and other intertemporal impacts are absorbed across generational impacts (in the long term). Ifother assumptions about coefficient restrictions and the business cycle are made, it is possible thatthe split between the short and longrun variation may differ marginally.It is evident that under these assumptions, unemployment is indeed related to the business cycle.
A strong added worker effect is found for the black population, suggesting that in downswings indi-viduals are likely to enter the labour market, while returning to household production in upswings.On the demand side, cyclical employment creation is present in upswings (though not as robust asthe strong participation impacts). This refutes allegations of “jobless growth” — however the long lagin employment generation following the start of the upswing suggests that employers are hesitant totranslate their gains into more vacancies immediately. This underlines the notion that adjustmentcosts and labour market rigidity are high in South Africa.Turning to the long run, it is evident that younger generations among the black population
are suffering from higher levels of unemployment compared to older cohorts. This is explainedby a steady increase in labour force participation across generations, which converges to the samelevels as the white population. A similar pattern exists for white females, which is reflective ofthe changing gender roles overall. These increases are not matched by higher employment ratesfor more recent black entrants (though they are for white females). The most likely reason is thatdemand for largely unskilled black labour has declined over this period due to a changing structureof the economy. Unskilled workers that entered the labour market in the earlier half of the centuryhad a higher probability of being absorbed compared to those entering a labour market that hasbecome skills-biased. This growth in labour supply can be explained by the increase in educationalattainment for males, while changing household formation decisions also contribute for females.How then do higher education levels for these cohorts convert to sluggish absorption? It is
evident from the data that the retraining of the population has occurred more slowly than thechanging demand structure of the labour market — this suggests that the increases in educationalattainment have not yet been enough. For the most recent black labour market entrants, a strongsurge into unemployment can be explained by a demographic shift that has not yet been exposed atlength. In particular, overage education policies have forcefully sped up the transition from schoolinto the labour market since 1996. While these measures intended to relieve a schooling system thatwas overburdened by high repetition rates and teacher-pupil ratios, it has had the unintended effectof pushing a large cohort of individuals into the labour market perhaps prematurely. Given thatour analysis reveals that these particular cohorts have lower probabilities of finding employment, itis evident that large groups of individuals have been added to a long unskilledjob queue.The results of this study suggest that age is not necessarily the defining factor in South African
24

unemployment, but that the risks of being part of a particular generation of entrants could bemore decisive. If only age were important, the life cycle decline in unemployment would eventuallyalleviate the worst of the problem, suggesting that policy should be geared towards speeding upthis transitional phase. The potential solutions geared at youth would only require short-livedintervention, such as the proposed wage subsidy (Banerjee et. al., 2006). However, if particulargenerations are affected severely by high unemployment, it may be that this disadvantage followsthese groups throughout their working lives. This paper has revealed that structural issues are ofgreat importance. The large increase in the labour force that has not been appropriately trainedand pushed into the labour market by overaged school policies is of substantial concern. Retrainingthese individuals becomes essential and requires more long-term interventions to succeed in loweringunemployment among these cohorts.
References[1] Arulampalam, W., Booth, A., & Taylor, M. (2000). Unemployment Persistence. Oxford Eco-
nomic Papers, 52, 24-50.
[2] Asmal, K. (2003). Press Conference on FET Colleges By The Minister Of Education. Alexan-der Campus, Johannesburg. Available [Online]: http://www.polity.org.za/article/asmal-press-conference-of-fet-colleges-02062003-2003-06-02
[3] Baltagi, B. (2005). Econometric Analysis of Panel Data 3rd Edition. Chichester: John Wiley& Sons.
[4] Banerjee, A., Galiani, S., Levinsohn, J. and Woolard, I. (2006). "Why Has Unemployment Risenin the New South Africa?" CID Working Paper No. 134, Center for International Development,Cambridge, Massachusetts.
[5] Bhorat, H. and Leibbrandt, M., (1999). "Correlates of Vulnerability in the South African LabourMarket". DPRU Working Paper No. 99/27.
[6] Bhorat, H. and Hodge, J., (1999). Decomposing shifts in labour demand in South Africa, SouthAfrican Journal of Economics 67(3): 155-168.
[7] Branson, N. and Wittenberg, M. (2007). The measurement of employment status in SouthAfrica using cohort analysis, 1994-2004. South African Journal of Economics 75 (2): 313-326.
[8] Burger, R.P. and Van der Berg, S. (2007). "The sudden increase in the South African labourforce participation rate." Presented at SALDRU seminar, Cape Town, 11 September 2007.
[9] Burger, R.P. and Woolard, I. (2005). The state of the labour market in South Africa after thefirst decade of democracy. Journal of vocational education and training 57 (4): 453-476.
[10] Burger, R.P. and Yu, D. (2006). Wage trends in post-apartheid South Africa: Constructing anearnings series for South Africa from household survey data. Labour Market Frontiers 8: 1-8.
[11] Casale, D., and Posel, D. (2002). "The Continued Feminisation of the Labour Force in SouthAfrica: An Analysis of Recent Data and Trends." South African Journal of Economics 70(1):156-184.
[12] Deaton, A. (1985). Panel Data from Time Series of Cross-Sections. Journal of Econometrics,30, 109-126.
[13] Deaton, A. (1997). The Analysis of Household Surveys - A Microeconometric Approach toDevelopment Policy. Baltimore: Johns Hopkins University Press.
25

[14] Devey, R., Skinner, C. and Valodia, I. (2006). "Second Best? Trends and Linkages in the Infor-mal Economy in South Africa." DPRU Working Paper 06/102. Development Policy ResearchUnit, University of Cape Town.
[15] Guluza, X. and Hoadley, U.K. (1998). Learner Progress and Achievement Study: Researchreport 2 for the President’s Education Initiative by JET Education Services. Available [Online]:http://www.jet.org.za/publications/pei-research/001745.pdf
[16] Grün, C. (2004). Racial and Gender Wage Differentials in South Africa: What can Cohort Datatell? Available [Online]: http://www.wits.ac.za/sebs/downloads/cohort_data.pdf.
[17] Hsiao, C. (2003). Analaysis of Panel Data - Second Edition. Cambridge: The Press Syndicateof the University of Cambridge.
[18] International Monetary Fund (IMF) (2009). South Africa: 2009 Article IV Consultation–StaffReport. IMF Country Report No. 09/273, Washington: IMF.
[19] Inoue, A. (2005). Efficient Estimation and Inference in Linear Pseudo-Panel Data Models.Texas AandM University, Department of Economics, Spring Workshop. Available [Online]:http://econweb.tamu.edu/workshops/Econometrics/Atsushi%20Inoue.pdf
[20] Kingdon, G., and Knight, J. (2005). Unemployment in South Africa, 1995-2003: causes prob-lems and policies. Retrieved from Global Poverty Research Group Working Paper 010. Available[Online]:http://www.gprgorg/pubs/workingpapers/pdfs/gprg-wps-010.pdf.
[21] Kingdon, G., and Knight, J. (2006). The measurement of unemployment when unemploymentis high. Labour Economics 13(3): 291-315
[22] Klasen, S., and Woolard, I. (2008). Surviving Unemployment Without State Support: Un-employment and Household Formation in South Africa. Journal of African Economies 18(1):1-51.
[23] Lewis, J. (2001). Policies to promote growth and employment in South Africa. Paper presentedat the TIPS Annual Forum, Muldersdrift, 10-12 September 2001.
[24] Mlatsheni, C. and Rospabé, S. (2002). Why is Youth Unemployment so High and Unequallyspread in South Africa? DPRU Working Paper 02/65. Development Policy Research Unit,University of Cape Town.
[25] Mincer, J. (1962). On-the-Job Training: Costs, Returns and Some Implications. Journal ofPolitical Economy, 70(5) Part 2, S50-S79.
[26] Ntuli, M. (2007). Determinants of South African Women’s Labour Force Participation, 1995-2004. IZA Discussion Papers 3119, Institute for the Study of Labor, University of Bonn.
[27] Oosthuizen, M. and Bhorat, H. (2005). The post-apartheid South African labour market DPRUWorking Paper 05/093. Development Policy Research Unit, University of Cape Town.
[28] Republic of South Africa, (1995).Meeting the Commitment to Free and Compulsory General Ed-ucation. Chapter 13. White Paper on Education and Training. Notice 196 of 1995. Departmentof Education. Available [Online]: http://www.education.gpg.gov.za/Legislation/White paperon Education and Training.pdf
[29] Seeking, J. and Natrass, N., (2006). Class, Race and Inequality in South Africa. Durban: Uni-versity of KwaZulu-Natal Press.
26

[30] South African Reserve Bank (SARB), (2006). Quarterly Bulletin — June 2006 No240. Pretoria:South African Reserve Bank.
[31] Verbeek, M., and Nijman, T. (1992). Can Cohort Data be Treated as Genuine Panel Data?Empirical Economics, 17, 9-23.
[32] Western Cape Education Department (WCED), (2003). Admission Of Over-Age Learners To Public Schools. Circular 0240/2003. Available [Online]:http://wced.wcape.gov.za/circulars/2003/e240_03.html
[33] Woolard, I. and Woolard, C. (2002). Wage dispersion in South Africa: household survey evi-dence, 1995-2003. HSRC Working Paper, Human Sciences Research Council.
27

Table 1 Cohort Structure ‐ whole population
Group Number of Observations after Aggregation (= #Cohorts x T)
Average Number of individuals per Cohort Observation
Minimum Number of individuals per Cohort Observation
Maximum Number of individuals per Cohort Observation
Number of Cohort observations constructed with less than 100 underlying individuals
Employment and Participation
663 1285.05 289 3593 0
Unemployment 663 788.51 26 1786 31
Table 2 Cohort Structure ‐ By race and gender
Group Number of Observations after aggregation by cohort (= #Cohorts x T)
Mean Number of individuals per Cohort Observation
Minimum Number of individuals per Cohort Observation
Maximum Number of individuals per Cohort Observation
Number of Cohort observations constructed with less than 100 underlying individuals
Employment and Participation
Black Male 663 449.48 66 1421 12 Black Female 663 530.92 118 1538 0 White Male 663 53.00 17 153 639 White Female 663 54.67 17 169 632
Unemployment Black Male 663 290.4087 12 696 116 Black Female 663 298.1508 6 703 142 White Male 663 40.66968 0 145 648 White Female 663 30.71795 0 91 663
28

Figure 1: Unemployment rate, by age, OHS 1995 and LFS 2007b
0
20
40
60
80
100
Une
mploymen
t rate (%
)
15 20 25 30 35 40 45 50 55 60 65
Age
1995 2007
Figure 2: Unemployment rate and formal sector unemployment rate, 1995‐2007
0
20
40
60
Une
mploymen
t rate (%
)
1995 1997 1999 2001 2003 2005 2007
Year
Formal unemployment rate Broadly defined unemployment rate
29
Figure 3: Unemployment decomposition, 1995‐2007
20
40
60
80
100
Une
mpl
oym
ent r
ate
(%)
15 20 25 30 35 40 45 50 55 60 65
Age
Figure 3.1: Unemployment rate, by cohort and age
20
40
60
80
100
Une
mpl
oym
ent r
ate
(%)
5 10 15 20 25 30 35 40 45 50 55 60 65
Age in 1995
FE estimator GMM estimator
Figure 3.3: Unemployment rate cohort effects
20
40
60
80
100
Une
mpl
oym
ent r
ate
(%)
15 20 25 30 35 40 45 50 55 60 65
Age
FE estimator GMM estimator
Figure 3.2: Unemployment rate age effects
-10
-5
0
5
10D
evia
tion
from
unem
ploy
men
t rat
e (%
)
1995 1997 1999 2001 2003 2005 2007
Year
FE estimator GMM estimator
Figure 3.4: Unemployment rate year effects
30

Figure 4: Unemployment decomposition, by race and gender, 1995‐2007
0
2040
60
80
100
Une
mpl
oym
ent r
ate
(%)
15 20 25 30 35 40 45 50 55 60 65
Age
Black male White male
Black female White female
Figure 4.1: Unemployment rate, by cohort and age
020406080
100
Une
mpl
oym
ent r
ate
(%)
5 10 15 20 25 30 35 40 45 50 55 60 65
Age in 1995
Black male White male
Black female White female
Figure 4.3: Unemployment rate cohort effects
0
20
40
60
80
100
Une
mpl
oym
ent r
ate
(%)
15 20 25 30 35 40 45 50 55 60 65
Age
Black male White male
Black female White female
Figure 4.2: Unemployment rate age effects
-10
-5
0
5
10D
evia
tion
from
unem
ploy
men
t rat
e (%
)
1995 1997 1999 2001 2003 2005 2007
Year
Black male White male
Black female White female
Figure 4.4: Unemployment rate year effects
31

Figure 5: Participation decomposition, by race and gender, 1995‐2007
0
2040
60
80100
Par
ticpa
tion
rate
(%)
15 20 25 30 35 40 45 50 55 60 65
Age
Black male White male
Black female White female
Figure 5.1: Particpation rate, by cohort and age
020
40
6080
100
Par
ticpa
tion
rate
(%)
5 10 15 20 25 30 35 40 45 50 55 60 65
Age in 1995
Black male White male
Black female White female
Figure 5.3: Particpation rate cohort effects
020406080
100
Par
ticpa
tion
rate
(%)
15 20 25 30 35 40 45 50 55 60 65
Age
Black male White male
Black female White female
Figure 5.2: Particpation rate age effects
-10
-5
0
5
10D
evia
tion
from
parti
cpat
ion
rate
(%)
1995 1997 1999 2001 2003 2005 2007
Year
Black male White male
Black female White female
Figure 5.4: Particpation rate year effects
32

Figure 6: Employment rate, by race and gender, 1995‐2007
0
2040
60
80100
Em
ploy
men
t rat
e (%
)
15 20 25 30 35 40 45 50 55 60 65
Age
Black male White male
Black female White female
Figure 6.1: Employment rate, by cohort and age
0
20
40
60
80
100
Em
ploy
men
t rat
e (%
)
5 10 15 20 25 30 35 40 45 50 55 60 65
Age in 1995
Black male White male
Black female White female
Figure 6.3: Employment rate cohort effects
020406080
100
Em
ploy
men
t rat
e (%
)
15 20 25 30 35 40 45 50 55 60 65
Age
Black male White male
Black female White female
Figure 6.2: Employment rate age effects
-10
-5
0
5
10
Dev
iatio
n fro
mem
ploy
men
t rat
e (%
)
1995 1997 1999 2001 2003 2005 2007
Year
Black male White male
Black female White female
Figure 6.4: Employment rate year effects
33

Figure 7: Log average real hourly wage rate decomposition, by race and gender, 1995‐2007
01234
Log
hou
rly w
age
rat
e
15 20 25 30 35 40 45 50 55 60 65
Age
Black male White male
Black female White female
Figure 7.1: Log hourly wage rate, by cohort and age
0
1
2
3
4
Log
hou
rly
wa
ge r
ate
5 10 15 20 25 30 35 40 45 50 55 60 65
Age in 1995
Black male White male
Black female White female
Figure 7.3: Log hourly wage rate cohort effects
0
1
2
3
4
Log
hou
rly w
age
rat
e
15 20 25 30 35 40 45 50 55 60 65
Age
Black male White male
Black female White female
Figure 7.2: Log hourly wage rate age effects
-.2
-.1
0
.1
.2D
evia
tion
from
log
hour
ly w
age
rate
1995 1997 1999 2001 2003 2005 2007
Year
Black male White male
Black female White female
Figure 7.4: Log hourly wage rate year effects
34

Figure 8: Participation decomposition, black population by gender, 1995‐2007. Controls: Proportion of cohort with primary education, secondary education, tertiary education, are
married, are household heads; Number of broadly unemployed in the household
0
2040
60
80100
Par
ticip
atio
n ra
te (%
)
15 20 25 30 35 40 45 50 55 60 65
Age
Black male Black female
Figure 8.1: Participation rate, by cohort and age
020
40
6080
100
Par
ticip
atio
n ra
te (%
)
5 10 15 20 25 30 35 40 45 50 55 60 65
Age in 1995
Black male with Black female with
Black male without controls Black female without controls
Figure 8.3: Participation rate cohort effects
020406080
100
Par
ticip
atio
n ra
te (%
)
15 20 25 30 35 40 45 50 55 60 65
Age
Black male with Black female with
Black male without controls Black female without controls
Figure 8.2: Participation rate age effects
-10
-5
0
5
10
Dev
iatio
n fro
mpa
rtici
patio
n ra
te (%
)
1995 1997 1999 2001 2003 2005 2007
Year
Black male with Black female with
Black male without controls Black female without controls
Figure 8.4: Participation rate year effects
35

Figure 9: Participation decomposition, black population by gender, 1995‐2007. Controls: Proportion of cohort with primary education, secondary education, tertiary education, are married, are household heads, are still in education; Number of broadly unemployed in the
household
0
2040
60
80100
Par
ticip
atio
n ra
te (%
)
15 20 25 30 35 40 45 50 55 60 65
Age
Black male Black female
Figure 9.1: Participation rate, by cohort and age
020
40
6080
100
Par
ticip
atio
n ra
te (%
)
5 10 15 20 25 30 35 40 45 50 55 60 65
Age in 1995
Black male with Black female with
Black male without controls Black female without controls
Figure 9.3: Participation rate cohort effects
020406080
100
Par
ticip
atio
n ra
te (%
)
15 20 25 30 35 40 45 50 55 60 65
Age
Black male with Black female with
Black male without controls Black female without controls
Figure 9.2: Participation rate age effects
-10
-5
0
5
10
Dev
iatio
n fro
mpa
rtici
patio
n ra
te (%
)
1995 1997 1999 2001 2003 2005 2007
Year
Black male with Black female with
Black male without controls Black female without controls
Figure 9.4: Participation rate year effects
36