Determining the Aging Performance of Vacuum Insulation...
89
Ryerson University Digital Commons @ Ryerson eses and dissertations 1-1-2012 Determining the Aging Performance of Vacuum Insulation Panels: Development of a Prediction Model Melissa Morlidge Ryerson University Follow this and additional works at: hp://digitalcommons.ryerson.ca/dissertations Part of the Construction Engineering Commons is esis is brought to you for free and open access by Digital Commons @ Ryerson. It has been accepted for inclusion in eses and dissertations by an authorized administrator of Digital Commons @ Ryerson. For more information, please contact [email protected]. Recommended Citation Morlidge, Melissa, "Determining the Aging Performance of Vacuum Insulation Panels: Development of a Prediction Model" (2012). eses and dissertations. Paper 1417.
Transcript of Determining the Aging Performance of Vacuum Insulation...
Ryerson UniversityDigital Commons @ Ryerson
Theses and dissertations
1-1-2012
Determining the Aging Performance of VacuumInsulation Panels: Development of a PredictionModelMelissa MorlidgeRyerson University
Follow this and additional works at: http://digitalcommons.ryerson.ca/dissertationsPart of the Construction Engineering Commons
This Thesis is brought to you for free and open access by Digital Commons @ Ryerson. It has been accepted for inclusion in Theses and dissertations byan authorized administrator of Digital Commons @ Ryerson. For more information, please contact [email protected].
Recommended CitationMorlidge, Melissa, "Determining the Aging Performance of Vacuum Insulation Panels: Development of a Prediction Model" (2012).Theses and dissertations. Paper 1417.
DETERMINING THE AGING PERFORMANCE OF VACUUM INSULATION PANELS: DEVELOPMENT OF A PREDICTION MODEL
By
Melissa Morlidge
Bachelor of Architectural Sciences
A thesis presented
to Ryerson University
in partial fulfilment of the
requirements for the degree of
Master of Building Science
In the program of
Building Science
Toronto, Ontario, Canada, 2012
© (Melissa Morlidge) 2012
(ii)
AUTHOR’S DECLARATION FOR ELECTRONIC SUBMISSION OF A THESIS
I hereby declare that I am the sole author of this thesis. This is a true copy of the thesis, including any required final revisions, as accepted by my examiners.
I authorize Ryerson University to lend this thesis to other institutions or individuals for the purpose of scholarly research.
I further authorize Ryerson University to reproduce this thesis by photocopying or by other mean, in total or in part, at the request of other institutions or individuals for the purpose of scholarly research.
I understand that my thesis may be made electronically available to the public.
(iii)
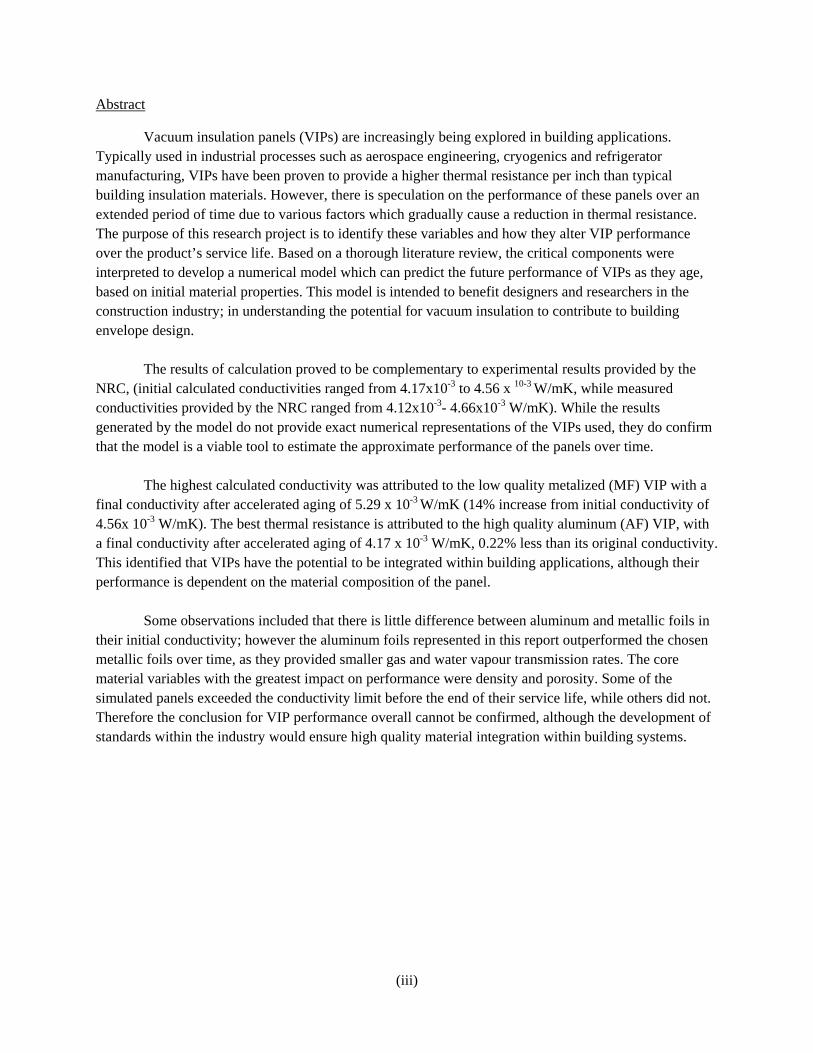
Abstract
Vacuum insulation panels (VIPs) are increasingly being explored in building applications. Typically used in industrial processes such as aerospace engineering, cryogenics and refrigerator manufacturing, VIPs have been proven to provide a higher thermal resistance per inch than typical building insulation materials. However, there is speculation on the performance of these panels over an extended period of time due to various factors which gradually cause a reduction in thermal resistance. The purpose of this research project is to identify these variables and how they alter VIP performance over the product’s service life. Based on a thorough literature review, the critical components were interpreted to develop a numerical model which can predict the future performance of VIPs as they age, based on initial material properties. This model is intended to benefit designers and researchers in the construction industry; in understanding the potential for vacuum insulation to contribute to building envelope design.
The results of calculation proved to be complementary to experimental results provided by the NRC, (initial calculated conductivities ranged from 4.17x10⁻³ to 4.56 x 10⁻³ W/mK, while measured conductivities provided by the NRC ranged from 4.12x10⁻³- 4.66x10⁻³ W/mK). While the results generated by the model do not provide exact numerical representations of the VIPs used, they do confirm that the model is a viable tool to estimate the approximate performance of the panels over time.
The highest calculated conductivity was attributed to the low quality metalized (MF) VIP with a
final conductivity after accelerated aging of 5.29 x 10⁻³ W/mK (14% increase from initial conductivity of 4.56x 10⁻³ W/mK). The best thermal resistance is attributed to the high quality aluminum (AF) VIP, with a final conductivity after accelerated aging of 4.17 x 10⁻³ W/mK, 0.22% less than its original conductivity. This identified that VIPs have the potential to be integrated within building applications, although their performance is dependent on the material composition of the panel.
Some observations included that there is little difference between aluminum and metallic foils in
their initial conductivity; however the aluminum foils represented in this report outperformed the chosen metallic foils over time, as they provided smaller gas and water vapour transmission rates. The core material variables with the greatest impact on performance were density and porosity. Some of the simulated panels exceeded the conductivity limit before the end of their service life, while others did not. Therefore the conclusion for VIP performance overall cannot be confirmed, although the development of standards within the industry would ensure high quality material integration within building systems.

(iv)
Acknowledgements
This research project would not have been completed without the assistance and expertise of my supervisor Dr. Hua Ge. I would like to express my sincere gratitude for her contribution in this project and the guidance she has provided in its successful completion.
I would also like to thank my co-supervisor, Dr. Phalguni Mukhopadhyaya for his collaboration and for inspiring this topic of research. His knowledge and involvement in this field have been essential in this topic’s development.
Thanks also go to Dr. Russell Richman for his input and critical review of this project.
Finally I would like to thank my friends and colleagues from Ryerson University for their continuous motivation and support. Many facets of this project can be attributed to lengthy discussions and criticisms provided on the topic amongst my peers.

(v)
Contents
1.0 Introduction 1.1 Objective 1.2 Vacuum Insulation Panels 1.3 Background Information on VIP Development & Advantages and
Disadvantages 1.4 Purpose and Scope of Research
1 3 5
2.0 Literature Review 2.1 Overall Conductivity 2.2 Core Material Properties 2.3 Outgassing of Core Material 2.4 Gaseous Diffusion and Permeability 2.5 Moisture Permeability and Water Content 2.6 Polymer Seals and Panel Joints 2.7 Thermal Bridging and Edge Losses 2.8 Assemblies vs. Individual Panels 2.9 Relative Humidity, Pressure and Time: Experimental Processes and
Prediction Models
6 10 12 16 21 22 26 29
3.0 Methodology 3.1 NRC Laboratory Testing 3.2 Explanation of Proposed Numerical Model
3.2.1 Evacuated Panel 3.2.2 Gas Transmission 3.2.3 Water Vapour Transmission 3.2.4 Moisture Accumulation
3.3 Assumptions and Excluded Variables 3.4 Categorization of Variables and Determination of Generic Properties
43 43 45 46 47 48 49 50 51
4.0 Results: Comparison of Excel Output to NRC Testing 4.1 Service Life Prediction 4.2 Potential for Future Research and Development
55 57 60
5.0 Conclusion 62 Appendices References
(vi)
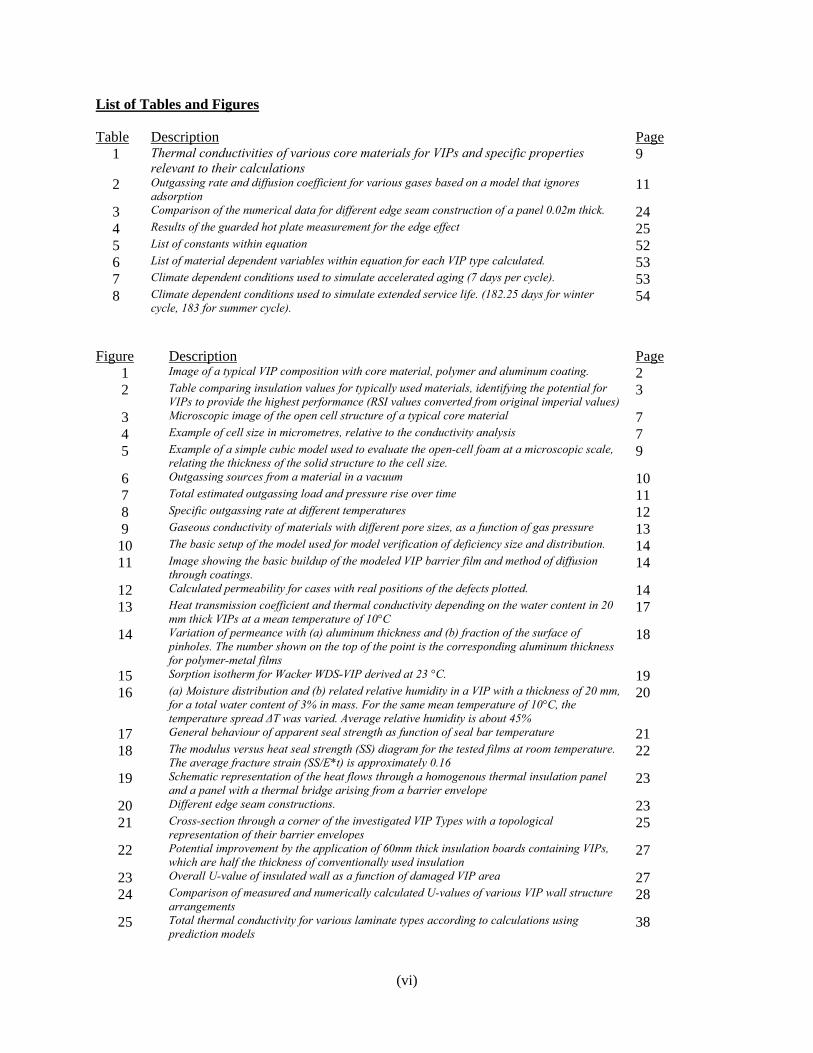
List of Tables and Figures
Table Description Page 1 Thermal conductivities of various core materials for VIPs and specific properties
relevant to their calculations 9
2 Outgassing rate and diffusion coefficient for various gases based on a model that ignores adsorption
11
3 Comparison of the numerical data for different edge seam construction of a panel 0.02m thick. 24 4 Results of the guarded hot plate measurement for the edge effect 25 5 List of constants within equation 52 6 List of material dependent variables within equation for each VIP type calculated. 53 7 Climate dependent conditions used to simulate accelerated aging (7 days per cycle). 53 8 Climate dependent conditions used to simulate extended service life. (182.25 days for winter
cycle, 183 for summer cycle). 54
Figure Description Page 1 Image of a typical VIP composition with core material, polymer and aluminum coating. 2 2 Table comparing insulation values for typically used materials, identifying the potential for
VIPs to provide the highest performance (RSI values converted from original imperial values) 3
3 Microscopic image of the open cell structure of a typical core material 7 4 Example of cell size in micrometres, relative to the conductivity analysis 7 5 Example of a simple cubic model used to evaluate the open-cell foam at a microscopic scale,
relating the thickness of the solid structure to the cell size.9
6 Outgassing sources from a material in a vacuum 10 7 Total estimated outgassing load and pressure rise over time 11 8 Specific outgassing rate at different temperatures 12 9 Gaseous conductivity of materials with different pore sizes, as a function of gas pressure 13 10 The basic setup of the model used for model verification of deficiency size and distribution. 14 11 Image showing the basic buildup of the modeled VIP barrier film and method of diffusion
through coatings. 14
12 Calculated permeability for cases with real positions of the defects plotted. 14 13 Heat transmission coefficient and thermal conductivity depending on the water content in 20
mm thick VIPs at a mean temperature of 10°C17
14 Variation of permeance with (a) aluminum thickness and (b) fraction of the surface of pinholes. The number shown on the top of the point is the corresponding aluminum thickness for polymer-metal films
18
15 Sorption isotherm for Wacker WDS-VIP derived at 23 °C. 19 16 (a) Moisture distribution and (b) related relative humidity in a VIP with a thickness of 20 mm,
for a total water content of 3% in mass. For the same mean temperature of 10°C, the temperature spread ΔT was varied. Average relative humidity is about 45%
20
17 General behaviour of apparent seal strength as function of seal bar temperature 21 18 The modulus versus heat seal strength (SS) diagram for the tested films at room temperature.
The average fracture strain (SS/E*t) is approximately 0.1622
19 Schematic representation of the heat flows through a homogenous thermal insulation panel and a panel with a thermal bridge arising from a barrier envelope
23
20 Different edge seam constructions. 23 21 Cross-section through a corner of the investigated VIP Types with a topological
representation of their barrier envelopes25
22 Potential improvement by the application of 60mm thick insulation boards containing VIPs, which are half the thickness of conventionally used insulation
27
23 Overall U-value of insulated wall as a function of damaged VIP area 27 24 Comparison of measured and numerically calculated U-values of various VIP wall structure
arrangements 28
25 Total thermal conductivity for various laminate types according to calculations using prediction models
38
(vii)
26 Internal pressure as a function of time and external pressure 39 27 Water content as a function of time and external pressure. 39 28 Acceleration effect of increased pressure, plotted for aging time up to 5 years. 39 29 Comparison of results from experiment with theoretical prediction. 40 30 Results of the accelerated aging effects on five VIP products, conducted by the NRC 44 31 Typical sections of envelope materials for VIPs. 51 32 Measured results provided by NRC of accelerated aging of 5 VIP products 55 33 Output Results from Excel calculation identifying six potential types of VIP materials 55 34 Output results from excel calculation demonstrated according to thermal resistance value
RSI, for panels 0.02m thick. 56
35 Output results of conductivity increase over 50 year time period. 57 36 Comparison of variables impacting conductivity increase in high quality aluminum foil 58 37 Comparison of variables impacting conductivity increase in average quality aluminum foil. 58 38 Comparison of variables impacting conductivity increase in lower quality aluminum foil. 59 39 Comparison of variables impacting conductivity increase in higher quality metalized foil. 59 40 Comparison of variables impacting conductivity increase in average quality metalized foil. 59 41 Comparison of variables impacting conductivity increase in lower quality metalized foil.
60
- 1 -
1.0 Introduction
Vacuum insulation panels (VIPs) are increasingly being explored as potential building materials, with properties that could significantly reduce energy consumption without increasing the thickness of building envelopes. VIPs have been proven to provide a higher overall thermal resistance per inch than typical building insulation materials (Mukhodpyhaha, 2011). However, this technology is relatively new in building applications and there is speculation on the performance of these panels over an extended period of time. There have been numerous studies and experimental measures by various parties to determine the properties of these materials and how they affect the building’s performance over time. Several numerical models have also been developed to predict the future performance of VIPs based on their changing properties of permeability and conductivity. However, many of these models make numerous assumptions, and focus on particular properties relevant to the outcome of the research conducted, disregarding other variables which may impact performance. There are few which holistically consider all the relevant properties of the material and how these properties change as the material is subjected to differing climatic conditions and time.
1.1 Objective
The objective of this research project is to combine the efforts of previously conducted analyses to determine the aging performance of VIPs by establishing a relationship between their initial thermal resistances and how those resistances change as the panels age. A prediction model would be a valuable tool to the construction industry in designing and specifying VIP materials based on an estimation of their future performance values, and the contribution of improved insulation materials to reduced energy consumption in buildings. Many of the studies explored in this report identified the need for industry to have a tool such as this, in order to fully take advantage of this technology in building applications. This paper aims to identify all the key variables which must be considered in the development of such a model, and assist in identifying gaps in existing models which can be improved to provide a more holistic understanding of VIP aging performance. Generic material properties will be determined in order to identify which variables have the greatest impact on long term performance.
1.2 Vacuum Insulation Panels
The concept behind vacuum insulation is to remove air from the insulation material, thus removing thermal energy losses via means of convection and conduction. Ideally radiation would be the only heat transfer mechanism contributing to thermal transfer in the assembly, and this transfer is significantly less in comparison to its two counterparts. There is also an attempt to reduce heat transfer via radiation through the use of metallic foils. The complication with this system is that the thermal resistance is dependent on the absence of air (vacuum) and solid materials, which is nearly impossible to accomplish at the scale of a building application. Various options have been explored in regards to a material composition which can support this concept, as no material that has been developed on a feasible construction scale is completely impermeable to leakage and diffusion. The use of vacuum insulation is relatively new to the building industry, but has been used for quite a while in industrial applications such as refrigeration, aerospace engineering, and cryogenics.
- 2 -
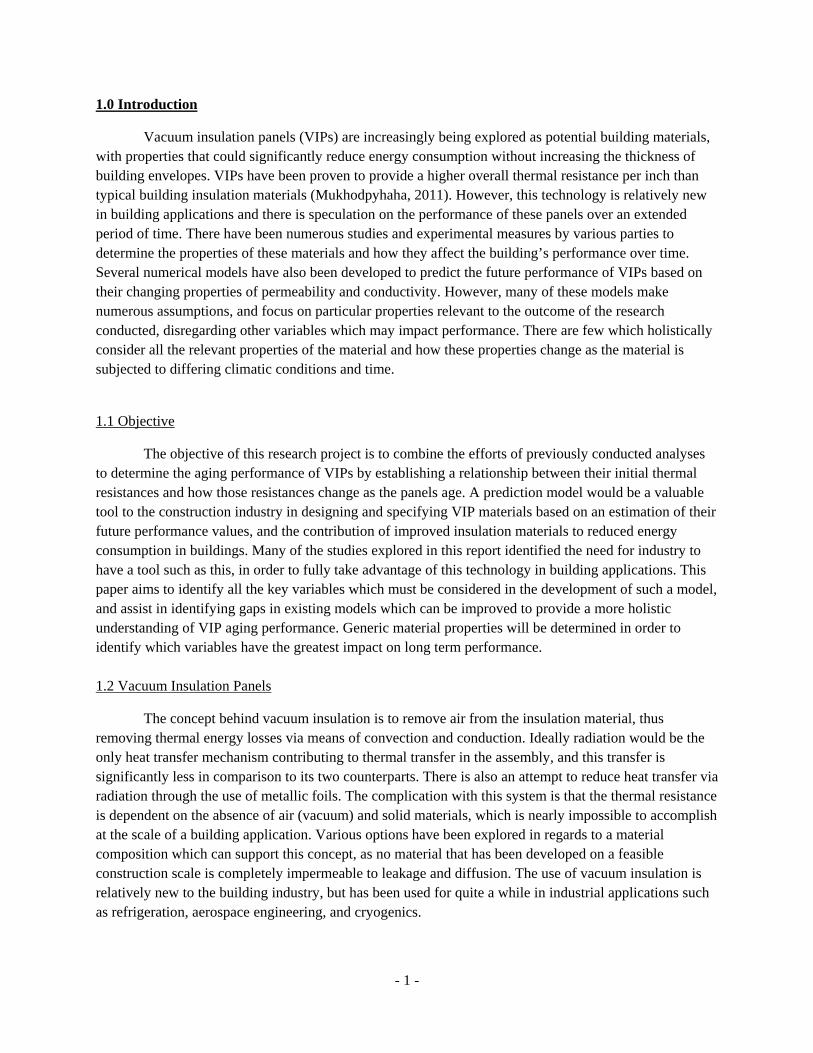
These systems consist of core insulation materials which are wrapped within an exterior metallic layer. The air inside this membrane is mechanically removed and then sealed to create the interior vacuum. VIPs typically consist of foam, powder and fiber insulation cores as these materials are porous, making it possible to evacuate air from the panels. This core must also be able to withstand atmospheric pressure in order to maintain the vacuum, without compression occurring within the panel (Kwon, 2009). The most common iteration of this system in use today, and the one most commonly proposed is a fumed silica core wrapped in a polymer based film and coated with metallic foils. Metallic foils differ from aluminum foils in that they use multiple layers of thin aluminum between polymers. Increasing the number of metal layers is meant to enhance the performance of the panel by providing increased durability.
Figure 1: Image of a typical VIP composition with core material, polymer and aluminum coating. (Emerald, 2012)
Presently, there are no standards to guide the fabrication of VIPs or the testing of their
performance. Typical practice which has been adopted by manufacturers is to fabricate panels ranging in thickness from 10-20mm, with either square or rectangular dimensions ranging from 10x10cm to 50x50cm. These dimensions are common as they have been adopted from the current use of VIPs in applications where these dimensions are ideal (i.e. refrigeration). There is also yet to be any standards in fabrication amongst VIPs of the same materials, meaning that VIPs made from polyurethane foam for example can have very different material properties based on the temperature and duration of the foaming process. These materials can also vary considerably based on the fabrication of metallic foils. These foils generally consist of layers with alternating adhesives and polymers which can greatly influence the overall performance of the panel (see sections 2.4 on gaseous diffusion and 2.5 on water permeability for detailed explanation).
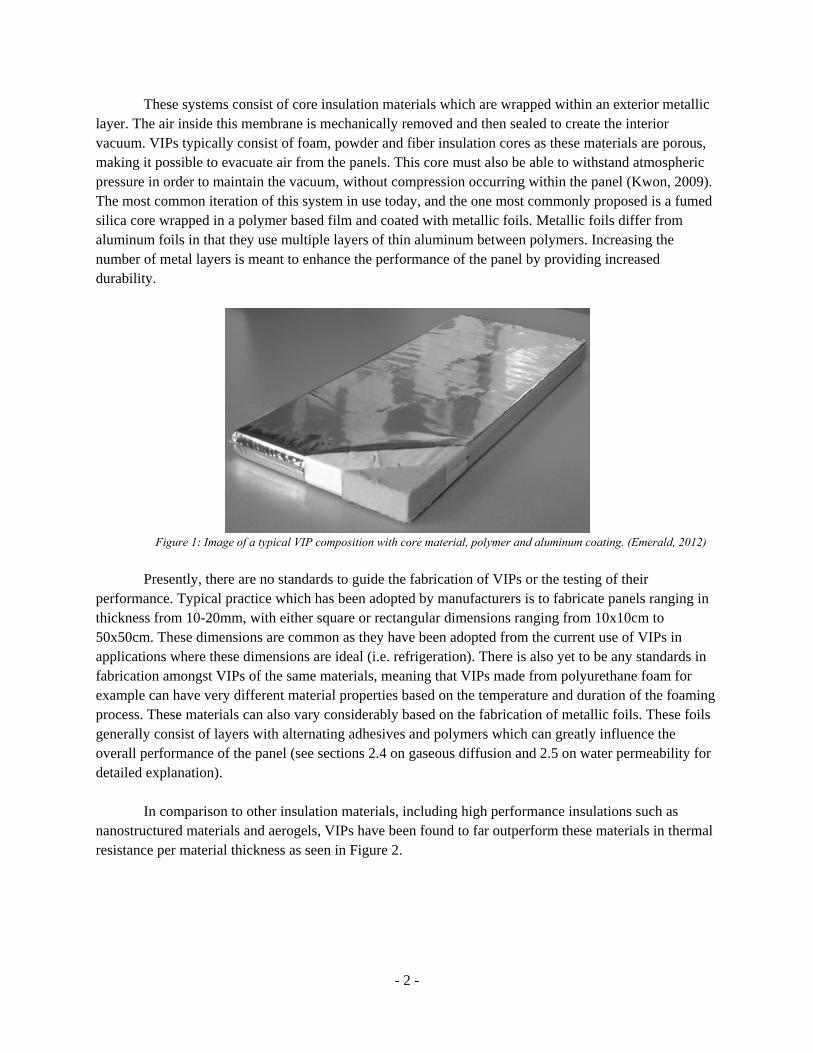
In comparison to other insulation materials, including high performance insulations such as
nanostructured materials and aerogels, VIPs have been found to far outperform these materials in thermal resistance per material thickness as seen in Figure 2.
- 3 -
Figure 2: Table comparing insulation values for typically used materials, identifying the potential for VIPs to provide the highest
performance (RSI values converted from original imperial values). (Mukhopadhyaya, 2011)
However, there are restrictions to this system’s ability to perform over time. The materials which
construct this system cannot be isolated from the surrounding climatic conditions, and are thus subject to deterioration. This compromises the integrity of the vacuum and thus compromises the thermal resistance of the insulation. For this reason, as the panels age their performance as a thermal insulation decreases. Thus, while Figure 2 identifies the initial thermal resistance of VIPs in comparison to other insulations, it does not accurately depict how the material will perform in building applications. The initial thermal resistance can be much higher than conventional materials; however the rate of change in thermal resistance is what dictates the valuable service life for VIPs.
1.3 Background Information on VIP Development & Advantages and Disadvantages
In North America, building envelopes are expected to provide a minimum service life of 25-50 years (Mukhopadhyaya, 2011). Since the performance of VIPs over an extended period of time cannot yet be confirmed in building applications, researchers are exploring different methods of predicting future performance in order to determine their ability to meet the minimum insulation standards over their service life. Research of this nature has been conducted, primarily in the form of physical experimental aging, with some theoretical knowledge and calculations to support measured findings. Many of these tests aimed to simulate rapid or accelerated aging processes, which expose panels to extreme variations of climatic conditions to accommodate for the time difference in testing. Theoretically, these tests can provide some notion of how panels would react to elongated exposure in more moderate conditions. This information can then be used to identify the potential for practical applications of VIPs in building assemblies.
In Canada, the primary driver of such research is the National Research Council of Canada. They participate in an annual conference with other researchers from Europe (primarily Germany and Switzerland) and Japan (Alam, 2011). In Europe, some VIPs have already been integrated into building applications to monitor holistic performance, while in Canada the products are still in research and development testing within laboratories (Simmler, 2005). Much of the technological innovation and
0.69
RS
Ip
ercm
1.39
2.08
2.77
3.47
4.16
4.85
- 4 -
implementation of this product is occurring in Europe, while Canada remains at an earlier stage within investigation. This is influenced by the difference in building codes and conventions between the two regions. In Europe where VIPs are being utilized more frequently in building applications, a lot of the construction consists of concrete forms, which VIPs can easily be adhered to. In Canada, the majority of the housing industry consists of wood frame construction, which requires different methods of application to assure minimal thermal bridging.
One of the main drivers behind the research and development of VIPs is their potential for increased thermal resistance. Buildings consume approximately 40% of national energy usage, primarily for heating and cooling (Mukhopadhyaya, 2011). By increasing the thermal resistance of a building envelope, one could reduce the amount of energy required to supply heating and cooling, thus reducing overall energy consumption in buildings, and thereby conserving energy resources and preventing environmental damage.
While there is speculation on the potential of VIPs in building applications, there are several anticipated advantages for their use. One is that the envelope thickness in a building could potentially be reduced (for example, in concrete construction) while increasing the thermal resistance, creating more usable space within building design. VIPs also have great potential in building retrofit as the reduced thickness allows for additional insulation to be used in an envelope, while potentially avoiding zoning restrictions that may be encountered with increasing wall thicknesses. By utilizing thinner panels, manufacturers can also save on material resources, producing less waste. Depending on the materials used to fabricate the panels, they can also be recyclable or made from recycled materials. These panels have a higher thermal resistance per inch than conventional insulations and minimize the heat transfer mechanisms to consider through a wall assembly.
There are also several disadvantages which can be associated with VIPs; many can be attributed
to the lack of knowledge in building applications. The first is the material can deteriorate over time depending on the exposure within the envelope, contact with other materials and quality of construction. (For example, leaky sealants cause excessive air leakage through the envelope which can affect the performance of the panels). Further to this, exposure to different climatic conditions can results in various rates of material degradation and panel failure. Another significant issue for the construction industry is the limitation of how this material is installed. Physical damage and punctures to the metallic barriers allows for pressure increase within the panels, compromising the vacuum and causing them to fail. Thus, there is risk during installation for damage and puncturing of panels (Grynning, 2010). There is also limitation in construction as the dimensions of the wall must accommodate the panel sizes or vice versa, as the panels cannot be conveniently trimmed to fit on site as other conventional materials can be. There are other issues which need to be addressed and considered during construction, such as panel assembly. Panels are commonly secured in building assemblies using adhesives and/or clip fasteners. Depending on the method of assembly, the configuration of panels, the joint type and spacing between panels can also have an impact on overall performance. In identifying these variables, it is possible to mitigate some of the effects of degradation, and improve the system’s long-term performance.
- 5 -
1.4 Purpose and Scope of Research
The purpose of this research is to thoroughly review studies which have been conducted in relation to the aging performance of VIPs and synthesize the results in an attempt to develop a numeric model which can then be utilized to predict the aging performance of a panel based on its relevant material properties. This calculation will focus on individual panel performance, and will not account for other factors such as assembly components. This particular analysis will also focus on utilizing information which has already been developed in the industry and can be confirmed by more than one source. This numeric model is being developed in collaboration with the NRC as they have experimentally tested panels within their facilities in Ottawa, ON. The results of these tests will be utilized to validate the model produced in this project.
This project will contribute to developing research around VIPs by synthesizing existing knowledge to simplify the prediction of future performance and to amalgamate experimental results to determine the generic material properties and variables of VIP products. The anticipated outcome of this research is a model which can approximate the aging performance of individual vacuum insulation panels, which can account for various climatic conditions and material properties. This tool can then be utilized to further research in the field of vacuum insulation, and identify the potential to advance testing to practical building applications.
- 6 -
2.0 Literature Review
Research has been conducted to investigate the methods currently being used by academics to quantify the performance values of vacuum insulation. It is evident through the various studies that there are a number of variables which impact the performance of VIPs, in varying degrees. Many of these studies segment the factors acting upon the VIPs, focusing on particular material properties and disregarding others. The aim of this literature review is to understand the purpose of these studies, analyze their findings and critically examine how these results are relevant for the holistic performance of the panel. Based on these academic publications, the following variables have been determined as the major factors influencing VIP performance.
2.1 Overall Conductivity
As an insulation material, the function of a VIP is primarily to resist heat flow. Therefore, the most critical variable in determining its value as insulation is to determine its overall conductivity, or the rate at which it transmits heat. It is critical to note that while the variables which quantify the performance of VIPs have been divided in this report, they are very much interconnected properties as a change in one will often have implications on the other properties as well. That said, each of these variables contributes to VIPs’ overall conductivity value. The general consensus amongst most studies is that the properties which contribute primarily to VIP performance include: core material properties, offgassing of core materials, gaseous diffusion and permeability, moisture permeability and water content, polymer seals and panel joints, thermal bridging and edge losses, and climatic conditions (relative humidity, pressure, temperature and time). Each of these variables plays a role in the VIPs ability to resist heat transfer through conduction, convection and radiation. It is important to note that the overall conductivity is the value which best encompasses all the variables holistically, as it accounts for the overall change in heat transfer over a given time.
2.2 Core Material Properties
There are a number of different core materials which have been utilized in vacuum insulation technology including powders, glass fibers, expanded polystyrene and fumed silica foams (Kwon, 2009). These materials can vary greatly in their performance as VIPs as they have different material properties. In this research project, the focus is on fumed silica as it is the commonly utilized and researched core material in this application (Baetens, 2010). The effective U value of VIPs is dependent on its ability to eliminate air from the core, while also minimizing solid conduction heat transfer. The way typical cores are fabricated is by injecting blowing agents into the fumed silica substance to create air pockets. In conventional application those air pockets (also referred to as cells) perform as the primary source of thermal resistance. In the case of VIPs, that air is evacuated from the cells in order to increase thermal resistance (Kwon, 2009). Open cell insulation (Figure 3) is used in VIP applications, as there is no access to remove air from closed cell structures (for example, extruded polystyrene would not be suitable). Open cell insulation materials are typically made by ensuring bubble growth from the injected blowing agents, followed by the cell wall thinning and breaking. Several analyses have been conducted to determine how the core structure contributes to the performance of the vacuum, and how core materials could be optimized during the fabrication process to ensure the maximum amount of thermal resistance.
- 7 -
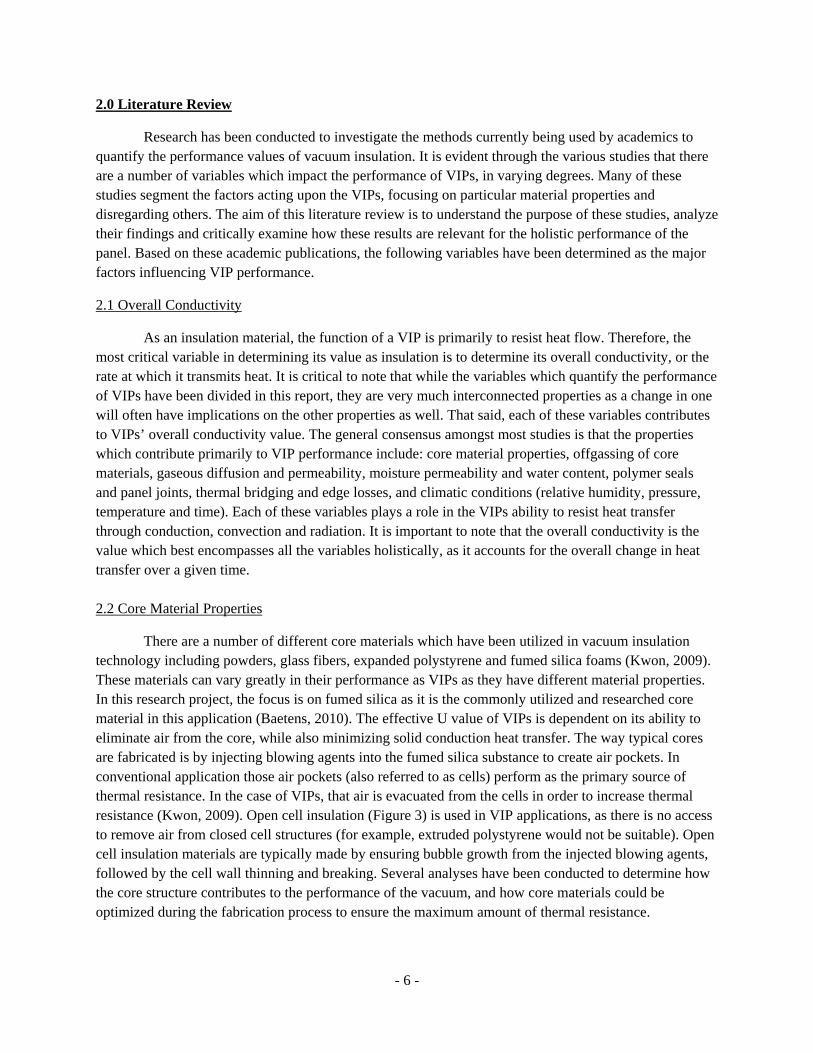
Tseng and Chu, from the Mechanical Engineering department at National Chiao Tung University, conducted a study which explores the variables which influence the radiative and conductive heat resistance properties of vacuum insulation based on the cell formation of the foam; focusing specifically on foam density, mean cell diameter, mean bead diameter and inter-bead porosity (Tseng and Chu, 2008). This analysis conducted experiments to measure the performance of 14 VIP samples with different broken and open cell structures, to evaluate the effect of cell geometry on heat transfer. This research goes into depth exploring the variables impacting performance based on cell structure, and developing various equations to represent these relationships. The results were categorized in two ways distinguishing lower and higher solid volume fractions, as the conductivity results ranged from 6.7x10⁻³ to 7.6x10⁻³ W/mK depending on the density of the foam (Tseng and Chu, 2008).
Figure 3: Microscopic image of the open cell structure of a typical core material (Tseng and Chu, 2008)
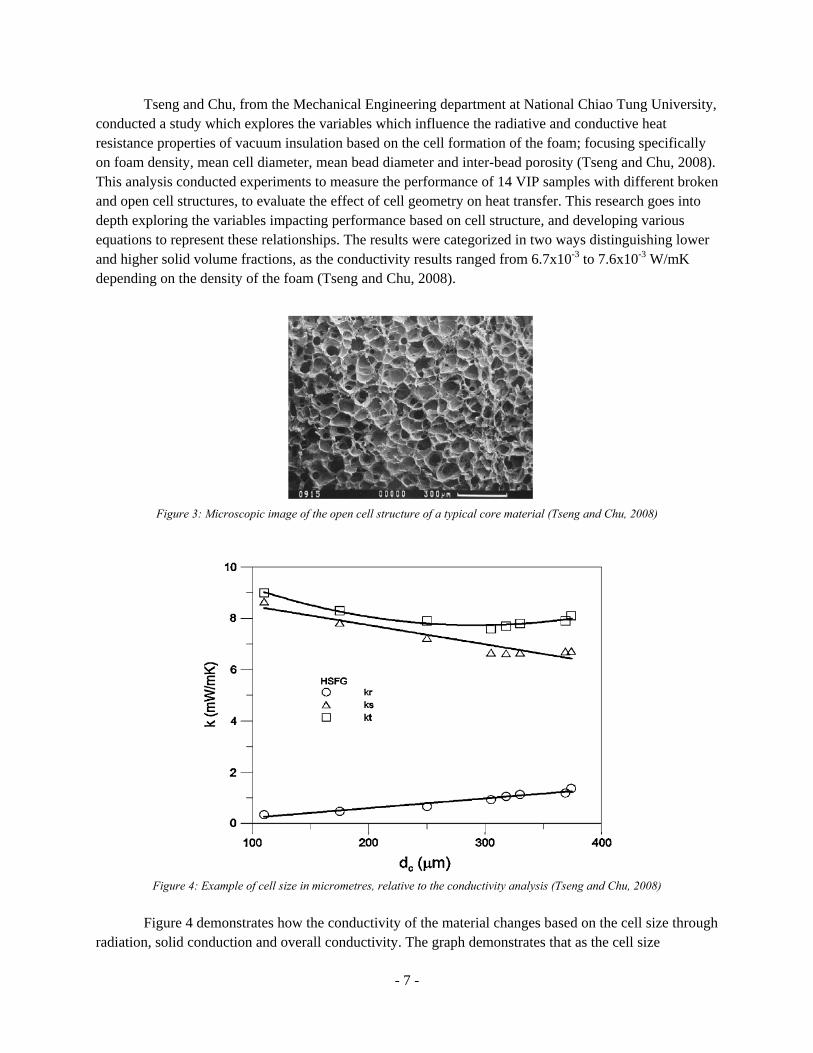
Figure 4: Example of cell size in micrometres, relative to the conductivity analysis (Tseng and Chu, 2008)
Figure 4 demonstrates how the conductivity of the material changes based on the cell size through radiation, solid conduction and overall conductivity. The graph demonstrates that as the cell size
- 8 -
increases, the total conductivity increasingly becomes dependent on radiative heat transfer, while the conductivity due to solid conduction decreases. This is ideal, because the conductivity caused by radiation has a smaller impact than solid conduction (solid conduction account for approximately 80% of total core conductivity (Tseng and Chu, 2009)). However, once the cell size surpasses 300µm, the total conductivity again begins to increase, implying that the ideal relationship between conduction and radiation can be achieved with a cell size between 100-300µm (Tseng and Chu, 2008). This is relevant to the study of aging performance, as the amount of evacuated air which returns to these voids will affect the thermal performance over time. Thus understanding the interior structure of the foam is crucial in understanding the potential conductivity of the panels.
Another study analyzed four combinations of polystyrene and polyethylene compound foams to determine the relationship between the foam’s density and foaming temperature, and how this relationship affects the overall performance of the material in a VIP (Wong and Tsai, 2006). The results of this analysis outlined the various temperatures at which the compounds foam and indicate that increasing the content of polyethylene within a composite can increase the foam density. This is critical in the analysis of aging performance as the properties of the foam content in VIP’s will alter the manner in which they resist heat. These differences may determine different behaviour over time. This study also demonstrated that a porous open-cell foam core can be achieved at higher foaming temperatures, resulting in a lower initial thermal conductivity, but potentially larger deficiencies due to failure over time. This study is comparable to another (Wong and Hung, 2008), which looked again at foam density, cell sizes and chemical ratios. The final result of these tests was that the higher density core materials reduced the overall conductivity. This is relevant to this study, as there are yet to be any established standards for core material manufacturing. Therefore, the more that is understood about which material compositions provide the best service life, the more focus can be directed on developing those materials. Tseng and Chu furthered their research to expand upon the first outlined method looking at broken cell ratio, heat transfer, average cell size and again solid volume fraction. The conclusion of this test outlined that adding 2% polyethylene to the product is the most effective combination to alter cell structure and reduce heat transfer (Tseng and Chu, 2009). It also indicated the 5% was the percentage where the material no longer improved, and should thus be considered the maximum additive necessary. The broken cell ratio of a material accounts for how many cells have physically broken within the material during the evacuation of air. The ratio primarily affects the amount of heat transfer via radiation, as a broken cell ratio which is too high is often accompanied by internal compression (causing cell walls to collapse on one another), while a broken cell ratio which is too low does not allow for sufficient evacuation of air. The cell size and broken ratio therefore control an optimum value to reduce radiative heat transfer, while the solid volume fraction is kept low to minimize conductive heat transfer. In this analysis, the results concluded that the lowest conductivity achieved was 4.4 mW/mK; which occurred with a broken cell ratio of 0.95 and a cell size of 170 µm. Kwon and colleagues utilized equations and numeric representations to determine the values of each heat transfer mechanism through the cell structures. This article can be used in reference to analyse the particular heat transfer mechanisms of these panels to validate the claims of the previous studies, and also to predict the changing conductivity values as the core cell structure changes over time (Kwon et al, 2009). The previous references utilized some calculations in order to validate their measured empirical
- 9 -
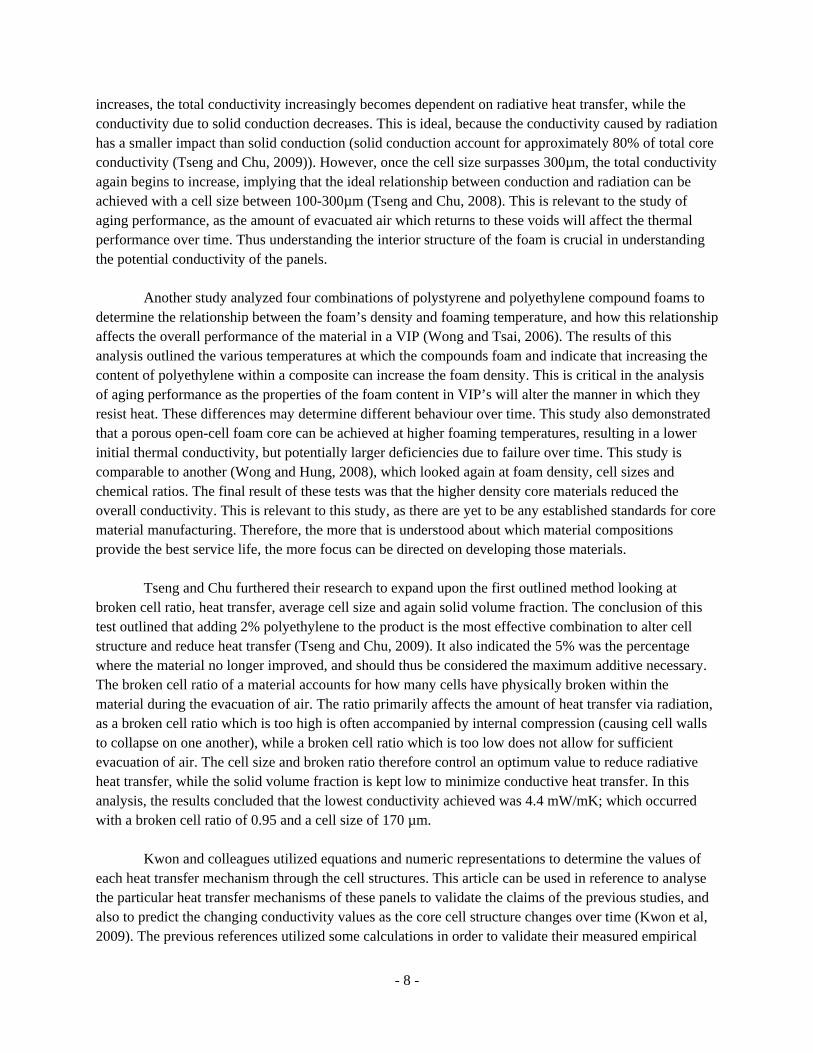
data, however this analysis differs as it relies primarily on theoretical knowledge to formulate equations. This study went into greater depth explaining the specific qualities of variables, whereas measured values can often account for such nuances. For example, the effect of porosity of the core in the previous studies was determined by taking an overall measurement of the panels and dividing it by other known factors, whereas this study went into microscopic depth (Figure 5), describing heat transfer at a cell-to-cell scale, before using these values to evaluate the core at a larger scale.
Figure 5: Example of a simple cubic model used to evaluate the open-cell foam at a microscopic scale, relating the thickness of
the solid structure to the cell size. (Kwon et al, 2009)
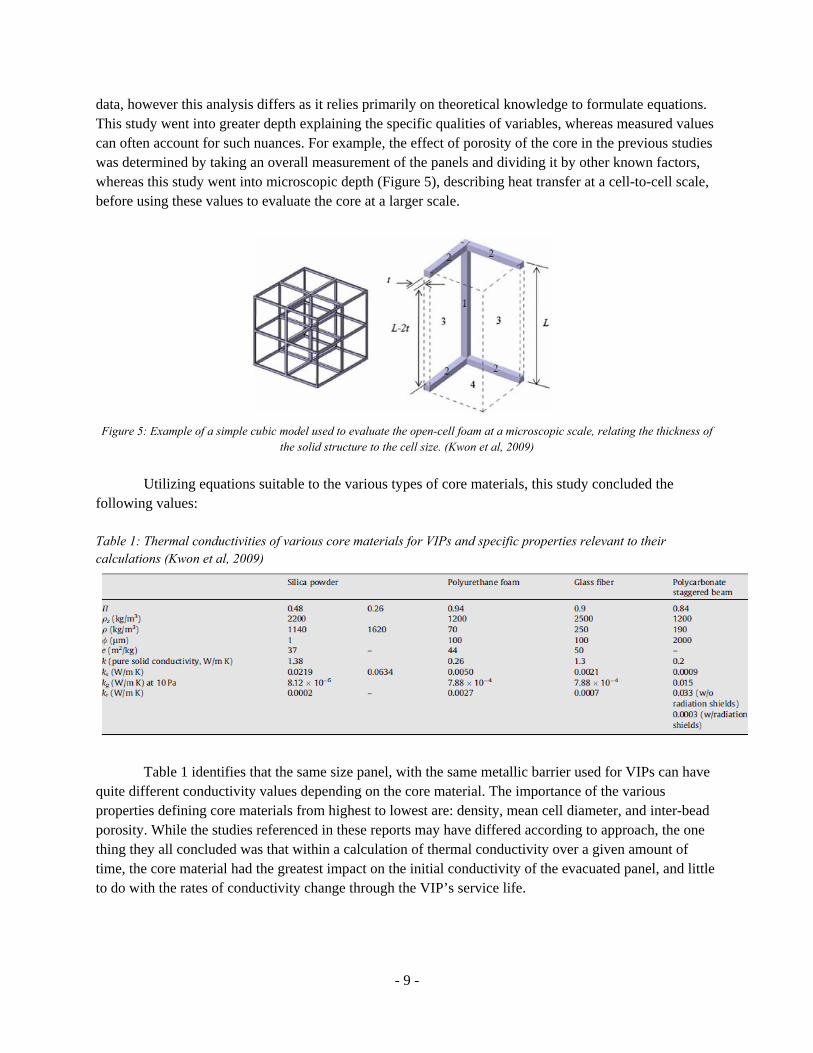
Utilizing equations suitable to the various types of core materials, this study concluded the following values: Table 1: Thermal conductivities of various core materials for VIPs and specific properties relevant to their calculations (Kwon et al, 2009)
Table 1 identifies that the same size panel, with the same metallic barrier used for VIPs can have quite different conductivity values depending on the core material. The importance of the various properties defining core materials from highest to lowest are: density, mean cell diameter, and inter-bead porosity. While the studies referenced in these reports may have differed according to approach, the one thing they all concluded was that within a calculation of thermal conductivity over a given amount of time, the core material had the greatest impact on the initial conductivity of the evacuated panel, and little to do with the rates of conductivity change through the VIP’s service life.
- 10 -
2.3 Outgassing of Core Material
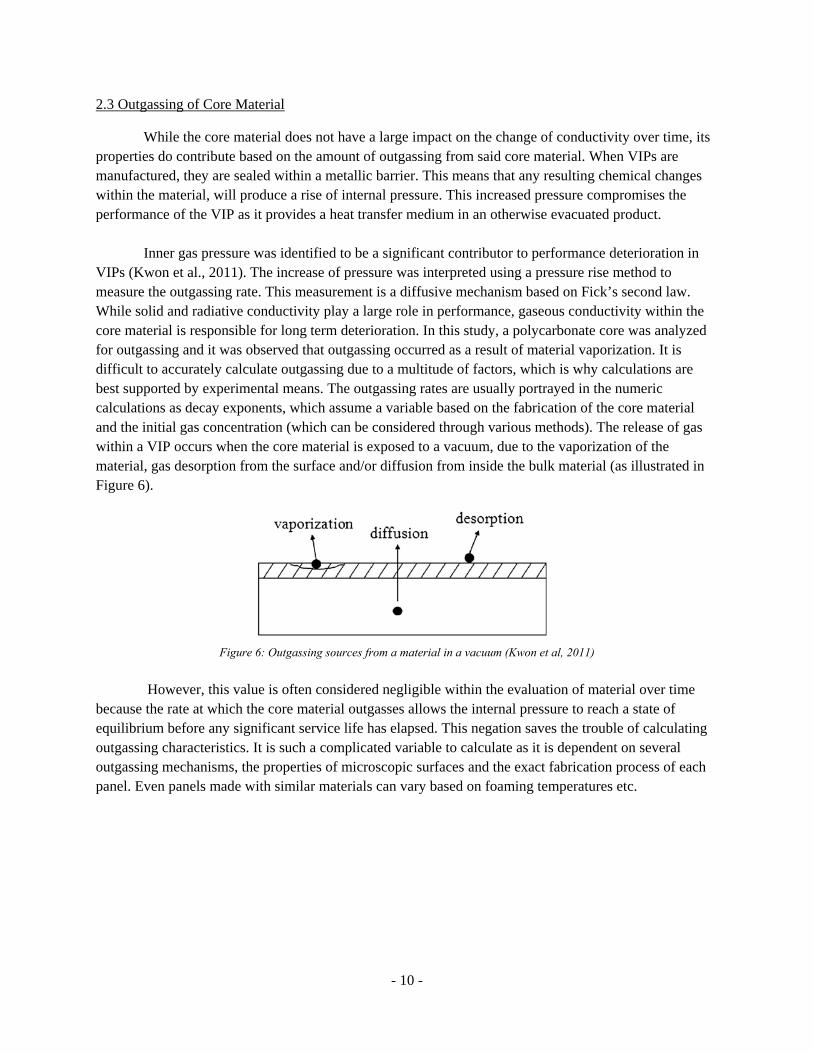
While the core material does not have a large impact on the change of conductivity over time, its properties do contribute based on the amount of outgassing from said core material. When VIPs are manufactured, they are sealed within a metallic barrier. This means that any resulting chemical changes within the material, will produce a rise of internal pressure. This increased pressure compromises the performance of the VIP as it provides a heat transfer medium in an otherwise evacuated product. Inner gas pressure was identified to be a significant contributor to performance deterioration in VIPs (Kwon et al., 2011). The increase of pressure was interpreted using a pressure rise method to measure the outgassing rate. This measurement is a diffusive mechanism based on Fick’s second law. While solid and radiative conductivity play a large role in performance, gaseous conductivity within the core material is responsible for long term deterioration. In this study, a polycarbonate core was analyzed for outgassing and it was observed that outgassing occurred as a result of material vaporization. It is difficult to accurately calculate outgassing due to a multitude of factors, which is why calculations are best supported by experimental means. The outgassing rates are usually portrayed in the numeric calculations as decay exponents, which assume a variable based on the fabrication of the core material and the initial gas concentration (which can be considered through various methods). The release of gas within a VIP occurs when the core material is exposed to a vacuum, due to the vaporization of the material, gas desorption from the surface and/or diffusion from inside the bulk material (as illustrated in Figure 6).
Figure 6: Outgassing sources from a material in a vacuum (Kwon et al, 2011)
However, this value is often considered negligible within the evaluation of material over time
because the rate at which the core material outgasses allows the internal pressure to reach a state of equilibrium before any significant service life has elapsed. This negation saves the trouble of calculating outgassing characteristics. It is such a complicated variable to calculate as it is dependent on several outgassing mechanisms, the properties of microscopic surfaces and the exact fabrication process of each panel. Even panels made with similar materials can vary based on foaming temperatures etc.
- 11 -
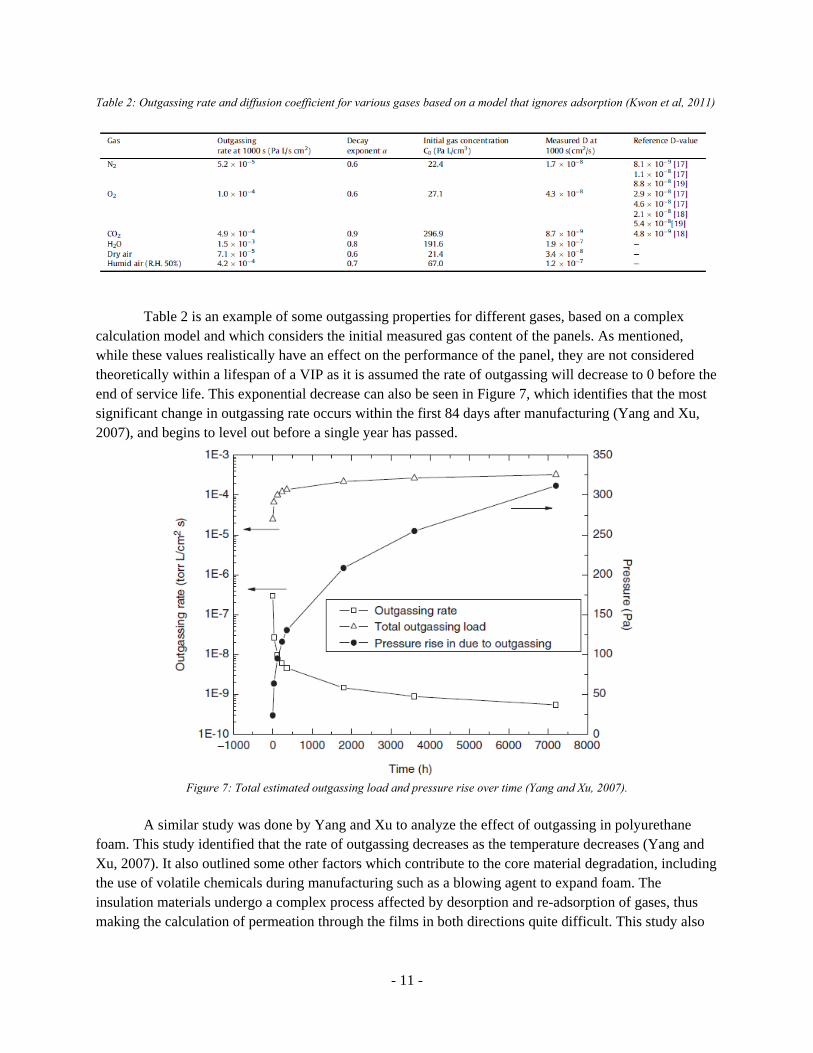
Table 2: Outgassing rate and diffusion coefficient for various gases based on a model that ignores adsorption (Kwon et al, 2011)
Table 2 is an example of some outgassing properties for different gases, based on a complex calculation model and which considers the initial measured gas content of the panels. As mentioned, while these values realistically have an effect on the performance of the panel, they are not considered theoretically within a lifespan of a VIP as it is assumed the rate of outgassing will decrease to 0 before the end of service life. This exponential decrease can also be seen in Figure 7, which identifies that the most significant change in outgassing rate occurs within the first 84 days after manufacturing (Yang and Xu, 2007), and begins to level out before a single year has passed.
Figure 7: Total estimated outgassing load and pressure rise over time (Yang and Xu, 2007).
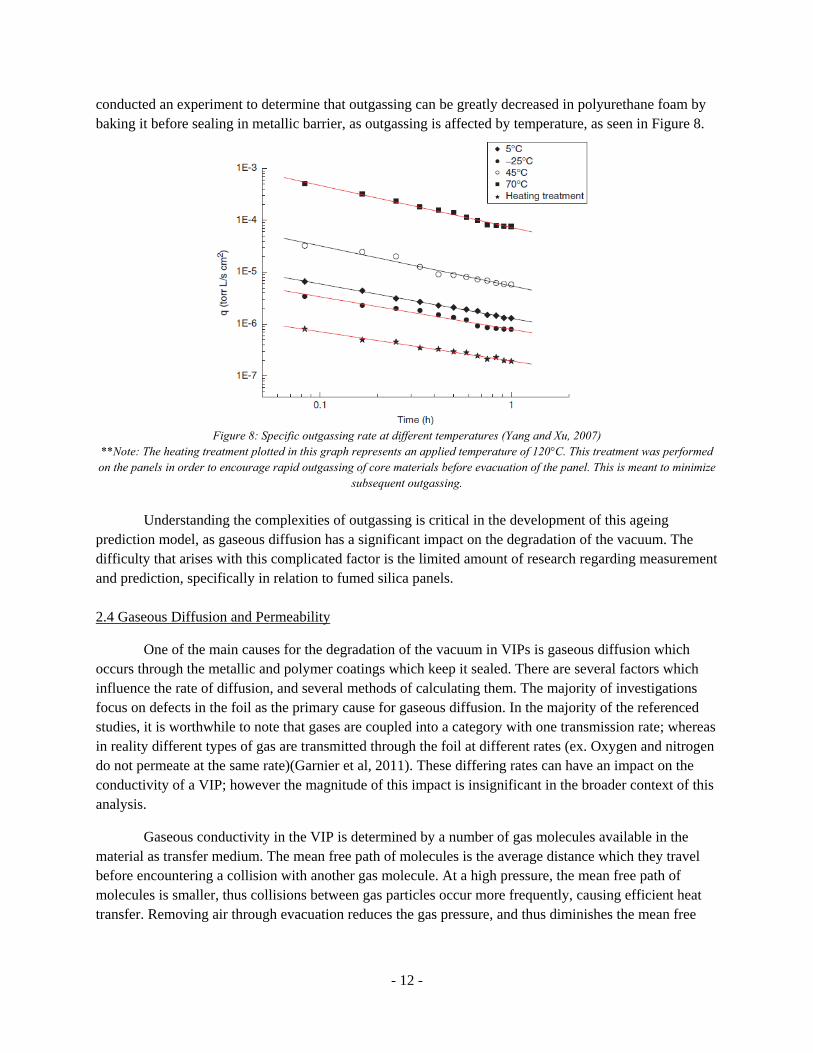
A similar study was done by Yang and Xu to analyze the effect of outgassing in polyurethane
foam. This study identified that the rate of outgassing decreases as the temperature decreases (Yang and Xu, 2007). It also outlined some other factors which contribute to the core material degradation, including the use of volatile chemicals during manufacturing such as a blowing agent to expand foam. The insulation materials undergo a complex process affected by desorption and re-adsorption of gases, thus making the calculation of permeation through the films in both directions quite difficult. This study also
- 12 -
conducted an experiment to determine that outgassing can be greatly decreased in polyurethane foam by baking it before sealing in metallic barrier, as outgassing is affected by temperature, as seen in Figure 8.
Figure 8: Specific outgassing rate at different temperatures (Yang and Xu, 2007)
**Note: The heating treatment plotted in this graph represents an applied temperature of 120°C. This treatment was performed on the panels in order to encourage rapid outgassing of core materials before evacuation of the panel. This is meant to minimize
subsequent outgassing.
Understanding the complexities of outgassing is critical in the development of this ageing prediction model, as gaseous diffusion has a significant impact on the degradation of the vacuum. The difficulty that arises with this complicated factor is the limited amount of research regarding measurement and prediction, specifically in relation to fumed silica panels. 2.4 Gaseous Diffusion and Permeability
One of the main causes for the degradation of the vacuum in VIPs is gaseous diffusion which occurs through the metallic and polymer coatings which keep it sealed. There are several factors which influence the rate of diffusion, and several methods of calculating them. The majority of investigations focus on defects in the foil as the primary cause for gaseous diffusion. In the majority of the referenced studies, it is worthwhile to note that gases are coupled into a category with one transmission rate; whereas in reality different types of gas are transmitted through the foil at different rates (ex. Oxygen and nitrogen do not permeate at the same rate)(Garnier et al, 2011). These differing rates can have an impact on the conductivity of a VIP; however the magnitude of this impact is insignificant in the broader context of this analysis.
Gaseous conductivity in the VIP is determined by a number of gas molecules available in the material as transfer medium. The mean free path of molecules is the average distance which they travel before encountering a collision with another gas molecule. At a high pressure, the mean free path of molecules is smaller, thus collisions between gas particles occur more frequently, causing efficient heat transfer. Removing air through evacuation reduces the gas pressure, and thus diminishes the mean free
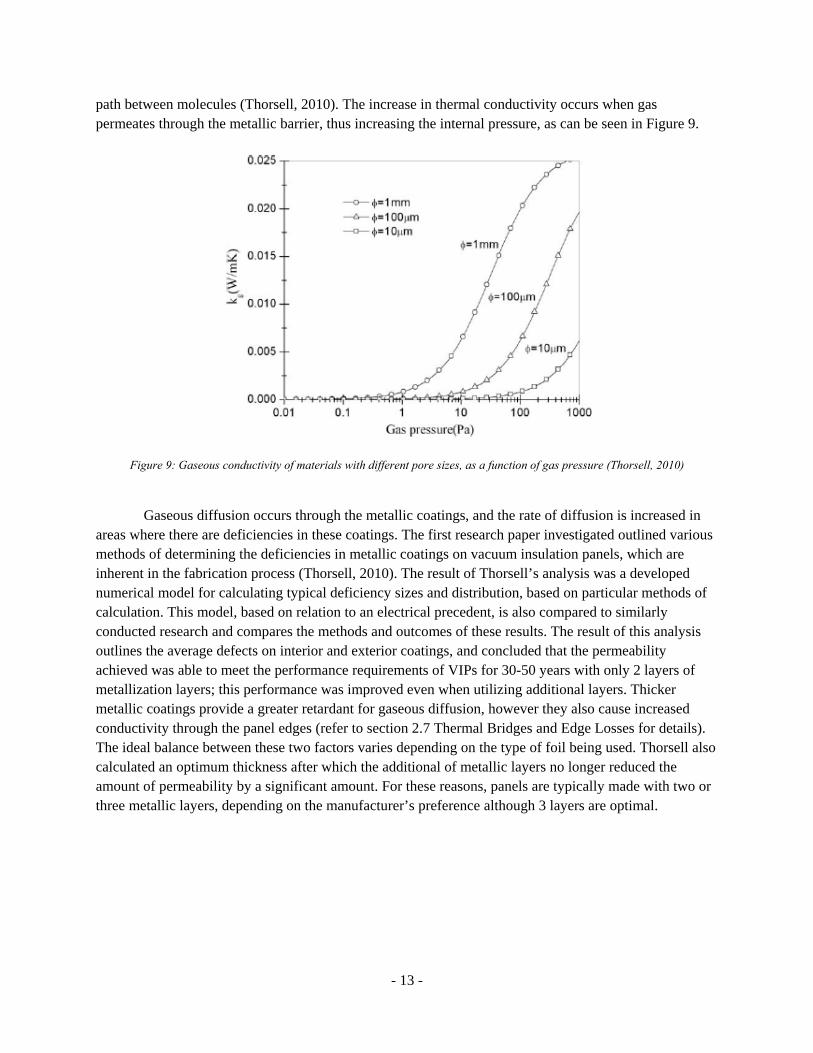
- 13 -
path between molecules (Thorsell, 2010). The increase in thermal conductivity occurs when gas permeates through the metallic barrier, thus increasing the internal pressure, as can be seen in Figure 9.
Figure 9: Gaseous conductivity of materials with different pore sizes, as a function of gas pressure (Thorsell, 2010)
Gaseous diffusion occurs through the metallic coatings, and the rate of diffusion is increased in
areas where there are deficiencies in these coatings. The first research paper investigated outlined various methods of determining the deficiencies in metallic coatings on vacuum insulation panels, which are inherent in the fabrication process (Thorsell, 2010). The result of Thorsell’s analysis was a developed numerical model for calculating typical deficiency sizes and distribution, based on particular methods of calculation. This model, based on relation to an electrical precedent, is also compared to similarly conducted research and compares the methods and outcomes of these results. The result of this analysis outlines the average defects on interior and exterior coatings, and concluded that the permeability achieved was able to meet the performance requirements of VIPs for 30-50 years with only 2 layers of metallization layers; this performance was improved even when utilizing additional layers. Thicker metallic coatings provide a greater retardant for gaseous diffusion, however they also cause increased conductivity through the panel edges (refer to section 2.7 Thermal Bridges and Edge Losses for details). The ideal balance between these two factors varies depending on the type of foil being used. Thorsell also calculated an optimum thickness after which the additional of metallic layers no longer reduced the amount of permeability by a significant amount. For these reasons, panels are typically made with two or three metallic layers, depending on the manufacturer’s preference although 3 layers are optimal.
- 14 -
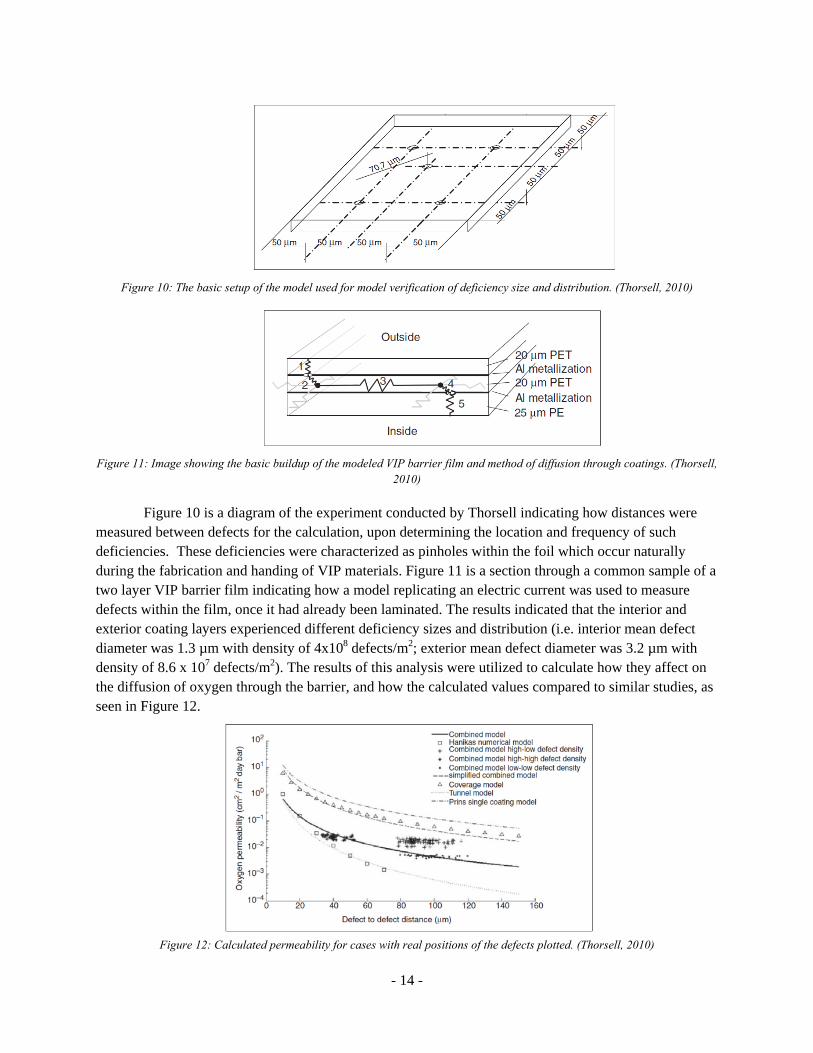
Figure 10: The basic setup of the model used for model verification of deficiency size and distribution. (Thorsell, 2010)
Figure 11: Image showing the basic buildup of the modeled VIP barrier film and method of diffusion through coatings. (Thorsell,
2010)
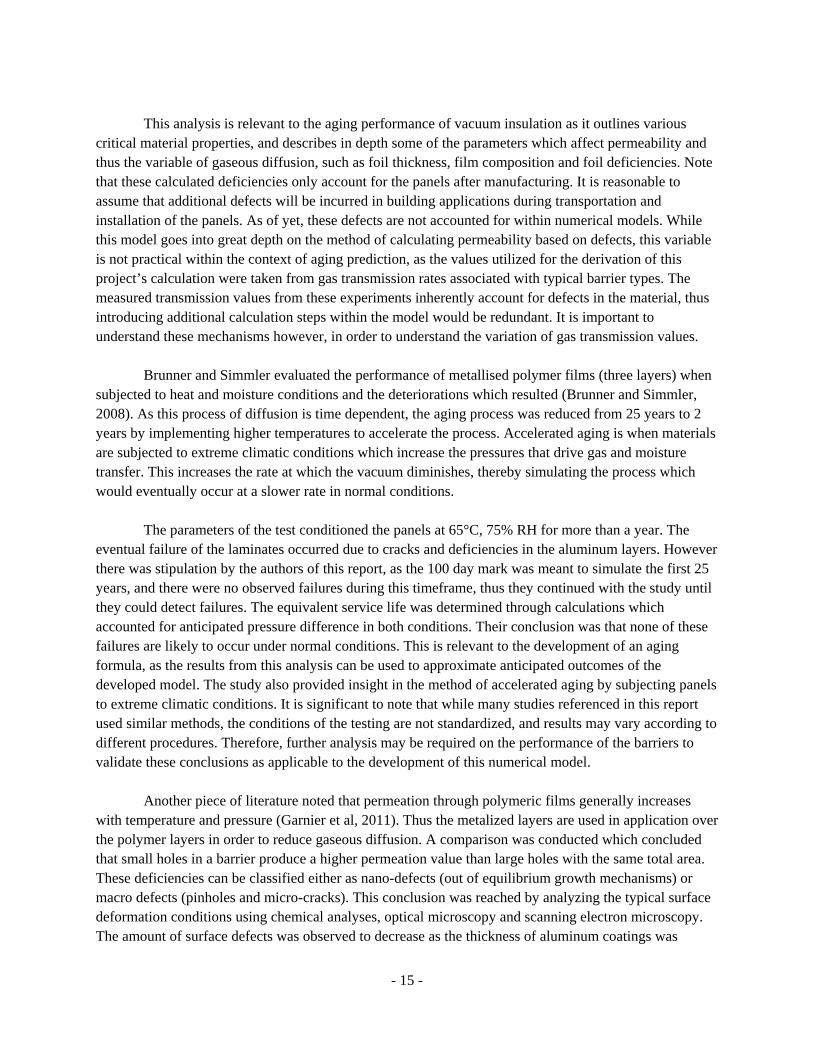
Figure 10 is a diagram of the experiment conducted by Thorsell indicating how distances were measured between defects for the calculation, upon determining the location and frequency of such deficiencies. These deficiencies were characterized as pinholes within the foil which occur naturally during the fabrication and handing of VIP materials. Figure 11 is a section through a common sample of a two layer VIP barrier film indicating how a model replicating an electric current was used to measure defects within the film, once it had already been laminated. The results indicated that the interior and exterior coating layers experienced different deficiency sizes and distribution (i.e. interior mean defect diameter was 1.3 µm with density of 4x10⁸ defects/m2; exterior mean defect diameter was 3.2 µm with density of 8.6 x 10⁷ defects/m2). The results of this analysis were utilized to calculate how they affect on the diffusion of oxygen through the barrier, and how the calculated values compared to similar studies, as seen in Figure 12.
Figure 12: Calculated permeability for cases with real positions of the defects plotted. (Thorsell, 2010)
- 15 -
This analysis is relevant to the aging performance of vacuum insulation as it outlines various
critical material properties, and describes in depth some of the parameters which affect permeability and thus the variable of gaseous diffusion, such as foil thickness, film composition and foil deficiencies. Note that these calculated deficiencies only account for the panels after manufacturing. It is reasonable to assume that additional defects will be incurred in building applications during transportation and installation of the panels. As of yet, these defects are not accounted for within numerical models. While this model goes into great depth on the method of calculating permeability based on defects, this variable is not practical within the context of aging prediction, as the values utilized for the derivation of this project’s calculation were taken from gas transmission rates associated with typical barrier types. The measured transmission values from these experiments inherently account for defects in the material, thus introducing additional calculation steps within the model would be redundant. It is important to understand these mechanisms however, in order to understand the variation of gas transmission values. Brunner and Simmler evaluated the performance of metallised polymer films (three layers) when subjected to heat and moisture conditions and the deteriorations which resulted (Brunner and Simmler, 2008). As this process of diffusion is time dependent, the aging process was reduced from 25 years to 2 years by implementing higher temperatures to accelerate the process. Accelerated aging is when materials are subjected to extreme climatic conditions which increase the pressures that drive gas and moisture transfer. This increases the rate at which the vacuum diminishes, thereby simulating the process which would eventually occur at a slower rate in normal conditions.
The parameters of the test conditioned the panels at 65°C, 75% RH for more than a year. The eventual failure of the laminates occurred due to cracks and deficiencies in the aluminum layers. However there was stipulation by the authors of this report, as the 100 day mark was meant to simulate the first 25 years, and there were no observed failures during this timeframe, thus they continued with the study until they could detect failures. The equivalent service life was determined through calculations which accounted for anticipated pressure difference in both conditions. Their conclusion was that none of these failures are likely to occur under normal conditions. This is relevant to the development of an aging formula, as the results from this analysis can be used to approximate anticipated outcomes of the developed model. The study also provided insight in the method of accelerated aging by subjecting panels to extreme climatic conditions. It is significant to note that while many studies referenced in this report used similar methods, the conditions of the testing are not standardized, and results may vary according to different procedures. Therefore, further analysis may be required on the performance of the barriers to validate these conclusions as applicable to the development of this numerical model. Another piece of literature noted that permeation through polymeric films generally increases with temperature and pressure (Garnier et al, 2011). Thus the metalized layers are used in application over the polymer layers in order to reduce gaseous diffusion. A comparison was conducted which concluded that small holes in a barrier produce a higher permeation value than large holes with the same total area. These deficiencies can be classified either as nano-defects (out of equilibrium growth mechanisms) or macro defects (pinholes and micro-cracks). This conclusion was reached by analyzing the typical surface deformation conditions using chemical analyses, optical microscopy and scanning electron microscopy. The amount of surface defects was observed to decrease as the thickness of aluminum coatings was
- 16 -
increased; however this addition of metallic coating also causes the effective conductivity to increase (as confirmed by previous references). A scanning electron microscope was also used in a study by Sutjipto (Sutjipto et al, 2008) to find deficiencies. The experiment works by charging and discharging metallic surfaces. The bombardment of electrons can be mapped and then interpreted to characterize and evaluate material properties. The durability of these coating materials is dependent on the aging process as the rate of diffusion decreases over time. Each of these articles outline various methods of measuring the potential for gaseous diffusion in VIPs, but the resultant values vary for different testing methods. For the development of a numerical model, the determining factors such as foil deficiencies and thickness should be considered in order to determine an accurate representation of diffusion. Many of these studies utilize experimentation as well as numerical modelling in order to conclude the overall gas transmission rates through various types of metallic barriers. For the development of aging prediction, this overall value is sufficient for calculation as the resultant will be an approximation of future performance, and not a completely accurate representation of the panel’s actual performance. 2.5 Moisture Permeability and Water Content
Water can have a significant impact on the conductivity value of a VIP. This water is perceived in two ways, either as liquid moisture accumulation within the material, or vapour diffusion through the membranes. It is important to understand that vapour diffusion does not necessarily behave according to the same mechanisms as gas, although they are often caused by the same driving forces (air pressure vs. water vapour pressure). While they often act in conjunction with one another, the rate of gaseous diffusion is not necessarily relative to the rate of vapour diffusion. It is also notable that the diffusion of these two factors occurs at different rates, and is not interchangeable values by any means. When considering moisture, there is also a difference between measuring the moisture content of the panel in liquid form, and the presence of water vapour in gas form. Liquid moisture and water vapour are inherently connected in their behaviour, however the state of moisture has an impact on the conductivity of the panel, and thus they are considered separately. Within the development of this prediction model, they are considered to be two separate phenomena which affect the aging performance, while in reality there are coupling effects which account for the transition from one state to another. However, these values are insignificantly small in comparison to other variables and are therefore negated in this report. Schwab lead a study on the water content in VIPs considered in relation to their performance, accounting for inherent water content and vapour diffusion through the panels (Schwab et al, 2005). Desiccants are often used in panels to mitigate moisture issues for certain materials; however fumed silica tends to absorb moisture, negating the necessity for an additional desiccant. Also, due to the longevity of the panel’s service life, a desiccant will delay the transfer of water but will not negate it. The amount of water bound in the panel can contribute to the thermal conductivity through latent heat transport. An experiment utilizing a hot plate apparatus was conducted to measure the thermal conductivity of VIPs when subject to various moisture loads. One side of the panel was heated to encourage vapour permeation for measurement, while the panel was loaded with increased amounts of liquid water to be absorbed between tests. This was done by encasing the panel within a glass enclosure with an increased temperature and relative humidity to produce larger pressure differences between the interior and exterior
- 17 -
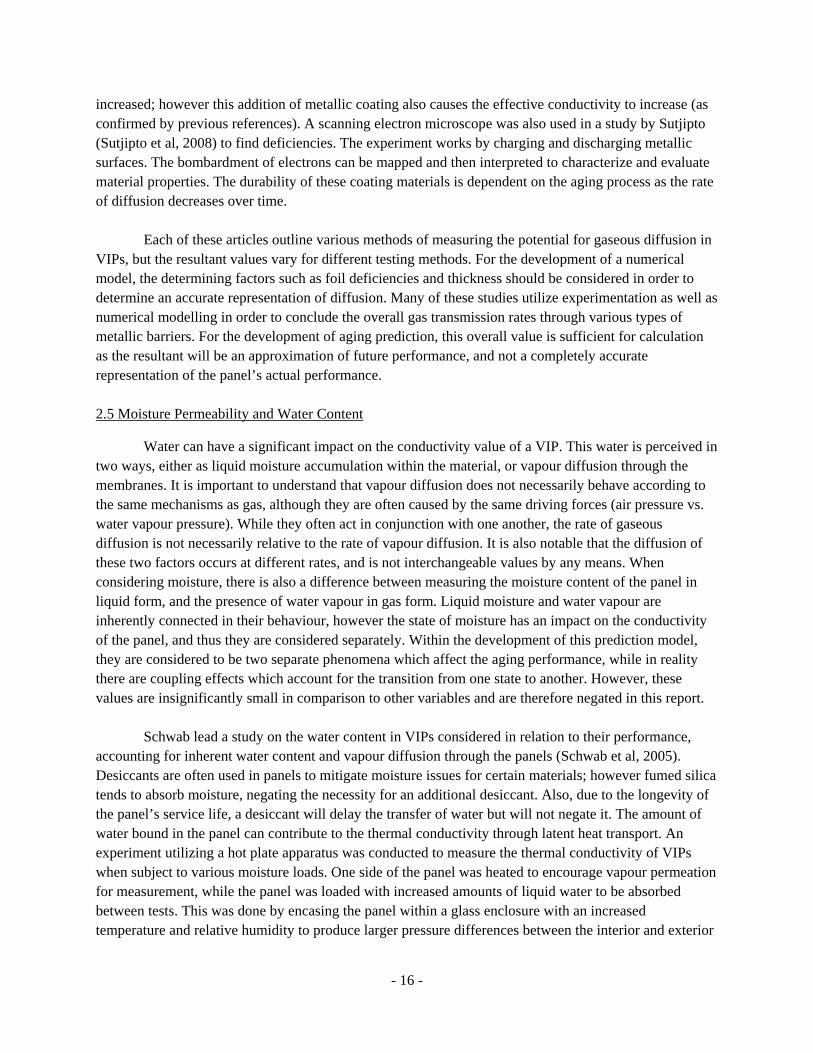
of the panel. The results indicated a correlation between the increase of thermal conductivity and the water content of the panels. This study also observes that the water content in VIPs can often increase depending on the type of foils used, the climatic conditions and the adsorption properties of the core material. This study is relevant in analyzing the aging performance of the panels, as the accumulation of moisture is dependent on the factor of time, and can thus change the overall performance of the system. This study concluded that the increase of thermal conductivity is proportional to the water content of the panel (approximately 0.5x10⁻³ W/mK conductivity increase per mass percentage of water, as derived from Figure 13).
Figure 13: Heat transmission coefficient and thermal conductivity depending on the water content in 20 mm thick VIPs at a mean
temperature of 10°C (Schwab et al, 2005)
Figure 13 identifies the mass increase for the panels specific to that test. However, the rates of increase in water content have been found between 0.02-3.8 % per year in different panels, which can contribute to a conductivity increase of approximately 1.9x10⁻³ W/mK annually (Schwab et al, 2005). This identifies that while the conductivity will increase linearly depending on the moisture content, that moisture content rate is dependent on the permeance of the foil, the climatic conditions and the sorption isotherm of the core material. Evidently this is relevant to aging performance, as a higher rate of moisture accumulation can lead to a faster decrease of thermal performance of the panel.
Schwab and his colleagues also developed a calculation model to determine various climatic effects on the panels. The developed calculation was used to predict the increase in pressure and derive the maximum potential for increase in water content. This calculation can also be used in the development of an aging performance model, as the water content will continue to fluctuate based on other mechanisms, and will affect the future performance of the panels. The behaviour of these transfer mechanisms is based on a complex influence of temperature, relative humidity, and the size of panels which affect the pressure increase within the VIPs. This study noted that high relative humidity influences air and water vapour permeance of VIPs. This is critical especially for the polymer films. An experiment identified that the mass increase due to water adsorption happened along the surface of the foil, indicated that the water was being absorbed by the fumed silica near the surface of the VIP, rather than passing through the panel.
- 18 -
A separate study outlines that the most important element in VIP long term performance is the barrier of water and gas (Garnier et al, 2010). In this analysis, electrical resistivity was used to determine the thickness of the aluminum coating materials as a component affecting vapour permeability. The result of this test actually identified that panels can often have different film thicknesses on either face, even when composed of the same material, based on the manufacturing process and the handling of the panel. Similar to gas, the vapour permeability of VIP panels is dependent on this thickness of aluminum. However, all vacuum deposited coatings are in a state of stress (from pressure differences) and vapour diffusion through those coatings creates more flaws, whereas gas transmission is less harmful. This analysis identified that the pinhole defects (size and amount) are linearly related to the thickness of the coating. Wet and dry cup methods were used to test sample panel materials at different relative humidity levels to calculate the average permeability of different products.
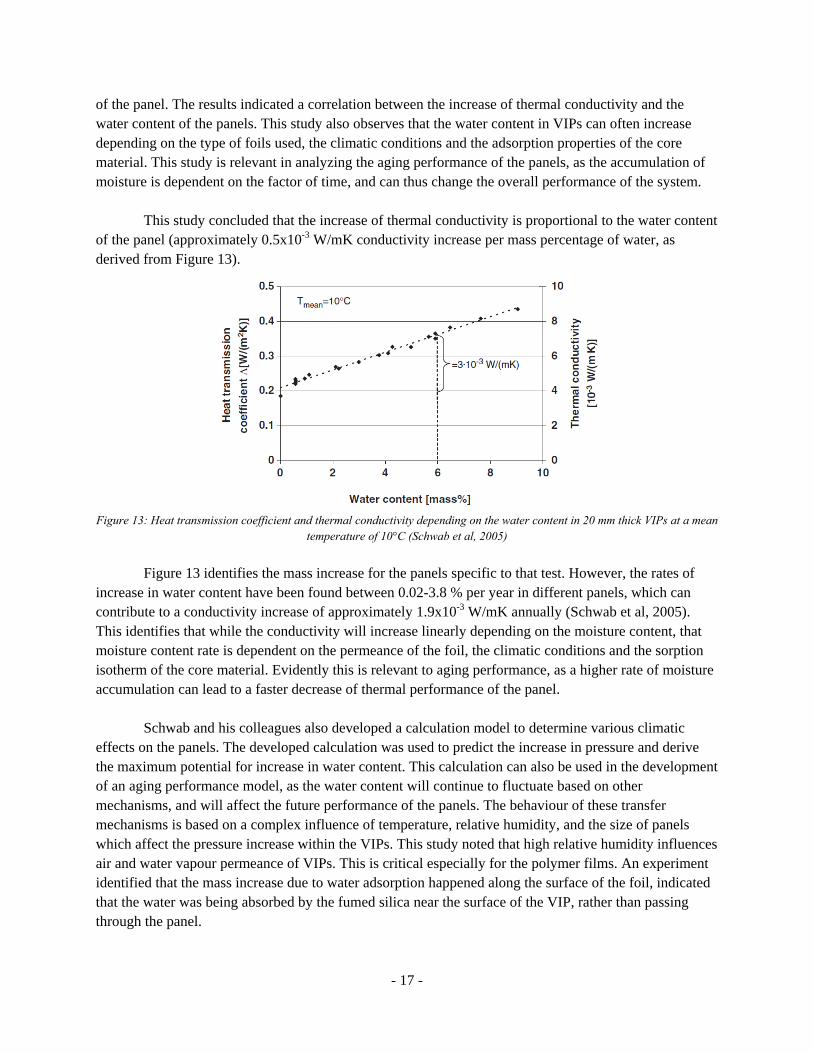
For the cup test, VIP samples were subject to conditions of 25°C, 90% RH and weighed weekly
to determine mass increase. The water vapour flux was then derived through calculation by the weight change according to duration of exposure. The results confirmed that the vapour flux decreases exponentially with increased aluminum thickness, as well as using additional layers in the film barrier, as seen in Figure 14.
Figure 14: Variation of permeance with (a) aluminum thickness and (b) fraction of the surface of pinholes. The number shown on
the top of the point is the corresponding aluminum thickness for polymer-metal films.(Garnier et al, 2010)
- 19 -
This analysis also identifies the effect of pinholes in the film on the overall permeance of the panels. The permeance increased linearly with the increased percentage of pinholes in the metallic foil. In this test, the aluminum and polymer-aluminum films are considered separately, as the chemical composition of polymers can have an impact on the aging of VIPs. This occurs primarily because aluminum is sensitive to oxidation and polymers can protect the aluminum (particularly the presence of chlorine) and elongate the service life of the panel by preventing oxidation.
Many of the tests which were conducted to calculate gaseous diffusion were done in parallel with
vapour diffusion tests. This was the case for Garnier (Garnier et al, 2011), as she also conducted experiments using the cup method. Garnier also noted that layering multiple sheets of polymer films had no effect on vapour diffusion, as it had with gas. She noted that the increased water content in the VIPs would cause the degradation to polymers over time due to a hydrolysis reaction which results in delamination of various barriers. This was determined using a hydrothermal ageing process in a regulated climatic chamber (at 70°C, 90% RH).
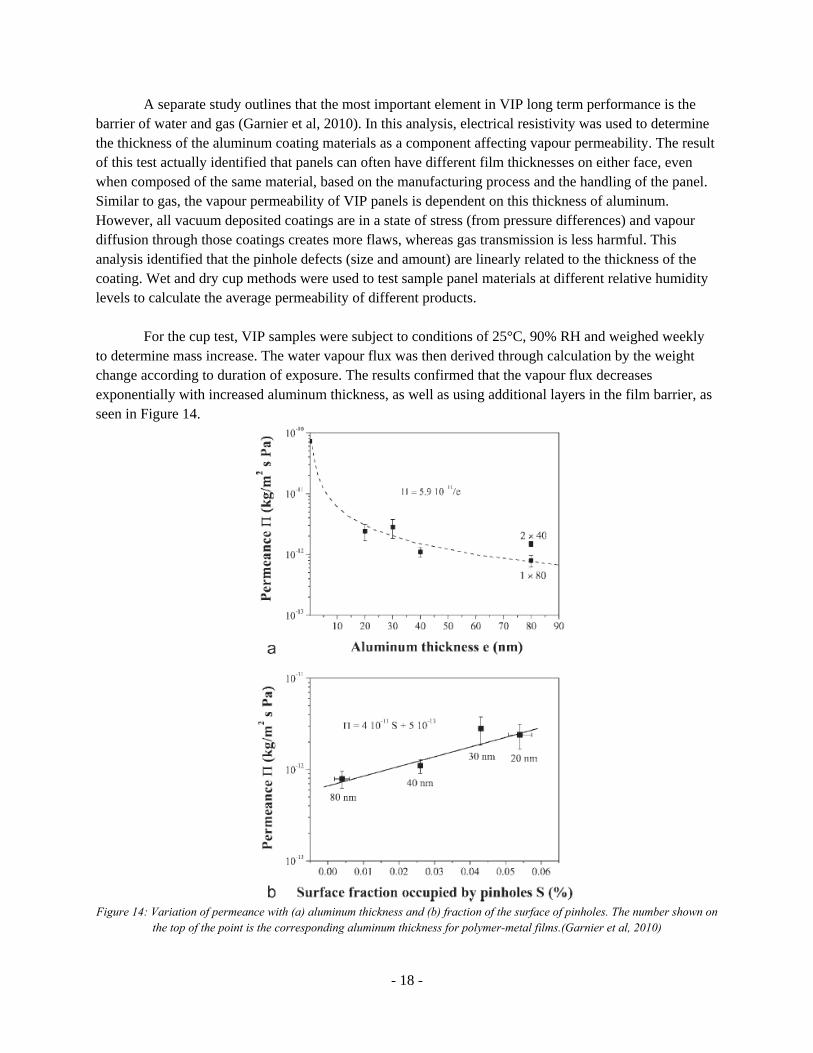
Heinemann (Heinemann, 2008) used a hot plate measurement technique in order to measure the effect of water vapour on overall thermal conductivity. VIPs were tested with various levels of increased water content within the cells, to determine the end result. When the fumed silica specimens were investigated, it was noted that most water had been adsorbed in the material, while small amounts were present in a gas state. This amount is dependent on the partial vapour pressure, which is dependent on the temperature. Moisture levels within the panels were investigated based on proximity to the warm and cold surfaces of the panel during testing. The most influential variables on overall conductivity are assumed to be the adsorbed water present in the liquid phase, which increases the rate of solid conduction according to the amount of water present.
Figure 15: Sorption isotherm for Wacker WDS-VIP derived at 23 °C. (Heinemann, 2008).
Figure 15 is a resultant of these measured tests identifying an exponential increase of water content with elevated relative humidity. This measurement assumes a steady state condition and only accounts for desorption and adsorption by the panel, and does not account for surface diffusion. The
- 20 -
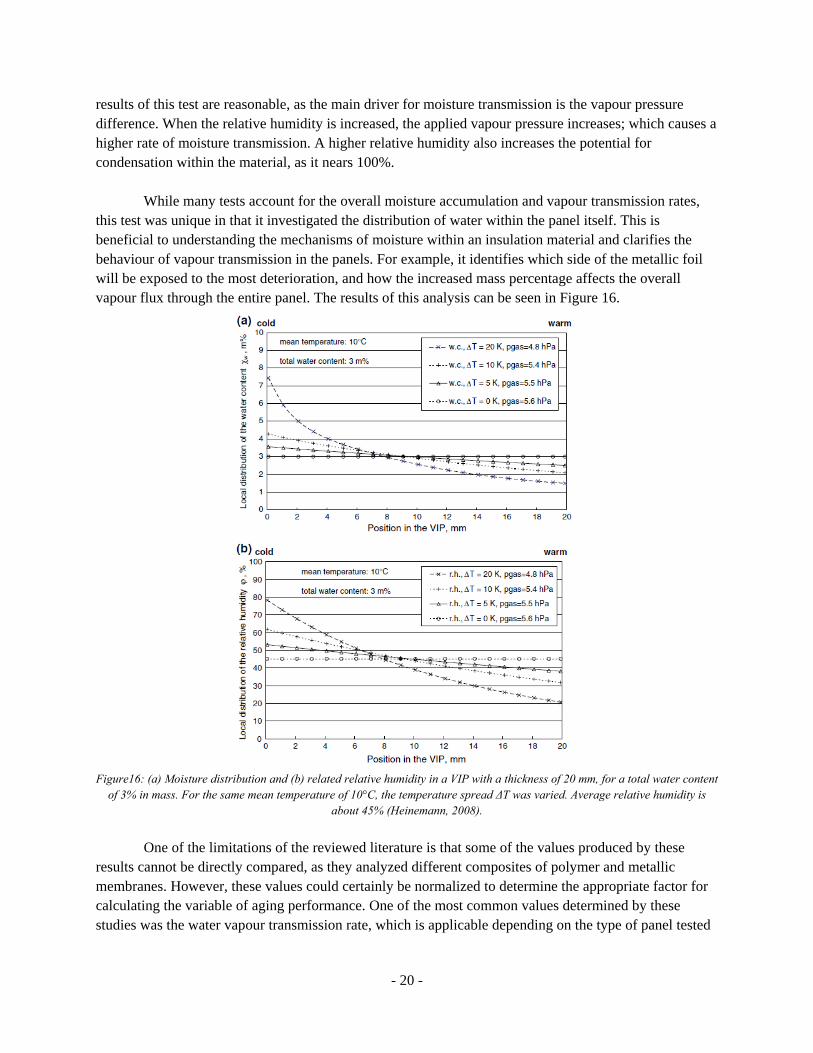
results of this test are reasonable, as the main driver for moisture transmission is the vapour pressure difference. When the relative humidity is increased, the applied vapour pressure increases; which causes a higher rate of moisture transmission. A higher relative humidity also increases the potential for condensation within the material, as it nears 100%. While many tests account for the overall moisture accumulation and vapour transmission rates, this test was unique in that it investigated the distribution of water within the panel itself. This is beneficial to understanding the mechanisms of moisture within an insulation material and clarifies the behaviour of vapour transmission in the panels. For example, it identifies which side of the metallic foil will be exposed to the most deterioration, and how the increased mass percentage affects the overall vapour flux through the entire panel. The results of this analysis can be seen in Figure 16.
Figure16: (a) Moisture distribution and (b) related relative humidity in a VIP with a thickness of 20 mm, for a total water content
of 3% in mass. For the same mean temperature of 10°C, the temperature spread ΔT was varied. Average relative humidity is about 45% (Heinemann, 2008).
One of the limitations of the reviewed literature is that some of the values produced by these results cannot be directly compared, as they analyzed different composites of polymer and metallic membranes. However, these values could certainly be normalized to determine the appropriate factor for calculating the variable of aging performance. One of the most common values determined by these studies was the water vapour transmission rate, which is applicable depending on the type of panel tested

- 21 -
and can be translated into a normalized value. Therefore, the mass percentage of water content increase must be considered to accurately account for the increased thermal conductivity of the panel. 2.6 Polymer Seals and Panel Joints
The literature on the topic of VIP performance includes the importance of manufacturing techniques as a component which contributes to different performance values. This is particularly the case when it comes to sealing and evacuating the polymer seals and connecting the panels’ joints. There are several studies which investigate the effect of heat on the films and how it could potentially compromise the integrity of the seal, and lead to premature failure of the panel. The moment the seal is broken; air is allowed easy passage back into the panel, eliminating the benefits of the system. Malsen and colleagues (Malsen et al, 2008) conducted an investigation of the effect of heat seals on metal films. The composite investigated comprised a base layer of polyethylene sealant, followed by an aluminum layer for the metallic coating and lastly a layer of polyethylene terephthalate (PET) for protection. The heat seal where these layers are connected is considered to be the weakest part of the coating. This study compares the bond of seals at extremely low temperatures, as well as room temperature. The temperature at which the polymers are sealed and the amount of time they are heated, largely determines the strength of the bond. When the films are heated, a small amount of pressure is applied and the layers fuse. There are various types of failure which can occur as a result of sealant methods. Peeling occurs when two fused laminates are completely de-bonded. Tearing is a rupture that occurs in the film in a non-sealed area. The third failure is a combination of peeling and tearing, often resulting is tearing along the seal. It is also possible for delamination to occur at areas other than the seal.
In this study, four types of panels were tested based on different metallic layers. At room temperatures, it was found that the most common type of panel failure was delamination along the seal. Young’s modulus is a coefficient used together with tensile strength to determine the toughness of film materials, which then determines the life expectancy of the panel based on seal failure. The relationship between the heat seal strain and the modulus determine a potential fracture strain (the ability of the seal to store impact energy). While the temperature and time are critical to performance, a range of possibilities are available to provide good quality seal. Overall, seals tend to perform better in colder temperatures.
Figure 17: General behaviour of apparent seal strength as function of seal bar temperature. (Malsen et al, 2008)
- 22 -
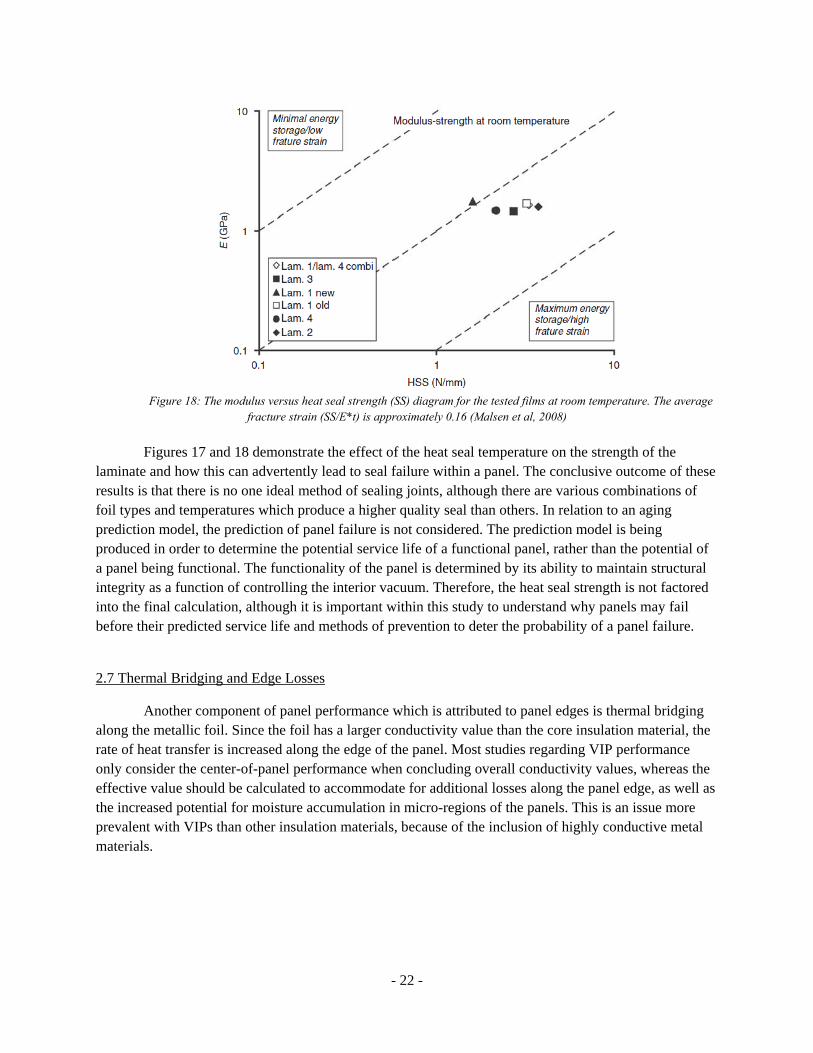
Figure 18: The modulus versus heat seal strength (SS) diagram for the tested films at room temperature. The average
fracture strain (SS/E*t) is approximately 0.16 (Malsen et al, 2008)
Figures 17 and 18 demonstrate the effect of the heat seal temperature on the strength of the laminate and how this can advertently lead to seal failure within a panel. The conclusive outcome of these results is that there is no one ideal method of sealing joints, although there are various combinations of foil types and temperatures which produce a higher quality seal than others. In relation to an aging prediction model, the prediction of panel failure is not considered. The prediction model is being produced in order to determine the potential service life of a functional panel, rather than the potential of a panel being functional. The functionality of the panel is determined by its ability to maintain structural integrity as a function of controlling the interior vacuum. Therefore, the heat seal strength is not factored into the final calculation, although it is important within this study to understand why panels may fail before their predicted service life and methods of prevention to deter the probability of a panel failure.
2.7 Thermal Bridging and Edge Losses
Another component of panel performance which is attributed to panel edges is thermal bridging along the metallic foil. Since the foil has a larger conductivity value than the core insulation material, the rate of heat transfer is increased along the edge of the panel. Most studies regarding VIP performance only consider the center-of-panel performance when concluding overall conductivity values, whereas the effective value should be calculated to accommodate for additional losses along the panel edge, as well as the increased potential for moisture accumulation in micro-regions of the panels. This is an issue more prevalent with VIPs than other insulation materials, because of the inclusion of highly conductive metal materials.
- 23 -
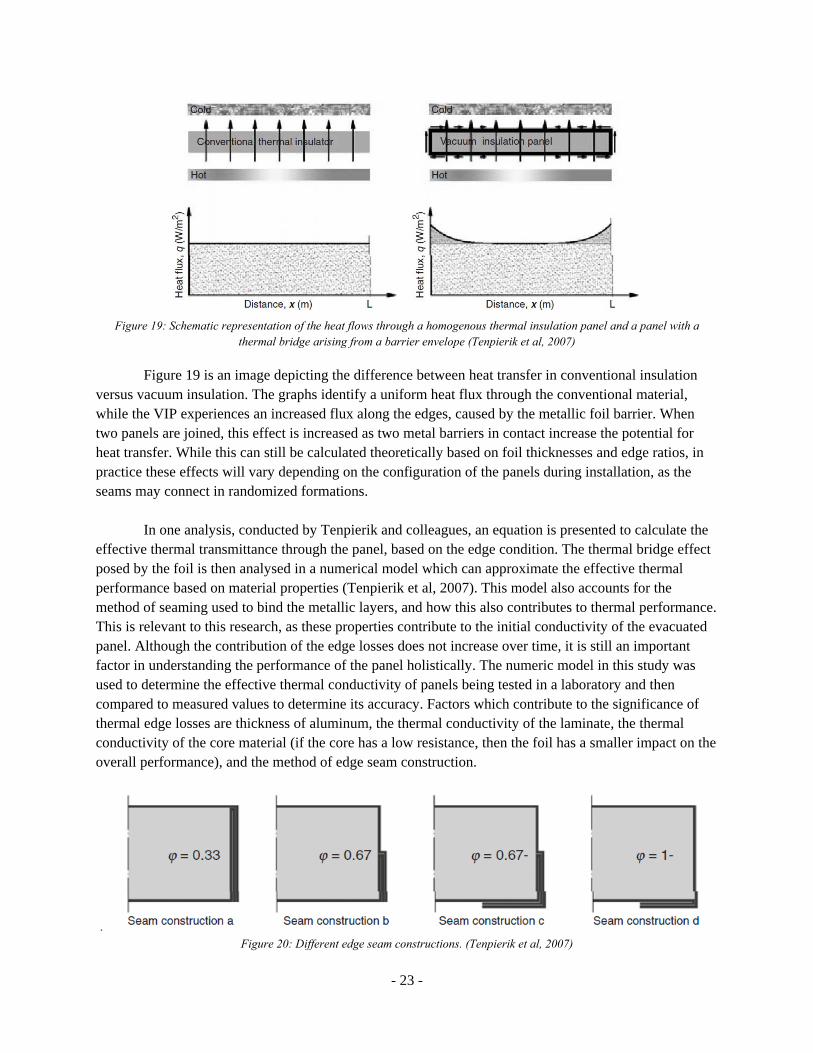
Figure 19: Schematic representation of the heat flows through a homogenous thermal insulation panel and a panel with a
thermal bridge arising from a barrier envelope (Tenpierik et al, 2007)
Figure 19 is an image depicting the difference between heat transfer in conventional insulation versus vacuum insulation. The graphs identify a uniform heat flux through the conventional material, while the VIP experiences an increased flux along the edges, caused by the metallic foil barrier. When two panels are joined, this effect is increased as two metal barriers in contact increase the potential for heat transfer. While this can still be calculated theoretically based on foil thicknesses and edge ratios, in practice these effects will vary depending on the configuration of the panels during installation, as the seams may connect in randomized formations.
In one analysis, conducted by Tenpierik and colleagues, an equation is presented to calculate the
effective thermal transmittance through the panel, based on the edge condition. The thermal bridge effect posed by the foil is then analysed in a numerical model which can approximate the effective thermal performance based on material properties (Tenpierik et al, 2007). This model also accounts for the method of seaming used to bind the metallic layers, and how this also contributes to thermal performance. This is relevant to this research, as these properties contribute to the initial conductivity of the evacuated panel. Although the contribution of the edge losses does not increase over time, it is still an important factor in understanding the performance of the panel holistically. The numeric model in this study was used to determine the effective thermal conductivity of panels being tested in a laboratory and then compared to measured values to determine its accuracy. Factors which contribute to the significance of thermal edge losses are thickness of aluminum, the thermal conductivity of the laminate, the thermal conductivity of the core material (if the core has a low resistance, then the foil has a smaller impact on the overall performance), and the method of edge seam construction.
. Figure 20: Different edge seam constructions. (Tenpierik et al, 2007)
- 24 -
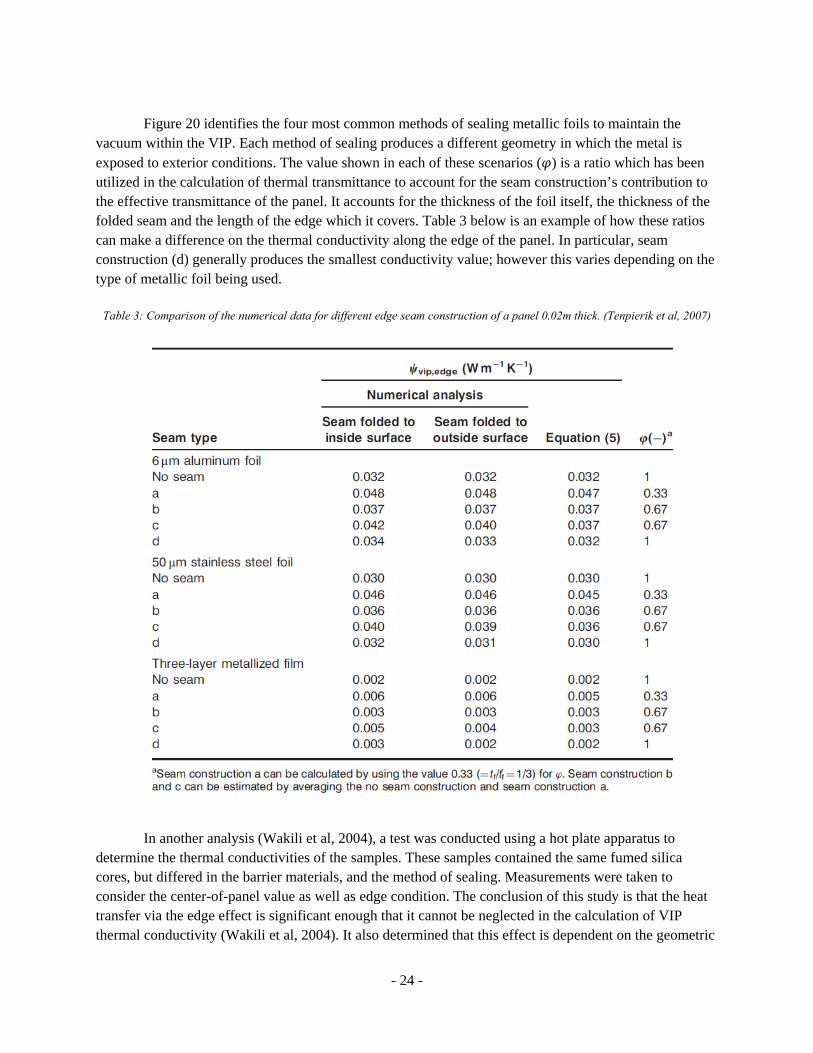
Figure 20 identifies the four most common methods of sealing metallic foils to maintain the
vacuum within the VIP. Each method of sealing produces a different geometry in which the metal is exposed to exterior conditions. The value shown in each of these scenarios ( ) is a ratio which has been utilized in the calculation of thermal transmittance to account for the seam construction’s contribution to the effective transmittance of the panel. It accounts for the thickness of the foil itself, the thickness of the folded seam and the length of the edge which it covers. Table 3 below is an example of how these ratios can make a difference on the thermal conductivity along the edge of the panel. In particular, seam construction (d) generally produces the smallest conductivity value; however this varies depending on the type of metallic foil being used.
Table 3: Comparison of the numerical data for different edge seam construction of a panel 0.02m thick. (Tenpierik et al, 2007)
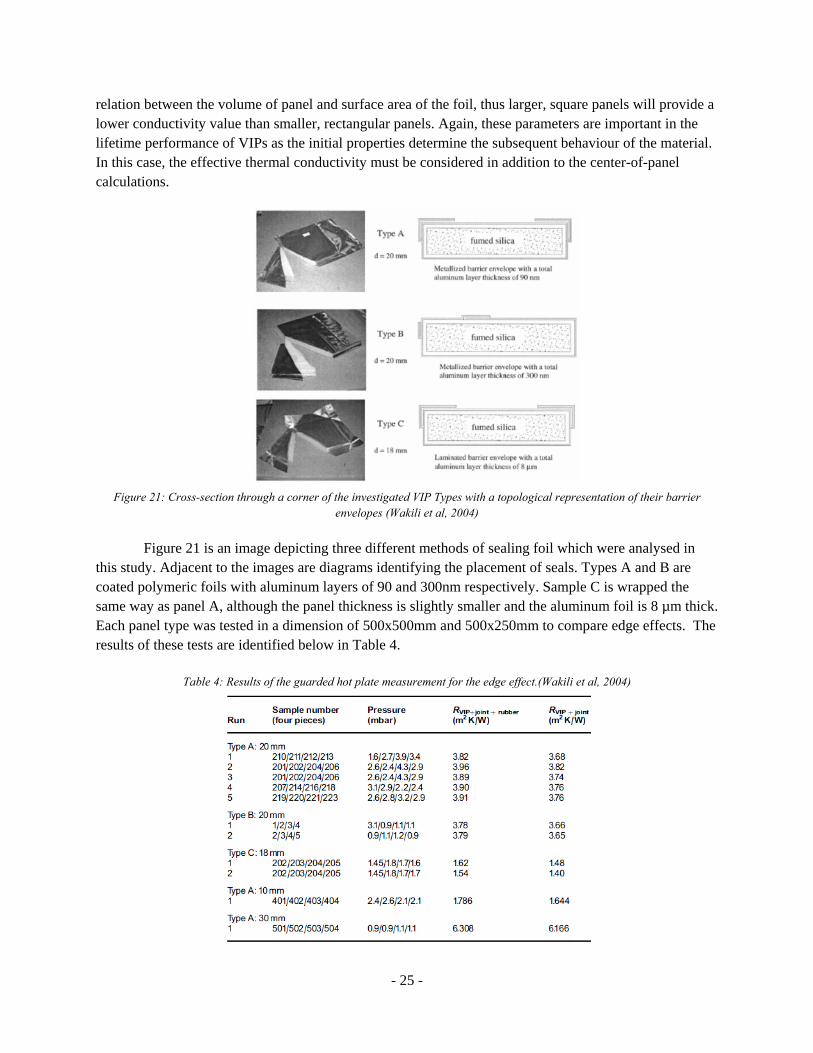
In another analysis (Wakili et al, 2004), a test was conducted using a hot plate apparatus to determine the thermal conductivities of the samples. These samples contained the same fumed silica cores, but differed in the barrier materials, and the method of sealing. Measurements were taken to consider the center-of-panel value as well as edge condition. The conclusion of this study is that the heat transfer via the edge effect is significant enough that it cannot be neglected in the calculation of VIP thermal conductivity (Wakili et al, 2004). It also determined that this effect is dependent on the geometric
- 25 -
relation between the volume of panel and surface area of the foil, thus larger, square panels will provide a lower conductivity value than smaller, rectangular panels. Again, these parameters are important in the lifetime performance of VIPs as the initial properties determine the subsequent behaviour of the material. In this case, the effective thermal conductivity must be considered in addition to the center-of-panel calculations.
Figure 21: Cross-section through a corner of the investigated VIP Types with a topological representation of their barrier
envelopes (Wakili et al, 2004)
Figure 21 is an image depicting three different methods of sealing foil which were analysed in this study. Adjacent to the images are diagrams identifying the placement of seals. Types A and B are coated polymeric foils with aluminum layers of 90 and 300nm respectively. Sample C is wrapped the same way as panel A, although the panel thickness is slightly smaller and the aluminum foil is 8 µm thick. Each panel type was tested in a dimension of 500x500mm and 500x250mm to compare edge effects. The results of these tests are identified below in Table 4.
Table 4: Results of the guarded hot plate measurement for the edge effect.(Wakili et al, 2004)
- 26 -
The results shown in Table 4 identify the resultant thermal resistances of the joints when using various foil types, which were all determined to be less than the initial calculated center-of-panel resistance which is typically used in other studies. This indicates that the thermal bridging has a significant impact on the conductivity of an evacuated panel and must be considered in the prediction model for panel performance. Some methods have been explored in attempting to mitigate the issue of thermal bridging in VIPs. Encapsulated VIPs go one step further to reduce thermal bridging by wrapping VIPs in an additional exterior layer of expanded polystyrene (EPS) (Tenpierik and Cauberg, 2010). This study utilized numerical modelling to determine the optimal thickness for VIPs within these panels. The study concluded that the performance of EPS alone could be significantly improved (up to 35% with 30mm panels, 248% with 100mm, and 137% with 95 mm) by integrating VIPs. This study considers integrated panels which could be interesting to compare with non-integrated panels, as the additional EPS may contribute to the durability of the VIP and potential reduction of deficiencies in the metallic barriers. The numerical approach to solving for optimized thickness in this could be applicable in determining the relationship between core thickness and metallic coatings, and should thus be considered in this project’s evaluation techniques. This is an interesting component to consider as it begins to indicate not only how VIPs could perform as individual panels, but how that performance can potentially be improved through the method of integration with other materials. 2.8 Assemblies vs. Individual Panels
The majority of tests and calculations which have been conducted to evaluate vacuum insulation panels have been carried out in isolated environments and evaluated solely the performance of individual panels. Theoretically, this can determine an approximate value of performance for VIPs over time. Although realistically, it must be considered that these individual panels may perform differently depending on the context of their construction and integration within a building assembly. By understanding the weaknesses and strengths of VIPs through the previous studies, it makes it possible for designers to make appropriate decisions on how to incorporate VIPs in construction, and how to integrate them with adjacent materials to avoid compromising the integrity of the VIPs. There are some studies which have begun to take interest in these material interactions, and monitoring the specific utilization of VIPs in various assemblies.
One study considered the uses of VIPs in a built context, in comparison to other typical insulation materials (Nussbaumer et al, 2006). The VIPs used in this analysis were encapsulated panels, protected by a layer of EPS applied outside of the metallic foil. This study also accounted for the performance of damaged VIPs which remained within the assembly. A hot box apparatus was used to measure the thermal properties of the samples by applying heat on one side of the sample, and measuring the temperature gradient using thermocouples at different locations. For the test, 6 sample panels were mounted to a concrete wall and monitored with thermocouples. Infrared thermography was also used in this experiment as a tool to identify surface temperature distribution. A numeric model was then analyzed to compare with the real time results.
- 27 -
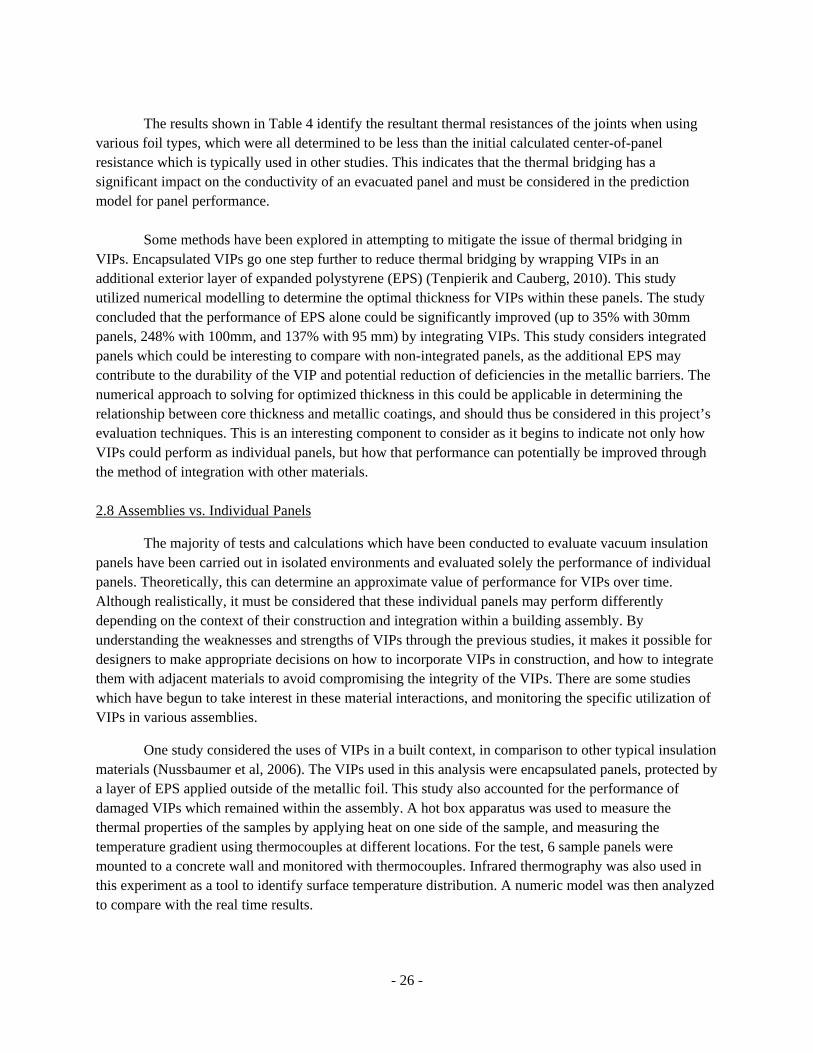
Figure 22: Potential improvement by the application of 60mm thick insulation boards containing VIPs, which are half the thickness of conventionally used insulation (Nussbaumer et al, 2006).
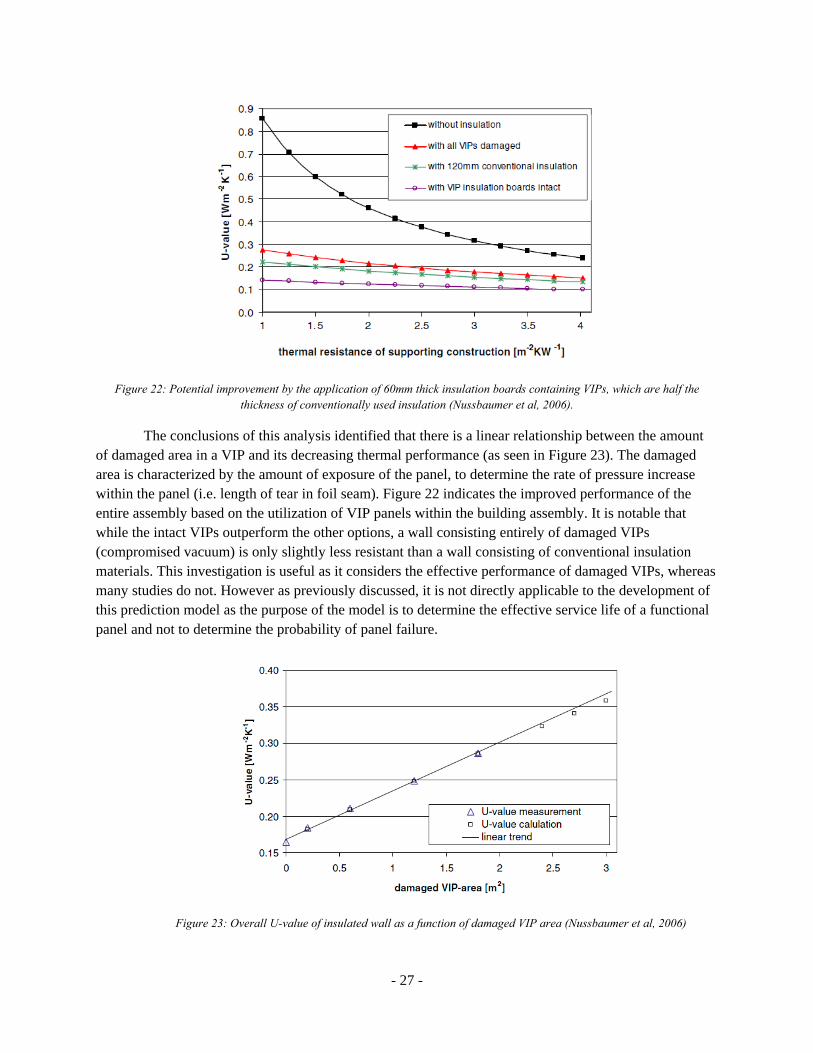
The conclusions of this analysis identified that there is a linear relationship between the amount of damaged area in a VIP and its decreasing thermal performance (as seen in Figure 23). The damaged area is characterized by the amount of exposure of the panel, to determine the rate of pressure increase within the panel (i.e. length of tear in foil seam). Figure 22 indicates the improved performance of the entire assembly based on the utilization of VIP panels within the building assembly. It is notable that while the intact VIPs outperform the other options, a wall consisting entirely of damaged VIPs (compromised vacuum) is only slightly less resistant than a wall consisting of conventional insulation materials. This investigation is useful as it considers the effective performance of damaged VIPs, whereas many studies do not. However as previously discussed, it is not directly applicable to the development of this prediction model as the purpose of the model is to determine the effective service life of a functional panel and not to determine the probability of panel failure.
Figure 23: Overall U-value of insulated wall as a function of damaged VIP area (Nussbaumer et al, 2006)
- 28 -
Another conducted study (Grynning et al, 2010) was researched using hot box measurements to analyze a complete wall assembly. This investigation looked at single layer application of VIPs versus double layer configurations, while considering different panel thicknesses, edge effects (ex. Spaces of air between panels), and the effects of staggering panels and taping joints (Grynning et al, 2010). Thermocouples were used to measure resultant temperatures on the cold side of the wall, while subject to the hot box apparatus. These thermocouples were located in strategic areas along the face of the assembly to account for the effects of the different configurations. The results identified that there were irregularities found in certain areas due to the compression of panels during installation. This is another indication of the potential risk damage that could compromise the material’s performance. Error calculations were conducted in an attempt to correct this offset, while integrated in a simplified numeric model to determine different variables. A 19% difference was calculated based on the variations between the measured and nominal thicknesses, as well as round-off error.
Figure 24: Comparison of measured and numerically calculated U-values of various VIP wall structure arrangements
(Grynning et al, 2010)
The results of this study (seen in Figure 24) identified that the size of the panels had an impact on
their overall thermal resistance, as did the orientation and configurations. It was speculated that this was due to possible convection in gaps between the hot and cold surfaces of the VIP. When compared, the measurements indicated that the effective U values were higher than calculated in their numerical simulation. This indicates that there was either a large margin of error, or there may have been critical variables missing from their interpretation. For example, while the calculation does account for thermal bridging and convection in air gaps between the panels, it does not account for the increased conduction along the panel’s edge. The center of panel conductivity value was used and thus lacked the variable of linear thermal transmittance which may have a significant effect on the overall performance of the panel.

- 29 -
Either way, it can be assumed that in the development of a long-term prediction model, there will be a margin of error dependent on the accuracy and relevancy of the information included in the calculation.
2.9 Relative Humidity, Pressure and Time: Experimental Processes and Prediction Models
Aside from the investigations of VIPs within a built assembly, each of the variables evaluated in this report thus far have been considered as individual components. Many of the studies performed were anticipated to reveal a specific material property regarding the performance of the VIPs. However the implications of these factors have an impact on the other material properties depending on the conditions of testing. In regards to VIPs, it can be assumed that once you have the infiltration of one element, you will begin to experience reduced thermal performance. The objective of this report is to assemble a holistic list of variables derived from these previous studies to produce a model that can be used to account for all heat, air and moisture transfer mechanisms. More importantly is how these mechanisms behave in relation to relative humidity, pressure, temperature and time. These climatic and temporal aspects are crucial in determining the potential performance over time. There have been studies which have begun to develop service life prediction models in order to utilize the previously obtained material properties and translate them into the potential for long-term performance. Each of the service life models in these studies has aimed to solve the same value, which amounts to the change in conductivity over a given amount of time. The service life of the panels is dependent on the definition of what performance those panels must provide. It is not yet standardized, but it is generally agreed upon within the academic community that the service life of a VIP is defined by the amount of time it takes for the conductivity to exceed 8.0 x 10⁻³ W/mK (Schwab et al, 2005). In order to perform as an acceptable insulation within a building envelope, this service life must exceed a minimum of 50 years (Mukhopadhyaya et al, 2011). While the final desired outcome for each of the following models is the same, the approaches to model development vary slightly depending on the known measured properties attributed to each panel type. The representation of these values is dependent on the method of testing used in each case, and the results produced from testing. The first examined model (Simmler and Brunner, 2005) expressed the overall change in conductivity as:
, , [1]
Where; The overall change in conductivity is a summation of two variables;
, is a variable that defines the change in conductivity over a change in pressure, based on a rate
of pressure change that is dependent on the temperature and relative humidity that the panel is subject to;
, is a variable that defines the change in conductivity over a change in water content, based on
the rate of moisture accumulation within the panel as determined by the temperature and relative humidity. The rate of pressure increase can be determined by:
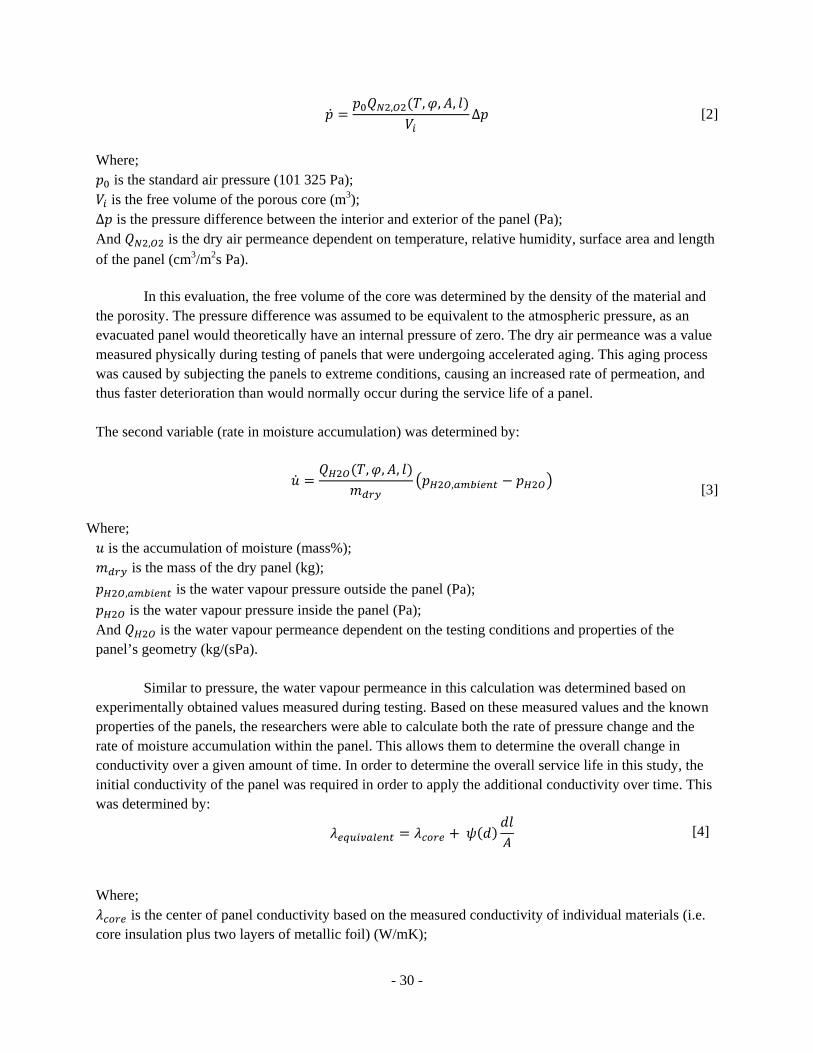
- 30 -
, , , ,∆ [2]
Where;
is the standard air pressure (101 325 Pa); is the free volume of the porous core (m3);
∆ is the pressure difference between the interior and exterior of the panel (Pa); And , is the dry air permeance dependent on temperature, relative humidity, surface area and length
of the panel (cm3/m2s Pa).
In this evaluation, the free volume of the core was determined by the density of the material and the porosity. The pressure difference was assumed to be equivalent to the atmospheric pressure, as an evacuated panel would theoretically have an internal pressure of zero. The dry air permeance was a value measured physically during testing of panels that were undergoing accelerated aging. This aging process was caused by subjecting the panels to extreme conditions, causing an increased rate of permeation, and thus faster deterioration than would normally occur during the service life of a panel. The second variable (rate in moisture accumulation) was determined by: , , ,
, [3]
Where;
is the accumulation of moisture (mass%); is the mass of the dry panel (kg);
, is the water vapour pressure outside the panel (Pa);
is the water vapour pressure inside the panel (Pa); And is the water vapour permeance dependent on the testing conditions and properties of the panel’s geometry (kg/(sPa). Similar to pressure, the water vapour permeance in this calculation was determined based on experimentally obtained values measured during testing. Based on these measured values and the known properties of the panels, the researchers were able to calculate both the rate of pressure change and the rate of moisture accumulation within the panel. This allows them to determine the overall change in conductivity over a given amount of time. In order to determine the overall service life in this study, the initial conductivity of the panel was required in order to apply the additional conductivity over time. This was determined by:
[4]
Where;
is the center of panel conductivity based on the measured conductivity of individual materials (i.e. core insulation plus two layers of metallic foil) (W/mK);
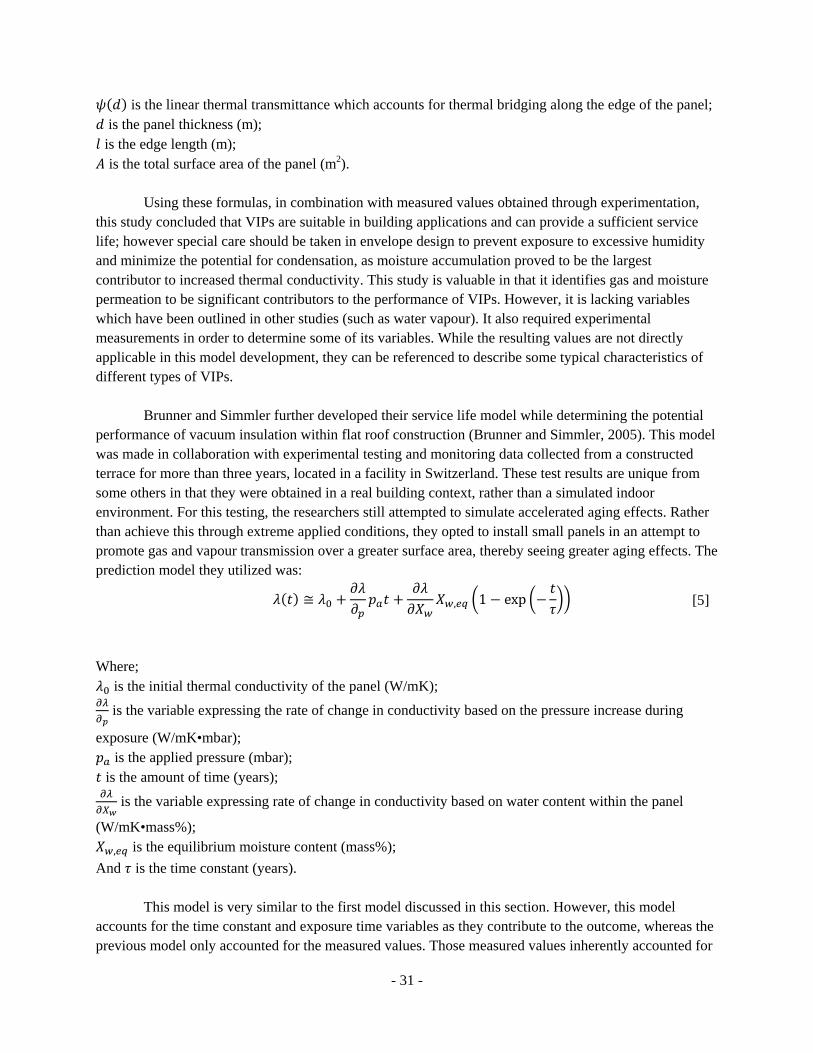
- 31 -
is the linear thermal transmittance which accounts for thermal bridging along the edge of the panel; is the panel thickness (m);
is the edge length (m); is the total surface area of the panel (m2).
Using these formulas, in combination with measured values obtained through experimentation, this study concluded that VIPs are suitable in building applications and can provide a sufficient service life; however special care should be taken in envelope design to prevent exposure to excessive humidity and minimize the potential for condensation, as moisture accumulation proved to be the largest contributor to increased thermal conductivity. This study is valuable in that it identifies gas and moisture permeation to be significant contributors to the performance of VIPs. However, it is lacking variables which have been outlined in other studies (such as water vapour). It also required experimental measurements in order to determine some of its variables. While the resulting values are not directly applicable in this model development, they can be referenced to describe some typical characteristics of different types of VIPs. Brunner and Simmler further developed their service life model while determining the potential performance of vacuum insulation within flat roof construction (Brunner and Simmler, 2005). This model was made in collaboration with experimental testing and monitoring data collected from a constructed terrace for more than three years, located in a facility in Switzerland. These test results are unique from some others in that they were obtained in a real building context, rather than a simulated indoor environment. For this testing, the researchers still attempted to simulate accelerated aging effects. Rather than achieve this through extreme applied conditions, they opted to install small panels in an attempt to promote gas and vapour transmission over a greater surface area, thereby seeing greater aging effects. The prediction model they utilized was:
≅ , 1 exp [5]
Where;
is the initial thermal conductivity of the panel (W/mK);
is the variable expressing the rate of change in conductivity based on the pressure increase during
exposure (W/mK•mbar); is the applied pressure (mbar);
is the amount of time (years);
is the variable expressing rate of change in conductivity based on water content within the panel
(W/mK•mass%);
, is the equilibrium moisture content (mass%);
And is the time constant (years). This model is very similar to the first model discussed in this section. However, this model accounts for the time constant and exposure time variables as they contribute to the outcome, whereas the previous model only accounted for the measured values. Those measured values inherently accounted for
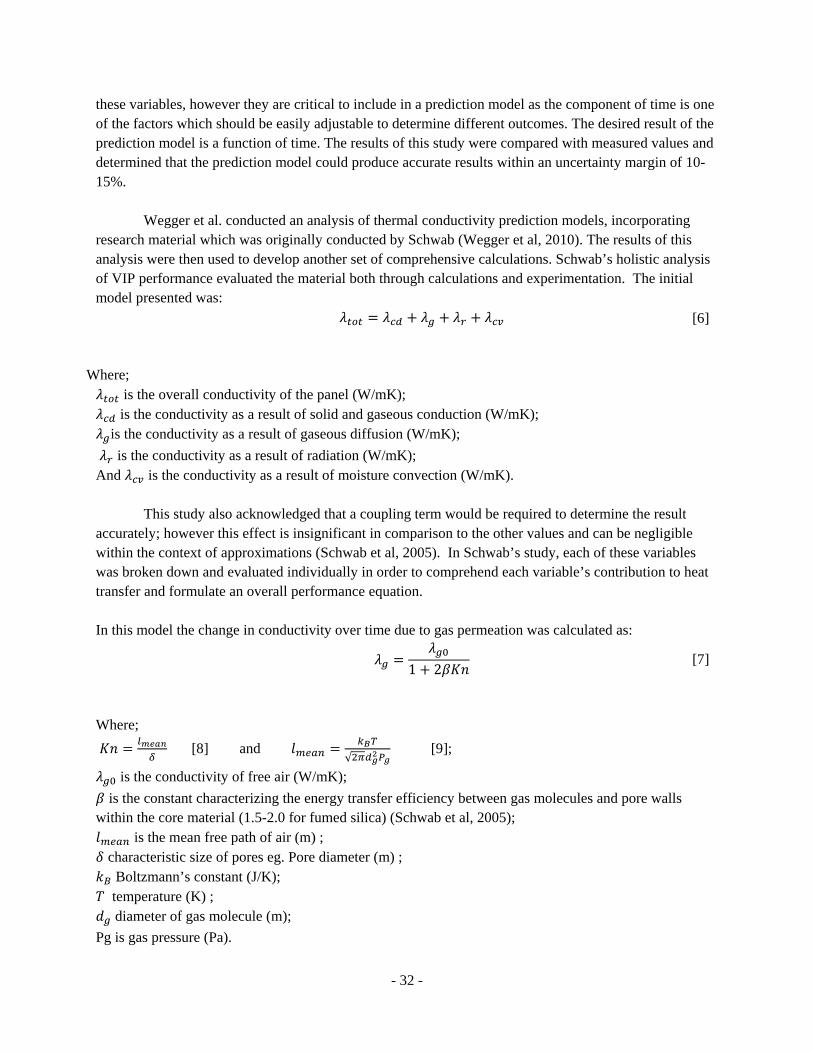
- 32 -
these variables, however they are critical to include in a prediction model as the component of time is one of the factors which should be easily adjustable to determine different outcomes. The desired result of the prediction model is a function of time. The results of this study were compared with measured values and determined that the prediction model could produce accurate results within an uncertainty margin of 10-15%. Wegger et al. conducted an analysis of thermal conductivity prediction models, incorporating research material which was originally conducted by Schwab (Wegger et al, 2010). The results of this analysis were then used to develop another set of comprehensive calculations. Schwab’s holistic analysis of VIP performance evaluated the material both through calculations and experimentation. The initial model presented was:
[6]
Where; is the overall conductivity of the panel (W/mK); is the conductivity as a result of solid and gaseous conduction (W/mK);
is the conductivity as a result of gaseous diffusion (W/mK);
is the conductivity as a result of radiation (W/mK); And is the conductivity as a result of moisture convection (W/mK). This study also acknowledged that a coupling term would be required to determine the result accurately; however this effect is insignificant in comparison to the other values and can be negligible within the context of approximations (Schwab et al, 2005). In Schwab’s study, each of these variables was broken down and evaluated individually in order to comprehend each variable’s contribution to heat transfer and formulate an overall performance equation. In this model the change in conductivity over time due to gas permeation was calculated as:
1 2
[7]
Where;
[8] and √
[9];
is the conductivity of free air (W/mK);
is the constant characterizing the energy transfer efficiency between gas molecules and pore walls within the core material (1.5-2.0 for fumed silica) (Schwab et al, 2005);
is the mean free path of air (m) ; characteristic size of pores eg. Pore diameter (m) ;
Boltzmann’s constant (J/K); temperature (K) ; diameter of gas molecule (m);
Pg is gas pressure (Pa).
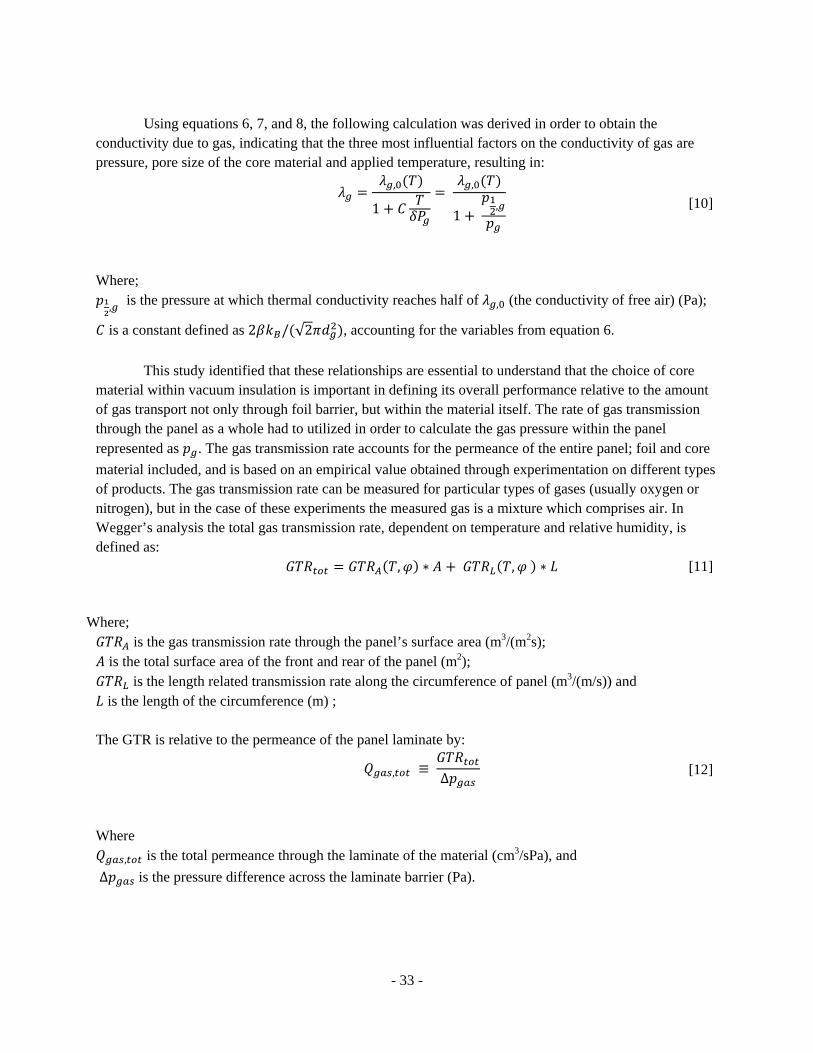
- 33 -
Using equations 6, 7, and 8, the following calculation was derived in order to obtain the conductivity due to gas, indicating that the three most influential factors on the conductivity of gas are pressure, pore size of the core material and applied temperature, resulting in:
,
1
,
1,
[10]
Where;
, is the pressure at which thermal conductivity reaches half of , (the conductivity of free air) (Pa);
is a constant defined as 2 / √2 , accounting for the variables from equation 6.
This study identified that these relationships are essential to understand that the choice of core material within vacuum insulation is important in defining its overall performance relative to the amount of gas transport not only through foil barrier, but within the material itself. The rate of gas transmission through the panel as a whole had to utilized in order to calculate the gas pressure within the panel represented as . The gas transmission rate accounts for the permeance of the entire panel; foil and core
material included, and is based on an empirical value obtained through experimentation on different types of products. The gas transmission rate can be measured for particular types of gases (usually oxygen or nitrogen), but in the case of these experiments the measured gas is a mixture which comprises air. In Wegger’s analysis the total gas transmission rate, dependent on temperature and relative humidity, is defined as:
, ∗ , ∗ [11]
Where;
is the gas transmission rate through the panel’s surface area (m3/(m2s); is the total surface area of the front and rear of the panel (m2);
is the length related transmission rate along the circumference of panel (m3/(m/s)) and is the length of the circumference (m) ;
The GTR is relative to the permeance of the panel laminate by:
, ≡
∆ [12]
Where
, is the total permeance through the laminate of the material (cm3/sPa), and
∆ is the pressure difference across the laminate barrier (Pa).
- 34 -
While the pressure on the exterior of the panel is known, the pressure within the panel changes with exposure over time. As the panel is initially subject to a vacuum, the initial pressure can be assumed as zero. In this study, the increase of pressure within the panel is defined as:
, ∆ [13]
Where;
is the change in pressure due to gas over a change in time,
, is the measured permeance (cm3/sPa);
∆ is the difference between internal and external pressures;
effective pore volume (m3);
is conversion factor from standard (index 0) to measurement conditions (index m);
Therefore is the measured temperature within the panel (K); is the standard pressure (Pa), is the standard temperature (K).
This equation can be solved to give an expression for the internal pressure as a function of time and external pressure:
,
[14]
Where
is the internal pressure after a given amount of time (Pa), Papp is applied external pressure (Pa) and pinit is initial internal gas pressure of the panel (Pa). While gas pressure increase accounts for a significant amount of conductivity increase in a VIP, moisture transport is also important to calculate. Similar to the method of calculation for gas, water vapour transport is determined using an empirically measured value. The water vapour transmission rate (WVTR) can be defined as:
, ∆ [15]
Where;
is the mass increase of the panel with time (kg/s);
, total water vapour permeance (kg/(sPa) ;
∆ water pressure difference across foil (Pa).
- 35 -
The external water vapour pressure can be determined based on the temperature and relative humidity; however the interior conditions can only be approximated through calculation. This can be done by applying the inverse function of the sorption isotherm according to equation 15. The sorption isotherm represents the amount of moisture bound within the core material as a function of the presence of water vapour in the pores .
, [16] Where
is the water vapour partial pressure (Pa) ;
, saturation pressure depending on temperature (Pa) ;
relative humidity (%) depending on water content (-). Therefore the change in water content must be calculated over time in order to solve for internal vapour pressure. It can be determined by:
,
,, ,
,
,, [17]
Where;
is the rate of change in water content over the change in time (mass%/s);
, is the water vapour permeance (kg/(sPa);
, is the dry mass of the VIP (kg) ;
, , , water vapour pressures inside and outside the VIP (Pa) ;
, relative humidities inside and outside (%). This study, with the support of other studies including Schwab and colleagues (Schwab 2005), the sorption isotherm of the VIP is approximated as a linear relationship where :
1
– , ,
, [18]
is a constant representing the slope of isotherm for fumed silica which is estimated at approx. 0.08 mass % per percentage of RH up to 60%. Unfortunately, the number above 60% relative humidity has yet to be estimated on an empirical scale and therefore in this study is always assumed to be linear. , is the
saturated vapour pressure, according to the temperature (Pa). By understanding each of these variables, Schwab presented a formula to predict the changing performance of VIPs. The result of this analysis provided the following proposed prediction model:
,
1 / [19]
- 36 -
conductivity in evacuated state (W/mK);
, conductivity of free and still air (W/mK);
the pressure at which thermal conductivity of gas is half of , (Pa);
pressure inside VIP (Pa); is constant dependent on sorption isotherm (W/(mKmass%)) ;
moisture content (mass%) . While the gas portion of this equation is consistent with others’ presented work, this equation lumps moisture accumulation and water vapour transmission as one variable acting on the VIP. While this formula assumes that an increase in moisture content and water vapour are inherently linked, it does not seem to holistically describe the possible scenarios. Also, the constant lacks explanation in this study. Upon examining Schwab’s work thoroughly, it seems that Wegger had reached some similar conclusions as he proposed an alternate model for prediction which separated water accumulation and vapour characteristics. After thoroughly examining Schwab’s work, Wegger et al. proposed the following prediction model (Wegger et al, 2010):
∆ ∆ ∆ ∆
, 1 /, 1 /
1 /
[20]
Where; ∆ is the overall change in panel conductivity (W/mK);
is the rate of conductivity change over the change in pore gas pressure (W/mK/Pa);
is the rate of conductivity change over the change in water vapour pressure (W/mK/Pa);
is the rate of conductivity change over then change in accumulated moisture content(W/mK/mass%);
is the pore gas pressure (Pa);
, is the atmospheric gas pressure outside the panel (Pa);
is the partial water vapour pressure inside the panel (Pa);
, is the partial water vapour pressure outside VIP (Pa);
is the water content of the core material (mass%); relative humidity outside VIP (%);
is time (days); and are the time shifts caused by getters and desiccants (days);
and are time constants due to gas and moisture respectively where:
,∗ [21] and
,∗ [22]
- 37 -
is the effective volume of the panel, determined by the actually volume of the panel and the porosity (m3);
the gas transmission rate, depending on the relative humidity and temperature (cm3/m2 s); the standard temperature (K); standard pressure (Pa);
mean temperature of the panel (K); the density of dry VIP (kg/m3),
volume (m3); the water vapour transmission rate according to temperature and relative humidity (g/m2 s);
the saturated vapour pressure according to the temperature (Pa);
the rate of moisture content change over the change in relative humidity (mass%/%RH).
This model from Wegger was one of the most comprehensive in describing the variables which impact the change in conductivity over time, and is one of the strongest references used for the development of a prediction model in this study. The most useful concept in this formula is that the majority of the variables are prescriptive and can be obtained by knowing the physical properties of the material which are easy to obtain from manufacturers, or based on experiments. The two most critical variables which have been obtained through experimental testing are the GTR and the WVTR. Using these concepts, Wegger and collegues used their equation to produce several prediction curves over a period of a century (Wegger et al, 2010). The prediction curves were based on the following equations:
[23] Where;
is the initial conductivity of the evaluated panel (assumed 4.0 mW/(mK)); conductivity due to permeation of gas over time:
,
1,/
[24]
Where , is the conductivity of free gas (W/mK);
is the gas pressure within the panel (Pa);
, is the gas pressure when the conductivity is half of , (Pa);
is the conductivity due to permeation of water over time:
,
1 / , / [25]
, is the conductivity of water vapour (W/mK);
the partial vapour pressure inside the panel (Pa);
/ , is the pressure within the panel when the conductivity is half of , (Pa);
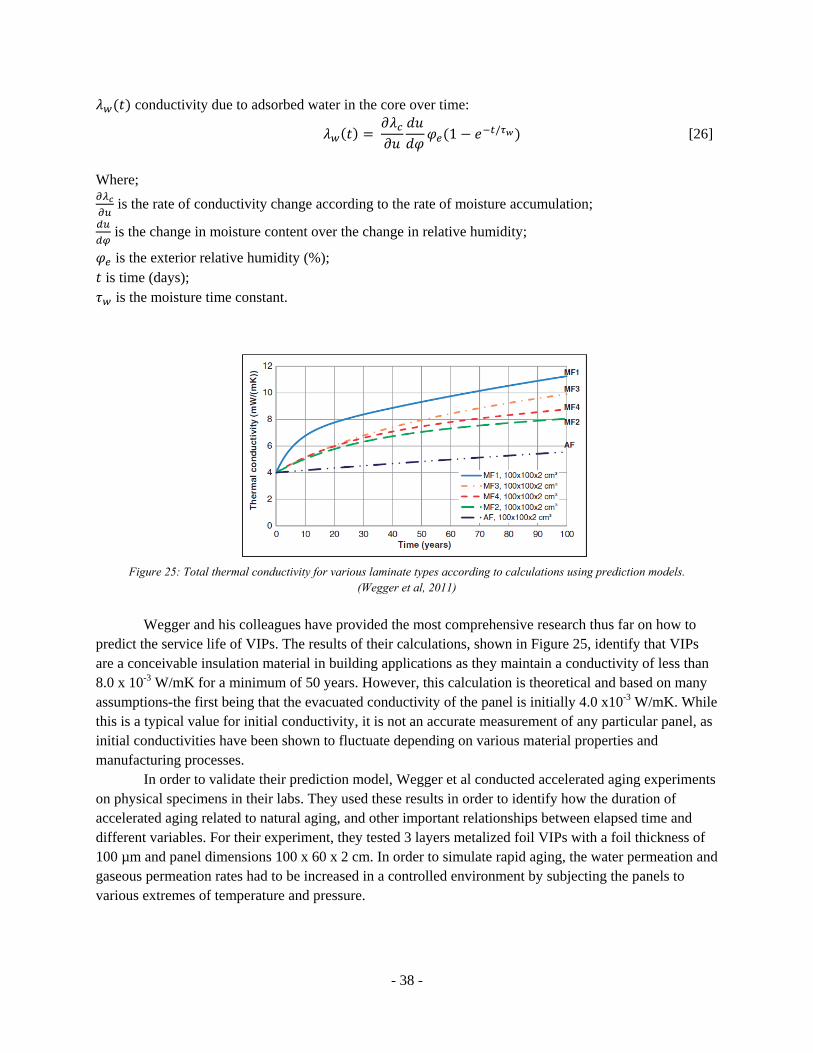
- 38 -
conductivity due to adsorbed water in the core over time:
1 / [26]
Where;
is the rate of conductivity change according to the rate of moisture accumulation;
is the change in moisture content over the change in relative humidity;
is the exterior relative humidity (%); is time (days);
is the moisture time constant.
Figure 25: Total thermal conductivity for various laminate types according to calculations using prediction models.
(Wegger et al, 2011)
Wegger and his colleagues have provided the most comprehensive research thus far on how to predict the service life of VIPs. The results of their calculations, shown in Figure 25, identify that VIPs are a conceivable insulation material in building applications as they maintain a conductivity of less than 8.0 x 10⁻³ W/mK for a minimum of 50 years. However, this calculation is theoretical and based on many assumptions-the first being that the evacuated conductivity of the panel is initially 4.0 x10⁻³ W/mK. While this is a typical value for initial conductivity, it is not an accurate measurement of any particular panel, as initial conductivities have been shown to fluctuate depending on various material properties and manufacturing processes. In order to validate their prediction model, Wegger et al conducted accelerated aging experiments on physical specimens in their labs. They used these results in order to identify how the duration of accelerated aging related to natural aging, and other important relationships between elapsed time and different variables. For their experiment, they tested 3 layers metalized foil VIPs with a foil thickness of 100 µm and panel dimensions 100 x 60 x 2 cm. In order to simulate rapid aging, the water permeation and gaseous permeation rates had to be increased in a controlled environment by subjecting the panels to various extremes of temperature and pressure.
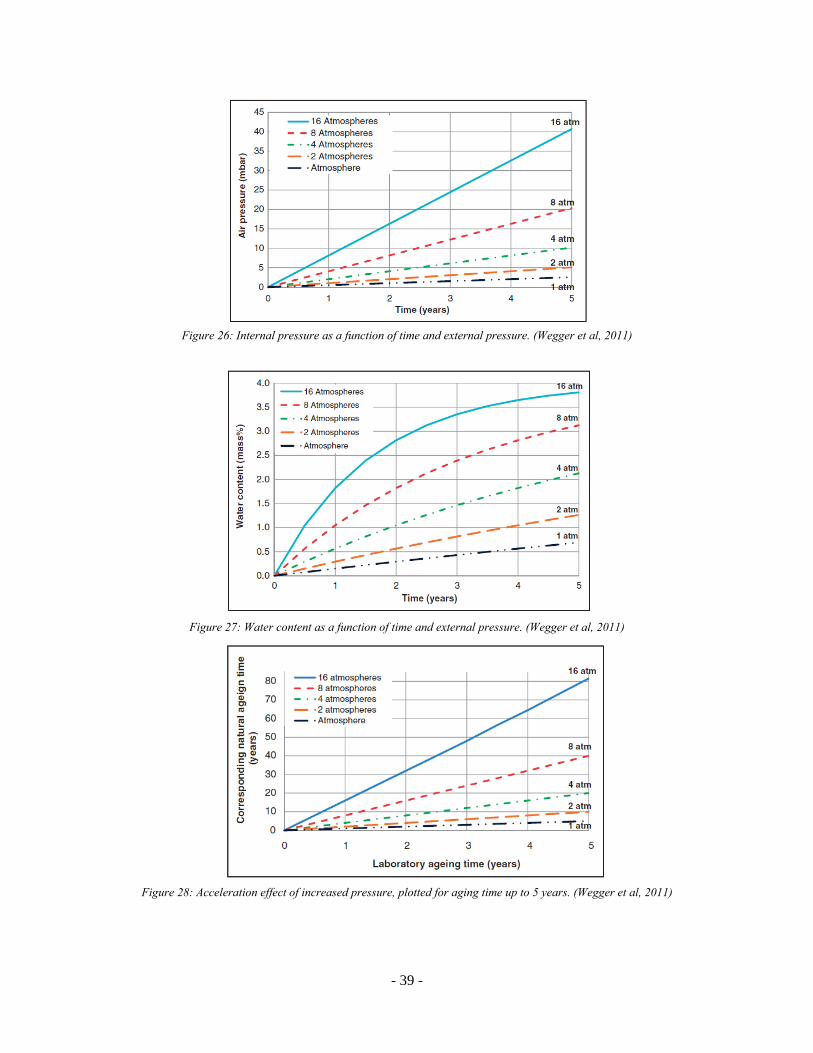
- 39 -
Figure 26: Internal pressure as a function of time and external pressure. (Wegger et al, 2011)
Figure 27: Water content as a function of time and external pressure. (Wegger et al, 2011)
Figure 28: Acceleration effect of increased pressure, plotted for aging time up to 5 years. (Wegger et al, 2011)
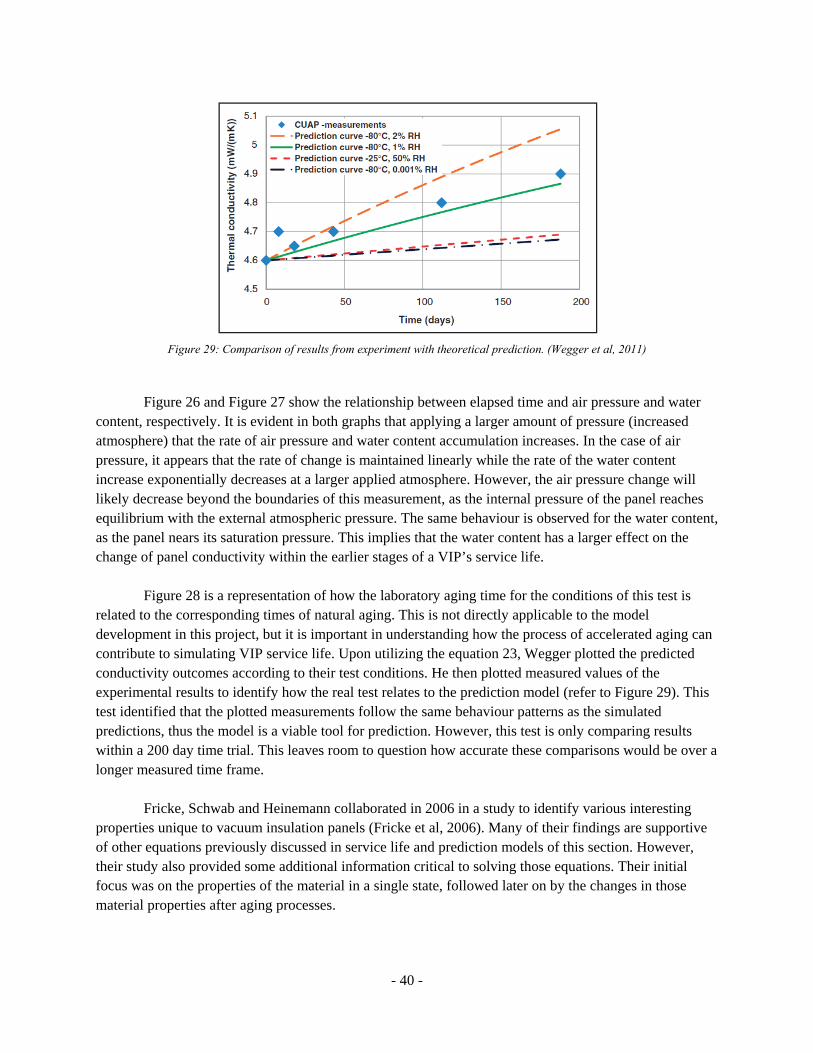
- 40 -
Figure 29: Comparison of results from experiment with theoretical prediction. (Wegger et al, 2011)
Figure 26 and Figure 27 show the relationship between elapsed time and air pressure and water content, respectively. It is evident in both graphs that applying a larger amount of pressure (increased atmosphere) that the rate of air pressure and water content accumulation increases. In the case of air pressure, it appears that the rate of change is maintained linearly while the rate of the water content increase exponentially decreases at a larger applied atmosphere. However, the air pressure change will likely decrease beyond the boundaries of this measurement, as the internal pressure of the panel reaches equilibrium with the external atmospheric pressure. The same behaviour is observed for the water content, as the panel nears its saturation pressure. This implies that the water content has a larger effect on the change of panel conductivity within the earlier stages of a VIP’s service life. Figure 28 is a representation of how the laboratory aging time for the conditions of this test is related to the corresponding times of natural aging. This is not directly applicable to the model development in this project, but it is important in understanding how the process of accelerated aging can contribute to simulating VIP service life. Upon utilizing the equation 23, Wegger plotted the predicted conductivity outcomes according to their test conditions. He then plotted measured values of the experimental results to identify how the real test relates to the prediction model (refer to Figure 29). This test identified that the plotted measurements follow the same behaviour patterns as the simulated predictions, thus the model is a viable tool for prediction. However, this test is only comparing results within a 200 day time trial. This leaves room to question how accurate these comparisons would be over a longer measured time frame. Fricke, Schwab and Heinemann collaborated in 2006 in a study to identify various interesting properties unique to vacuum insulation panels (Fricke et al, 2006). Many of their findings are supportive of other equations previously discussed in service life and prediction models of this section. However, their study also provided some additional information critical to solving those equations. Their initial focus was on the properties of the material in a single state, followed later on by the changes in those material properties after aging processes.
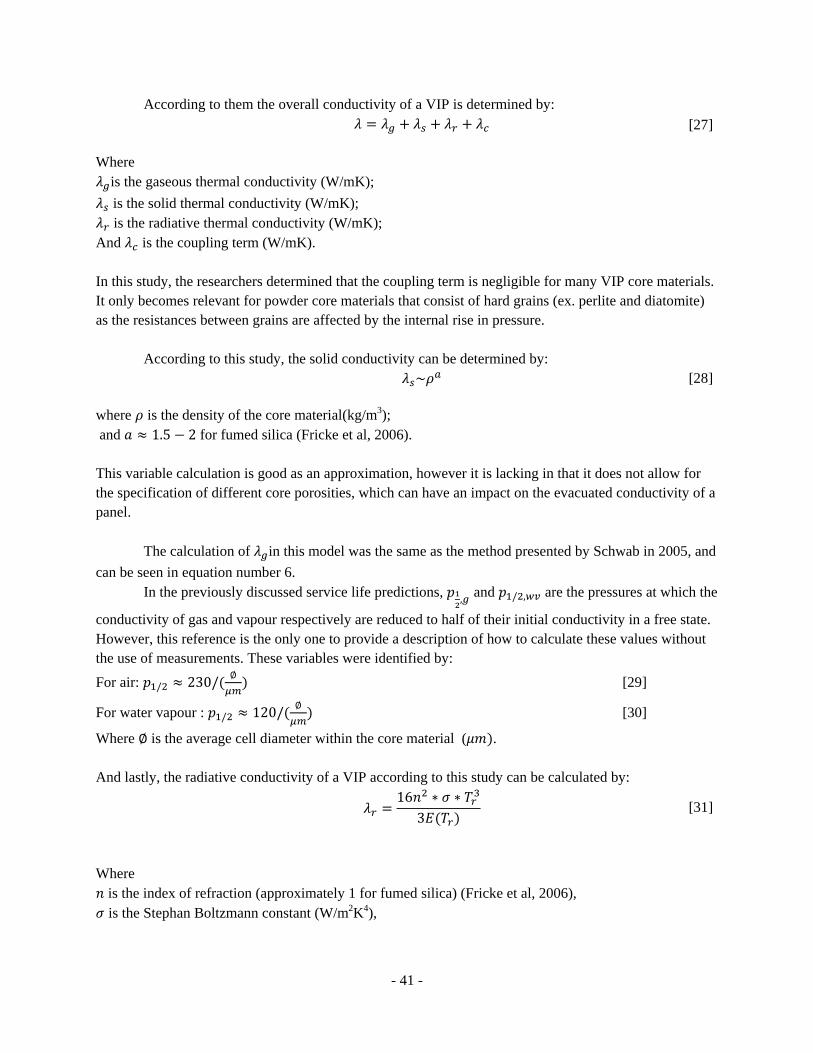
- 41 -
According to them the overall conductivity of a VIP is determined by: [27]
Where
is the gaseous thermal conductivity (W/mK);
is the solid thermal conductivity (W/mK); is the radiative thermal conductivity (W/mK);
And is the coupling term (W/mK). In this study, the researchers determined that the coupling term is negligible for many VIP core materials. It only becomes relevant for powder core materials that consist of hard grains (ex. perlite and diatomite) as the resistances between grains are affected by the internal rise in pressure. According to this study, the solid conductivity can be determined by:
~ [28] where is the density of the core material(kg/m3); and 1.5 2 for fumed silica (Fricke et al, 2006). This variable calculation is good as an approximation, however it is lacking in that it does not allow for the specification of different core porosities, which can have an impact on the evacuated conductivity of a panel. The calculation of in this model was the same as the method presented by Schwab in 2005, and
can be seen in equation number 6. In the previously discussed service life predictions, , and / , are the pressures at which the
conductivity of gas and vapour respectively are reduced to half of their initial conductivity in a free state. However, this reference is the only one to provide a description of how to calculate these values without the use of measurements. These variables were identified by:
For air: / 230/∅
[29]
For water vapour : / 120/∅
[30]
Where ∅ is the average cell diameter within the core material ( . And lastly, the radiative conductivity of a VIP according to this study can be calculated by:
16 ∗ ∗3
[31]
Where
is the index of refraction (approximately 1 for fumed silica) (Fricke et al, 2006), is the Stephan Boltzmann constant (W/m2K4),
- 42 -
is the average temperature within the insulation and can be determined by ∗ /4, where and are the temperatures of the VIP surfaces (K);
And is the Rosseland extinction coefficient according to the average temperature and can be calculated as: where is spectral extinction coefficient and is obtained through measurements at various spectral wavelengths. The average for fumed silica core material is 50-60 m2/kg. This presented model does not specifically relate to the aging of VIPs, as it does not account for changing rates of conductivities, but only for single state measurements. This is not as useful within a prediction model, as it is required to understand the undergoing process in which conductivities change (as discussed, increase of gas pressure, moisture content etc.) However, this calculation can be useful in identifying the initial conductivity of evacuated panels according to their material properties, as many existing prediction models do not account for this accuracy. Each of these analyses provides information on contributing factors to how VIPs age over time based on increases in conductivity. The service life is then determined by how long it takes the panel to exceed the maximum accepted conductivity within building construction. According to most studies this value is 8 x 10⁻³ W/mK, while others allow a conductivity of 11 x 10-3 W/mK (Tenpierik et al, 2010). According to current expectations of performance in the Canadian construction industry, it should take at least 25-50 years (Mukhopadhyaya, 2010) for the panel to reach this conductivity limit to be an acceptable building material. It is extremely inefficient and illogical for one to test a panel consecutively in experimental conditions for 50 years in order to prove the materials eligibility as a building material, before it can be implemented within the industry. For this reason, proving its potential through accelerated aging experimentation processes and through accurate numerical modelling can provide the evidence required to determine whether or not a material is suitable for use in the construction industry.
The models presented here represent work which has been conducted in this field up to this point. One of the issues with each of these service life predictions is that at some point within the process, they are all reliant on measured values, or variables obtained through experimentation. The final goal of a prediction model would be to input potential material values to obtain a service life prediction before deciding which materials to utilize within a building assembly. However, these material values are not yet standardized within the industry and this makes it difficult to synthesize calculations and formulas between different types of research without having to conduct various experiments. The next phase of this project is to utilize the information deduced by these studies and synthesize them into one equation, which can utilize typical material values based on existing research in this field of study.
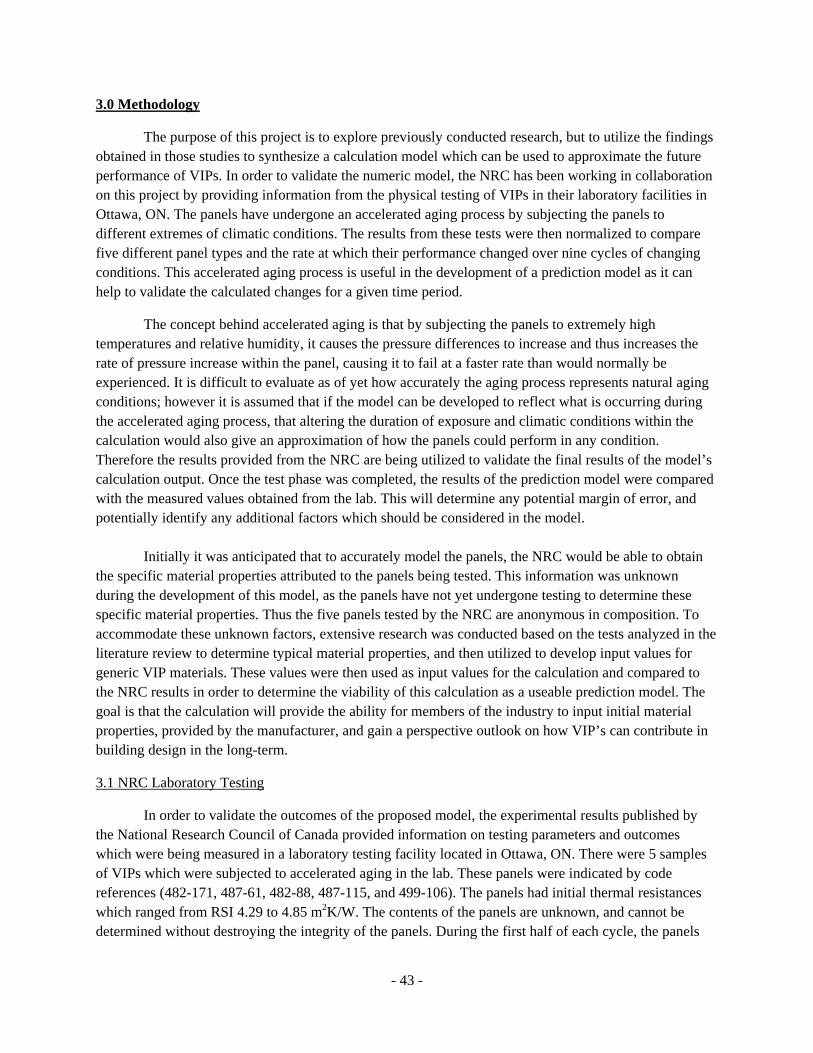
- 43 -
3.0 Methodology
The purpose of this project is to explore previously conducted research, but to utilize the findings obtained in those studies to synthesize a calculation model which can be used to approximate the future performance of VIPs. In order to validate the numeric model, the NRC has been working in collaboration on this project by providing information from the physical testing of VIPs in their laboratory facilities in Ottawa, ON. The panels have undergone an accelerated aging process by subjecting the panels to different extremes of climatic conditions. The results from these tests were then normalized to compare five different panel types and the rate at which their performance changed over nine cycles of changing conditions. This accelerated aging process is useful in the development of a prediction model as it can help to validate the calculated changes for a given time period.
The concept behind accelerated aging is that by subjecting the panels to extremely high temperatures and relative humidity, it causes the pressure differences to increase and thus increases the rate of pressure increase within the panel, causing it to fail at a faster rate than would normally be experienced. It is difficult to evaluate as of yet how accurately the aging process represents natural aging conditions; however it is assumed that if the model can be developed to reflect what is occurring during the accelerated aging process, that altering the duration of exposure and climatic conditions within the calculation would also give an approximation of how the panels could perform in any condition. Therefore the results provided from the NRC are being utilized to validate the final results of the model’s calculation output. Once the test phase was completed, the results of the prediction model were compared with the measured values obtained from the lab. This will determine any potential margin of error, and potentially identify any additional factors which should be considered in the model.
Initially it was anticipated that to accurately model the panels, the NRC would be able to obtain the specific material properties attributed to the panels being tested. This information was unknown during the development of this model, as the panels have not yet undergone testing to determine these specific material properties. Thus the five panels tested by the NRC are anonymous in composition. To accommodate these unknown factors, extensive research was conducted based on the tests analyzed in the literature review to determine typical material properties, and then utilized to develop input values for generic VIP materials. These values were then used as input values for the calculation and compared to the NRC results in order to determine the viability of this calculation as a useable prediction model. The goal is that the calculation will provide the ability for members of the industry to input initial material properties, provided by the manufacturer, and gain a perspective outlook on how VIP’s can contribute in building design in the long-term.
3.1 NRC Laboratory Testing
In order to validate the outcomes of the proposed model, the experimental results published by the National Research Council of Canada provided information on testing parameters and outcomes which were being measured in a laboratory testing facility located in Ottawa, ON. There were 5 samples of VIPs which were subjected to accelerated aging in the lab. These panels were indicated by code references (482-171, 487-61, 482-88, 487-115, and 499-106). The panels had initial thermal resistances which ranged from RSI 4.29 to 4.85 m2K/W. The contents of the panels are unknown, and cannot be determined without destroying the integrity of the panels. During the first half of each cycle, the panels
- 44 -
were kept in conditions of 23°C, 95% RH for seven days. For the next seven days the panels were then kept in conditions at 70°C, 5%RH. 5% is an estimation for the second half of the cycle as the attempt was to achieve as close to 0% as possible. The panels went through these fourteen day cycles nine times and measured at the end of each half cycle to determine the change in thermal resistance. Since the initial thermal resistances varied, these numbers were normalized in order to compare the change of performance in each panel. The results can be seen in Figure 30.
Figure 30: Results of the accelerated aging effects on five VIP products, conducted by the NRC (Mukhopadhyaya, 2011)
In this graph, it is seen that 3 of the VIP products behaved in a similar manner (487-61, 482-171 and 487-115) where their initial thermal resistance was reduced to 95% of the original value. The decrease in performance ranged for each product from 0.37-3.51% of the initial RSI value per cycle. The maximum reduction observed in this time was 19% of the initial thermal resistance, the minimum was 10%, while the average reduction after seven simulated years was 13%. Product 499-106 can be seen diminishing at a much faster rate than the other panels. The result of this testing for product 482-88 is inconclusive as it is observed to increase in thermal resistance before reducing at a rate similar to the average cases. The hypothesis for this behaviour is attributed to the adsorption capacity of core materials at higher temperatures, which may have caused the resistance to increase during the second half of the testing cycles. The anticipated outcome of this project is then that, if VIPS are simulated using a calculation model which utilizes the same cycle durations and conditions, the resulting change in thermal conductivity should follow a curve similar to these output results. The model can then be altered to simulate a typical Canadian climate over a normal aging curve to determine the predicted performance.
- 45 -
3.2 Explanation of Proposed Numerical Model
A numerical model was assembled in an attempt to predict the aging performance of Vacuum Insulation Panels (VIPs), using concepts from the existing research. This model was assembled based on the findings of researchers who have analyzed this product and have produced their own calculations to solve various properties of this material. While there have been some studies focused on creating holistic models for aging performance, which aim to encompass all methods of heat transfer and decomposition of panel performance, these models have all been used in tangent with experimental results retrieved through physical testing. The intention of the model produced in this report is to provide a tool which can predict the approximate thermal conductivity of panels over extended periods of time, with simple inputs of known material properties. This will be achieved by providing a database of results from relevant experiments, so that if there is an unknown material property (or an unspecific value) the value for this component can be estimated based on similar materials. This model will then be used to solve various scenarios and compared with equivalent test results in order to validate its accuracy.
Based on supported research from the literature review, the following model was utilized (referenced from equations 6, 23 and 27):
[32]
Where is the overall thermal conductivity of the panel after a given amount of time (W/mK); is the initial thermal conductivity of the evacuated panel (W/mK). This value is based on the thermal
heat transfer via radiation and solid conduction ( ; is the thermal conductivity as a function of gaseous diffusion over time (W/mK);
is the thermal conductivity as a function of water vapour permeation over time (W/mK); is the thermal conductivity as a function of accumulated moisture content within the panels over
time (W/mK); and is the thermal conductivity of the panel as a component of the coupling effect (W/mK), which
accounts for proponents of variables which can act as driving mechanisms for other heat transfer variables. Throughout the studies analyzed, there was a consensus that this variable is negligible for fumed silica VIPs.
Using this initial equation, each of the conductivity components was derived according to methods agreed upon by various studies and other developed models, which account for the material properties and climatic conditions to determine each of those conductivities. Upon deriving these components, the resulting equation is proposed for this prediction model as follows:
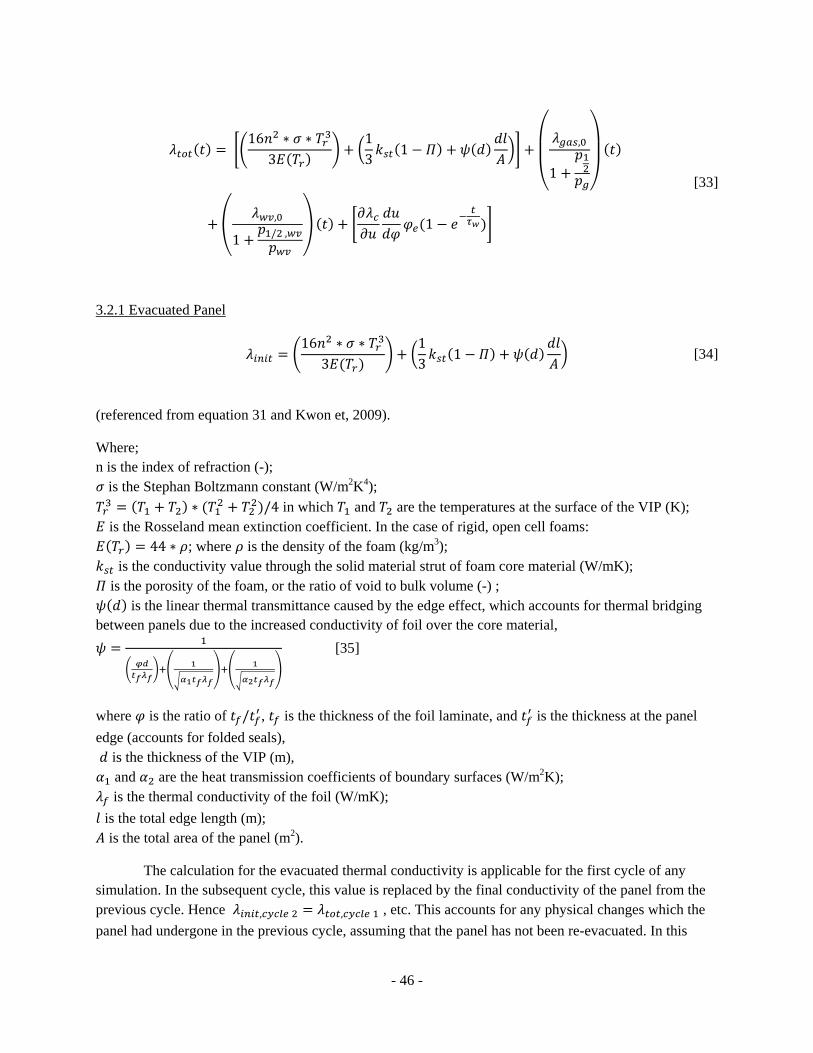
- 46 -
16 ∗ ∗
313
1,
1
,
1 / ,1
[33]
3.2.1 Evacuated Panel
16 ∗ ∗
313
1 [34]
(referenced from equation 31 and Kwon et, 2009).
Where; n is the index of refraction (-);
is the Stephan Boltzmann constant (W/m2K4);
∗ /4 in which and are the temperatures at the surface of the VIP (K); is the Rosseland mean extinction coefficient. In the case of rigid, open cell foams:
44 ∗ ; where is the density of the foam (kg/m3); is the conductivity value through the solid material strut of foam core material (W/mK);
is the porosity of the foam, or the ratio of void to bulk volume (-) ; is the linear thermal transmittance caused by the edge effect, which accounts for thermal bridging
between panels due to the increased conductivity of foil over the core material,
[35]
where is the ratio of / , is the thickness of the foil laminate, and is the thickness at the panel
edge (accounts for folded seals), is the thickness of the VIP (m),
and are the heat transmission coefficients of boundary surfaces (W/m2K); is the thermal conductivity of the foil (W/mK);
is the total edge length (m); is the total area of the panel (m2).
The calculation for the evacuated thermal conductivity is applicable for the first cycle of any simulation. In the subsequent cycle, this value is replaced by the final conductivity of the panel from the previous cycle. Hence , , , etc. This accounts for any physical changes which the
panel had undergone in the previous cycle, assuming that the panel has not been re-evacuated. In this
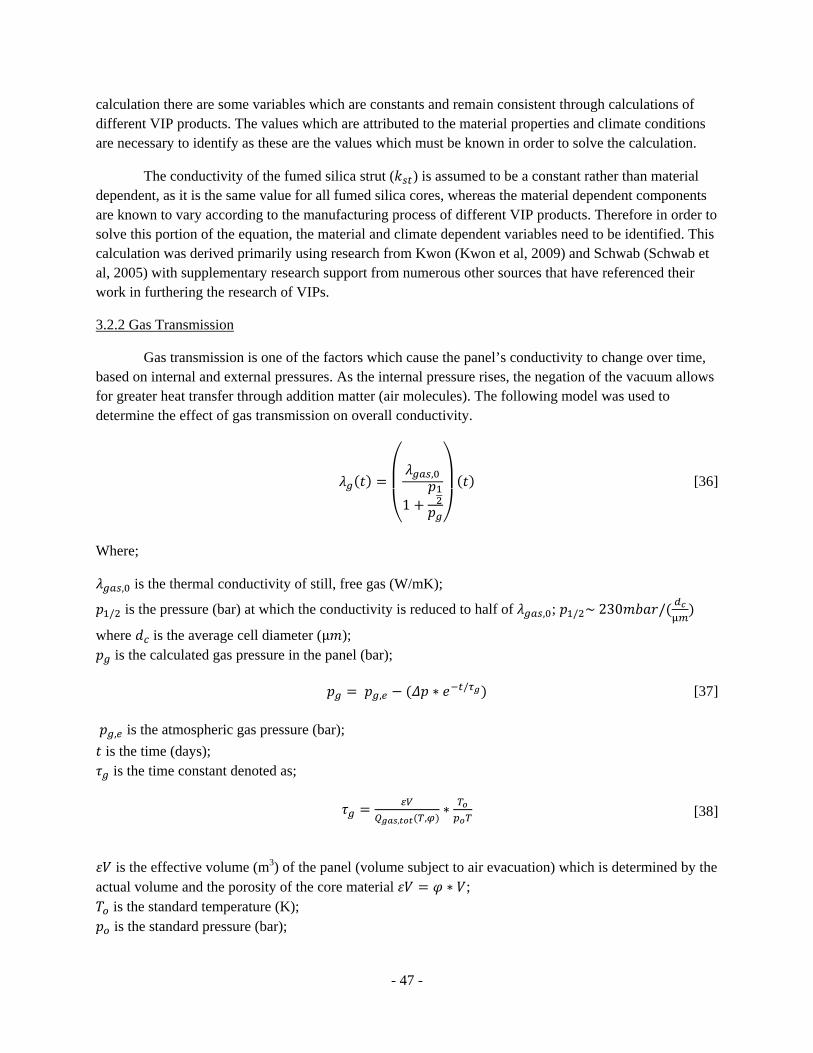
- 47 -
calculation there are some variables which are constants and remain consistent through calculations of different VIP products. The values which are attributed to the material properties and climate conditions are necessary to identify as these are the values which must be known in order to solve the calculation.
The conductivity of the fumed silica strut ( ) is assumed to be a constant rather than material dependent, as it is the same value for all fumed silica cores, whereas the material dependent components are known to vary according to the manufacturing process of different VIP products. Therefore in order to solve this portion of the equation, the material and climate dependent variables need to be identified. This calculation was derived primarily using research from Kwon (Kwon et al, 2009) and Schwab (Schwab et al, 2005) with supplementary research support from numerous other sources that have referenced their work in furthering the research of VIPs.
3.2.2 Gas Transmission
Gas transmission is one of the factors which cause the panel’s conductivity to change over time, based on internal and external pressures. As the internal pressure rises, the negation of the vacuum allows for greater heat transfer through addition matter (air molecules). The following model was used to determine the effect of gas transmission on overall conductivity.
,
1
[36]
Where;
, is the thermal conductivity of still, free gas (W/mK);
/ is the pressure (bar) at which the conductivity is reduced to half of , ; / ~230 /
where is the average cell diameter (μ ); is the calculated gas pressure in the panel (bar);
, ∗ / [37] , is the atmospheric gas pressure (bar);
is the time (days); is the time constant denoted as;
, ,
∗ [38]
is the effective volume (m3) of the panel (volume subject to air evacuation) which is determined by the actual volume and the porosity of the core material ∗ ;
is the standard temperature (K); is the standard pressure (bar);
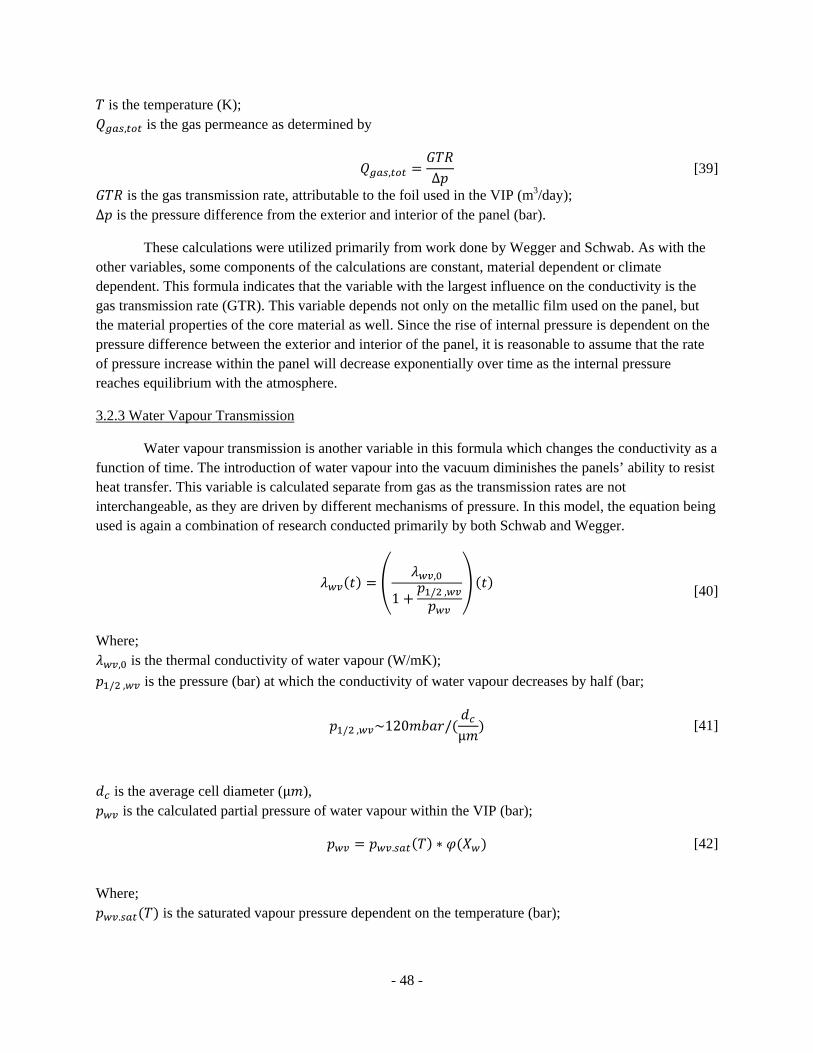
- 48 -
is the temperature (K);
, is the gas permeance as determined by
, ∆ [39]
is the gas transmission rate, attributable to the foil used in the VIP (m3/day); ∆ is the pressure difference from the exterior and interior of the panel (bar).
These calculations were utilized primarily from work done by Wegger and Schwab. As with the other variables, some components of the calculations are constant, material dependent or climate dependent. This formula indicates that the variable with the largest influence on the conductivity is the gas transmission rate (GTR). This variable depends not only on the metallic film used on the panel, but the material properties of the core material as well. Since the rise of internal pressure is dependent on the pressure difference between the exterior and interior of the panel, it is reasonable to assume that the rate of pressure increase within the panel will decrease exponentially over time as the internal pressure reaches equilibrium with the atmosphere.
3.2.3 Water Vapour Transmission
Water vapour transmission is another variable in this formula which changes the conductivity as a function of time. The introduction of water vapour into the vacuum diminishes the panels’ ability to resist heat transfer. This variable is calculated separate from gas as the transmission rates are not interchangeable, as they are driven by different mechanisms of pressure. In this model, the equation being used is again a combination of research conducted primarily by both Schwab and Wegger.
,
1 / ,
[40]
Where;
, is the thermal conductivity of water vapour (W/mK);
/ , is the pressure (bar) at which the conductivity of water vapour decreases by half (bar;
/ , ~120 /μ
[41]
is the average cell diameter (μ ), is the calculated partial pressure of water vapour within the VIP (bar);
. ∗ [42]
Where;
. is the saturated vapour pressure dependent on the temperature (bar);
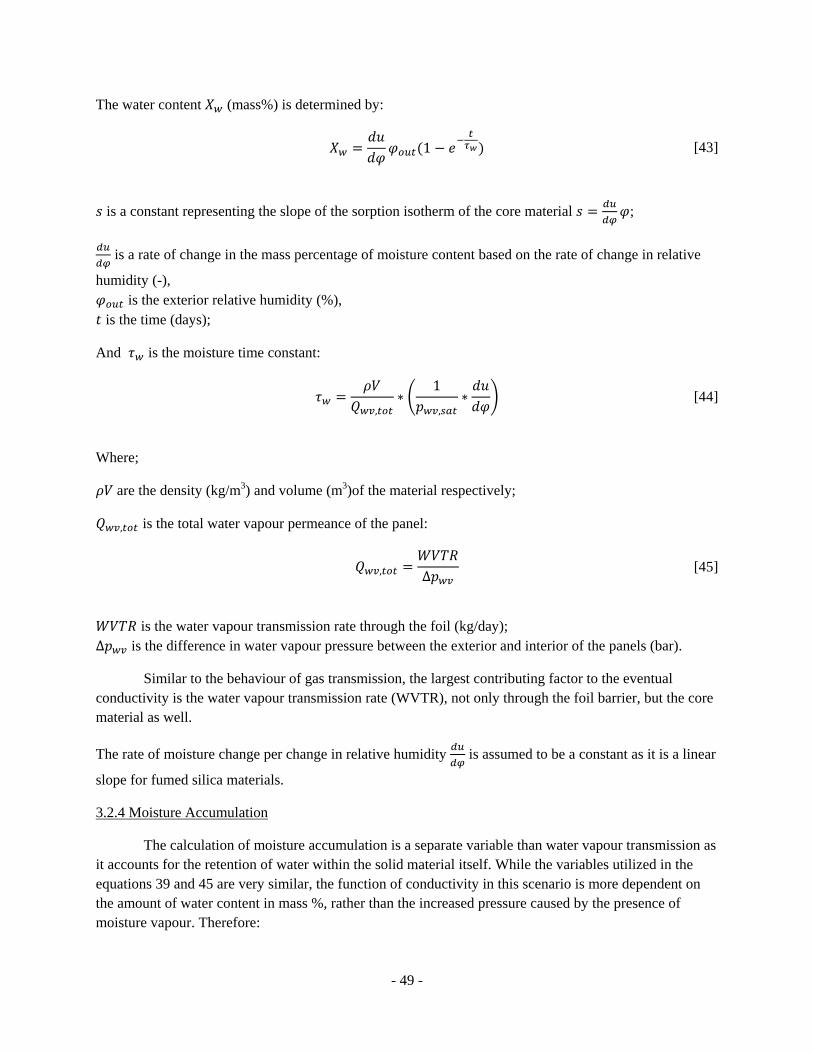
- 49 -
The water content (mass%) is determined by:
1 [43]
is a constant representing the slope of the sorption isotherm of the core material ;
is a rate of change in the mass percentage of moisture content based on the rate of change in relative
humidity (-), is the exterior relative humidity (%),
is the time (days);
And is the moisture time constant:
,
∗1
,∗ [44]
Where;
are the density (kg/m3) and volume (m3)of the material respectively;
, is the total water vapour permeance of the panel:
, ∆ [45]
is the water vapour transmission rate through the foil (kg/day); ∆ is the difference in water vapour pressure between the exterior and interior of the panels (bar).
Similar to the behaviour of gas transmission, the largest contributing factor to the eventual conductivity is the water vapour transmission rate (WVTR), not only through the foil barrier, but the core material as well.
The rate of moisture change per change in relative humidity is assumed to be a constant as it is a linear
slope for fumed silica materials.
3.2.4 Moisture Accumulation
The calculation of moisture accumulation is a separate variable than water vapour transmission as it accounts for the retention of water within the solid material itself. While the variables utilized in the equations 39 and 45 are very similar, the function of conductivity in this scenario is more dependent on the amount of water content in mass %, rather than the increased pressure caused by the presence of moisture vapour. Therefore:
- 50 -
1
[46]
Where
is a rate is conductivity change due to a change in moisture content;
This value was determined by Schwab to be 0.29mW/mK (Schwab et al, 2005), and is a considered a constant for fumed silica materials. (See section 3.2.3 Water Vapour Transmission for definitions of other variables).
3.3 Assumptions and Excluded Variables
The development of this model was heavily reliant on existing research which has already been confirmed in the field of study. However, these equations are lacking certain components which need to be considered when determining the suitability for VIPs in the use of building applications. The inclusion of the following excluded variables within this calculation is not included in the scope of this report, although they could have an impact on a panel’s overall performance. The first thing to consider is that the accuracy of these results is dependent on the accuracy of the information from the referenced studies. This calculation should not be considered an accurate representation of a panel’s service life, but rather an approximation of the panel’s future behaviour identifying the potential performance over extended periods of time.
Another assumption made in this equation is two dimensional steady state heat transfer. While the initial conductivity does account for linear thermal transmittance, it is not completely accurate as there is increased heat transfer in the corners. While it also accounts for the type of seam per panel, it does not account for increased heat transfer dependent on the connection between panels (i.e. the resistance throughout the panel configuration will alter depending on the consistency of the connection between panels). It should also be noted that this calculation accounts for various climate conditions over given amounts of time. However, the natural conditions would not instantly change from one condition to another (i.e. winter does not instantaneously become summer). Therefore it is assumed that a longer duration at the extremities would account for any conductivity changes which occur during transitional states.
This calculation does not account for structural and physical deterioration factors. For example, exposure to ultraviolet radiation could cause the foil to weaken thereby causing higher transmission rates of gas and moisture. Effects from this kind of exposure may be prevented by other materials within the assembly, however these factors should not be overlooked. Also, the oxidation of the metallic foil also has an impact on the transmission rate of air as deficiencies within the foil increase. The calculation does not account for exposure to pollutants and acidity that could contribute to degradation of materials over time. However it is assumed that because the values utilized in this report have been obtained from outside sources that compiled results through experimental measurements, that these deficiencies are inherent in the calculated values.
The outgassing rate of the core material was also excluded from this calculation. The outgassing rate is negligible due to the exponential rate at which it decreases. While it may have an effect on the
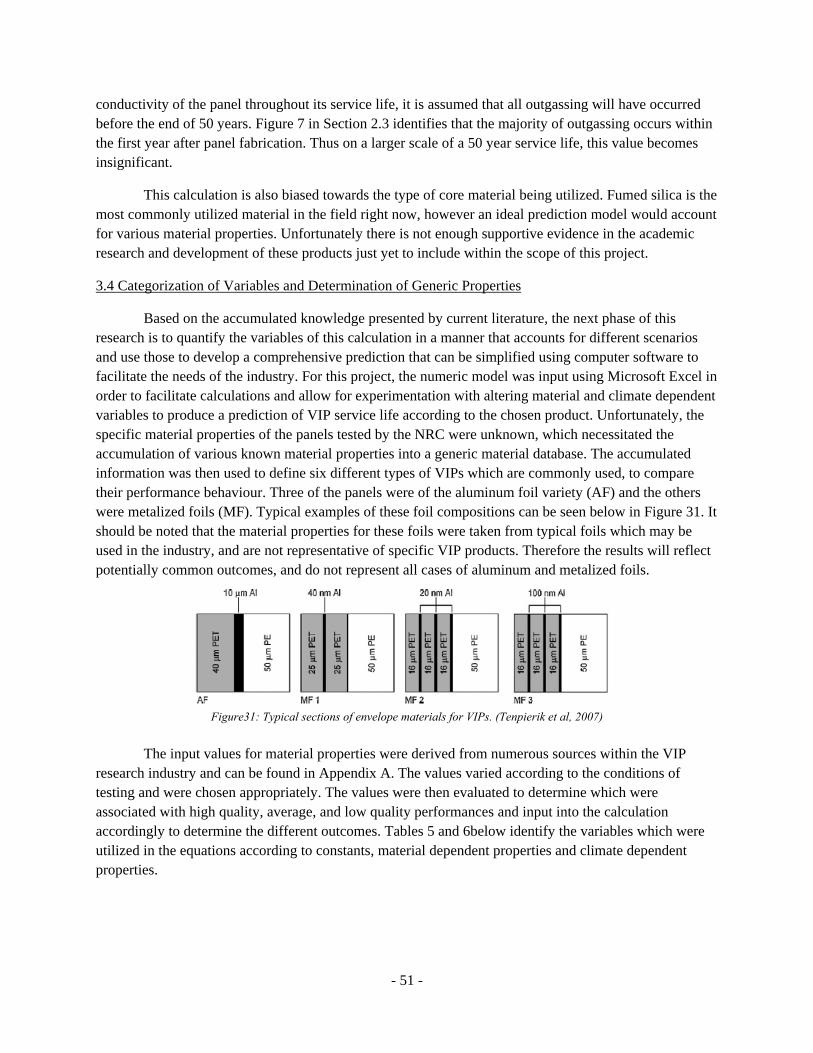
- 51 -
conductivity of the panel throughout its service life, it is assumed that all outgassing will have occurred before the end of 50 years. Figure 7 in Section 2.3 identifies that the majority of outgassing occurs within the first year after panel fabrication. Thus on a larger scale of a 50 year service life, this value becomes insignificant.
This calculation is also biased towards the type of core material being utilized. Fumed silica is the most commonly utilized material in the field right now, however an ideal prediction model would account for various material properties. Unfortunately there is not enough supportive evidence in the academic research and development of these products just yet to include within the scope of this project.
3.4 Categorization of Variables and Determination of Generic Properties
Based on the accumulated knowledge presented by current literature, the next phase of this research is to quantify the variables of this calculation in a manner that accounts for different scenarios and use those to develop a comprehensive prediction that can be simplified using computer software to facilitate the needs of the industry. For this project, the numeric model was input using Microsoft Excel in order to facilitate calculations and allow for experimentation with altering material and climate dependent variables to produce a prediction of VIP service life according to the chosen product. Unfortunately, the specific material properties of the panels tested by the NRC were unknown, which necessitated the accumulation of various known material properties into a generic material database. The accumulated information was then used to define six different types of VIPs which are commonly used, to compare their performance behaviour. Three of the panels were of the aluminum foil variety (AF) and the others were metalized foils (MF). Typical examples of these foil compositions can be seen below in Figure 31. It should be noted that the material properties for these foils were taken from typical foils which may be used in the industry, and are not representative of specific VIP products. Therefore the results will reflect potentially common outcomes, and do not represent all cases of aluminum and metalized foils.
Figure31: Typical sections of envelope materials for VIPs. (Tenpierik et al, 2007)
The input values for material properties were derived from numerous sources within the VIP
research industry and can be found in Appendix A. The values varied according to the conditions of testing and were chosen appropriately. The values were then evaluated to determine which were associated with high quality, average, and low quality performances and input into the calculation accordingly to determine the different outcomes. Tables 5 and 6below identify the variables which were utilized in the equations according to constants, material dependent properties and climate dependent properties.
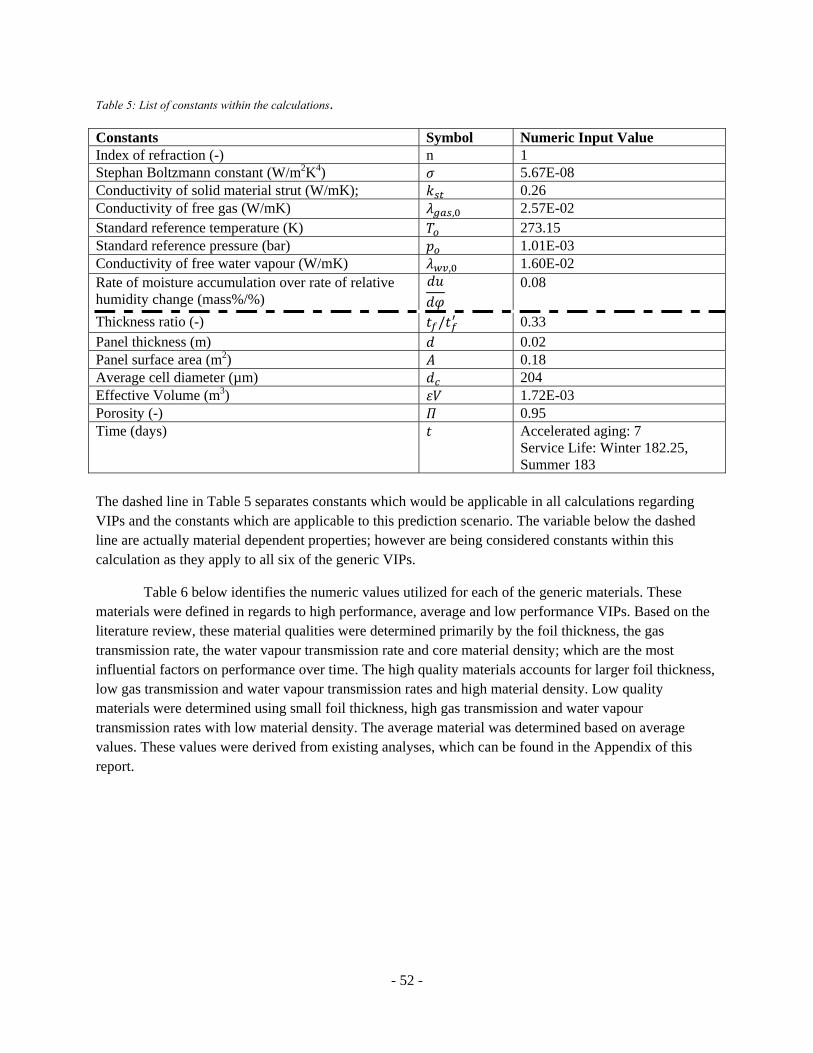
- 52 -
Table 5: List of constants within the calculations.
Constants Symbol Numeric Input Value Index of refraction (-) n 1 Stephan Boltzmann constant (W/m2K4) 5.67E-08 Conductivity of solid material strut (W/mK); 0.26 Conductivity of free gas (W/mK) , 2.57E-02 Standard reference temperature (K) 273.15 Standard reference pressure (bar) 1.01E-03 Conductivity of free water vapour (W/mK) , 1.60E-02 Rate of moisture accumulation over rate of relative humidity change (mass%/%)
0.08
Thickness ratio (-) / 0.33 Panel thickness (m) 0.02 Panel surface area (m2) 0.18 Average cell diameter (µm) 204 Effective Volume (m3) 1.72E-03 Porosity (-) 0.95 Time (days) Accelerated aging: 7
Service Life: Winter 182.25, Summer 183
The dashed line in Table 5 separates constants which would be applicable in all calculations regarding VIPs and the constants which are applicable to this prediction scenario. The variable below the dashed line are actually material dependent properties; however are being considered constants within this calculation as they apply to all six of the generic VIPs.
Table 6 below identifies the numeric values utilized for each of the generic materials. These materials were defined in regards to high performance, average and low performance VIPs. Based on the literature review, these material qualities were determined primarily by the foil thickness, the gas transmission rate, the water vapour transmission rate and core material density; which are the most influential factors on performance over time. The high quality materials accounts for larger foil thickness, low gas transmission and water vapour transmission rates and high material density. Low quality materials were determined using small foil thickness, high gas transmission and water vapour transmission rates with low material density. The average material was determined based on average values. These values were derived from existing analyses, which can be found in the Appendix of this report.

- 53 -
Table 6: List of material dependent variables within equation for each VIP type calculated. MF=metalized foil, AF=aluminum foil.
Generic Foil Type
Foil Conductivity
(W/mK)
Foil Thickness
(m) Gas Transmission Rate (m3/d)
Water Vapour Transmission Rate
(kg/d) Density (kg/m3)
MF Avg. 1.25 8.57E-05
@ mid T, high RH = 3.35E-09 @high T, low RH = 2.58E-09 @ mid T, mid RH = 4.20E-09
@ mid T, high RH = 3.36E-06 @high T, low RH = 8.51E-07 @ mid T, mid RH = 1.08E-06 515.03
MF High 1.25 1.01E-04
@ mid T, high RH = 7.80 E-11 @high T, low RH = 8.00E-11 @ mid T, mid RH = 4.20E-09
@ mid T, high RH = 3.24E-07 @high T, low RH = 1.62E-07 @ mid T, mid RH = 1.98E-07 991.96
MF Low 1.25 6.41E-05
@ mid T, high RH = 1.37E-08 @high T, low RH = 8.82E-09 @ mid T, mid RH = 1.57E-08
@ mid T, high RH = 7.20E-06 @high T, low RH = 1.80E-06 @ mid T, mid RH = 4.20E-06 319
AF Avg. 0.33 1.15E-04
@ mid T, high RH = 2.88E-10 @high T, low RH = 1.09E-09 @ mid T, mid RH = 1.00E-09
@ mid T, high RH = 2.70E-07 @high T, low RH = 1.71E-07 @ mid T, mid RH = 3.64E-07 515.03
AF High 0.33 1.20E-04
@ mid T, high RH = 3.60E-11 @high T, low RH = 2.00E-10 @ mid T, mid RH = 3.00E-11
@ mid T, high RH = 1.08E-07 @high T, low RH = 1.44E-07 @ mid T, mid RH = 9.00E-08 991.96
AF Low 0.33 1.00E-04
@ mid T, high RH = 5.40E-10 @high T, low RH = 1.98E-09 @ mid T, mid RH = 5.40E-09
@ mid T, high RH = 3.60E-07 @high T, low RH = 1.98E-07 @ mid T, mid RH = 9.00E-07 319
***Note: The gas and water vapour transmission rates change according to temperature and relative humidity. For this reason, it was necessary to derive three different rates appropriate for the climatic conditions used in this evaluation.
Table 7: Climate dependent conditions used to simulate accelerated aging (7 days per cycle).
Tr (K)
pg inside (bar)
pg outside (bar)
pwv, sat (bar)
pwv, e (bar)
pwv, in (bar) RH
Cycle 1.1 296.15 0 1.01E+00 0.03 0.026686 0 0.95 Cycle 1.2 343.15 9.56E-07 1.01E+00 0.0312 0.00156 9.56E-07 0.05
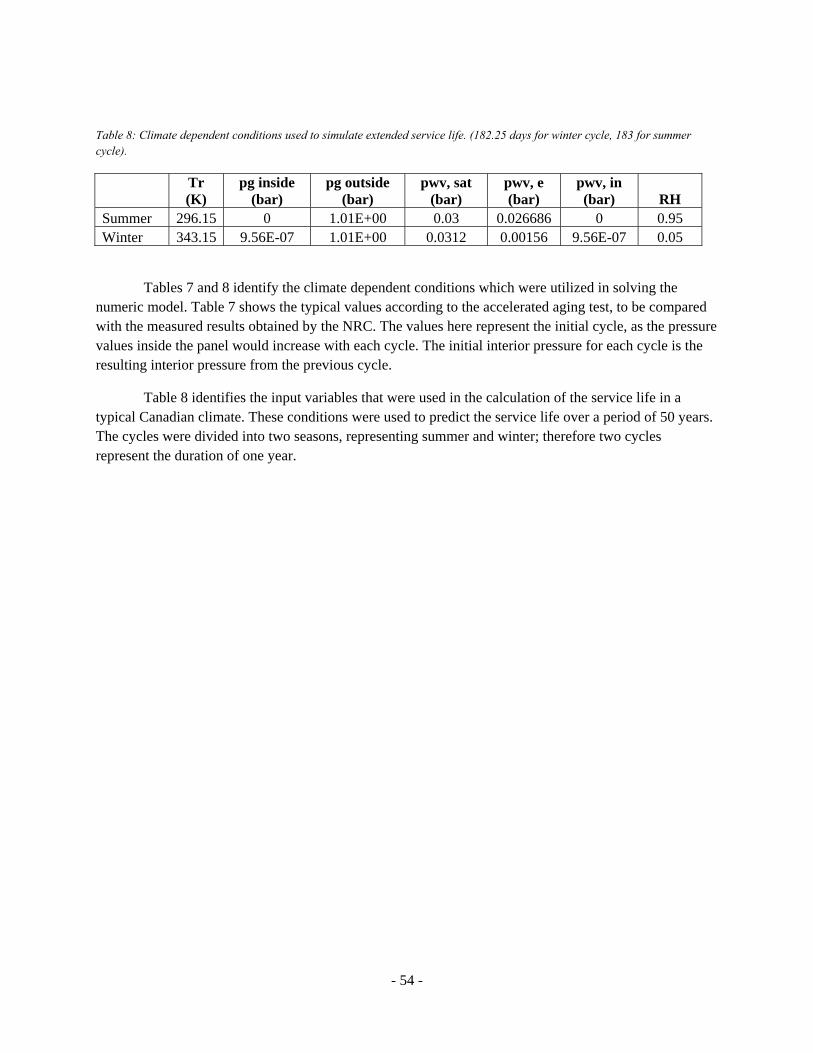
- 54 -
Table 8: Climate dependent conditions used to simulate extended service life. (182.25 days for winter cycle, 183 for summer cycle).
Tr (K)
pg inside (bar)
pg outside (bar)
pwv, sat (bar)
pwv, e (bar)
pwv, in (bar) RH
Summer 296.15 0 1.01E+00 0.03 0.026686 0 0.95 Winter 343.15 9.56E-07 1.01E+00 0.0312 0.00156 9.56E-07 0.05
Tables 7 and 8 identify the climate dependent conditions which were utilized in solving the numeric model. Table 7 shows the typical values according to the accelerated aging test, to be compared with the measured results obtained by the NRC. The values here represent the initial cycle, as the pressure values inside the panel would increase with each cycle. The initial interior pressure for each cycle is the resulting interior pressure from the previous cycle.
Table 8 identifies the input variables that were used in the calculation of the service life in a typical Canadian climate. These conditions were used to predict the service life over a period of 50 years. The cycles were divided into two seasons, representing summer and winter; therefore two cycles represent the duration of one year.
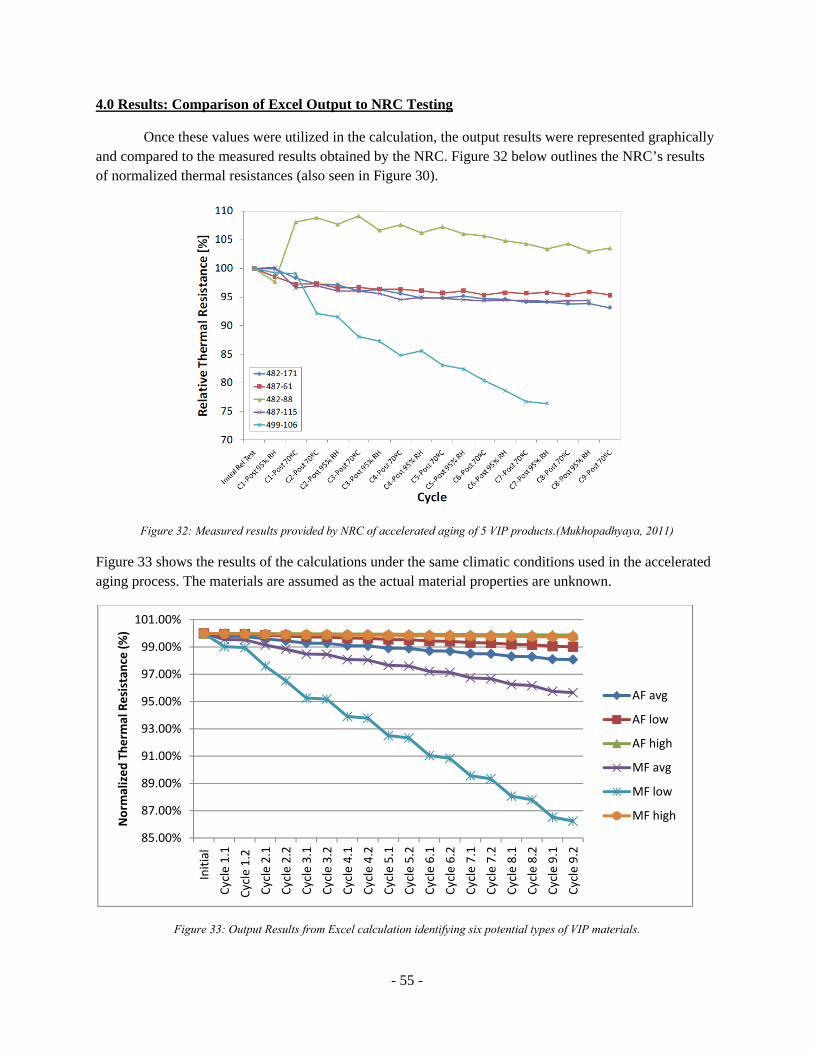
- 55 -
4.0 Results: Comparison of Excel Output to NRC Testing
Once these values were utilized in the calculation, the output results were represented graphically and compared to the measured results obtained by the NRC. Figure 32 below outlines the NRC’s results of normalized thermal resistances (also seen in Figure 30).
Figure 32: Measured results provided by NRC of accelerated aging of 5 VIP products.(Mukhopadhyaya, 2011)
Figure 33 shows the results of the calculations under the same climatic conditions used in the accelerated aging process. The materials are assumed as the actual material properties are unknown.
Figure 33: Output Results from Excel calculation identifying six potential types of VIP materials.
85.00%
87.00%
89.00%
91.00%
93.00%
95.00%
97.00%
99.00%
101.00%
Initial
Cycle 1.1
Cycle 1.2
Cycle 2.1
Cycle 2.2
Cycle 3.1
Cycle 3.2
Cycle 4.1
Cycle 4.2
Cycle 5.1
Cycle 5.2
Cycle 6.1
Cycle 6.2
Cycle 7.1
Cycle 7.2
Cycle 8.1
Cycle 8.2
Cycle 9.1
Cycle 9.2
Norm
alized Therm
al Resistan
ce (%)
AF avg
AF low
AF high
MF avg
MF low
MF high
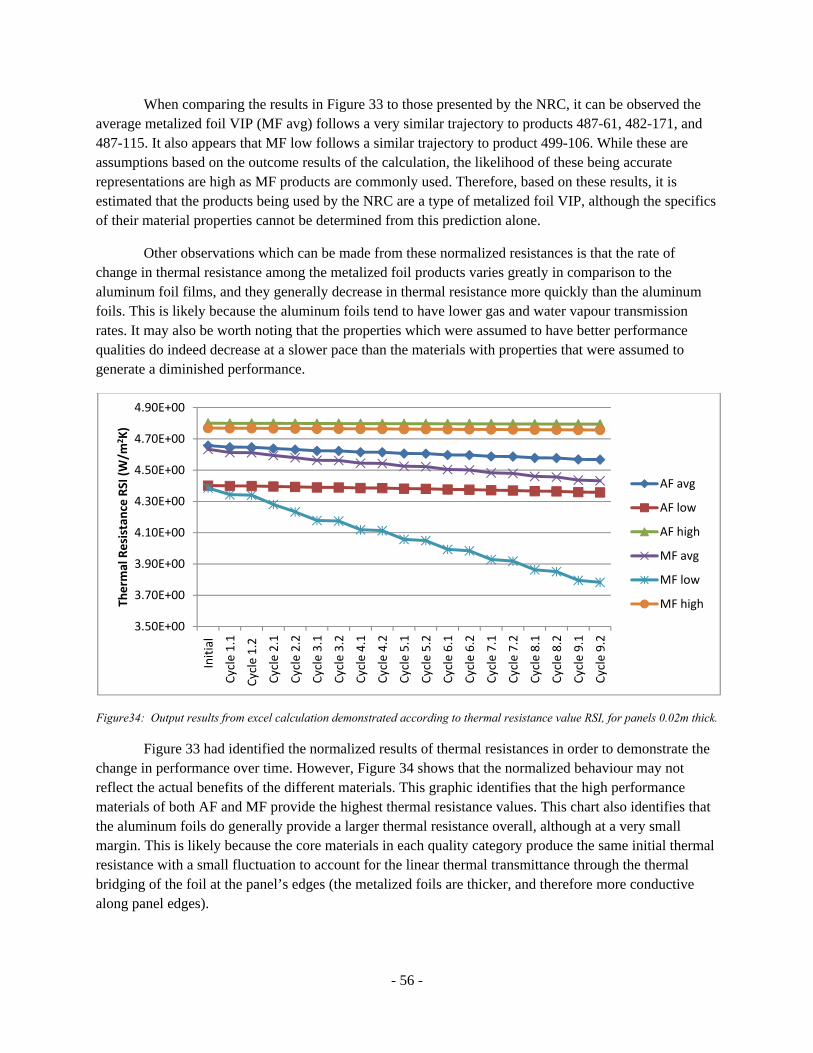
- 56 -
When comparing the results in Figure 33 to those presented by the NRC, it can be observed the average metalized foil VIP (MF avg) follows a very similar trajectory to products 487-61, 482-171, and 487-115. It also appears that MF low follows a similar trajectory to product 499-106. While these are assumptions based on the outcome results of the calculation, the likelihood of these being accurate representations are high as MF products are commonly used. Therefore, based on these results, it is estimated that the products being used by the NRC are a type of metalized foil VIP, although the specifics of their material properties cannot be determined from this prediction alone.
Other observations which can be made from these normalized resistances is that the rate of change in thermal resistance among the metalized foil products varies greatly in comparison to the aluminum foil films, and they generally decrease in thermal resistance more quickly than the aluminum foils. This is likely because the aluminum foils tend to have lower gas and water vapour transmission rates. It may also be worth noting that the properties which were assumed to have better performance qualities do indeed decrease at a slower pace than the materials with properties that were assumed to generate a diminished performance.
Figure34: Output results from excel calculation demonstrated according to thermal resistance value RSI, for panels 0.02m thick.
Figure 33 had identified the normalized results of thermal resistances in order to demonstrate the change in performance over time. However, Figure 34 shows that the normalized behaviour may not reflect the actual benefits of the different materials. This graphic identifies that the high performance materials of both AF and MF provide the highest thermal resistance values. This chart also identifies that the aluminum foils do generally provide a larger thermal resistance overall, although at a very small margin. This is likely because the core materials in each quality category produce the same initial thermal resistance with a small fluctuation to account for the linear thermal transmittance through the thermal bridging of the foil at the panel’s edges (the metalized foils are thicker, and therefore more conductive along panel edges).
3.50E+00
3.70E+00
3.90E+00
4.10E+00
4.30E+00
4.50E+00
4.70E+00
4.90E+00
Initial
Cycle 1.1
Cycle 1.2
Cycle 2.1
Cycle 2.2
Cycle 3.1
Cycle 3.2
Cycle 4.1
Cycle 4.2
Cycle 5.1
Cycle 5.2
Cycle 6.1
Cycle 6.2
Cycle 7.1
Cycle 7.2
Cycle 8.1
Cycle 8.2
Cycle 9.1
Cycle 9.2
Therm
al Resistan
ce RSI (W/m
2K)
AF avg
AF low
AF high
MF avg
MF low
MF high
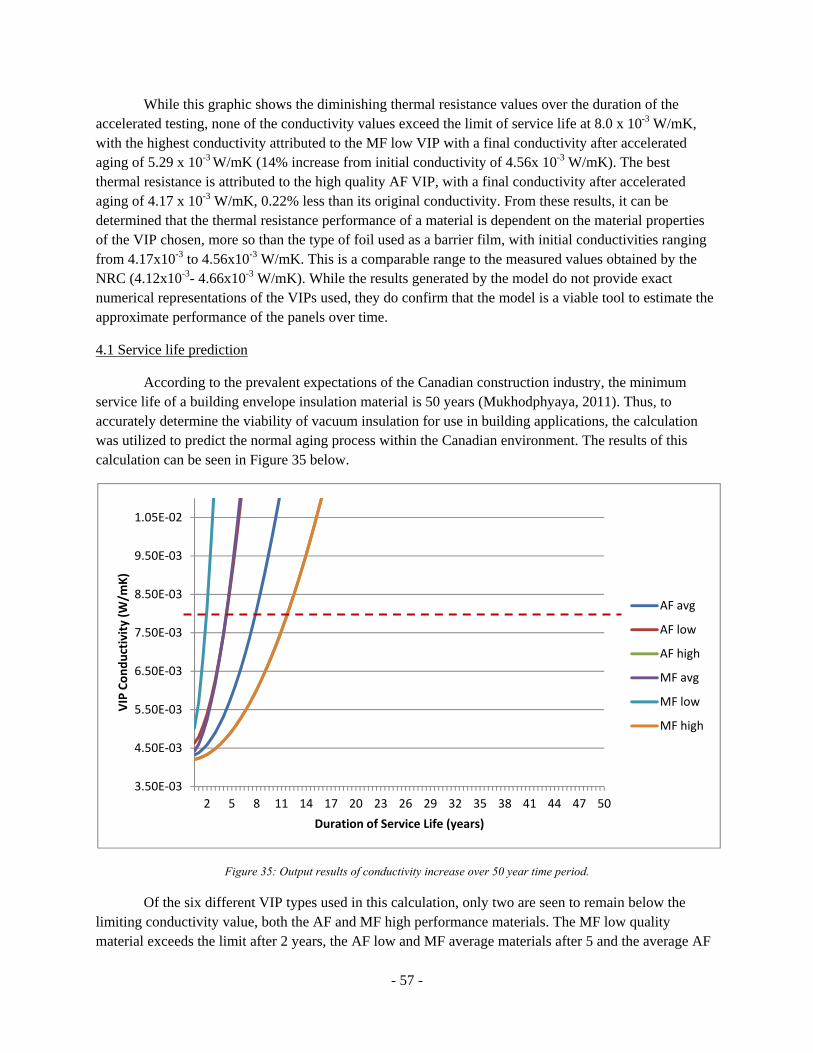
- 57 -
While this graphic shows the diminishing thermal resistance values over the duration of the accelerated testing, none of the conductivity values exceed the limit of service life at 8.0 x 10⁻³ W/mK, with the highest conductivity attributed to the MF low VIP with a final conductivity after accelerated aging of 5.29 x 10⁻³ W/mK (14% increase from initial conductivity of 4.56x 10⁻³ W/mK). The best thermal resistance is attributed to the high quality AF VIP, with a final conductivity after accelerated aging of 4.17 x 10⁻³ W/mK, 0.22% less than its original conductivity. From these results, it can be determined that the thermal resistance performance of a material is dependent on the material properties of the VIP chosen, more so than the type of foil used as a barrier film, with initial conductivities ranging from 4.17x10⁻³ to 4.56x10⁻³ W/mK. This is a comparable range to the measured values obtained by the NRC (4.12x10⁻³- 4.66x10⁻³ W/mK). While the results generated by the model do not provide exact numerical representations of the VIPs used, they do confirm that the model is a viable tool to estimate the approximate performance of the panels over time.
4.1 Service life prediction
According to the prevalent expectations of the Canadian construction industry, the minimum service life of a building envelope insulation material is 50 years (Mukhodphyaya, 2011). Thus, to accurately determine the viability of vacuum insulation for use in building applications, the calculation was utilized to predict the normal aging process within the Canadian environment. The results of this calculation can be seen in Figure 35 below.
Figure 35: Output results of conductivity increase over 50 year time period.
Of the six different VIP types used in this calculation, only two are seen to remain below the limiting conductivity value, both the AF and MF high performance materials. The MF low quality material exceeds the limit after 2 years, the AF low and MF average materials after 5 and the average AF
3.50E‐03
4.50E‐03
5.50E‐03
6.50E‐03
7.50E‐03
8.50E‐03
9.50E‐03
1.05E‐02
2 5 8 11 14 17 20 23 26 29 32 35 38 41 44 47 50
VIP Conductivity (W
/mK)
Duration of Service Life (years)
AF avg
AF low
AF high
MF avg
MF low
MF high
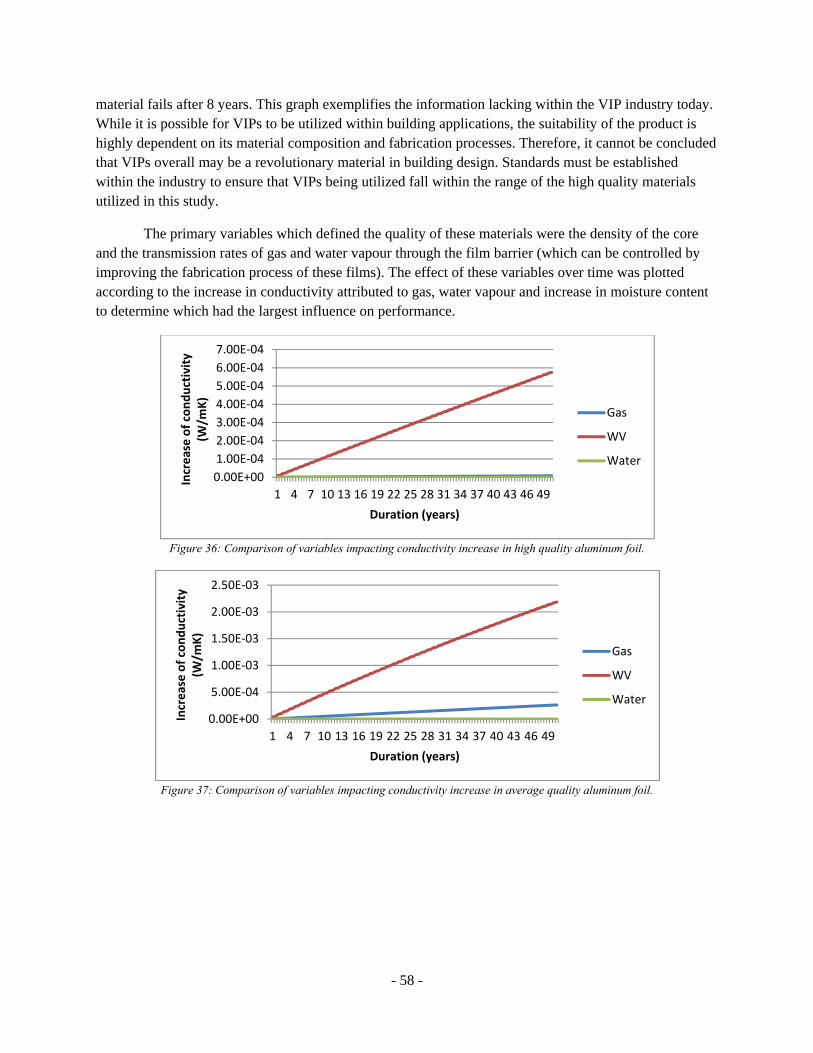
- 58 -
material fails after 8 years. This graph exemplifies the information lacking within the VIP industry today. While it is possible for VIPs to be utilized within building applications, the suitability of the product is highly dependent on its material composition and fabrication processes. Therefore, it cannot be concluded that VIPs overall may be a revolutionary material in building design. Standards must be established within the industry to ensure that VIPs being utilized fall within the range of the high quality materials utilized in this study.
The primary variables which defined the quality of these materials were the density of the core and the transmission rates of gas and water vapour through the film barrier (which can be controlled by improving the fabrication process of these films). The effect of these variables over time was plotted according to the increase in conductivity attributed to gas, water vapour and increase in moisture content to determine which had the largest influence on performance.
Figure 36: Comparison of variables impacting conductivity increase in high quality aluminum foil.
Figure 37: Comparison of variables impacting conductivity increase in average quality aluminum foil.
0.00E+00
1.00E‐04
2.00E‐04
3.00E‐04
4.00E‐04
5.00E‐04
6.00E‐04
7.00E‐04
1 4 7 10 13 16 19 22 25 28 31 34 37 40 43 46 49
Increase of conductivity
(W/m
K)
Duration (years)
Gas
WV
Water
0.00E+00
5.00E‐04
1.00E‐03
1.50E‐03
2.00E‐03
2.50E‐03
1 4 7 10 13 16 19 22 25 28 31 34 37 40 43 46 49
Increase of conductivity
(W/m
K)
Duration (years)
Gas
WV
Water

- 59 -
Figure 38: Comparison of variables impacting conductivity increase in lower quality aluminum foil.
Figure 39: Comparison of variables impacting conductivity increase in higher quality metalized foil.
Figure 40: Comparison of variables impacting conductivity increase in average quality metalized foil.
0.00E+00
1.00E‐03
2.00E‐03
3.00E‐03
4.00E‐03
5.00E‐03
1 4 7 10 13 16 19 22 25 28 31 34 37 40 43 46 49
Increase of conductivity
(W/m
K)
Duration (years)
Gas
WV
Water
0.00E+00
2.00E‐04
4.00E‐04
6.00E‐04
8.00E‐04
1.00E‐03
1.20E‐03
1.40E‐03
1 4 7 10 13 16 19 22 25 28 31 34 37 40 43 46 49
Increase of conductivity
(W/m
K)
Duration (years)
Gas
WV
Water
0.00E+00
1.00E‐03
2.00E‐03
3.00E‐03
4.00E‐03
5.00E‐03
6.00E‐03
1 4 7 10 13 16 19 22 25 28 31 34 37 40 43 46 49
Increase of conductivity (W
/mK)
Duration (years)
Gas
WV
Water
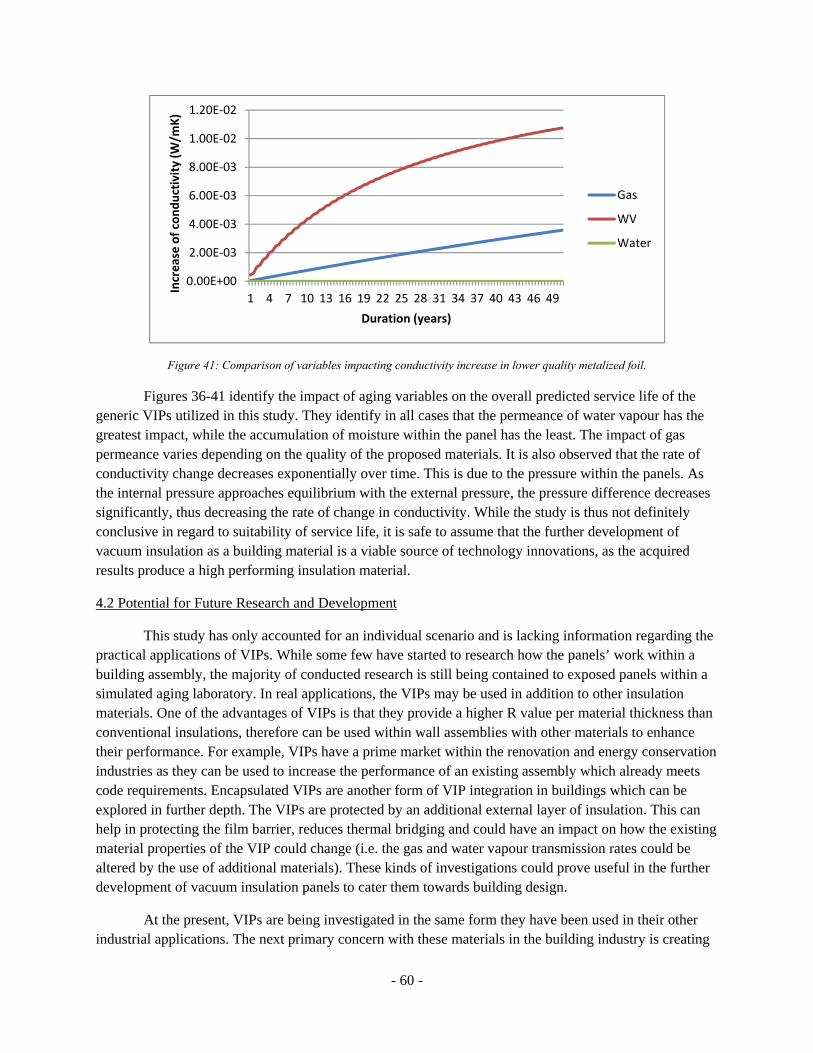
- 60 -
Figure 41: Comparison of variables impacting conductivity increase in lower quality metalized foil.
Figures 36-41 identify the impact of aging variables on the overall predicted service life of the generic VIPs utilized in this study. They identify in all cases that the permeance of water vapour has the greatest impact, while the accumulation of moisture within the panel has the least. The impact of gas permeance varies depending on the quality of the proposed materials. It is also observed that the rate of conductivity change decreases exponentially over time. This is due to the pressure within the panels. As the internal pressure approaches equilibrium with the external pressure, the pressure difference decreases significantly, thus decreasing the rate of change in conductivity. While the study is thus not definitely conclusive in regard to suitability of service life, it is safe to assume that the further development of vacuum insulation as a building material is a viable source of technology innovations, as the acquired results produce a high performing insulation material.
4.2 Potential for Future Research and Development
This study has only accounted for an individual scenario and is lacking information regarding the practical applications of VIPs. While some few have started to research how the panels’ work within a building assembly, the majority of conducted research is still being contained to exposed panels within a simulated aging laboratory. In real applications, the VIPs may be used in addition to other insulation materials. One of the advantages of VIPs is that they provide a higher R value per material thickness than conventional insulations, therefore can be used within wall assemblies with other materials to enhance their performance. For example, VIPs have a prime market within the renovation and energy conservation industries as they can be used to increase the performance of an existing assembly which already meets code requirements. Encapsulated VIPs are another form of VIP integration in buildings which can be explored in further depth. The VIPs are protected by an additional external layer of insulation. This can help in protecting the film barrier, reduces thermal bridging and could have an impact on how the existing material properties of the VIP could change (i.e. the gas and water vapour transmission rates could be altered by the use of additional materials). These kinds of investigations could prove useful in the further development of vacuum insulation panels to cater them towards building design.
At the present, VIPs are being investigated in the same form they have been used in their other industrial applications. The next primary concern with these materials in the building industry is creating
0.00E+00
2.00E‐03
4.00E‐03
6.00E‐03
8.00E‐03
1.00E‐02
1.20E‐02
1 4 7 10 13 16 19 22 25 28 31 34 37 40 43 46 49
Increase of conductivity (W
/mK)
Duration (years)
Gas
WV
Water
- 61 -
performance and prescriptive standards which can be used to ensure adequate performance in practical application. In the future, if VIPs do prove to be an invaluable building material, there is much room for development of different material properties, i.e. film and core enhancements. For example, if a vacuum can be maintained within the panel for longer periods of time, what are the possibilities for the use of organic materials over synthetic? What are the potentials for VIPs to work within prefabricated constructions? Questions like this could vastly change the conception of how VIPs are implemented within the building industry as a whole. The research and development of this product may still be in its infancy, but it should not be limited to the methods it has been utilized in other industries. Building applications provide different opportunities and should be explored accordingly.
- 62 -
5.0 Conclusion
Through this analysis, it is evident that the thermal resistance of the vacuum insulation panels will reduce over time, based on a number of factors and variables. This is unavoidable as the system depends on an ideal barrier and seal system, where no absolute barrier and seal materials exist in reality. Therefore in order to determine the benefits of VIP use as insulation in building applications, the long-term performance of the material must be analysed. Calculations provide a useful insight in material performance as they can predict this future performance and negate the need to test a material for a long duration of time before determining its potential in building applications.
The research and development regarding VIPs is still in its primary phases. The literature reviewed in this project covered most of the known and relevant findings regarding this material. These findings allowed for the development of generic material properties based on previously conducted experiments. This information was then used within a numeric model to validate accelerated aging experiments conducted by the NRC, in an attempt to identify unknown material properties. Upon evaluating the results, it was determined that VIPs have the potential to be used in building applications; however the development of standards in material fabrication and testing are required to ensure the quality of material produced is sufficient for adequate performance. It may be that future development of VIPs should not be focused on the product as an individual panel, but should be reconceptualised to be integrated within building construction and utilized in conjunction with other materials which complement VIP performance.
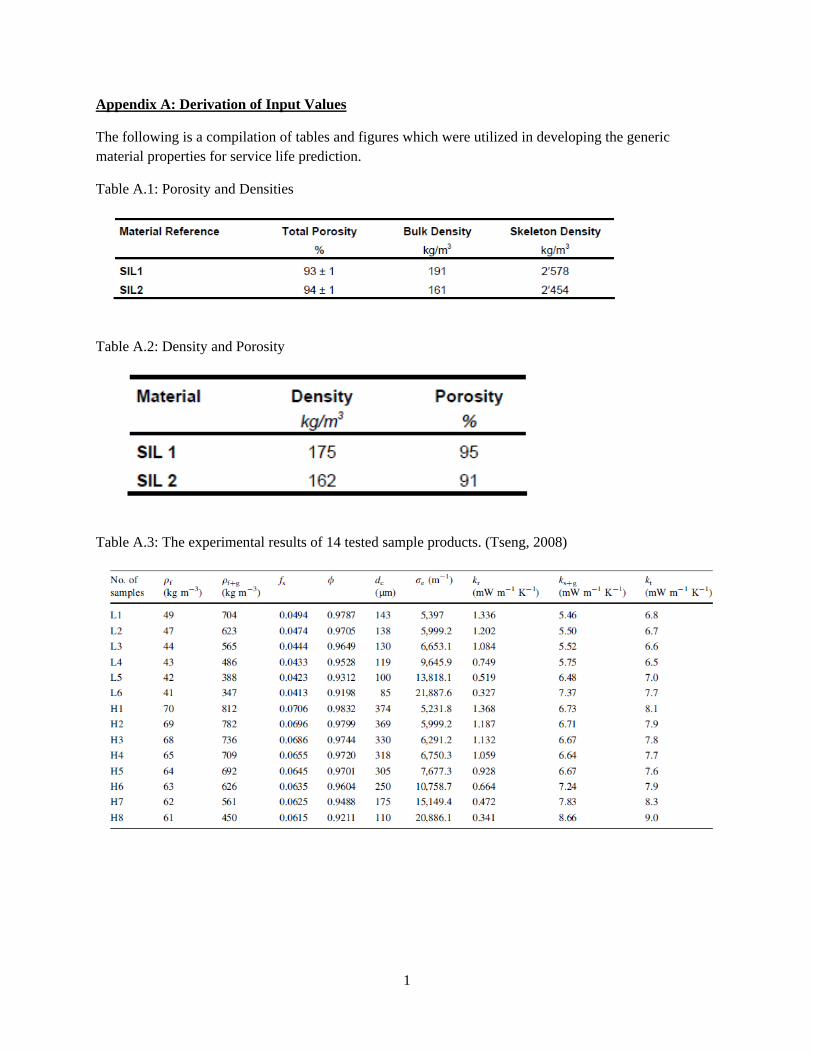
1
Appendix A: Derivation of Input Values
The following is a compilation of tables and figures which were utilized in developing the generic material properties for service life prediction.
Table A.1: Porosity and Densities
Table A.2: Density and Porosity
Table A.3: The experimental results of 14 tested sample products. (Tseng, 2008)
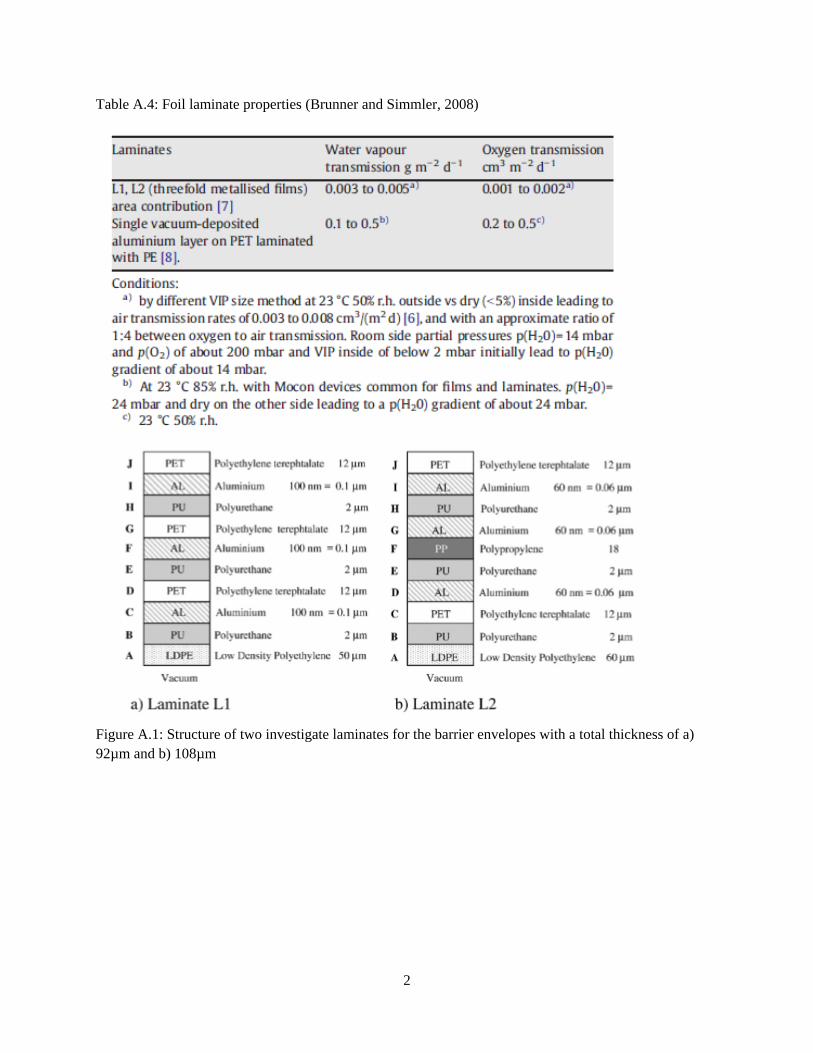
2
Table A.4: Foil laminate properties (Brunner and Simmler, 2008)
Figure A.1: Structure of two investigate laminates for the barrier envelopes with a total thickness of a) 92µm and b) 108µm
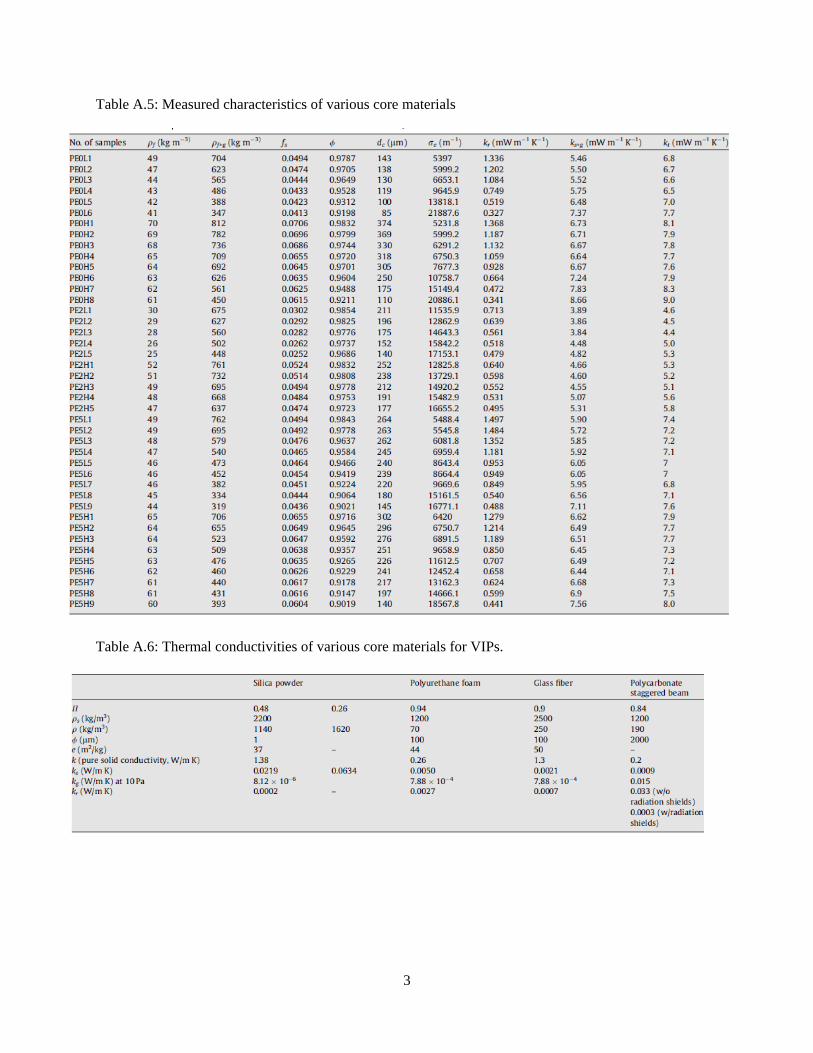
3
Table A.5: Measured characteristics of various core materials
Table A.6: Thermal conductivities of various core materials for VIPs.
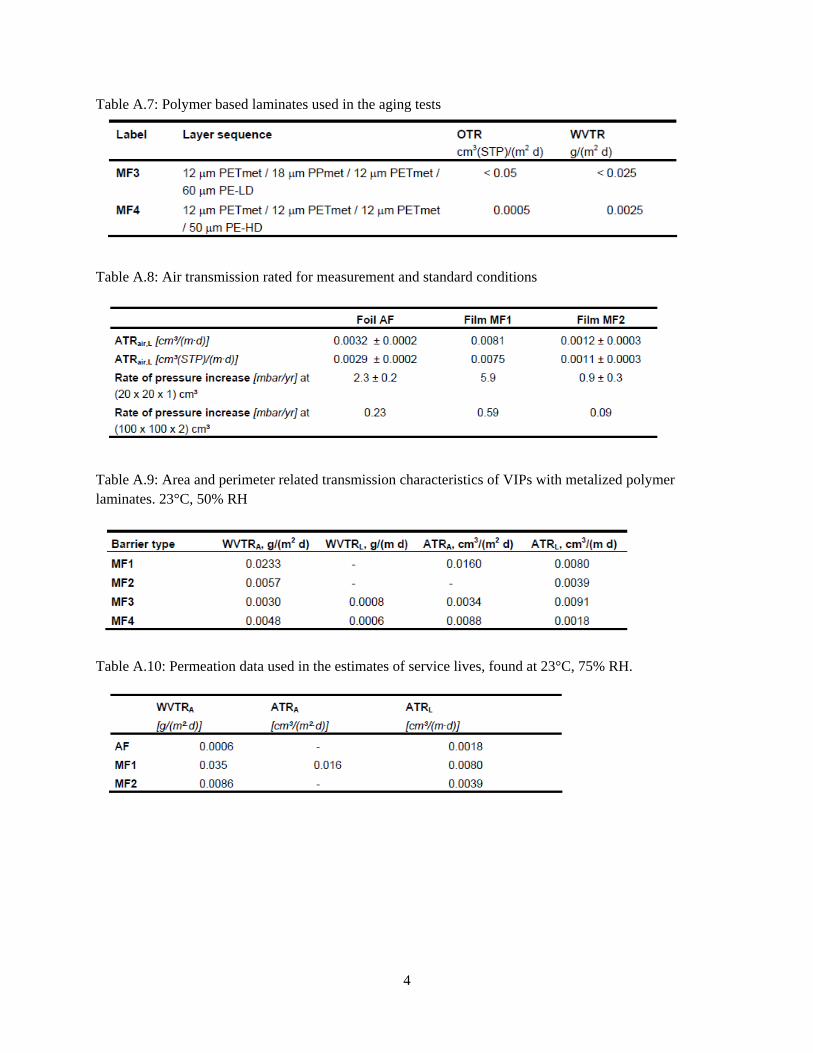
4
Table A.7: Polymer based laminates used in the aging tests
Table A.8: Air transmission rated for measurement and standard conditions
Table A.9: Area and perimeter related transmission characteristics of VIPs with metalized polymer laminates. 23°C, 50% RH
Table A.10: Permeation data used in the estimates of service lives, found at 23°C, 75% RH.
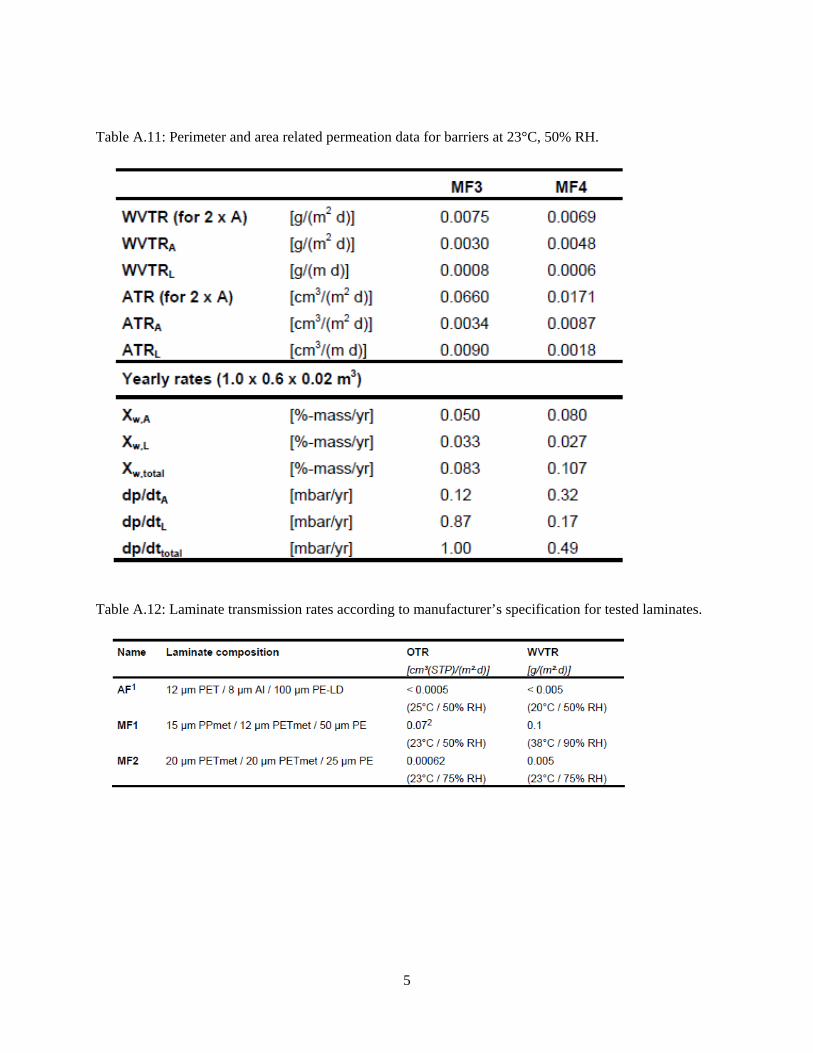
5
Table A.11: Perimeter and area related permeation data for barriers at 23°C, 50% RH.
Table A.12: Laminate transmission rates according to manufacturer’s specification for tested laminates.
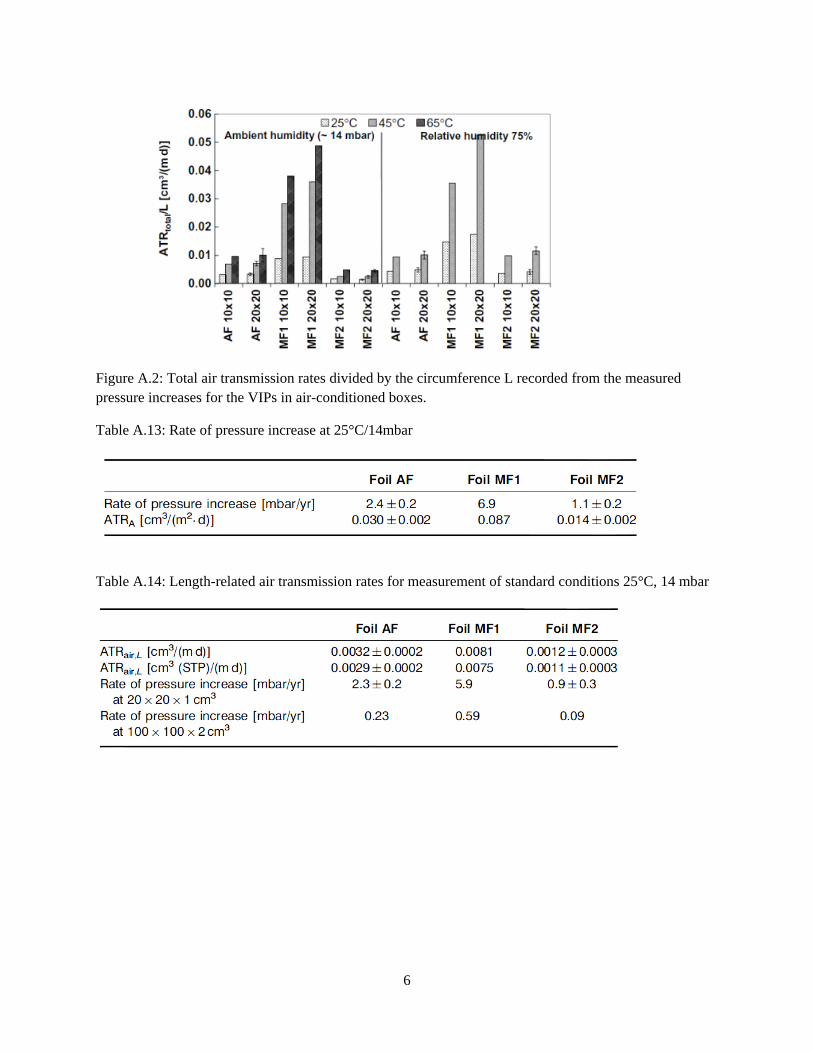
6
Figure A.2: Total air transmission rates divided by the circumference L recorded from the measured pressure increases for the VIPs in air-conditioned boxes.
Table A.13: Rate of pressure increase at 25°C/14mbar
Table A.14: Length-related air transmission rates for measurement of standard conditions 25°C, 14 mbar
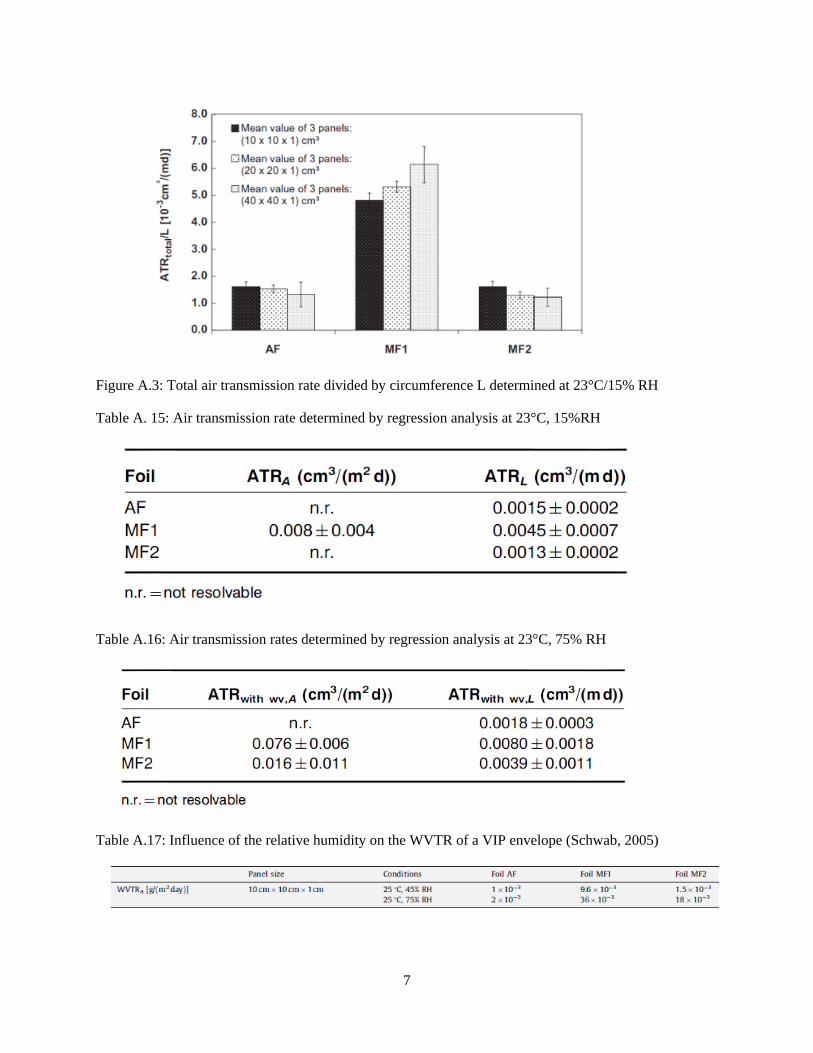
7
Figure A.3: Total air transmission rate divided by circumference L determined at 23°C/15% RH
Table A. 15: Air transmission rate determined by regression analysis at 23°C, 15%RH
Table A.16: Air transmission rates determined by regression analysis at 23°C, 75% RH
Table A.17: Influence of the relative humidity on the WVTR of a VIP envelope (Schwab, 2005)
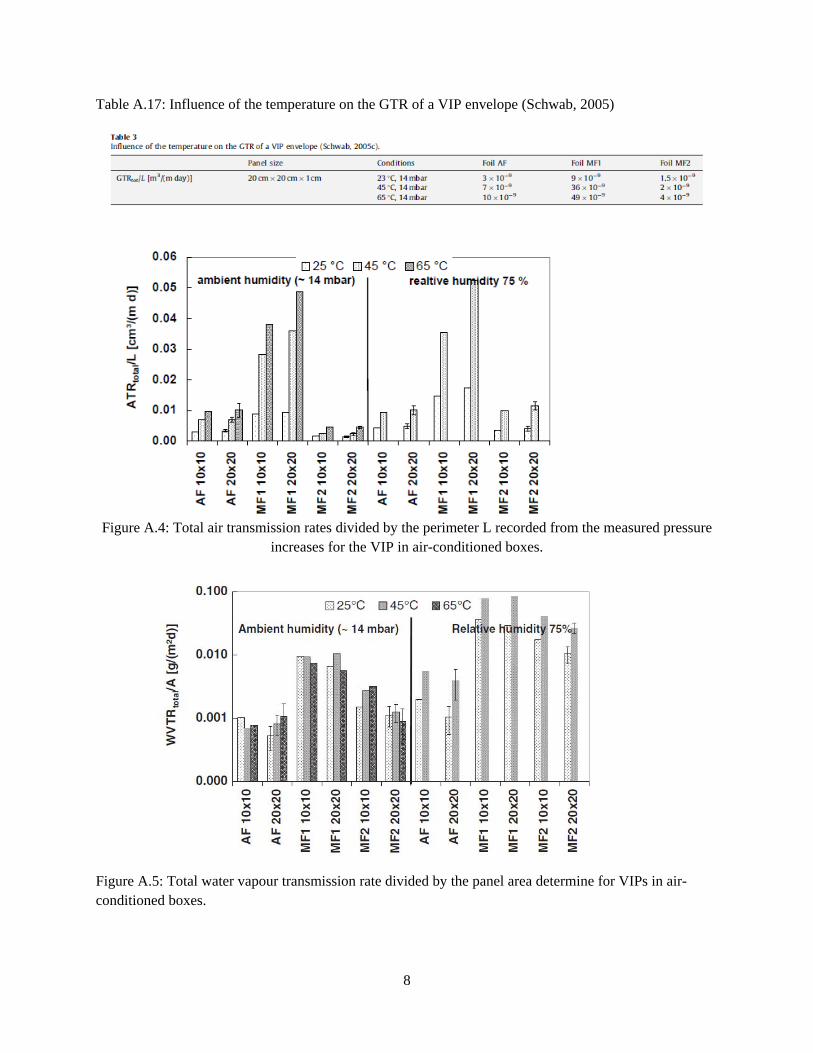
8
Table A.17: Influence of the temperature on the GTR of a VIP envelope (Schwab, 2005)
Figure A.4: Total air transmission rates divided by the perimeter L recorded from the measured pressure increases for the VIP in air-conditioned boxes.
Figure A.5: Total water vapour transmission rate divided by the panel area determine for VIPs in air-conditioned boxes.
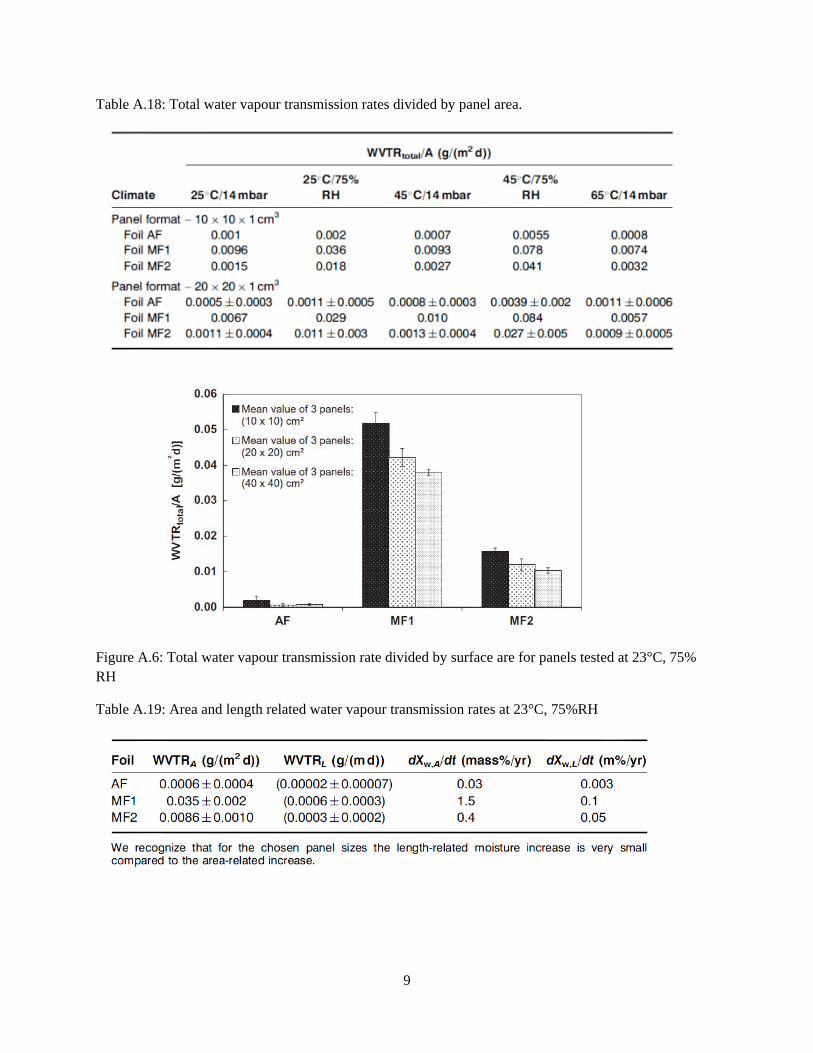
9
Table A.18: Total water vapour transmission rates divided by panel area.
Figure A.6: Total water vapour transmission rate divided by surface are for panels tested at 23°C, 75% RH
Table A.19: Area and length related water vapour transmission rates at 23°C, 75%RH
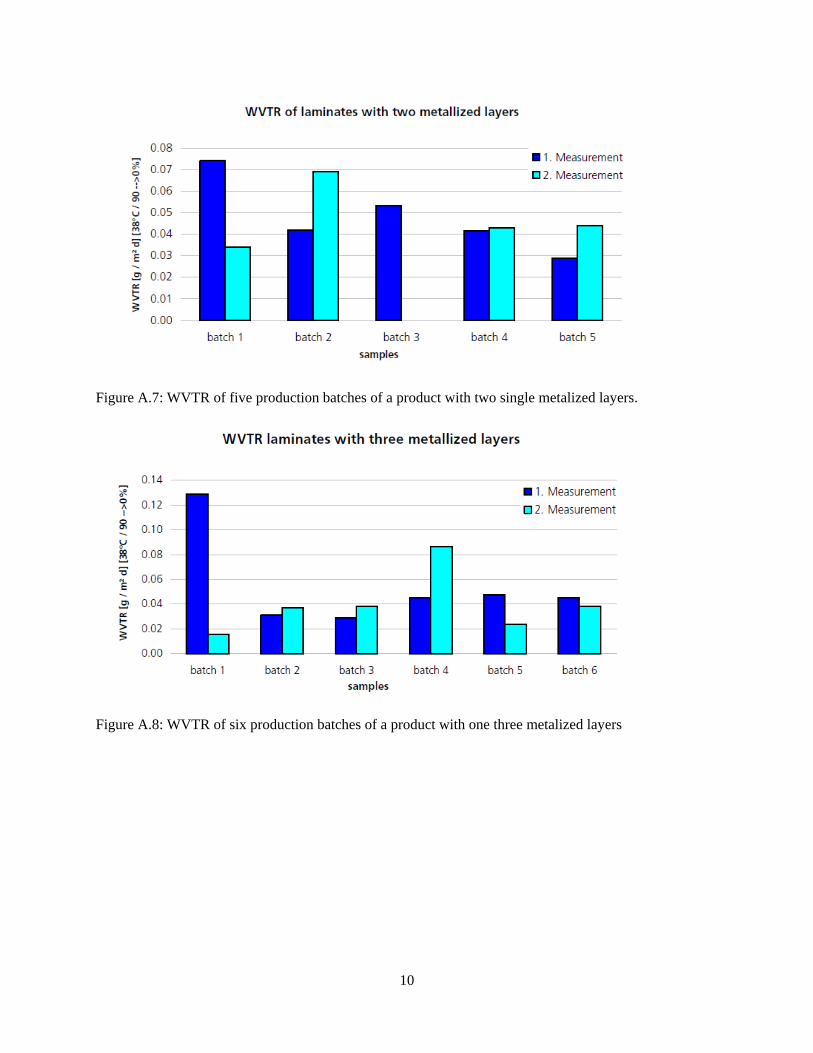
10
Figure A.7: WVTR of five production batches of a product with two single metalized layers.
Figure A.8: WVTR of six production batches of a product with one three metalized layers
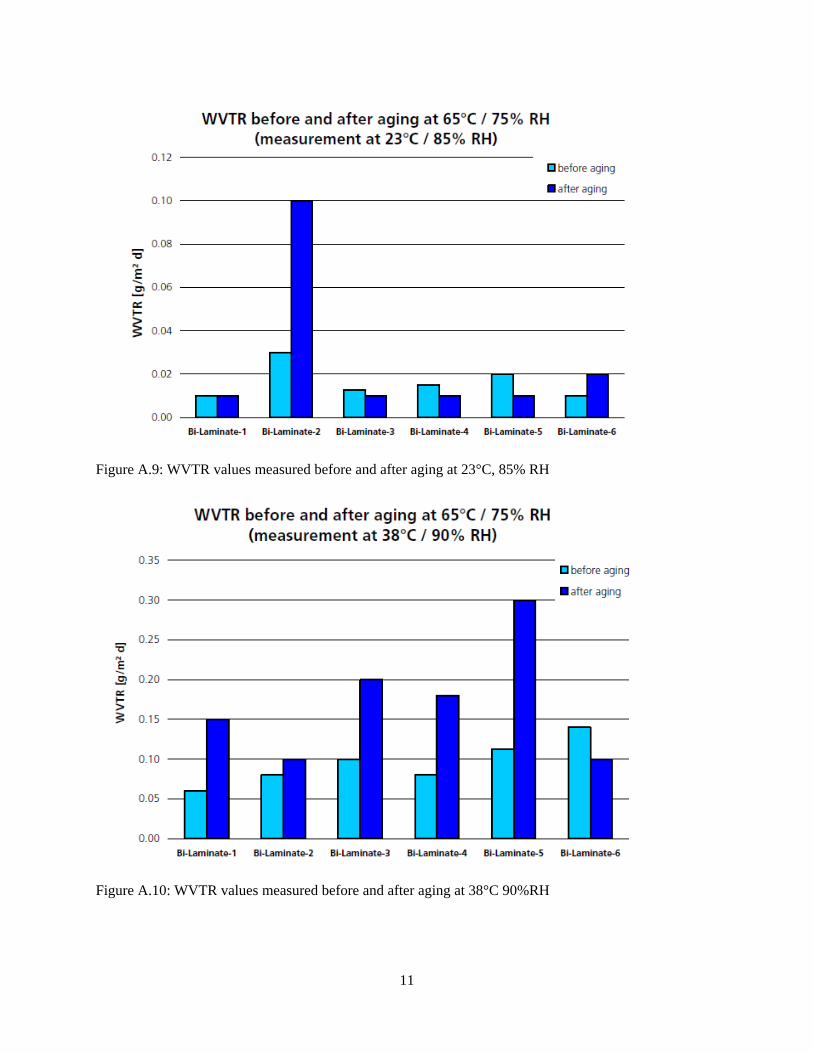
11
Figure A.9: WVTR values measured before and after aging at 23°C, 85% RH
Figure A.10: WVTR values measured before and after aging at 38°C 90%RH
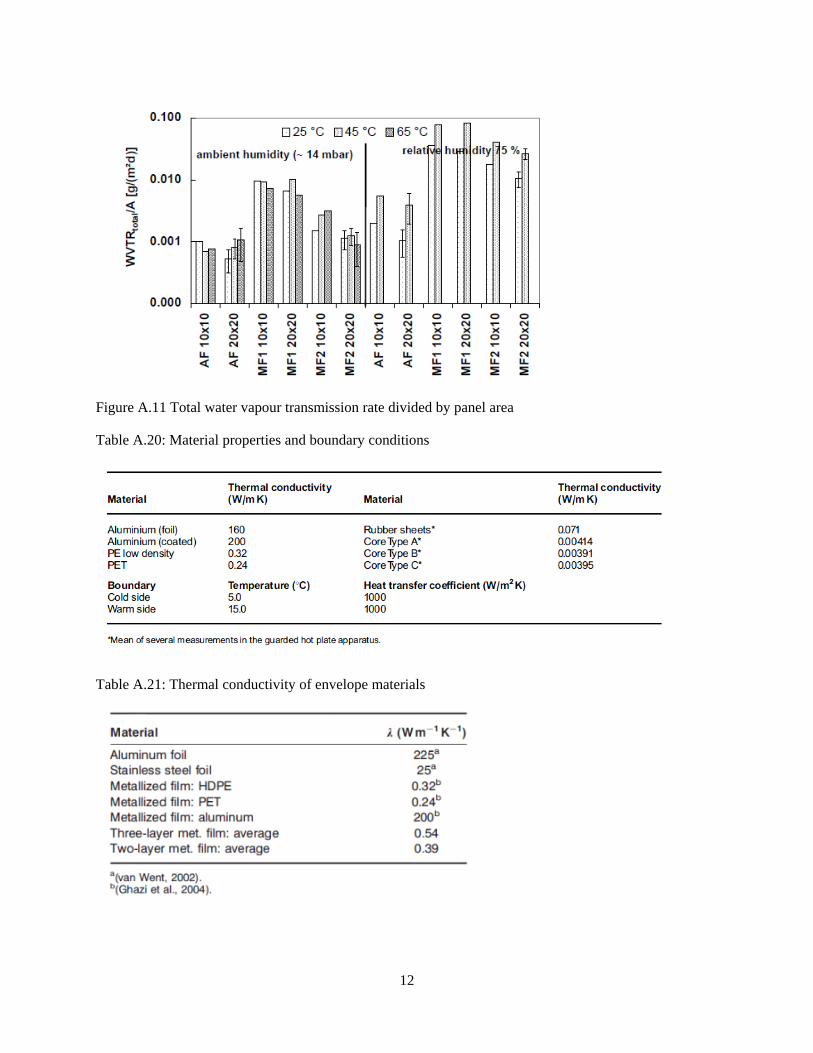
12
Figure A.11 Total water vapour transmission rate divided by panel area
Table A.20: Material properties and boundary conditions
Table A.21: Thermal conductivity of envelope materials
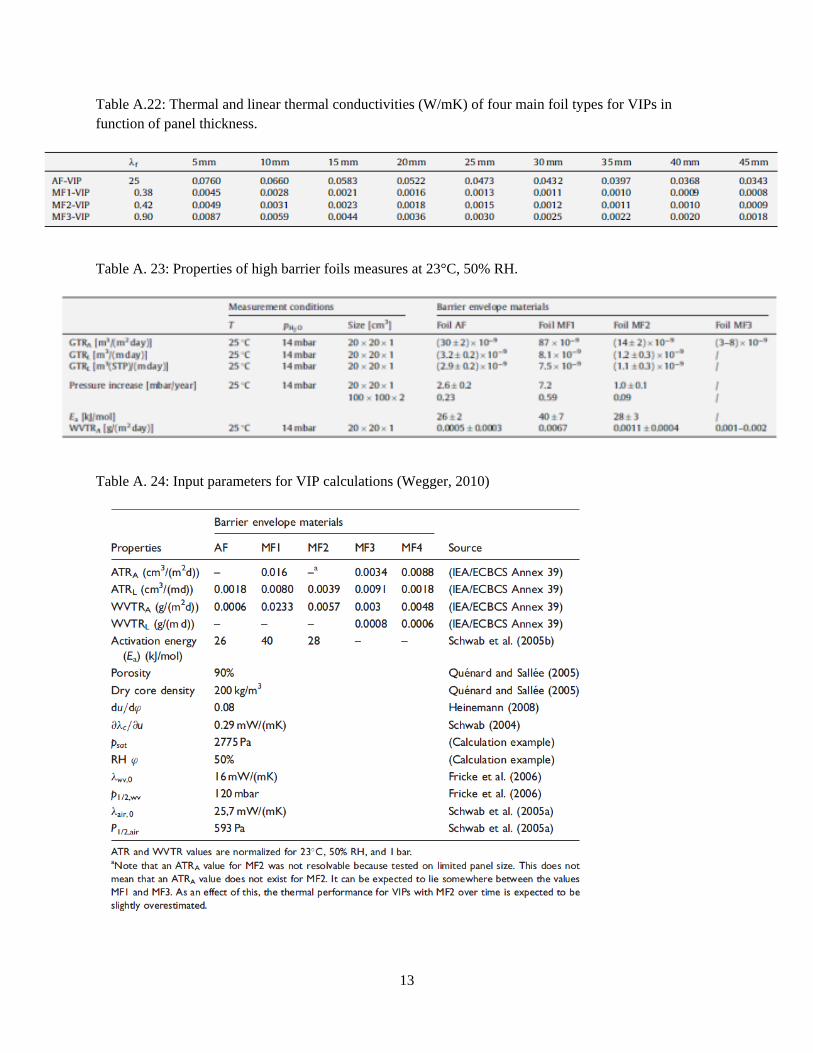
13
Table A.22: Thermal and linear thermal conductivities (W/mK) of four main foil types for VIPs in function of panel thickness.
Table A. 23: Properties of high barrier foils measures at 23°C, 50% RH.
Table A. 24: Input parameters for VIP calculations (Wegger, 2010)
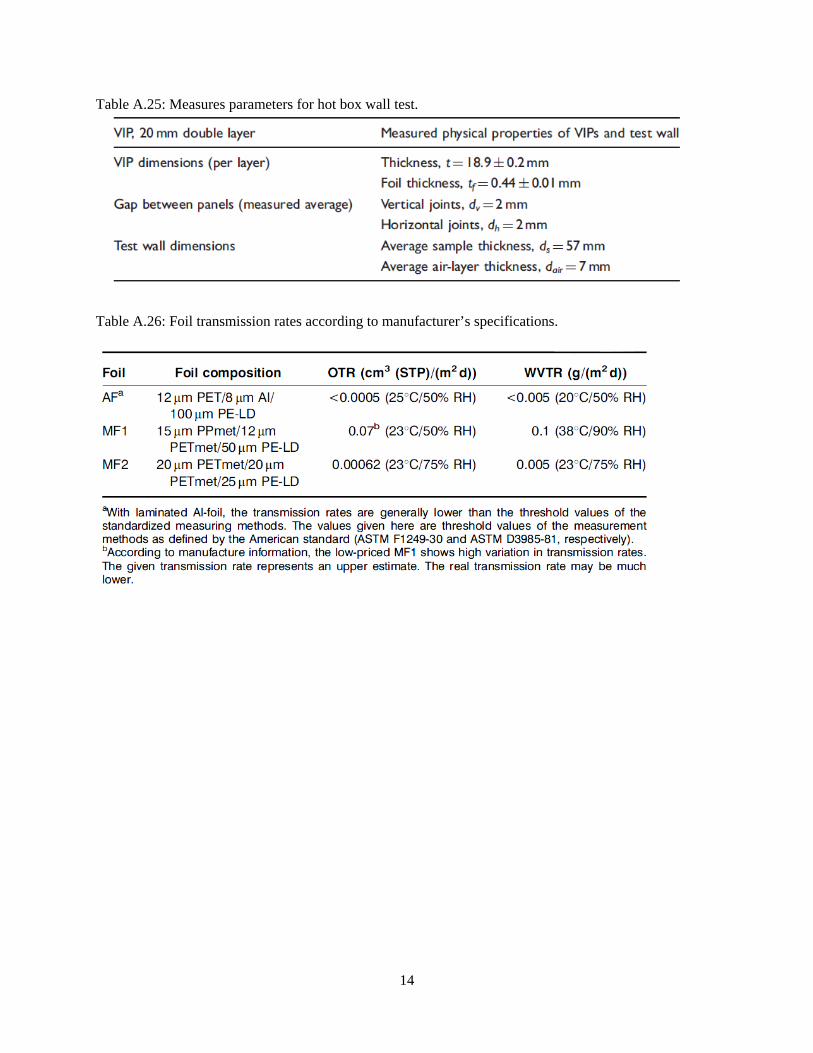
14
Table A.25: Measures parameters for hot box wall test.
Table A.26: Foil transmission rates according to manufacturer’s specifications.
15
References
10th International Vacuum Insulation Symposium Proceeding Edited by Phalguni Mukhopadhyaya (September 15-16,
2011) NRC
Alam M., H. Singh, & M.C. Limbachiya. 2011. Vacuum Insulation Panels (VIPs) for building construction industry-A
review of contemporary development and future directions. Applied Energy, 88, 3592-3602.
Baetens R., B. Petter Jelle, J. Vincent Thue, M.J. Tempierik, S. Grynning, S. Uvslokk, A. Gustaven. 2010. Vacuum
insulation panels for building applications: A review and beyond. Energy and Buildings, 42, 147-172.
Binz A., & G. Steinke. 2005. Proceedings from 7th International Vacuum Insulation Symposium 2005: Applications
of Vacuum Insulation in the Building Sector
Brunner S., & H. Simmler. 2008. In situ performance assessment of vacuum insulation panels in flat roof
construction.Vacuum, 82, 700-707.
Brunner S., P.J. Tharian, H. Simmler and K. Ghazi Wakili. 2008. Focused Ion beam (FIB) etching to investigate
aluminum-coated polymer laminates subjected to heat and moisture loads. Surface and Coatings Technology,
202, 6054-6063.
Buttner D., C. Stark M. Keller, J. Fricke. 2005. Proceedings from 7th International Vacuum Insulation Symposium
2005: Fast method to check the thermal performance of metal-covered VIP.
Caps R., H. Beyrichen, D. Kraus, S. Weismann. 2008. Quality control of vacuum insulation panels: Methods of
measuring gas pressure. Vacuum, 82, 691-699.
Charton C., N. Schiller, M. Fahland, A. Hollander, A. Wedel, K. Noller. 2006. Development of High Barrier Films on
Flexible Polymer Substrates.Thin Solid Films, 502, 99-103.
Emerald | Construction Innovation: Information, Process, Management | Integrating vacuum insulation panels in
building constructions: an integral perspective. (n.d.). Emerald. Retrieved October 5, 2012, from
http://www.emeraldinsight.com/journals.htm?articleid=1589128&show=html
Erb M., & P. Eicher. 2005. Proceedings from 7th International Vacuum Insulation Symposium 2005: AG IEA/ECBCS
– Annex 39 High Performance Thermal Insulation.
Fricke J., H. Schwab, & U. Heinemann. 2006. Vacuum Insulation Panels – Exciting Thermal Properties and Most
Challenging Applications. International Journal of Thermophysics, 27, 1123-1139.
16
Fricke J.. 2005. Proceedings from 7th International Vacuum Insulation Symposium 2005: Dewars to VIPs-One
Century of Progress in Vacuum Insulation Technology.
Garnier G., B. Yrieix, Y. Brechet, L. Flandin. 2010. Influence of Structural Feature of Aluminum Coatings on
Mechanical and Water Barrier Properties of Metallized PET Films. Journal of Applied Polymer Science, 115,
3110-3119.
Garnier G., S. Marouani, B. Yrieix, C. Pompeo, M. Chauvois, L. Flandin, Y. Brechet. 2011. Interest and durability of
multilayers: from model films to complex films. Polymer Advanced Technologies, 22, 847-856.
Grynning S., Jelle B.P., Uvslokk S., Gustaven A., Baetens R., Caps R., Meloysund V. 2010. Hot box investigations
and theoretical assessments of miscellaneous vacuum insulation panel configurations in building envelopes.
Journal of Building Physics, 34 (4), 297-324.
Heinemann U. 2008. Influence of Water on the Total Heat Transfer in ‘Evacuated’ Insulations. Int. J. Thermophys. 29,
735-749.
Kaczmarek D.. 2005. Proceedings from 7th International Vacuum Insulation Symposium 2005: Barrier Films for
vacuum insulation panels (VIP).
Kraus D., D. Buttner, U. Heinemann, J. Fricke. 2005. Proceedings from 7th International Vacuum Insulation
Symposium 2005: Non-destructive method to determine the water vapour pressure in vacuum insulation panels
(VIPs).
Kwon J.S., C. Hyo Jang, H. Jung, T.H. Song. 2010. Vacuum maintenance in vacuum insulation panels exemplified
with a staggered beam VIP. Energy and Buildings, 42, 590-597.
Kwon J.S., C.H. Jang, H. Jung, T.H. Song. 2009. Effective thermal conductivity of various filling materials for
insulation panels. International Journal of Heat and Mass Transfer, 52, 5525-5532.
Kwon J.S., H. Jung, I.S. Yeo, T.H. Song. 2011. Outgassing characteristics of a polycarbonate core material for
vacuum insulation panels. Vacuum, 85, 839-846.
Morel B., L. Autissier, D. Autissier, D. Lemordant, B. Yrieix, D. Quenard. 2009. Pryogenic silica ageing under humid
atmosphere. Powder Technology, 190, 225-229.
Mukhopadhyaya P., M.K. Kumaran, G. Sherrer and D. Van Reenen (NRC-IRC). An Investigation on Long-Term
Thermal Performance of Vacuum Insulation Panels (VIPs).
17
Musgrave D.S.. 2005. Proceedings from 7th International Vacuum Insulation Symposium 2005: Finite Element
Analysis Used to Model VIP Barrier Film Performance.
Nussbaumer T., Ghazi Wakili K., Tanner C.. 2006. Experimental and numerical investigation of the thermal
performance of a protected vacuum-insulation system applied to a concrete wall. Applied Energy, 83, 841-855.
Patzer, W. Stramm C., S. Amberg-Schwab, M. Kohl. 2005. Proceedings from 7th International Vacuum Insulation
Symposium 2005: Development of Innovative Insulation Systems on the Basis of Vacuum Insulation Panels.
Planes E., S. Marouuani, and L. Flandin; J Mater. 2011. Optimizing the heat sealing parameters of multilayers
polymeric films. Science, 46, 5948-5958.
Quenard D.& H. Sallee. 2005. Proceedings from 7th International Vacuum Insulation Symposium 2005: From VIPs to
Building Facades: Three levels of thermal bridges.
Roderick K., B. Glover and D. Smith. 2005. Proceedings from 7th International Vacuum Insulation Symposium 2005:
Applications of Vacuum Insulation Panels in Extreme Environments.
Schwab H., U. Heinemann, A. Beck, H.P. Ebert, J. Fricke. 2005. Dependence of Thermal Conductivity on Water
Content in Vacuum Insulation Panels with Fumed Silica Kernels. Journal of Thermal Env. & Building Sci., 28
(4), 319-327.
Schwab H., U. Heinemann, A. Beck, H.P. Ebert, J. Fricke. 2005. Permeation of Different Gases Through Foils used as
Enveloped for Vacuum Insulation Panels. Journal of Thermal Env. & Bldg. Sci, 28, (4), 293-317.
Schwab H., U. Heinemann, A. Beck, H.P. Ebert, J. Fricke. 2005. Prediction of Service Life for Vacuum Insulation
Panels with Fumed Silica Kernel and Foil Cover. Journal of Thermal Env. & Bldg. Sci., 28 (4), 357-374.
Schwab H., U. Heinemann, J. Wachtel, H.P. Ebert, J.Fricke. 2005. Predictions for the Increase in Pressure and Water
Content of Vacuum Insulation Panels (VIPs) Integrated into Building Construction using Model Calculations.
Journal of Thermal Env. & Bldg. Sci., 28 (4), 327-344.
Simmler H., & S. Brunner. 2005. Proceedings from 7th International Vacuum Insulation Symposium 2005:
Monitoring of VIP in Building Applications.
Simmler H., & S. Brunner. 2005. Vacuum Insulation panels for building application Basic properties, aging
mechanisms and service life. Energy and Buildings, 37, 1122-1131.
Simmler H., S. Brunner, U. Heinemann, H. Schwab, K. Kumaran, P. Mukhopadhyaya, D. Quenard, H. Sallee, K.
Noller, E. Kucukplnar-Niarchos, C. Stramm, M. Tenpierik, H. Cauberg, M. Erb. 2005. Vacuum Insulation
18
Panels: Study on VIP-components and Panels for Service Life Prediction of VIP in Building Applications
(Subtask A). IEX/ECBCS Annex 39-Implementing Agreement.
Station Results | Canada's National Climate Archive. (n.d.). Home | Canada's National Climate Archive. Retrieved
August 24, 2012, from
http://www.climate.weatheroffice.gc.ca/climate_normals/results_e.html?stnID=5097&lang=e&dCode=1&
StationName=TORONTO&SearchType=Contains&province=ALL&provBut=&month1=0&month2=12
Sutjipto A.G.E., Jufriadi, R. Muhida and M. Takata. 2008. Proceeding from Int. Symp. on Discharges and Electrical
Insulation in Vacuum: Novel Characterization Technique by Using an SEM. Bucharest.
Tenpierik M., & H. Cauberg. 2007.Analytical Models for Calculating Thermal Bridge Effects Caused by Thin High
Barrier Envelopes around Vacuum Insulation Panels. Journal of Building Physics, 30 (3).
Tenpierik M., & J.J.M. Cauberg. 2010. Encapsulated vacuum insulation panels: theoretical thermal
optimization.Building Research and Information, 35 (6), 660-669.
Tenpierik M.J., J.J.M. Cauberg, T.I. Thorsell. 2007. Integrating vacuum insulation panels in building constructions: an
integral perspective. Construction Innovation, 7 (1), 38-53.
Thorsell T. I.. 2010. A hybrid model for diffusion through barrier films with multiple coatings. Journal of Building
Physics, 34(4) 351-381.
Toronto Island Historical Relative Humidity . (n.d.). Current Weather in Toronto Island . Retrieved August 23,
2012, from http://toronto.weatherstats.ca/metrics/relative_humidity.html
Toronto, Ontario Climate, Average Monthly Temperatures, Rainfall, Sunshine Hours, Graphs. (n.d.). Toronto,
Ontario Climate, Average Monthly Temperatures, Rainfall, Sunshine Hours, Graphs. Retrieved August
24, 2012, from http://www.toronto.climatemps.com/
Tseng P.C., & H.S. Chu. 2008. An experimental study of the heat transfer in PS foam insulation. Department of
Mechanical Engineering, National Chiao Tung University, Springer-Verlag.
Tseng P.C., & H.S. Chu. 2009. The effects of PE additive on the performance of polystyrene vacuum insulation
panels. International Journal of Heat and Mass Transfer, 52, 3084-3090.
Van Malsen J., M.J. Tenpierik, R.H.J. Looman J.J.M. Cauberg. 2008. Heat Seal Strength of Barrier Films Used in
Vacuum Insulation Panels At Room Temperature and At -130°C. Journal of Plastic Film and Sheeting, 24-35.

19
Wakili K. Ghazi, R. Bundi, B. Binder. 2004. Effective thermal conductivity of vacuum insulation panels. Building
Research and Information, 32 (4), 293-299.
Wegger E., B. Petter Jelle, E. Sveipe, S. Grynning, A. Gustavsen, R. Baetens, J.V. Thue. 2010. Aging effects on
thermal properties and service life of vacuum insulation panels. Journal of Building Physics, 1-40.
Wegger E., B. Petter-Jelle, E. Sveipe, S.Grynning, A. Gustaven and J.V. Thue. 2010. Renewable Energy Conference:
Accelerated Ageing of Vacuum Insulation Panels (VIPs). Norway.
Willems W.M., Schild K, Hellinger G.. 2005. Proceedings from 7th International Vacuum Insulation Symposium
2005: Numerical Investigation on Thermal Bridge Effects in Vacuum Insulating Elements.
Wong C.M., & M.L. Hung. 2008. Polystyrene Foams as Core Materials Used in Vacuum Insulation Panel. Journal of
Cellular Plastics, 44, 239-259.
Wong C.M., & S.J. Tsai. 2006. Effect of Low Density Polyethylene on Polystyrene Foam.Journal of Cellular Plastic,
42, 153-163.
Wong C.M., & W.C. Liang. 2004. Porous Polystyrene Foam Produced at Supercritical Conditions. Jounral of Cellular
Plastics, 40, 421-429.
Yang C.G., & L. Xu. 2007. Outgassing of Rigid Open-celled Polyurethane Foam Used in Vacuum Insulation Panels
Under Vacuum Condition. Journal of Cellular Plastics, 43, 17-30.