Determining Parameters in the Spicer- Model and Predicted Maximum QE John Smedley.
D
MD
h
••••
a
ARRAA
KSCRR
1
aot
ST
U
h0
Journal of Neuroscience Methods 264 (2016) 136–152
Contents lists available at ScienceDirect
Journal of Neuroscience Methods
journa l homepage: www.e lsev ier .com/ locate / jneumeth
etermining synaptic parameters using high-frequency activation
onica S. Thanawala1, Wade G. Regehr ∗
epartment of Neurobiology, Harvard Medical School, Boston, MA, United States
i g h l i g h t s
Experimental methods to estimate RRP size and release probability are compared.For high p, low replenishment rates, and high firing frequency 3 methods align well.Simulations explain when and why different methods fail for certain conditions.A simple model provides better estimates of RRP and p under broader conditions.
r t i c l e i n f o
rticle history:eceived 11 December 2015eceived in revised form 23 February 2016ccepted 26 February 2016vailable online 10 March 2016
eywords:ynaptic transmissionalyx of Heldeadily-releasable poolelease probability
a b s t r a c t
Background: The specific properties of a synapse determine how neuronal activity evokes neuro-transmitter release. Evaluating changes in synaptic properties during sustained activity is essentialto understanding how genetic manipulations and neuromodulators regulate neurotransmitter release.Analyses of postsynaptic responses to high-frequency stimulation have provided estimates of the size ofthe readily-releasable pool (RRP) of vesicles (N0) and the probability of vesicular release (p) at multiplesynapses.New method: Here, we introduce a model-based approach at the calyx of Held synapse in which depletionand the rate of replenishment (R) determine the number of available vesicles, and facilitation leads to ause-dependent increase in p when initial p is low.Results: When p is high and R is low, we find excellent agreement between estimates based on all threemethods and the model. However, when p is low or when significant replenishment occurs betweenstimuli, estimates of different methods diverge, and model estimates are between the extreme estimatesprovided by the other approaches.Comparison with other methods: We compare our model-based approach to three other approaches thatrely on different simplifying assumptions. Our findings suggest that our model provides a better estimate
of N0 and p than previously-established methods, likely due to inaccurate assumptions about replenish-ment. More generally, our findings suggest that approaches commonly used to estimate N0 and p at othersynapses are often applied under experimental conditions that yield inaccurate estimates.Conclusions: Careful application of appropriate methods can greatly improve estimates of synaptic param-eters.. Introduction
The number of vesicles in the readily-releasable pool (RRP)
nd the probability of release (p) are fundamental propertiesf synapses that are used to characterize their basal charac-eristics and to describe how they are modified by activity,∗ Corresponding author at: Department of Neurobiology, Harvard Medicalchool, Goldenson 308, 220 Longwood Avenue, Boston, MA 02115, United States.el.: +1 617 432 0450; fax: +1 617 432 1639.
E-mail address: wade [email protected] (W.G. Regehr).1 Present address: Department of Chemistry and Chemical Biology, Harvardniversity, Cambridge, MA, United States.
ttp://dx.doi.org/10.1016/j.jneumeth.2016.02.021165-0270/© 2016 Elsevier B.V. All rights reserved.
© 2016 Elsevier B.V. All rights reserved.
neuromodulators, and genetic manipulations. One way to evalu-ate RRP size and p is to use a powerful non-physiological meansof liberating all vesicles in the RRP, such as prolonged presy-naptic voltage steps, photolytic presynaptic calcium release, orapplications of hypertonic sucrose, and then using capacitancemeasurements or postsynaptic voltage-clamp recordings to quan-tify the RRP (Schneggenburger et al., 2002; Zucker and Regehr,2002; Schneggenburger and Neher, 2005). These approaches haveall provided important insights into synaptic transmission, but for
technical reasons, they cannot be readily applied to many types ofsynapses. Moreover, the pool of vesicles that exocytoses in responseto these non-physiological stimuli may not be equivalent to thepool that can be released through physiologically-relevant action
f Neur
pscRsb
sshtatbstaar
pwfarAcb(btraaptHt1Fep(e(setoWttlwtEEp
ueobera
M.S. Thanawala, W.G. Regehr / Journal o
otential stimuli (Neher, 2015). To overcome these limitations, aecond class of approaches has been developed that uses synapticurrents evoked by high-frequency stimulation to estimate p andRP. Such approaches have the advantage that they are based onynaptic responses evoked under physiological conditions and cane readily applied to many types of synapses.
Here we evaluate different methods that are used to estimateynaptic parameters from responses evoked by high-frequencytimulation. A basic framework has been developed to understandow neurotransmitter is released in response to rapid firing. It ishought that release depends on the size of the RRP (comprised ofnumber of vesicles, N0) and the probability of an action poten-
ial causing a vesicle to fuse (p). The number of vesicles releasedy an action potential is equal to p × N0 (Liley and North, 1953). Atynapses with a high initial p, repetitive activation rapidly depleteshe RRP and reduces the amount of neurotransmitter release perction potential (Elmqvist and Quastel, 1965). As depletion occurs,synapse relies on vesicles from a recycling pool of vesicles to
eplenish the RRP.Several methods have been developed to determine synaptic
roperties that are based on this simple framework. The mostidely used method to characterize synaptic properties uses high-
requency stimulation to evoke EPSCs (Fig. 1A). According to thispproach, rapid stimulation depletes the RRP until the remainingesponses rely on the replenishment of the readily-releasable pool.plot of the cumulative EPSC versus stimulus number has a rapidly
hanging component during which the RRP is depleted, followedy a linear component once the EPSC reaches a constant amplitudeFig. 1B, Table 1). N0 is estimated by extrapolating the linear phaseack to the y-axis in order to account for replenishment. This quan-ity is in units of current, and corresponds to a number of vesicleseleased when divided by the quantal size, q. Then p is determineds p = EPSC0/N0 (Schneggenburger et al., 1999). This method, as wells a variation that uses presynaptic capacitance changes instead ofostsynaptic responses, has been applied to characterize synap-ic transmission at a variety of synapses, including the calyx ofeld, excitatory and inhibitory cultured hippocampal synapses, and
he Drosophila neuromuscular junction (Schneggenburger et al.,999; Moulder and Mennerick, 2005; Stevens and Williams, 2007;ioravante et al., 2011; Liu et al., 2014; Gavino et al., 2015; Müllert al., 2015). The same data can also be used to estimate synapticarameters using an approach developed by Elmqvist and QuastelElmqvist and Quastel, 1965; Ruiz et al., 2011) that relies on a differ-nt set of assumptions (Fig. 1C, Table 1). The Elmqvist and QuastelEQ) method is less widely used than the train method, but hastill been applied at multiple synapses. It relies primarily on EPSCsarly in the train and assumes that the decrease in EPSC ampli-udes during high-frequency stimulation is a result of depletionf a homogenous pool of synaptic vesicles that comprise the RRP.ith this method, a linear fit to the earliest few points of a plot of
he EPSC amplitude versus the cumulative EPSC is used to estimatehe size of the RRP, and p = EPSC0/N0. The data can also be ana-yzed with what we refer to as the decay method (Ruiz et al., 2011),
hich has not been used extensively. According to this approach,he amplitude of the nth synaptic response evoked by a train isPSCn = EPSC0(1 − p)n + C (C is a constant). An exponential fit to thePSC amplitude as a function of stimulus number is used to estimate, and N0 = EPSC0/p (Fig. 1D).
All of these methods rely on assumptions that are not validnder all conditions, which can compromise their accuracy instimating synaptic parameters (Table 1). The EQ and decay meth-ds assume that the effects of replenishment are small and can
e ignored, but it is not always clear if this is valid for typicalxperimental conditions. Although the train method does considereplenishment, it assumes constant replenishment throughoutstimulus train. In fact, replenishment could scale with the
oscience Methods 264 (2016) 136–152 137
availability of empty release sites (Wesseling and Lo, 2002) andaccelerate with elevation of presynaptic calcium levels (Kusano andLandau, 1975; Dittman and Regehr, 1998; Wang and Kaczmarek,1998; Sakaba and Neher, 2001a; Hosoi et al., 2007), which couldlead to underestimates of RRP size (but see Neher, 2015). Withregard to p, the train method is most flexible, in that it allows forchanges in p throughout the stimulus train and heterogeneity of pamong individual vesicles in the RRP. In contrast, the EQ and decaymethods assume uniform p that remains constant throughout astimulus train. However, p does not remain constant at facilitatingsynapses, and p may be non-uniform at many synapses (Dobrunzand Stevens, 1997; Sakaba and Neher, 2001b; Meinrenken et al.,2002; Trommershäuser et al., 2003; Moulder and Mennerick, 2005;Schneggenburger et al., 2012).
In this study, we compare estimates of synaptic parametersat the calyx of Held synapse based on four approaches: the trainmethod (Schneggenburger et al., 1999), the EQ method (Elmqvistand Quastel, 1965), the decay method (Ruiz et al., 2011), and fit-ting to a depletion-based model. There is good agreement betweenthe estimates obtained with all approaches when p is high, R islow, and stimulus frequency is high. When this is not the case,model estimates of RRP size are greater than those of the trainand decay methods but less than those of the EQ method. The val-ues obtained with these four methods can differ significantly undernon-ideal conditions and suggest that care is necessary in choosingan approach to analyze such data. Our findings suggest that undernon-ideal conditions, a depletion-based model provides better esti-mates, because the model is based on a more accurate description ofreplenishment of the RRP than is implicit in the in the train, decay,and EQ methods. We also use the depletion model to explore theeffects of changes in p, replenishment rate, and firing frequency onthe ability of linear extrapolation estimates to accurately measureN0 and p. We find that the train method and EQ method performbest in moderate to high p conditions with relatively low replen-ishment rates and high firing frequencies. These studies provideinsight into the optimal approaches to estimate synaptic parame-ters at the calyx of Held, advocate for simultaneous use of multipleapproaches for a given dataset, and have important implicationsfor the study of other synapses.
2. Materials and methods
2.1. Animals and preparation of brain slices
All animals used were wildtype mice (BL6C57/6J, Jackson Lab-oratories), postnatal day P11–14 of either sex. All animal handlingand procedures abided by the guidelines of the Harvard MedicalArea Standing Committee on Animals. Mice were deeply anes-thetized with isoflurane and killed by decapitation. Transverse200-�m-thick slices were cut from the brainstem containing themedial nucleus of the trapezoid body (MNTB) with a vibratomeslicer. Brains were dissected and sliced at 4 ◦C in a solution con-sisting of the following (in mM): 125 NaCl, 25 NaHCO3, 1.25NaH2PO4, 2.5 KCl, 0.1 CaCl2, 3 MgCl2, 25 glucose, 3 myo-inositol,2 Na-pyruvate, 0.4 ascorbic acid, continuously bubbled with 95%O2/5% CO2 (pH 7.4). Slices were incubated at 32 ◦C for 20 min in abicarbonate-buffered solution composed of the following (in mM):125 NaCl, 25 NaHCO3, 1.25 NaH2PO4, 2.5 KCl, 2 CaCl2, 1 MgCl2,25 glucose, 3 myo-inositol, 2 Na-pyruvate, 0.4 ascorbic acid, con-tinuously bubbled with 95% O2/5% CO2 (pH 7.4). For experimentsconducted in an external calcium concentration other than 2 mM,
slices were incubated in a solution similar to that above but withvarying CaCl2 and MgCl2 concentrations. The concentration of CaCl2added to that of MgCl2 was always equal to 3 mM when Cae ≤ 2 mM.For experiments with Cae = 3 mM and 4 mM, [Mg2+] = 0.1 mM.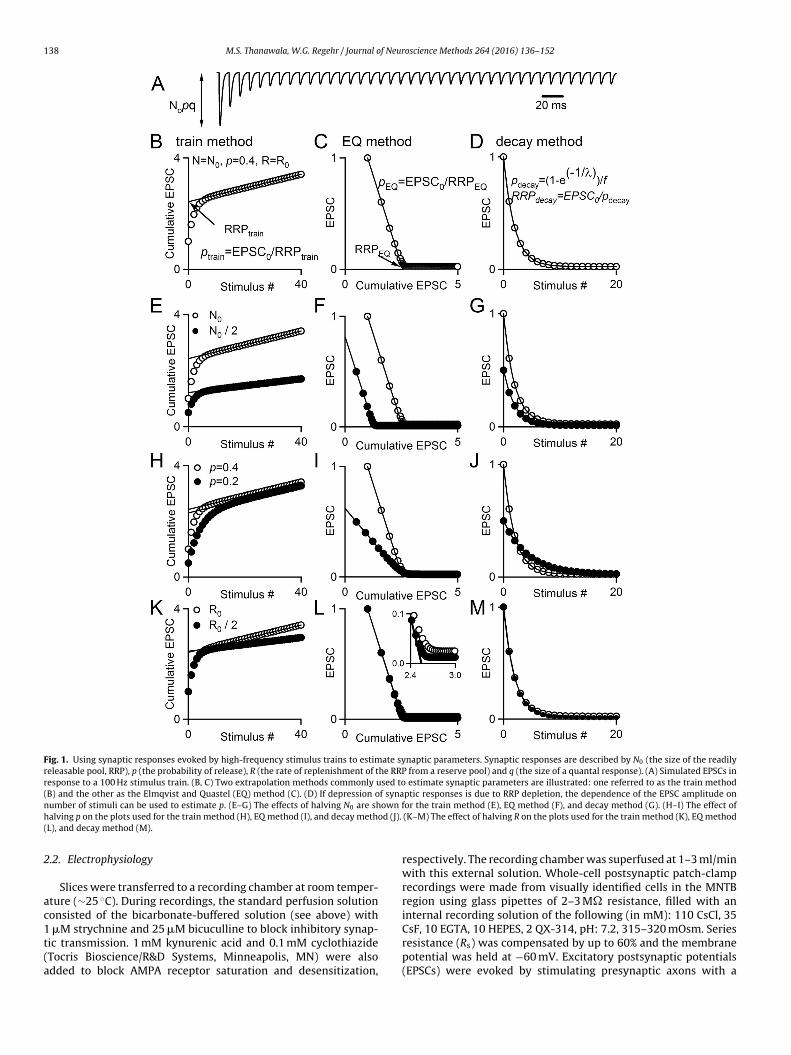
138 M.S. Thanawala, W.G. Regehr / Journal of Neuroscience Methods 264 (2016) 136–152
Fig. 1. Using synaptic responses evoked by high-frequency stimulus trains to estimate synaptic parameters. Synaptic responses are described by N0 (the size of the readilyreleasable pool, RRP), p (the probability of release), R (the rate of replenishment of the RRP from a reserve pool) and q (the size of a quantal response). (A) Simulated EPSCs inresponse to a 100 Hz stimulus train. (B, C) Two extrapolation methods commonly used to estimate synaptic parameters are illustrated: one referred to as the train method(B) and the other as the Elmqvist and Quastel (EQ) method (C). (D) If depression of synaptic responses is due to RRP depletion, the dependence of the EPSC amplitude onn own fh od (J).(
2
ac1t(a
umber of stimuli can be used to estimate p. (E–G) The effects of halving N0 are shalving p on the plots used for the train method (H), EQ method (I), and decay methL), and decay method (M).
.2. Electrophysiology
Slices were transferred to a recording chamber at room temper-ture (∼25 ◦C). During recordings, the standard perfusion solutiononsisted of the bicarbonate-buffered solution (see above) with�M strychnine and 25 �M bicuculline to block inhibitory synap-
ic transmission. 1 mM kynurenic acid and 0.1 mM cyclothiazideTocris Bioscience/R&D Systems, Minneapolis, MN) were alsodded to block AMPA receptor saturation and desensitization,
or the train method (E), EQ method (F), and decay method (G). (H–I) The effect of(K–M) The effect of halving R on the plots used for the train method (K), EQ method
respectively. The recording chamber was superfused at 1–3 ml/minwith this external solution. Whole-cell postsynaptic patch-clamprecordings were made from visually identified cells in the MNTBregion using glass pipettes of 2–3 M� resistance, filled with aninternal recording solution of the following (in mM): 110 CsCl, 35CsF, 10 EGTA, 10 HEPES, 2 QX-314, pH: 7.2, 315–320 mOsm. Series
resistance (Rs) was compensated by up to 60% and the membranepotential was held at −60 mV. Excitatory postsynaptic potentials(EPSCs) were evoked by stimulating presynaptic axons with a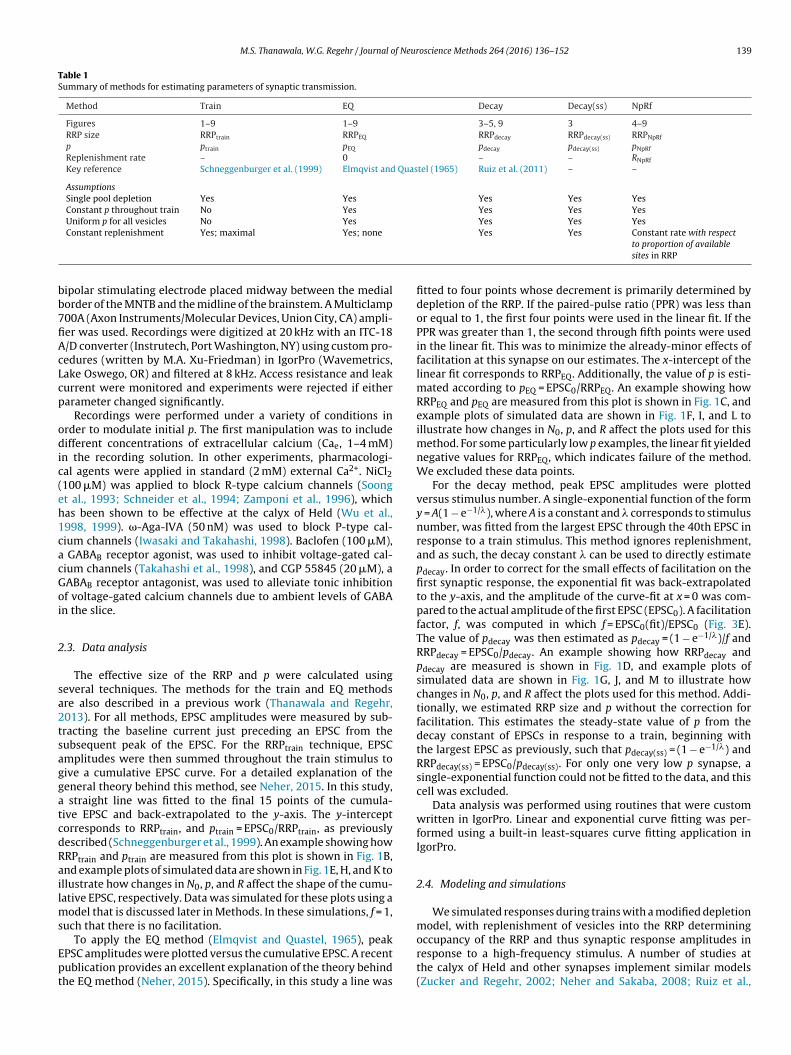
M.S. Thanawala, W.G. Regehr / Journal of Neuroscience Methods 264 (2016) 136–152 139
Table 1Summary of methods for estimating parameters of synaptic transmission.
Method Train EQ Decay Decay(ss) NpRf
Figures 1–9 1–9 3–5, 9 3 4–9RRP size RRPtrain RRPEQ RRPdecay RRPdecay(ss) RRPNpRf
p ptrain pEQ pdecay pdecay(ss) pNpRf
Replenishment rate – 0 – – RNpRf
Key reference Schneggenburger et al. (1999) Elmqvist and Quastel (1965) Ruiz et al. (2011) – –
AssumptionsSingle pool depletion Yes Yes Yes Yes YesConstant p throughout train No Yes Yes Yes YesUniform p for all vesicles No Yes Yes Yes Yes
bb7fiAcLcp
odic(eh1cacGoi
2
sa2tsaggatcdRailms
Ept
Constant replenishment Yes; maximal Yes; none
ipolar stimulating electrode placed midway between the medialorder of the MNTB and the midline of the brainstem. A Multiclamp00A (Axon Instruments/Molecular Devices, Union City, CA) ampli-er was used. Recordings were digitized at 20 kHz with an ITC-18/D converter (Instrutech, Port Washington, NY) using custom pro-edures (written by M.A. Xu-Friedman) in IgorPro (Wavemetrics,ake Oswego, OR) and filtered at 8 kHz. Access resistance and leakurrent were monitored and experiments were rejected if eitherarameter changed significantly.
Recordings were performed under a variety of conditions inrder to modulate initial p. The first manipulation was to includeifferent concentrations of extracellular calcium (Cae, 1–4 mM)
n the recording solution. In other experiments, pharmacologi-al agents were applied in standard (2 mM) external Ca2+. NiCl2100 �M) was applied to block R-type calcium channels (Soongt al., 1993; Schneider et al., 1994; Zamponi et al., 1996), whichas been shown to be effective at the calyx of Held (Wu et al.,998, 1999). �-Aga-IVA (50 nM) was used to block P-type cal-ium channels (Iwasaki and Takahashi, 1998). Baclofen (100 �M),GABAB receptor agonist, was used to inhibit voltage-gated cal-
ium channels (Takahashi et al., 1998), and CGP 55845 (20 �M), aABAB receptor antagonist, was used to alleviate tonic inhibitionf voltage-gated calcium channels due to ambient levels of GABAn the slice.
.3. Data analysis
The effective size of the RRP and p were calculated usingeveral techniques. The methods for the train and EQ methodsre also described in a previous work (Thanawala and Regehr,013). For all methods, EPSC amplitudes were measured by sub-racting the baseline current just preceding an EPSC from theubsequent peak of the EPSC. For the RRPtrain technique, EPSCmplitudes were then summed throughout the train stimulus toive a cumulative EPSC curve. For a detailed explanation of theeneral theory behind this method, see Neher, 2015. In this study,straight line was fitted to the final 15 points of the cumula-
ive EPSC and back-extrapolated to the y-axis. The y-interceptorresponds to RRPtrain, and ptrain = EPSC0/RRPtrain, as previouslyescribed (Schneggenburger et al., 1999). An example showing howRPtrain and ptrain are measured from this plot is shown in Fig. 1B,nd example plots of simulated data are shown in Fig. 1E, H, and K tollustrate how changes in N0, p, and R affect the shape of the cumu-ative EPSC, respectively. Data was simulated for these plots using a
odel that is discussed later in Methods. In these simulations, f = 1,uch that there is no facilitation.
To apply the EQ method (Elmqvist and Quastel, 1965), peakPSC amplitudes were plotted versus the cumulative EPSC. A recentublication provides an excellent explanation of the theory behindhe EQ method (Neher, 2015). Specifically, in this study a line was
Yes Yes Constant rate with respectto proportion of availablesites in RRP
fitted to four points whose decrement is primarily determined bydepletion of the RRP. If the paired-pulse ratio (PPR) was less thanor equal to 1, the first four points were used in the linear fit. If thePPR was greater than 1, the second through fifth points were usedin the linear fit. This was to minimize the already-minor effects offacilitation at this synapse on our estimates. The x-intercept of thelinear fit corresponds to RRPEQ. Additionally, the value of p is esti-mated according to pEQ = EPSC0/RRPEQ. An example showing howRRPEQ and pEQ are measured from this plot is shown in Fig. 1C, andexample plots of simulated data are shown in Fig. 1F, I, and L toillustrate how changes in N0, p, and R affect the plots used for thismethod. For some particularly low p examples, the linear fit yieldednegative values for RRPEQ, which indicates failure of the method.We excluded these data points.
For the decay method, peak EPSC amplitudes were plottedversus stimulus number. A single-exponential function of the formy = A(1 − e−1/�), where A is a constant and � corresponds to stimulusnumber, was fitted from the largest EPSC through the 40th EPSC inresponse to a train stimulus. This method ignores replenishment,and as such, the decay constant � can be used to directly estimatepdecay. In order to correct for the small effects of facilitation on thefirst synaptic response, the exponential fit was back-extrapolatedto the y-axis, and the amplitude of the curve-fit at x = 0 was com-pared to the actual amplitude of the first EPSC (EPSC0). A facilitationfactor, f, was computed in which f = EPSC0(fit)/EPSC0 (Fig. 3E).The value of pdecay was then estimated as pdecay = (1 − e−1/�)/f andRRPdecay = EPSC0/pdecay. An example showing how RRPdecay andpdecay are measured is shown in Fig. 1D, and example plots ofsimulated data are shown in Fig. 1G, J, and M to illustrate howchanges in N0, p, and R affect the plots used for this method. Addi-tionally, we estimated RRP size and p without the correction forfacilitation. This estimates the steady-state value of p from thedecay constant of EPSCs in response to a train, beginning withthe largest EPSC as previously, such that pdecay(ss) = (1 − e−1/�) andRRPdecay(ss) = EPSC0/pdecay(ss). For only one very low p synapse, asingle-exponential function could not be fitted to the data, and thiscell was excluded.
Data analysis was performed using routines that were customwritten in IgorPro. Linear and exponential curve fitting was per-formed using a built-in least-squares curve fitting application inIgorPro.
2.4. Modeling and simulations
We simulated responses during trains with a modified depletionmodel, with replenishment of vesicles into the RRP determining
occupancy of the RRP and thus synaptic response amplitudes inresponse to a high-frequency stimulus. A number of studies atthe calyx of Held and other synapses implement similar models(Zucker and Regehr, 2002; Neher and Sakaba, 2008; Ruiz et al.,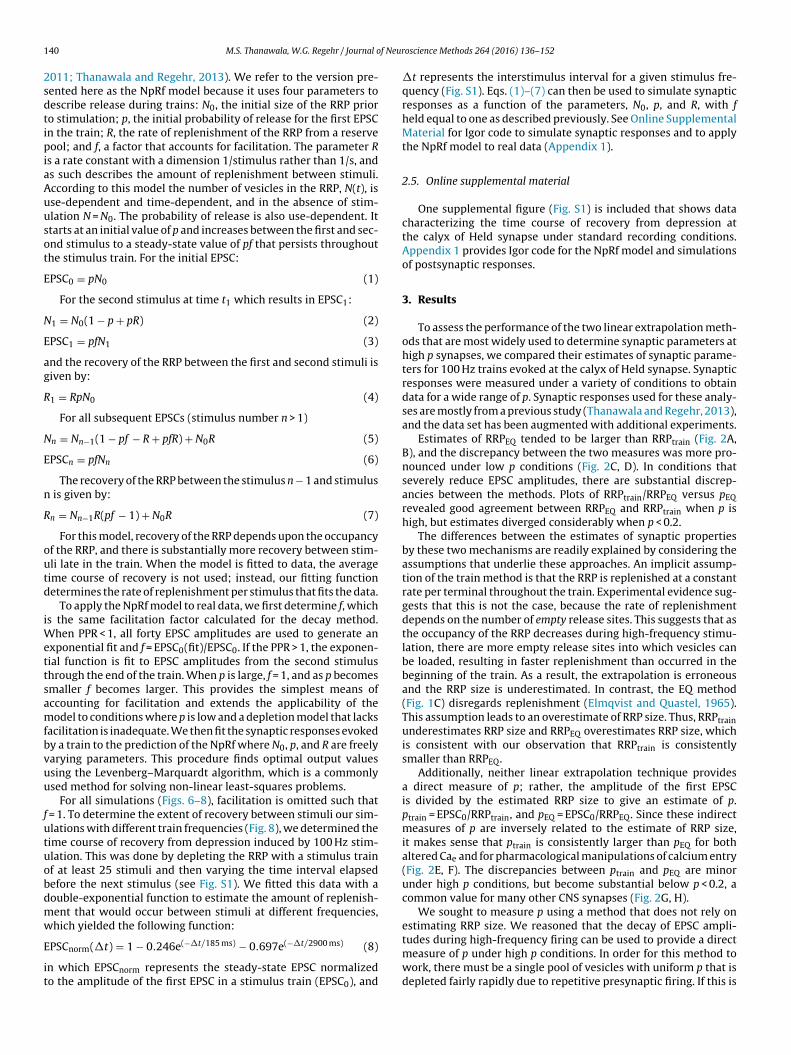
1 f Neur
2sdtipiaAuusot
E
N
E
ag
R
N
E
n
R
outd
iWettsamfbvuu
futuobdmw
E
it
40 M.S. Thanawala, W.G. Regehr / Journal o
011; Thanawala and Regehr, 2013). We refer to the version pre-ented here as the NpRf model because it uses four parameters toescribe release during trains: N0, the initial size of the RRP prioro stimulation; p, the initial probability of release for the first EPSCn the train; R, the rate of replenishment of the RRP from a reserveool; and f, a factor that accounts for facilitation. The parameter R
s a rate constant with a dimension 1/stimulus rather than 1/s, ands such describes the amount of replenishment between stimuli.ccording to this model the number of vesicles in the RRP, N(t), isse-dependent and time-dependent, and in the absence of stim-lation N = N0. The probability of release is also use-dependent. Ittarts at an initial value of p and increases between the first and sec-nd stimulus to a steady-state value of pf that persists throughouthe stimulus train. For the initial EPSC:
PSC0 = pN0 (1)
For the second stimulus at time t1 which results in EPSC1:
1 = N0(1 − p + pR) (2)
PSC1 = pfN1 (3)
nd the recovery of the RRP between the first and second stimuli isiven by:
1 = RpN0 (4)
For all subsequent EPSCs (stimulus number n > 1)
n = Nn−1(1 − pf − R + pfR) + N0R (5)
PSCn = pfNn (6)
The recovery of the RRP between the stimulus n − 1 and stimulusis given by:
n = Nn−1R(pf − 1) + N0R (7)
For this model, recovery of the RRP depends upon the occupancyf the RRP, and there is substantially more recovery between stim-li late in the train. When the model is fitted to data, the averageime course of recovery is not used; instead, our fitting functionetermines the rate of replenishment per stimulus that fits the data.
To apply the NpRf model to real data, we first determine f, whichs the same facilitation factor calculated for the decay method.
hen PPR < 1, all forty EPSC amplitudes are used to generate anxponential fit and f = EPSC0(fit)/EPSC0. If the PPR > 1, the exponen-ial function is fit to EPSC amplitudes from the second stimulushrough the end of the train. When p is large, f = 1, and as p becomesmaller f becomes larger. This provides the simplest means ofccounting for facilitation and extends the applicability of theodel to conditions where p is low and a depletion model that lacks
acilitation is inadequate. We then fit the synaptic responses evokedy a train to the prediction of the NpRf where N0, p, and R are freelyarying parameters. This procedure finds optimal output valuessing the Levenberg–Marquardt algorithm, which is a commonlysed method for solving non-linear least-squares problems.
For all simulations (Figs. 6–8), facilitation is omitted such that= 1. To determine the extent of recovery between stimuli our sim-lations with different train frequencies (Fig. 8), we determined theime course of recovery from depression induced by 100 Hz stim-lation. This was done by depleting the RRP with a stimulus trainf at least 25 stimuli and then varying the time interval elapsedefore the next stimulus (see Fig. S1). We fitted this data with aouble-exponential function to estimate the amount of replenish-ent that would occur between stimuli at different frequencies,hich yielded the following function:
PSCnorm(�t) = 1 − 0.246e(−�t/185 ms) − 0.697e(−�t/2900 ms) (8)
n which EPSCnorm represents the steady-state EPSC normalizedo the amplitude of the first EPSC in a stimulus train (EPSC0), and
oscience Methods 264 (2016) 136–152
�t represents the interstimulus interval for a given stimulus fre-quency (Fig. S1). Eqs. (1)–(7) can then be used to simulate synapticresponses as a function of the parameters, N0, p, and R, with fheld equal to one as described previously. See Online SupplementalMaterial for Igor code to simulate synaptic responses and to applythe NpRf model to real data (Appendix 1).
2.5. Online supplemental material
One supplemental figure (Fig. S1) is included that shows datacharacterizing the time course of recovery from depression atthe calyx of Held synapse under standard recording conditions.Appendix 1 provides Igor code for the NpRf model and simulationsof postsynaptic responses.
3. Results
To assess the performance of the two linear extrapolation meth-ods that are most widely used to determine synaptic parameters athigh p synapses, we compared their estimates of synaptic parame-ters for 100 Hz trains evoked at the calyx of Held synapse. Synapticresponses were measured under a variety of conditions to obtaindata for a wide range of p. Synaptic responses used for these analy-ses are mostly from a previous study (Thanawala and Regehr, 2013),and the data set has been augmented with additional experiments.
Estimates of RRPEQ tended to be larger than RRPtrain (Fig. 2A,B), and the discrepancy between the two measures was more pro-nounced under low p conditions (Fig. 2C, D). In conditions thatseverely reduce EPSC amplitudes, there are substantial discrep-ancies between the methods. Plots of RRPtrain/RRPEQ versus pEQrevealed good agreement between RRPEQ and RRPtrain when p ishigh, but estimates diverged considerably when p < 0.2.
The differences between the estimates of synaptic propertiesby these two mechanisms are readily explained by considering theassumptions that underlie these approaches. An implicit assump-tion of the train method is that the RRP is replenished at a constantrate per terminal throughout the train. Experimental evidence sug-gests that this is not the case, because the rate of replenishmentdepends on the number of empty release sites. This suggests that asthe occupancy of the RRP decreases during high-frequency stimu-lation, there are more empty release sites into which vesicles canbe loaded, resulting in faster replenishment than occurred in thebeginning of the train. As a result, the extrapolation is erroneousand the RRP size is underestimated. In contrast, the EQ method(Fig. 1C) disregards replenishment (Elmqvist and Quastel, 1965).This assumption leads to an overestimate of RRP size. Thus, RRPtrainunderestimates RRP size and RRPEQ overestimates RRP size, whichis consistent with our observation that RRPtrain is consistentlysmaller than RRPEQ.
Additionally, neither linear extrapolation technique providesa direct measure of p; rather, the amplitude of the first EPSCis divided by the estimated RRP size to give an estimate of p.ptrain = EPSC0/RRPtrain, and pEQ = EPSC0/RRPEQ. Since these indirectmeasures of p are inversely related to the estimate of RRP size,it makes sense that ptrain is consistently larger than pEQ for bothaltered Cae and for pharmacological manipulations of calcium entry(Fig. 2E, F). The discrepancies between ptrain and pEQ are minorunder high p conditions, but become substantial below p < 0.2, acommon value for many other CNS synapses (Fig. 2G, H).
We sought to measure p using a method that does not rely onestimating RRP size. We reasoned that the decay of EPSC ampli-
tudes during high-frequency firing can be used to provide a directmeasure of p under high p conditions. In order for this method towork, there must be a single pool of vesicles with uniform p that isdepleted fairly rapidly due to repetitive presynaptic firing. If this is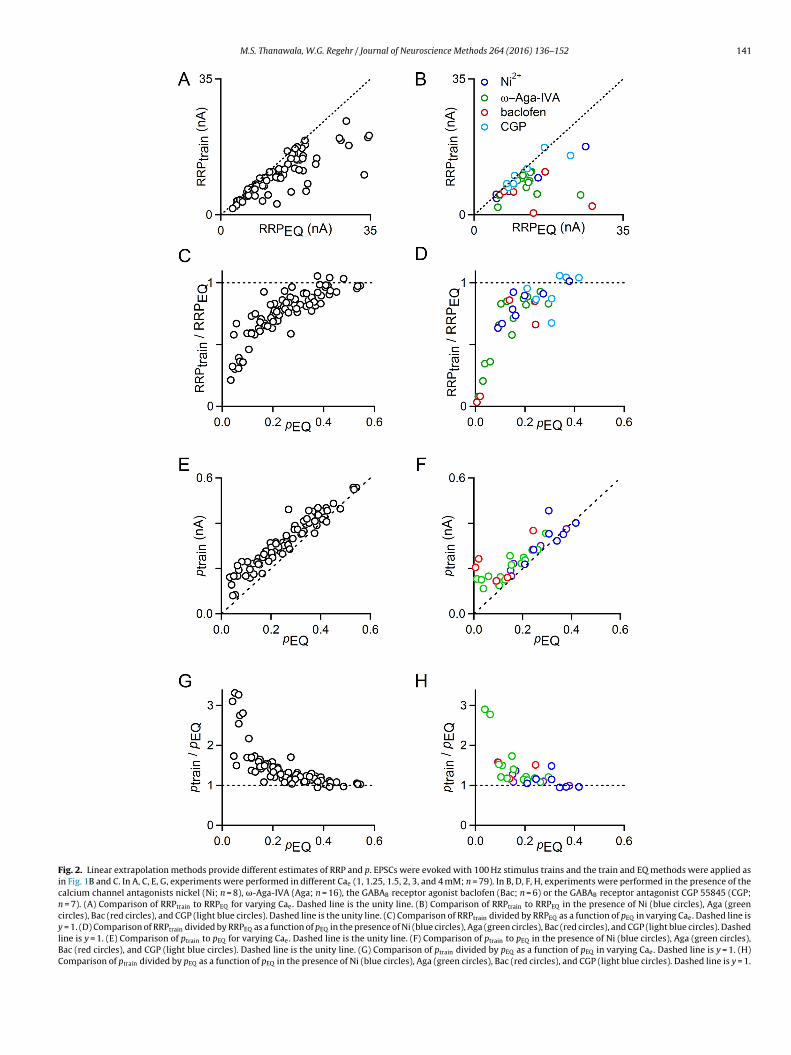
M.S. Thanawala, W.G. Regehr / Journal of Neuroscience Methods 264 (2016) 136–152 141
Fig. 2. Linear extrapolation methods provide different estimates of RRP and p. EPSCs were evoked with 100 Hz stimulus trains and the train and EQ methods were applied asin Fig. 1B and C. In A, C, E, G, experiments were performed in different Cae (1, 1.25, 1.5, 2, 3, and 4 mM; n = 79). In B, D, F, H, experiments were performed in the presence of thecalcium channel antagonists nickel (Ni; n = 8), �-Aga-IVA (Aga; n = 16), the GABAB receptor agonist baclofen (Bac; n = 6) or the GABAB receptor antagonist CGP 55845 (CGP;n = 7). (A) Comparison of RRPtrain to RRPEQ for varying Cae. Dashed line is the unity line. (B) Comparison of RRPtrain to RRPEQ in the presence of Ni (blue circles), Aga (greencircles), Bac (red circles), and CGP (light blue circles). Dashed line is the unity line. (C) Comparison of RRPtrain divided by RRPEQ as a function of pEQ in varying Cae. Dashed line isy = 1. (D) Comparison of RRPtrain divided by RRPEQ as a function of pEQ in the presence of Ni (blue circles), Aga (green circles), Bac (red circles), and CGP (light blue circles). Dashedline is y = 1. (E) Comparison of ptrain to pEQ for varying Cae. Dashed line is the unity line. (F) Comparison of ptrain to pEQ in the presence of Ni (blue circles), Aga (green circles),Bac (red circles), and CGP (light blue circles). Dashed line is the unity line. (G) Comparison of ptrain divided by pEQ as a function of pEQ in varying Cae. Dashed line is y = 1. (H)Comparison of ptrain divided by pEQ as a function of pEQ in the presence of Ni (blue circles), Aga (green circles), Bac (red circles), and CGP (light blue circles). Dashed line is y = 1.
142 M.S. Thanawala, W.G. Regehr / Journal of Neuroscience Methods 264 (2016) 136–152
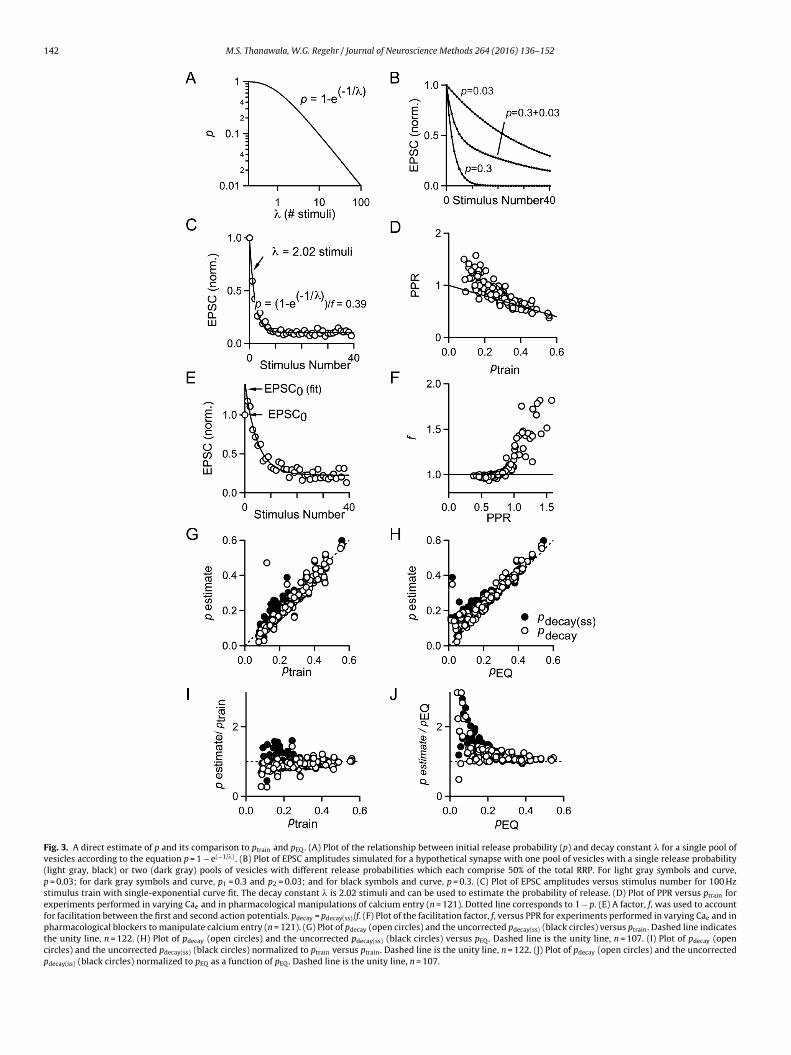
Fig. 3. A direct estimate of p and its comparison to ptrain and pEQ. (A) Plot of the relationship between initial release probability (p) and decay constant � for a single pool ofvesicles according to the equation p = 1 − e(−1/�) . (B) Plot of EPSC amplitudes simulated for a hypothetical synapse with one pool of vesicles with a single release probability(light gray, black) or two (dark gray) pools of vesicles with different release probabilities which each comprise 50% of the total RRP. For light gray symbols and curve,p = 0.03; for dark gray symbols and curve, p1 = 0.3 and p2 = 0.03; and for black symbols and curve, p = 0.3. (C) Plot of EPSC amplitudes versus stimulus number for 100 Hzstimulus train with single-exponential curve fit. The decay constant � is 2.02 stimuli and can be used to estimate the probability of release. (D) Plot of PPR versus ptrain forexperiments performed in varying Cae and in pharmacological manipulations of calcium entry (n = 121). Dotted line corresponds to 1 − p. (E) A factor, f, was used to accountfor facilitation between the first and second action potentials. pdecay = pdecay(ss)/f. (F) Plot of the facilitation factor, f, versus PPR for experiments performed in varying Cae and inpharmacological blockers to manipulate calcium entry (n = 121). (G) Plot of pdecay (open circles) and the uncorrected pdecay(ss) (black circles) versus ptrain. Dashed line indicatesthe unity line, n = 122. (H) Plot of pdecay (open circles) and the uncorrected pdecay(ss) (black circles) versus pEQ. Dashed line is the unity line, n = 107. (I) Plot of pdecay (opencircles) and the uncorrected pdecay(ss) (black circles) normalized to ptrain versus ptrain. Dashed line is the unity line, n = 122. (J) Plot of pdecay (open circles) and the uncorrectedpdecay(ss) (black circles) normalized to pEQ as a function of pEQ. Dashed line is the unity line, n = 107.
f Neur
ttbatpassppoekltappnft(artfttdeltabtdc
ucbasestoEtfodo
Cptoesbntpa
M.S. Thanawala, W.G. Regehr / Journal o
he case, then EPSC amplitudes will decay exponentially accordingo the equation EPSCn/EPSC0 = e(−n/�), where n is the stimulus num-er and � is the decay constant of a single-exponential fit to EPSCmplitudes throughout a train. If the decrement is due to deple-ion and there is no significant replenishment, then it should beossible to estimate p directly using p = 1 − e(−1/�). It is difficult topply this approach if p > 0.5 because the decrement in the EPSC iso rapid that � is less that a single stimulus, as well as if p < 0.01,ince � is more than 100 stimuli (Fig. 3A). Another potential com-lication is that at the calyx of Held there appear to be high and lowvesicles for release driven by prolonged presynaptic voltage stepsr calcium increases (Sakaba and Neher, 2001a; Trommershäusert al., 2003; Wölfel et al., 2007; Chen et al., 2015), but it is notnown if low p vesicles contribute to AP-evoked release. If high andow p vesicles both contribute to release evoked by 100 Hz trains,hen EPSC amplitudes would decay with a double-exponentialmplitude (EPSCn/EPSC0 = Ae(−n/�1) + Be(−n/�2), p1 = 1 − e(−1/�1) and2 = 1 − e(−1/�2)). This predicts that if there are both high and lowsynapses, the EPSC decay as a function of stimulus number can-ot be approximated by a single-exponential decay, as illustrated
or a simplified example (lacking replenishment) in which half ofhe vesicles in the RRP have p = 0.3 and the other half have p = 0.03Fig. 3B). As in Fig. 3C, we find that the EPSC amplitudes are wellpproximated by a single-exponential decay, which suggests thatelease due to action potentials is primarily mediated by a popula-ion of vesicles with similar release probability. Further, the PPRsor an interstimulus interval of 10 ms conform well to a line equalo 1 − p when p is greater than 0.2. This suggests that the ampli-udes of EPSCs early in a stimulus train are primarily determined byepletion of a readily-releasable pool of vesicles for synapses thatxhibit moderate to high p (Fig. 3D). This would likely not be true foronger interstimulus intervals, because replenishment would bringhe occupancy of the RRP closer to its initial state. The data devi-te from the 1 − p line for ptrain < 0.2, the point at which facilitationecomes somewhat noticeable, although the amplitude of facilita-ion is still quite small. This suggests that estimates of p from theecay of EPSC amplitudes will probably be inaccurate under low ponditions as a result.
To extend the value of using the decay of EPSC amplitudes tonderstand data from the calyx of Held synapse, we decided toalculate a facilitation factor, f, to adjust for the facilitation observedetween the first and second stimulus. For each cell, we performedsingle-exponential curve fit to the plot of EPSC amplitude versus
timulus number, beginning the fit with the largest EPSC. In almostvery case, either the first or second EPSC was the largest in the 40-timulus action potential train. We backextrapolated this curve tohe y-axis (Fig. 3E). The facilitation factor, f, equals the amplitudef the curve fit at the y-axis divided by the actual amplitude ofPSC0 (Fig. 3F). We reasoned that the estimate of p obtained fromhe single-exponential fit (with p that increased during the train byacilitation, or steady-state p) would be greater than the initial valuef p during the first action potential by a factor of f. We thereforeivided this estimate by f to calculate pdecay, which is our estimatef initial p.
We applied the decay method data obtained from varyingae and from pharmacological manipulation of calcium entry torovide many data points covering a wide range of values of ini-ial release probability (from p < 0.1 to almost p = 0.6, dependingn the estimation method used). Plots of pdecay versus the twostablished linear extrapolation methods of estimating p show rea-onable agreement between pdecay and ptrain (Fig. 3G) as well asetween pdecay and pEQ (Fig. 3H). The values for pdecay(ss), which are
ot corrected for facilitation (see Section 2), are likely to reflecthe steady-state value of p, display the same trends. A plot ofdecay/ptrain versus ptrain reveals that when ptrain is below 0.2, thegreement between the methods is poor, which is also true foroscience Methods 264 (2016) 136–152 143
pdecay(ss) (Fig. 3I). A comparison to the EQ method similarly revealsthe most considerable disagreement between the two methodswhen pEQ is below 0.2. Under these conditions, pdecay and pdecay(ss)are generally larger than ptrain (Fig. 3J). These findings suggest thatthe amplitude of EPSCs evoked during the train do indeed provideinformation about p, but that when p < 0.2 the methods providedifferent estimates of synaptic parameters.
These discrepancies may make sense in light of the fact thatthese methods are based on assumptions about replenishment thatare too simple, as discussed previously (Table 1). A comparison ofthe estimates of the EQ and train methods with the exponential fitmethod is useful because they are expected to provide estimatesof RRP that bracket the actual RRP (Thanawala and Regehr, 2013).Our analyses show that when p > 0.4, any of the three methods out-lined here are likely to provide similar results. For more moderatep between 0.2 and 0.4, the results may be somewhat different, andfor p < 0.2 the results are likely to differ dramatically.
In order to assess the performance of existing methods and todevelop an approach that allows more reliable determination ofsynaptic parameters, we developed a simple model of synaptictransmission at the calyx of Held that incorporates known prop-erties of replenishment. In this model, replenishment is dependenton the number of empty release sites and thus is not constant dur-ing the train. This is based on our experimental observation thatmore recovery from depression occurs when the extent of deple-tion is greater. The model has four parameters: the size of the RRP(N0); the probability of release (p), the rate of replenishment of thereadily-releasable pool from the recycling pool (R), and a facilita-tion factor (f) which was introduced in Fig. 3. It has similarities toa number of previous models that have been advanced to describesynaptic properties (Kusano and Landau, 1975; Abbott et al., 1997;Tsodyks and Markram, 1997; Dittman et al., 2000; Cartling, 2002;Yang and Xu-Friedman, 2008; Ruiz et al., 2011; Hennig, 2013). Wecall this model the NpRf model.
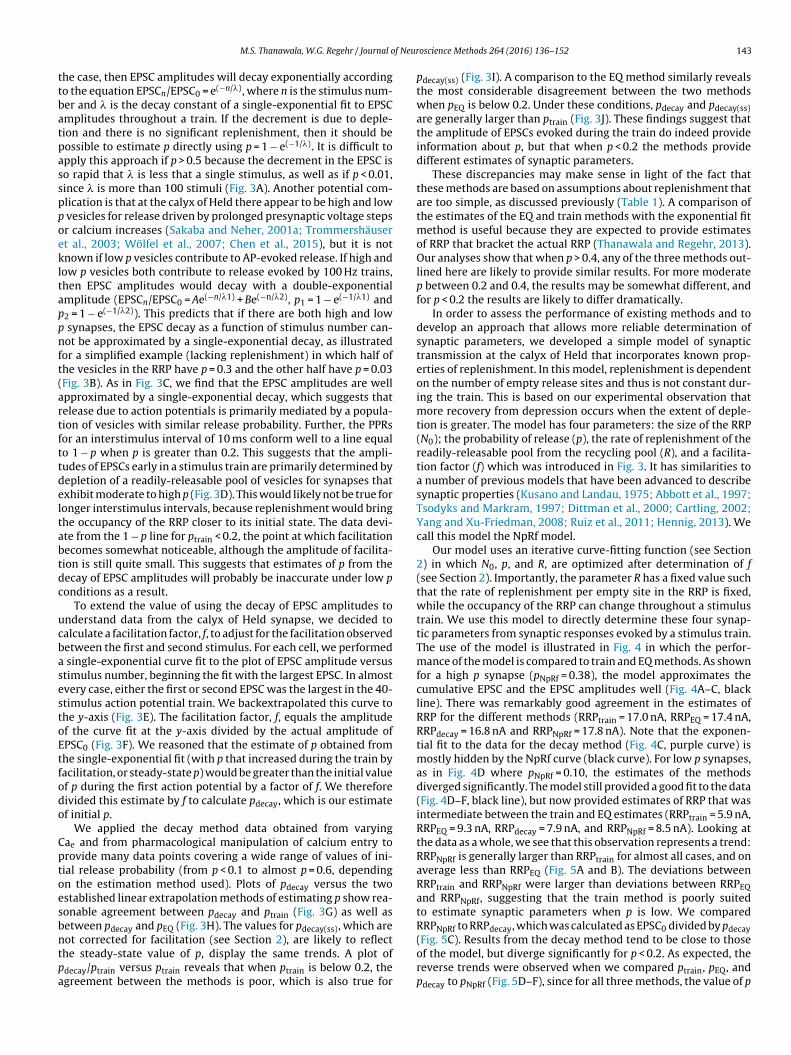
Our model uses an iterative curve-fitting function (see Section2) in which N0, p, and R, are optimized after determination of f(see Section 2). Importantly, the parameter R has a fixed value suchthat the rate of replenishment per empty site in the RRP is fixed,while the occupancy of the RRP can change throughout a stimulustrain. We use this model to directly determine these four synap-tic parameters from synaptic responses evoked by a stimulus train.The use of the model is illustrated in Fig. 4 in which the perfor-mance of the model is compared to train and EQ methods. As shownfor a high p synapse (pNpRf = 0.38), the model approximates thecumulative EPSC and the EPSC amplitudes well (Fig. 4A–C, blackline). There was remarkably good agreement in the estimates ofRRP for the different methods (RRPtrain = 17.0 nA, RRPEQ = 17.4 nA,RRPdecay = 16.8 nA and RRPNpRf = 17.8 nA). Note that the exponen-tial fit to the data for the decay method (Fig. 4C, purple curve) ismostly hidden by the NpRf curve (black curve). For low p synapses,as in Fig. 4D where pNpRf = 0.10, the estimates of the methodsdiverged significantly. The model still provided a good fit to the data(Fig. 4D–F, black line), but now provided estimates of RRP that wasintermediate between the train and EQ estimates (RRPtrain = 5.9 nA,RRPEQ = 9.3 nA, RRPdecay = 7.9 nA, and RRPNpRf = 8.5 nA). Looking atthe data as a whole, we see that this observation represents a trend:RRPNpRf is generally larger than RRPtrain for almost all cases, and onaverage less than RRPEQ (Fig. 5A and B). The deviations betweenRRPtrain and RRPNpRf were larger than deviations between RRPEQand RRPNpRf, suggesting that the train method is poorly suitedto estimate synaptic parameters when p is low. We comparedRRPNpRf to RRPdecay, which was calculated as EPSC0 divided by pdecay
(Fig. 5C). Results from the decay method tend to be close to thoseof the model, but diverge significantly for p < 0.2. As expected, thereverse trends were observed when we compared ptrain, pEQ, andpdecay to pNpRf (Fig. 5D–F), since for all three methods, the value of p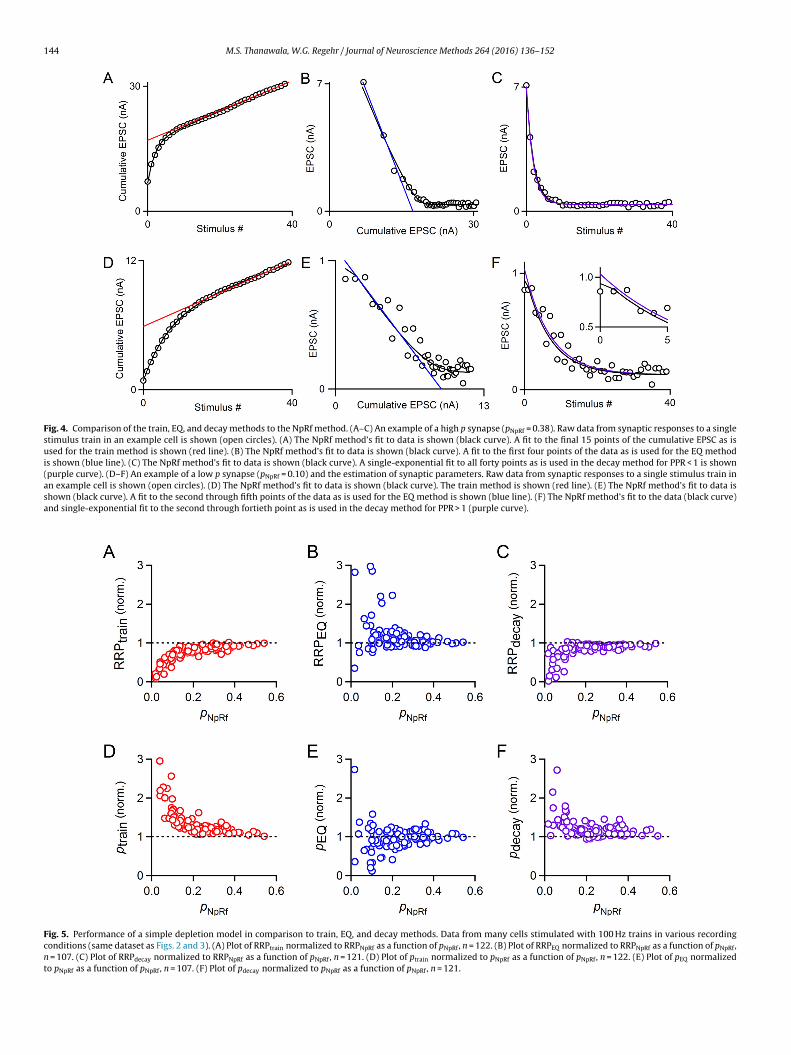
144 M.S. Thanawala, W.G. Regehr / Journal of Neuroscience Methods 264 (2016) 136–152
Fig. 4. Comparison of the train, EQ, and decay methods to the NpRf method. (A–C) An example of a high p synapse (pNpRf = 0.38). Raw data from synaptic responses to a singlestimulus train in an example cell is shown (open circles). (A) The NpRf method’s fit to data is shown (black curve). A fit to the final 15 points of the cumulative EPSC as isused for the train method is shown (red line). (B) The NpRf method’s fit to data is shown (black curve). A fit to the first four points of the data as is used for the EQ methodis shown (blue line). (C) The NpRf method’s fit to data is shown (black curve). A single-exponential fit to all forty points as is used in the decay method for PPR < 1 is shown(purple curve). (D–F) An example of a low p synapse (pNpRf = 0.10) and the estimation of synaptic parameters. Raw data from synaptic responses to a single stimulus train inan example cell is shown (open circles). (D) The NpRf method’s fit to data is shown (black curve). The train method is shown (red line). (E) The NpRf method’s fit to data isshown (black curve). A fit to the second through fifth points of the data as is used for the EQ method is shown (blue line). (F) The NpRf method’s fit to the data (black curve)and single-exponential fit to the second through fortieth point as is used in the decay method for PPR > 1 (purple curve).
Fig. 5. Performance of a simple depletion model in comparison to train, EQ, and decay methods. Data from many cells stimulated with 100 Hz trains in various recordingconditions (same dataset as Figs. 2 and 3). (A) Plot of RRPtrain normalized to RRPNpRf as a function of pNpRf, n = 122. (B) Plot of RRPEQ normalized to RRPNpRf as a function of pNpRf,n = 107. (C) Plot of RRPdecay normalized to RRPNpRf as a function of pNpRf, n = 121. (D) Plot of ptrain normalized to pNpRf as a function of pNpRf, n = 122. (E) Plot of pEQ normalizedto pNpRf as a function of pNpRf, n = 107. (F) Plot of pdecay normalized to pNpRf as a function of pNpRf, n = 121.
f Neur
iopRt
datlsiotenctubft
WrotdfpcptofapsRuerbRihw
ttsha(1hgsatmE
i3t
M.S. Thanawala, W.G. Regehr / Journal o
s inversely related to the measure of RRP size. Note that estimatesf p are all estimates of initial p: ptrain and pEQ are estimates of initial, since they divide the amplitude of the first EPSC by the estimatedRP size, and pdecay and pNpRf are corrected by facilitation factor fo reflect initial p.
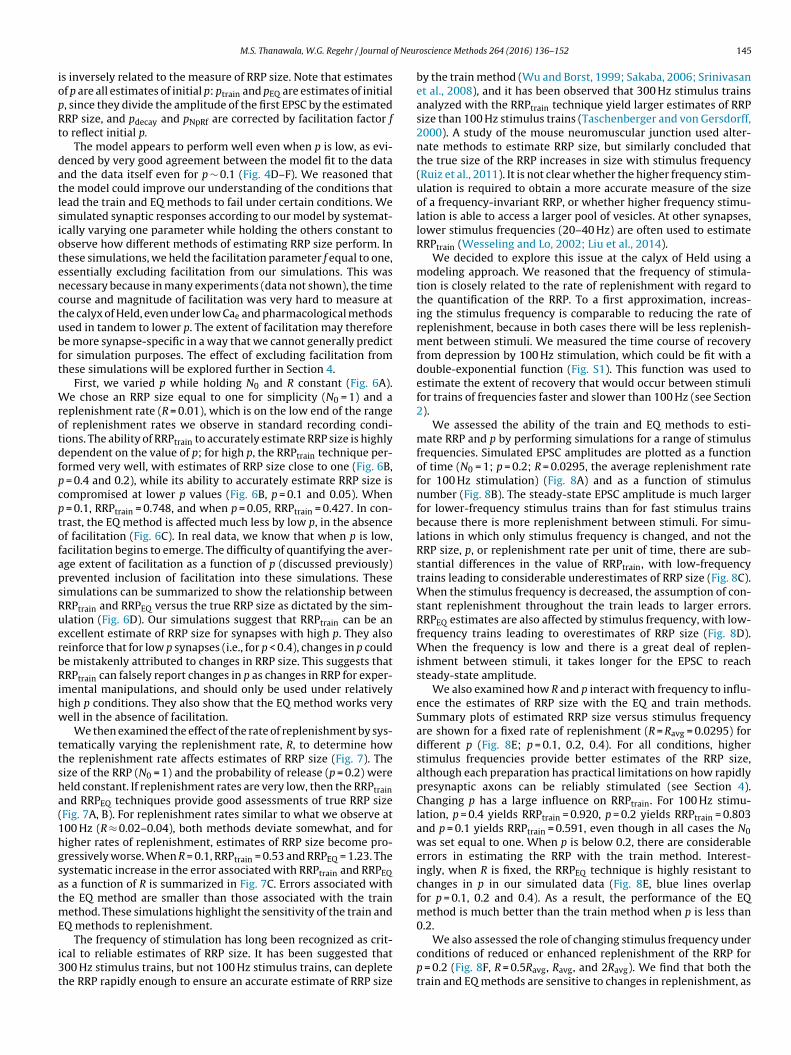
The model appears to perform well even when p is low, as evi-enced by very good agreement between the model fit to the datand the data itself even for p ∼ 0.1 (Fig. 4D–F). We reasoned thathe model could improve our understanding of the conditions thatead the train and EQ methods to fail under certain conditions. Weimulated synaptic responses according to our model by systemat-cally varying one parameter while holding the others constant tobserve how different methods of estimating RRP size perform. Inhese simulations, we held the facilitation parameter f equal to one,ssentially excluding facilitation from our simulations. This wasecessary because in many experiments (data not shown), the timeourse and magnitude of facilitation was very hard to measure athe calyx of Held, even under low Cae and pharmacological methodssed in tandem to lower p. The extent of facilitation may thereforee more synapse-specific in a way that we cannot generally predictor simulation purposes. The effect of excluding facilitation fromhese simulations will be explored further in Section 4.
First, we varied p while holding N0 and R constant (Fig. 6A).e chose an RRP size equal to one for simplicity (N0 = 1) and a
eplenishment rate (R = 0.01), which is on the low end of the rangef replenishment rates we observe in standard recording condi-ions. The ability of RRPtrain to accurately estimate RRP size is highlyependent on the value of p; for high p, the RRPtrain technique per-ormed very well, with estimates of RRP size close to one (Fig. 6B,= 0.4 and 0.2), while its ability to accurately estimate RRP size isompromised at lower p values (Fig. 6B, p = 0.1 and 0.05). When= 0.1, RRPtrain = 0.748, and when p = 0.05, RRPtrain = 0.427. In con-
rast, the EQ method is affected much less by low p, in the absencef facilitation (Fig. 6C). In real data, we know that when p is low,acilitation begins to emerge. The difficulty of quantifying the aver-ge extent of facilitation as a function of p (discussed previously)revented inclusion of facilitation into these simulations. Theseimulations can be summarized to show the relationship betweenRPtrain and RRPEQ versus the true RRP size as dictated by the sim-lation (Fig. 6D). Our simulations suggest that RRPtrain can be anxcellent estimate of RRP size for synapses with high p. They alsoeinforce that for low p synapses (i.e., for p < 0.4), changes in p coulde mistakenly attributed to changes in RRP size. This suggests thatRPtrain can falsely report changes in p as changes in RRP for exper-
mental manipulations, and should only be used under relativelyigh p conditions. They also show that the EQ method works veryell in the absence of facilitation.
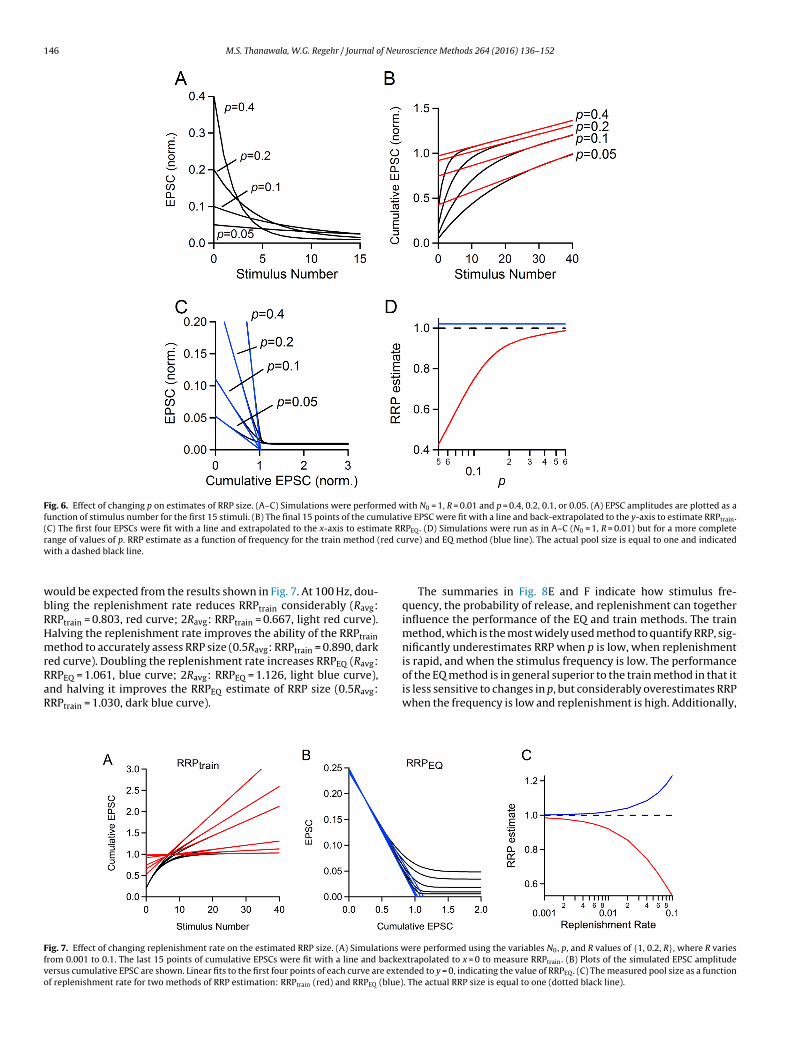
We then examined the effect of the rate of replenishment by sys-ematically varying the replenishment rate, R, to determine howhe replenishment rate affects estimates of RRP size (Fig. 7). Theize of the RRP (N0 = 1) and the probability of release (p = 0.2) wereeld constant. If replenishment rates are very low, then the RRPtrainnd RRPEQ techniques provide good assessments of true RRP sizeFig. 7A, B). For replenishment rates similar to what we observe at00 Hz (R ≈ 0.02–0.04), both methods deviate somewhat, and forigher rates of replenishment, estimates of RRP size become pro-ressively worse. When R = 0.1, RRPtrain = 0.53 and RRPEQ = 1.23. Theystematic increase in the error associated with RRPtrain and RRPEQs a function of R is summarized in Fig. 7C. Errors associated withhe EQ method are smaller than those associated with the train
ethod. These simulations highlight the sensitivity of the train andQ methods to replenishment.
The frequency of stimulation has long been recognized as crit-cal to reliable estimates of RRP size. It has been suggested that00 Hz stimulus trains, but not 100 Hz stimulus trains, can depletehe RRP rapidly enough to ensure an accurate estimate of RRP size
oscience Methods 264 (2016) 136–152 145
by the train method (Wu and Borst, 1999; Sakaba, 2006; Srinivasanet al., 2008), and it has been observed that 300 Hz stimulus trainsanalyzed with the RRPtrain technique yield larger estimates of RRPsize than 100 Hz stimulus trains (Taschenberger and von Gersdorff,2000). A study of the mouse neuromuscular junction used alter-nate methods to estimate RRP size, but similarly concluded thatthe true size of the RRP increases in size with stimulus frequency(Ruiz et al., 2011). It is not clear whether the higher frequency stim-ulation is required to obtain a more accurate measure of the sizeof a frequency-invariant RRP, or whether higher frequency stimu-lation is able to access a larger pool of vesicles. At other synapses,lower stimulus frequencies (20–40 Hz) are often used to estimateRRPtrain (Wesseling and Lo, 2002; Liu et al., 2014).
We decided to explore this issue at the calyx of Held using amodeling approach. We reasoned that the frequency of stimula-tion is closely related to the rate of replenishment with regard tothe quantification of the RRP. To a first approximation, increas-ing the stimulus frequency is comparable to reducing the rate ofreplenishment, because in both cases there will be less replenish-ment between stimuli. We measured the time course of recoveryfrom depression by 100 Hz stimulation, which could be fit with adouble-exponential function (Fig. S1). This function was used toestimate the extent of recovery that would occur between stimulifor trains of frequencies faster and slower than 100 Hz (see Section2).
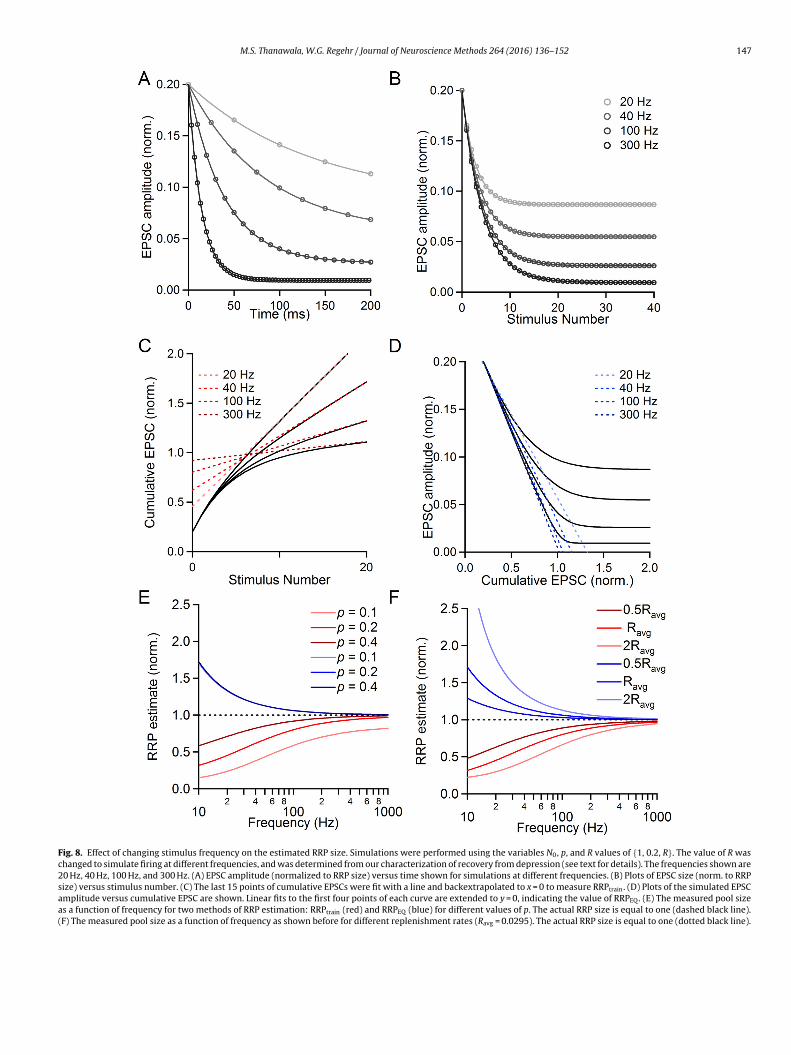
We assessed the ability of the train and EQ methods to esti-mate RRP and p by performing simulations for a range of stimulusfrequencies. Simulated EPSC amplitudes are plotted as a functionof time (N0 = 1; p = 0.2; R = 0.0295, the average replenishment ratefor 100 Hz stimulation) (Fig. 8A) and as a function of stimulusnumber (Fig. 8B). The steady-state EPSC amplitude is much largerfor lower-frequency stimulus trains than for fast stimulus trainsbecause there is more replenishment between stimuli. For simu-lations in which only stimulus frequency is changed, and not theRRP size, p, or replenishment rate per unit of time, there are sub-stantial differences in the value of RRPtrain, with low-frequencytrains leading to considerable underestimates of RRP size (Fig. 8C).When the stimulus frequency is decreased, the assumption of con-stant replenishment throughout the train leads to larger errors.RRPEQ estimates are also affected by stimulus frequency, with low-frequency trains leading to overestimates of RRP size (Fig. 8D).When the frequency is low and there is a great deal of replen-ishment between stimuli, it takes longer for the EPSC to reachsteady-state amplitude.
We also examined how R and p interact with frequency to influ-ence the estimates of RRP size with the EQ and train methods.Summary plots of estimated RRP size versus stimulus frequencyare shown for a fixed rate of replenishment (R = Ravg = 0.0295) fordifferent p (Fig. 8E; p = 0.1, 0.2, 0.4). For all conditions, higherstimulus frequencies provide better estimates of the RRP size,although each preparation has practical limitations on how rapidlypresynaptic axons can be reliably stimulated (see Section 4).Changing p has a large influence on RRPtrain. For 100 Hz stimu-lation, p = 0.4 yields RRPtrain = 0.920, p = 0.2 yields RRPtrain = 0.803and p = 0.1 yields RRPtrain = 0.591, even though in all cases the N0was set equal to one. When p is below 0.2, there are considerableerrors in estimating the RRP with the train method. Interest-ingly, when R is fixed, the RRPEQ technique is highly resistant tochanges in p in our simulated data (Fig. 8E, blue lines overlapfor p = 0.1, 0.2 and 0.4). As a result, the performance of the EQmethod is much better than the train method when p is less than0.2.
We also assessed the role of changing stimulus frequency underconditions of reduced or enhanced replenishment of the RRP forp = 0.2 (Fig. 8F, R = 0.5Ravg, Ravg, and 2Ravg). We find that both thetrain and EQ methods are sensitive to changes in replenishment, as
146 M.S. Thanawala, W.G. Regehr / Journal of Neuroscience Methods 264 (2016) 136–152
Fig. 6. Effect of changing p on estimates of RRP size. (A–C) Simulations were performed with N0 = 1, R = 0.01 and p = 0.4, 0.2, 0.1, or 0.05. (A) EPSC amplitudes are plotted as afunction of stimulus number for the first 15 stimuli. (B) The final 15 points of the cumulative EPSC were fit with a line and back-extrapolated to the y-axis to estimate RRPtrain.(C) The first four EPSCs were fit with a line and extrapolated to the x-axis to estimate RRPEQ. (D) Simulations were run as in A–C (N0 = 1, R = 0.01) but for a more completer red cuw
wbRHmrRaR
Ffvo
ange of values of p. RRP estimate as a function of frequency for the train method (ith a dashed black line.
ould be expected from the results shown in Fig. 7. At 100 Hz, dou-ling the replenishment rate reduces RRPtrain considerably (Ravg:RPtrain = 0.803, red curve; 2Ravg: RRPtrain = 0.667, light red curve).alving the replenishment rate improves the ability of the RRPtrainethod to accurately assess RRP size (0.5Ravg: RRPtrain = 0.890, dark
ed curve). Doubling the replenishment rate increases RRPEQ (Ravg:RPEQ = 1.061, blue curve; 2Ravg: RRPEQ = 1.126, light blue curve),nd halving it improves the RRPEQ estimate of RRP size (0.5Ravg:RPtrain = 1.030, dark blue curve).
ig. 7. Effect of changing replenishment rate on the estimated RRP size. (A) Simulations wrom 0.001 to 0.1. The last 15 points of cumulative EPSCs were fit with a line and backeersus cumulative EPSC are shown. Linear fits to the first four points of each curve are extef replenishment rate for two methods of RRP estimation: RRPtrain (red) and RRPEQ (blue)
rve) and EQ method (blue line). The actual pool size is equal to one and indicated
The summaries in Fig. 8E and F indicate how stimulus fre-quency, the probability of release, and replenishment can togetherinfluence the performance of the EQ and train methods. The trainmethod, which is the most widely used method to quantify RRP, sig-nificantly underestimates RRP when p is low, when replenishment
is rapid, and when the stimulus frequency is low. The performanceof the EQ method is in general superior to the train method in that itis less sensitive to changes in p, but considerably overestimates RRPwhen the frequency is low and replenishment is high. Additionally,ere performed using the variables N0, p, and R values of {1, 0.2, R}, where R variesxtrapolated to x = 0 to measure RRPtrain. (B) Plots of the simulated EPSC amplitudended to y = 0, indicating the value of RRPEQ. (C) The measured pool size as a function. The actual RRP size is equal to one (dotted black line).
M.S. Thanawala, W.G. Regehr / Journal of Neuroscience Methods 264 (2016) 136–152 147
Fig. 8. Effect of changing stimulus frequency on the estimated RRP size. Simulations were performed using the variables N0, p, and R values of {1, 0.2, R}. The value of R waschanged to simulate firing at different frequencies, and was determined from our characterization of recovery from depression (see text for details). The frequencies shown are20 Hz, 40 Hz, 100 Hz, and 300 Hz. (A) EPSC amplitude (normalized to RRP size) versus time shown for simulations at different frequencies. (B) Plots of EPSC size (norm. to RRPsize) versus stimulus number. (C) The last 15 points of cumulative EPSCs were fit with a line and backextrapolated to x = 0 to measure RRPtrain. (D) Plots of the simulated EPSCamplitude versus cumulative EPSC are shown. Linear fits to the first four points of each curve are extended to y = 0, indicating the value of RRPEQ. (E) The measured pool sizeas a function of frequency for two methods of RRP estimation: RRPtrain (red) and RRPEQ (blue) for different values of p. The actual RRP size is equal to one (dashed black line).(F) The measured pool size as a function of frequency as shown before for different replenishment rates (Ravg = 0.0295). The actual RRP size is equal to one (dotted black line).
1 f Neur
tve
cwsiitwoNaasccmteile
4
4m
tftdpiuhvwqrotwmt
cmdpmvoSf(weegdv
48 M.S. Thanawala, W.G. Regehr / Journal o
he presence of substantial facilitation, as at other synapses or atery low p conditions at the calyx of Held, will also compromise EQstimates.
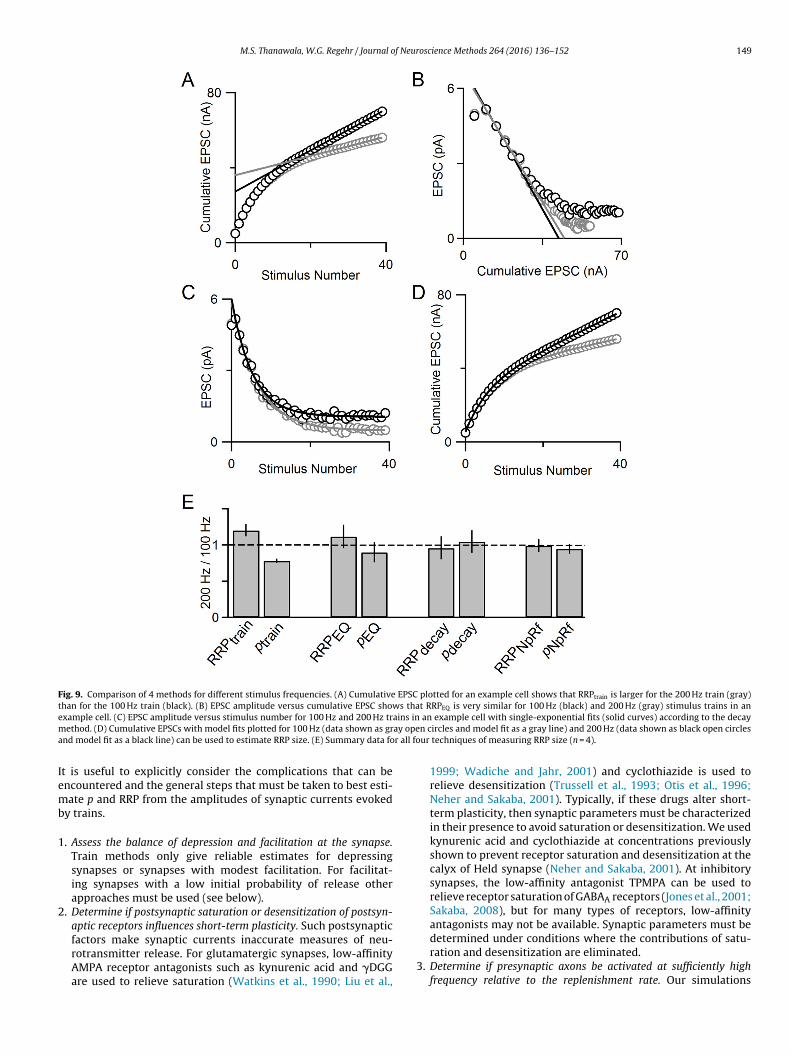
In light of these simulations, we analyzed experimental dataollected at 100 Hz and 200 Hz with our four techniques. Here,e show an example cell with the train technique applied, and
ee that the estimate of RRP is larger for 200 Hz stimulation thant is for 100 Hz stimulation (Fig. 9A). This could either reflect anncrease in the number of vesicles that are readily released whenhe stimulus frequency is elevated, or it could reflect a problemith the estimate of the RRP that is suggested by the simulations
f Fig. 8. We also used the EQ method, the decay method and thepRf model to estimate RRP size at 100 Hz and 200 Hz (Fig. 9B–D)nd found only small differences in estimates of RRP size and pt the different stimulus frequencies. Our summary data (Fig. 9E)hows that the train method reports differences in RRP size, andonsequently, differences in p, for different stimulus frequencies. Inontrast, the EQ method, decay method, and NpRf model all reportore similar values for RRP size and p at 100 Hz and 200 Hz, with
he NpRf and decay methods reporting the least difference. Thesexperimental results align with the predictions of the simulationsn Fig. 8, and suggest that the use of multiple approaches to ana-yze responses evoked by trains provides a more robust means ofstimating synaptic parameters.
. Discussion
.1. Assessment of the NpRf model in comparison to three otherethods
Our goal was to determine the best way to accurately measurehe size of the RRP and p using stimulus trains. We characterizedour independent methods at the calyx of Held synapse and findhat for p > 0.4, all exhibit remarkable agreement, providing confi-ence in the values we obtain. The estimates began to diverge for< 0.4, warranting further analysis of these methods. We began by
nvestigating the train and EQ methods, which are the most widelysed methods used to analyze action potential-evoked release atigh p synapses. A comparison of postsynaptic responses from indi-idual cells shows that RRPEQ is consistently greater than RRPtrainhen p < 0.4 (Fig. 2). Our simulations suggest that this is a conse-
uence of the different assumptions each method makes regardingeplenishment. While the EQ method does not subtract any releasef newly replenished vesicles from its estimation of RRP size, therain method subtracts a maximal level of replenishment. Thisould lead to a systematic overestimation of RRP size by the EQethod and underestimation by the train method, which is consis-
ent with our results.To deepen our understanding of synaptic parameters at the
alyx of Held, we also applied the decay method to directly esti-ate p. The observation that single-exponential functions fit our
ata very well (Fig. 3C) suggests that a 100 Hz train of actionotentials primarily liberates a pool of vesicles that have approxi-ately the same p. Although previous studies found that prolonged
oltage steps liberated two components of release at the calyxf Held (Sakaba and Neher, 2001a, 2001b; Wölfel et al., 2007;chneggenburger et al., 2012), recent work suggests that a singleast pool is likely responsible for action potential-evoked releaseChen et al., 2015). The decay method yields excellent agreementith both the train and EQ methods for p > 0.4, and this can be
xtended by correcting for facilitation to extend its range. How-
ver, for p < 0.2, pdecay tends to be lower than ptrain and considerablyreater than pEQ (Fig. 3G, H), and the decay method estimatesiverge from train and EQ estimates even more substantially atery low p (Fig. 3I, J).oscience Methods 264 (2016) 136–152
Encouraged by the results of the decay method, we developedand applied a simple model that implements depletion of theRRP with a more accurate description of replenishment in whichrefilling of the RRP proceeds with a constant rate per availablerelease site. The number of available release sites increases duringthe beginning of an action potential train as the RRP is depleted,and eventually stabilizes at a steady-state value. We deliberatelykept the model very simple, which was possible for our goal ofstudying synchronous, evoked release of neurotransmitter inresponse to a regular, high-frequency train stimuli. We kept thenumber of parameters small and did not incorporate physicalmodels of the presynaptic machinery (Meinrenken et al., 2002;Pan and Zucker, 2009) that require many parameters to account foractive zone size, the location and density of calcium channels, theconcentration and binding properties of calcium buffers, as wellas parameters to describe vesicle pools with different propertiesand calcium-dependent recovery from depression (Dittman andRegehr, 1998; Dittman et al., 2000; Yang and Xu-Friedman, 2008;Hallermann et al., 2010).
We found that the NpRf model very cleanly fit the data we havecollected in a variety of pharmacological and external calcium con-ditions (Figs. 4 and 5). RRPNpRf, RRPtrain, RRPEQ, and RRPdecay are allin agreement when p is high, but when p is low RRPNpRf is typicallygreater than RRPtrain and RRPdecay but less than RRPEQ (Fig. 5). Thisis consistent with the prediction that the different methods’ cor-rections for replenishment will lead RRPtrain to underestimate RRPand RRPEQ to overestimate it, and suggests that RRPNpRf can pro-vide a more reliable means of estimating RRP and p. RRPNpRf alsodiffers from RRPdecay, especially for low p, suggesting that account-ing for a variable rate of replenishment significantly affects the NpRfmethod’s estimates of p and RRP size.
It is also possible that in addition to the component of releasedescribed by the train methods, there could also be a componentof release with a much lower p (Müller et al., 2010). Such a compo-nent of release may not play a large role in determining the rapidresponses to the onset of a train stimulus, but could be importantfor sustaining release during prolonged high-frequency stimulationthat can occur under physiological conditions.
It is likely that other methods to determine the size ofthe RRP, such as using large voltage steps or high osmolar-ity (Schneggenburger et al., 2002; Zucker and Regehr, 2002;Schneggenburger and Neher, 2005), liberate pools of vesiclesthat do not make substantial contributions to release evoked byhigh-frequency stimulation. Different pools of vesicles evoked bylarge voltage steps have been identified, but it has been difficultto relate such pools to different aspects of action potential-evokedrelease. Using high osmolarity and large voltage step methodsdoes not discriminate between high p and low p components ofrelease; instead, they simply compute average p. These methodsmay even liberate vesicles that cannot be liberated by actionpotentials. This may provide an incomplete view of release. Forexample, a neuromodulator could increase the size of the high ppool by transforming low p sites into high p sites. Train methodswould detect an increase in RRP and no change in p, but step andhigh-osmolarity measurements would detect no change in RRPand would conclude that p increased. This points out potentialchallenges in relating estimates of p and RRP size based on differentapproaches and highlights the difficulty in defining the RRP.
4.2. Step by step approach to determine synaptic parametersusing stimulus trains
The approach we took to evaluate the performance of EQ andtrain methods is a best-case scenario at a close-to-ideal high psynapse, the calyx of Held. There are many challenges that can fur-ther affect the performance of these methods at other synapses.
M.S. Thanawala, W.G. Regehr / Journal of Neuroscience Methods 264 (2016) 136–152 149
Fig. 9. Comparison of 4 methods for different stimulus frequencies. (A) Cumulative EPSC plotted for an example cell shows that RRPtrain is larger for the 200 Hz train (gray)than for the 100 Hz train (black). (B) EPSC amplitude versus cumulative EPSC shows that RRPEQ is very similar for 100 Hz (black) and 200 Hz (gray) stimulus trains in ane ains inm ay opea r all fo
Iemb
1
2
xample cell. (C) EPSC amplitude versus stimulus number for 100 Hz and 200 Hz trethod. (D) Cumulative EPSCs with model fits plotted for 100 Hz (data shown as gr
nd model fit as a black line) can be used to estimate RRP size. (E) Summary data fo
t is useful to explicitly consider the complications that can bencountered and the general steps that must be taken to best esti-ate p and RRP from the amplitudes of synaptic currents evoked
y trains.
. Assess the balance of depression and facilitation at the synapse.Train methods only give reliable estimates for depressingsynapses or synapses with modest facilitation. For facilitat-ing synapses with a low initial probability of release otherapproaches must be used (see below).
. Determine if postsynaptic saturation or desensitization of postsyn-aptic receptors influences short-term plasticity. Such postsynaptic
factors make synaptic currents inaccurate measures of neu-rotransmitter release. For glutamatergic synapses, low-affinityAMPA receptor antagonists such as kynurenic acid and �DGGare used to relieve saturation (Watkins et al., 1990; Liu et al.,an example cell with single-exponential fits (solid curves) according to the decayn circles and model fit as a gray line) and 200 Hz (data shown as black open circlesur techniques of measuring RRP size (n = 4).
1999; Wadiche and Jahr, 2001) and cyclothiazide is used torelieve desensitization (Trussell et al., 1993; Otis et al., 1996;Neher and Sakaba, 2001). Typically, if these drugs alter short-term plasticity, then synaptic parameters must be characterizedin their presence to avoid saturation or desensitization. We usedkynurenic acid and cyclothiazide at concentrations previouslyshown to prevent receptor saturation and desensitization at thecalyx of Held synapse (Neher and Sakaba, 2001). At inhibitorysynapses, the low-affinity antagonist TPMPA can be used torelieve receptor saturation of GABAA receptors (Jones et al., 2001;Sakaba, 2008), but for many types of receptors, low-affinityantagonists may not be available. Synaptic parameters must be
determined under conditions where the contributions of satu-ration and desensitization are eliminated.3. Determine if presynaptic axons be activated at sufficiently highfrequency relative to the replenishment rate. Our simulations
1 f Neur
4
5
50 M.S. Thanawala, W.G. Regehr / Journal o
indicate that it is possible to more reliably estimate synapticparameters when the firing frequency is fast relative to the rateof replenishment (Figs. 7 and 8). For the train method, recentmodeling suggests that postsynaptic responses must depressby at least 60% to obtain reliable estimate synaptic parameters(Neher, 2015). Our simulations and experimental findings sug-gest that the performance of train methods can be substantiallydegraded even when the steady-state responses are depressedby 80% (Fig. 7). There is a limit to how rapidly presynaptic fiberscan be reliably activated. For the calyx of Held, which fires at leastup to 300 Hz in adult mice (Borst and Soria van Hoeve, 2012),the capacity of presynaptic axons to fire in slice experimentsis highly age- and temperature-dependent. In our experience,calyces of Held in tissue from mice aged P11–14 can be reli-ably stimulated at frequencies up to 100–200 Hz at 25 ◦C, and at300 Hz or higher at 34 ◦C. It may be possible to stimulate evenmore rapidly in older animals at high temperature. It is impor-tant to realize that performing experiments at high temperaturein older animals to allow more rapid stimulation may not pro-vide a better estimate of pool size, because replenishment maybe more rapid at physiological temperature in older animals.
. Accurately measure the amplitude of synaptic currents in responseto high-frequency stimulation. For a given data set, individualrecordings must be evaluated to ensure that automatic quan-tification of postsynaptic current amplitudes (PSC) is beingperformed accurately. Slight inaccuracies can obscure the actualdynamics of RRP depletion and recovery. The baseline currentmust be subtracted from the peak of the PSC. Moreover, if PSCsdecay slowly, such that the decay is longer than the interstimu-lus interval of the stimulus train, this must be accounted for inquantifying PSC amplitude. A single or double exponential fit tothe decay of the previous PSC should be obtained and subtractedfrom the following PSC in order to measure its amplitude.
. Determine if EPSC amplitudes during high-frequency trains are pri-marily determined by depletion of a single pool of vesicles with auniform probability of release. The EQ method, the decay method,and the NpRf method all rely on p remaining constant throughouta stimulus train after an initial facilitation and on depletion dom-inating the decrement of synaptic responses during the train.The train method does not require constant p, but does requiredepletion of the RRP by rapid stimulation. Although depletion ofthe RRP accounts for depression at many synapses, this is not thecase for all synapses. Also, for many low p synapses, p increasesduring stimulus trains as a result of synaptic facilitation, whichwill pose problems in the measurement of RRP. The EQ method,the decay method and the NpRf method all require release to bemediated by a single pool of vesicles with uniform p. There isconsiderable evidence that release sites from the same presy-naptic active zone can have different probabilities of release.At the calyx of Held, numerous studies have reported the exis-tence of a fast-releasing pool (FRP) and slow-releasing pool (SRP)which are elicited by presynaptic voltage steps and presynapticcaged calcium experiments (Sakaba and Neher, 2001a; Wölfelet al., 2007). We found that despite evidence that there are dif-ferent pools of vesicles with different properties when releaseis evoked by non-AP stimuli, there was not a clear indicationof a fast and slow component to the pool of vesicles releasedby high-frequency APs. This contrasts with studies performed atthis synapse at lower frequencies (Trommershäuser et al., 2003).Plots of the EPSC amplitude as a function of stimulus number(as in Fig. 3C) could be fit well with a single-exponential func-tion, indicating that release is dominated by a pool of vesicles
with an approximately uniform p. This cannot rule out the pos-sibility that there is a contribution of a second, slower pool toAP-evoked release, as suggested by others, but does give us con-fidence that a slower pool does not make a large contributionoscience Methods 264 (2016) 136–152
under the experimental conditions applied here. This is a veryimportant point for researchers who may apply these techniquesto a given synapse—if AP-evoked release appears to be driven bymultiple vesicle pools with different release probabilities, thenthe EQ and decay methods would give erroneous estimates ofsynaptic parameters that would differ considerably from esti-mates based on the train method. It is expected that the trainand EQ methods will determine the size of the RRP and proba-bility of release, and are likely to significantly underestimate thetrue size of the RRP if there are multiple pools or heterogeneousrelease probabilities.
6. Determine if responses reach a true steady state after prolongedstimulation. The train method relies on release reaching a steady-state value, and if this is not the case it will not provide a reliableestimate of RRP size. We have found that this is the case at thecalyx of Held synapse on the relatively short time scale of ourexperiments. This is not always the case at other synapses. Onefactor that could prevent the attainment of a steady state wouldbe if stimulation began to deplete the reserve pool, which wouldin turn reduce replenishment of the RRP during sustained acti-vation. It is also possible that a pool with a very low probabilityof release would only very gradually deplete and prevent steadystate from being attained. If the EPSC amplitude does not stabi-lize at a steady value, then it is not possible to apply the trainmethod to determine the size of the RRP.
7. Compare the estimates of the 4 different methods. If the condi-tions of the different methods are not satisfied then they cannotbe applied. A comparison of the different methods that can beapplied provides a powerful means to evaluate the various esti-mates because they are based on different assumptions. Goodagreement between the different methods, as is predicted to bethe case when the initial p is high, will validate the estimates. If pis moderate to low then disagreements between the methods areexpected, but the differences should conform to the predictionsof the simulations present here and the NpRf model should pro-vide a good estimate. This comprehensive approach will provideinsight into the synapse and will extract as much information aspossible from responses evoked by stimulus trains.
4.3. Stochastic variability and estimates of synaptic parameters
Stochastic variability in synaptic strength differentially influ-ences the ability of each method to estimate synaptic parameters.For example, the EQ method, which is based on a linear fit to justfour data points, seems to be particularly sensitive to stochasticvariability. It is also possible that noise could systematically biasestimates of synaptic parameters and contribute to the differencesin estimates of synaptic strength made with different approaches.For the large calyx of Held synapses we study, it appears thatestimates of different methods conform to predictions based onmodels of synaptic strength. However, variability in synapticresponses become increasingly important for smaller synapsesconsisting of fewer release sites and the train methods describedhere become ineffective.
Approaches based on quantal analysis, such as variance-meananalysis and multiple probability fluctuation analysis (MPFA)provide a powerful alternative approach that can be used to charac-terize low p synapses or synapses with few release sites (Redman,1990; Bekkers, 1994; Silver et al., 1998; Reid and Clements,1999; Bennett and Kearns, 2000; Meyer et al., 2001; Neher andSakaba, 2001; Silver, 2003; Foster and Regehr, 2004). These meth-ods require low-frequency repetitive activation of synapses and
use fluctuations in the amplitudes of the resulting postsynapticresponses to determine N0, p, and q. These quantal approaches arechallenging to apply because they require many trials from at leastthree different release probability conditions (typically different
f Neur
enttataatve
tbmmpc2
httctopovotrt
A
mNa
A
t0
R
A
B
B
B
C
C
D
M.S. Thanawala, W.G. Regehr / Journal o
xternal calcium concentrations) and very stable, high signal-to-oise recordings. Moreover, pharmacological agents must be usedo eliminate postsynaptic receptor saturation and desensitizationo accurately estimate synaptic parameters. Nonetheless, quantalpproaches may be the methods of choice for estimating synap-ic parameters at non-depressing or facilitating synapses. Thesere likely preferable to using a high-frequency approach withrtificially elevated Cae to increase p and deplete the RRP. Substan-ial elevation of external calcium may trigger non-physiologicalesicular release, primarily due to artificial temporal and spatialnlargement of calcium nano- or micro-domains at the active zone.
We hope that this analysis of existing methods and the presen-ation of a simple model (NpRf method) at the calyx of Held cane useful to investigators when considering the best way to esti-ate the values of synaptic parameters such as N0, p, and R. Theseethods may also be applicable to other depressing synapses with
rominent depletion, such as the endbulb of Held and neuromus-ular junction (Elmqvist and Quastel, 1965; Yang and Xu-Friedman,008).
The choice of methods to analyze data from a given synapse canave important implications for our ability to understand synap-ic transmission. As shown by simulations in Figs. 6–8, using therain or EQ method below p < 0.2 under our conditions can lead tohanges in p, R, or firing frequency as being inaccurately attributedo changes in N0. For the train and EQ methods, incorrect estimatesf RRP size will have a direct consequence of making estimates ofinaccurate as well. This is much more important than an issue
f semantics—different molecules and plasticity regimes regulatearious aspects of synaptic transmission, and in many cases shouldnly change N0 or p. If investigators use appropriate methodso analyze genetic mutants, pharmacological agents, or plasticityegimes, the findings can direct follow-up studies to characterizehe mechanism or locus of action.
cknowledgments
We thank members of the Regehr laboratory for their com-ents on this manuscript. This work was supported by NIH grantS032405 to WGR and NIH grant F31 NS073252 to MST. Theuthors declare no competing financial interests.
ppendix A. Supplementary data
Supplementary data associated with this article can be found, inhe online version, at http://dx.doi.org/10.1016/j.jneumeth.2016.2.021.
eferences
bbott ALF, Varela JA, Sen K, Nelson SB. Synaptic depression and cortical gain control.Science 1997;275(5297):220–4.
ekkers JM. Quantal analysis of synaptic transmission in the central nervous system.Curr. Opin. Neurobiol 1994;4(June (3)):360–5, Available from: http://www.ncbi.nlm.nih.gov/pubmed/7919931 (accessed 29.01.16).
ennett MR, Kearns JL. Statistics of transmitter release at nerve terminals. Prog. Neu-robiol 2000;60(April (6)):545–606, Available from: http://www.sciencedirect.com/science/article/pii/S0301008299000404 (accessed 02.02.16).
orst JGG, Soria van Hoeve J. The calyx of held synapse: from model synapse toauditory relay. Annu. Rev. Physiol 2012;74(January):199–224, Available from:http://www.ncbi.nlm.nih.gov/pubmed/22035348 (accessed 21.03.14).
artling B. Control of neural information transmission by synaptic dynamics. J. Theor.Biol 2002;214(January (2)):275–92, Available from: http://www.ncbi.nlm.nih.gov/pubmed/11812178 (accessed 21.01.14).
hen Z, Das B, Nakamura Y, DiGregorio DA, Young SM. Ca2+ channel to synapticvesicle distance accounts for the readily releasable pool kinetics at a func-
tionally mature auditory synapse. J. Neurosci 2015;35(February (5)):2083–100,Available from: http://www.jneurosci.org/content/35/5/2083.short (accessed10.02.15).ittman JS, Kreitzer AC, Regehr WG. Interplay between facilitation, depres-sion, and residual calcium at three presynaptic terminals. J. Neurosci
oscience Methods 264 (2016) 136–152 151
2000;20(February (4)):1374–85, Available from: http://www.ncbi.nlm.nih.gov/pubmed/10662828.
Dittman JS, Regehr WG. Calcium dependence and recovery kinetics of presy-naptic depression at the climbing fiber to Purkinje cell synapse. J. Neurosci1998;18(August (16)):6147–62, Available from: http://www.ncbi.nlm.nih.gov/pubmed/9698309.
Dobrunz LE, Stevens CF. Heterogeneity of release probability, facilitation, and deple-tion at central synapses. Neuron 1997;18(June (6)):995–1008, Available from:http://www.ncbi.nlm.nih.gov/pubmed/9208866.
Elmqvist BYD, Quastel DMJ. A quantitave study of end-plate potentials in isolatedhuman muscle. J. Physiol 1965;178:505–29.
Fioravante D, Chu Y, Myoga MH, Leitges M, Regehr WG. Calcium-dependent isoformsof protein kinase C mediate posttetanic potentiation at the calyx of Held. Neuron2011;70(June (5)):1005–19, Available from: http://www.pubmedcentral.nih.gov/articlerender.fcgi?artid=3113702&tool=pmcentrez&rendertype=Abstract(accessed 26.09.13).
Foster KA, Regehr WG. Variance-mean analysis in the presence of a rapid antagonistindicates vesicle depletion underlies depression at the climbing fiber synapse.Neuron 2004;43(July (1)):119–31, Available from: http://www.sciencedirect.com/science/article/pii/S0896627304003903 (accessed 13.08.14).
Gavino MA, Ford KJ, Archila S, Davis GW. Homeostatic synaptic depression isachieved through a regulated decrease in presynaptic calcium channel abun-dance. Elife 2015;4(April), Available from: http://www.pubmedcentral.nih.gov/articlerender.fcgi?artid=4443758&tool=pmcentrez&rendertype=Abstract(accessed 20.04.15).
Hallermann S, Heckmann M, Kittel RJ. Mechanisms of short-term plasticity at neu-romuscular active zones of Drosophila. HFSP J 2010;4(2):72–84.
Hennig MH. Theoretical models of synaptic short term plasticity. Front. Comput.Neurosci 2013;7(April):45, Available from: http://www.pubmedcentral.nih.gov/articlerender.fcgi?artid=3630333&tool=pmcentrez&rendertype=Abstract.
Hosoi N, Sakaba T, Neher E. Quantitative analysis of calcium-dependent vesiclerecruitment and its functional role at the calyx of Held synapse. J. Neurosci2007;27(December (52)):14286–98, Available from: http://www.ncbi.nlm.nih.gov/pubmed/18160636 (accessed 05.02.14).
Iwasaki S, Takahashi T. Rapid Report. Developmental changes in calcium chan-nel types mediating synaptic transmission in rat auditory brainstem. J. Physiol1998;509(2):419–23.
Jones MV, Jonas P, Sahara Y, Westbrook GL. Microscopic kinetics andenergetics distinguish GABA(A) receptor agonists from antagonists. Bio-phys. J 2001;81(5):2660–70, Available from: http://dx.doi.org/10.1016/S0006-3495(01)75909-7.
Kusano K, Landau EM. Depression and recovery of transmission atthe squid giant synapse. J. Physiol 1975;245(February (1)):13–32,Available from: http://www.pubmedcentral.nih.gov/articlerender.fcgi?artid=1330842&tool=pmcentrez&rendertype=Abstract (accessed01.04.14).
Liley AW, North KAK. An electrical investigation of effects of repetitive stimulationon mammalian neuromuscular junction. J. Neurophysiol 1953;16(September(5)):509–27, Available from: http://jn.physiology.org.ezp-prod1.hul.harvard.edu/content/16/5/509 (accessed 12.03.14).
Liu G, Choi S, Tsien RW. Variability of neurotransmitter concentration and nonsatu-ration of postsynaptic AMPA receptors at synapses in hippocampal cultures andslices. Neuron 1999;22(2):395–409.
Liu H, Bai H, Hui E, Yang L, Evans CS, Wang Z, et al. Synaptotagmin7 functions as a Ca2+-sensor for synaptic vesicle replenishment. Elife2014;3(January):e01524, Available from: http://www.ncbi.nlm.nih.gov/pmc/articles/PMC3930910/?report=Abstract (accessed 26.03.14).
Meinrenken CJ, Borst JGG, Sakmann B. Calcium secretion coupling at calyxof held governed by nonuniform channel-vesicle topography. J. Neurosci2002;22(March (5)):1648–67, Available from: http://www.ncbi.nlm.nih.gov/pubmed/11880495.
Meyer AC, Neher E, Schneggenburger R. Estimation of quantal size and numberof functional active zones at the calyx of Held synapse by nonstation-ary EPSC variance analysis. J. Neurosci 2001;21(October (20)):7889–900,Available from: http://www.jneurosci.org.ezp-prod1.hul.harvard.edu/content/21/20/7889.long (accessed 29.01.16).
Moulder KL, Mennerick S. Reluctant vesicles contribute to the total read-ily releasable pool in glutamatergic hippocampal neurons. J. Neurosci2005;25(April (15)):3842–50, Available from: http://www.ncbi.nlm.nih.gov/pubmed/15829636 (accessed 15.11.13).
Müller M, Genc Ö, Davis GW. RIM-binding protein links synaptic homeostasis tothe stabilization and replenishment of high release probability vesicles. Neuron2015;85(February (5)):1056–69, Available from: http://www.ncbi.nlm.nih.gov/pubmed/25704950 (accessed 23.02.15).
Müller M, Goutman JD, Kochubey O, Schneggenburger R. Interaction between facili-tation and depression at a large CNS synapse reveals mechanisms of short-termplasticity. J. Neurosci 2010;30(6):2007–16.
Neher E. Merits and limitations of vesicle pool models in view of het-erogeneous populations of synaptic vesicles. Neuron 2015;87(September(6)):1131–42, Available from: http://www.sciencedirect.com/science/article/pii/S0896627315007564 (accessed 28.09.15).
Neher E, Sakaba T. Combining deconvolution and noise analysis for the estimationof transmitter release rates at the calyx of held. J. Neurosci 2001;21(January(2)):444–61, Available from: http://www.ncbi.nlm.nih.gov/pubmed/11160425.
Neher E, Sakaba T. Multiple roles of calcium ions in the regulation of neu-rotransmitter release. Neuron 2008;59(September (6)):861–72, Available

1 f Neur
O
P
R
R
R
S
S
S
S
S
S
S
S
S
S
S
S
S
S
Membr. Biol 1996;151(May (1)):77–90, Available from: http://link.springer.
52 M.S. Thanawala, W.G. Regehr / Journal o
from: http://www.sciencedirect.com/science/article/pii/S0896627308007423(accessed 17.06.15).
tis T, Zhang S, Trussell LO. Direct measurement of AMPA receptor desen-sitization induced by glutamatergic synaptic transmission. J. Neurosci1996;16(December (23)):7496–504, Available from: http://www.jneurosci.org.ezp-prod1.hul.harvard.edu/content/16/23/7496.long (accessed 16.02.16).
an B, Zucker RS. A general model of synaptic transmission and short-term plasticity.Neuron 2009;62(4):539–54, http://dx.doi.org/10.1016/j.neuron.2009.03.025.
edman S. Quantal analysis of synaptic potentials in neurons of the central nervoussystem. Physiol. Rev 1990;70(January (1)):165–98, Available from: http://www.ncbi.nlm.nih.gov/pubmed/2404288 (accessed 02.02.16).
eid CA, Clements JD. Postsynaptic expression of long-term potentiation in the ratdentate gyrus demonstrated by variance-mean analysis. J. Physiol 1999;518(July(1)):121–30, Available from: http://doi.wiley.com/10.1111/j.1469-7793.1999.0121r.x (accessed 29.01.16).
uiz R, Cano R, Casanas JJ, Gaffield MA, Betz WJ, Tabares L. Active zonesand the readily releasable pool of synaptic vesicles at the neuromuscularjunction of the mouse. J. Neurosci 2011;31(February (6)):2000–8, Avail-able from: http://www.jneurosci.org.ezp-prod1.hul.harvard.edu/content/31/6/2000.long (accessed 19.07.15).
akaba T. Roles of the fast-releasing and the slowly releasing vesicles in synap-tic transmission at the calyx of Held. J. Neurosci 2006;26(May (22)):5863–71,Available from: http://www.jneurosci.org.ezp-prod1.hul.harvard.edu/content/26/22/5863.long (accessed 22.07.15).
akaba T. Two Ca2+-dependent steps controlling synaptic vesicle fusion and replen-ishment at the cerebellar basket cell terminal. Neuron 2008;57(3):406–19.
akaba T, Neher E. Calmodulin mediates rapid recruitment of fast-releasing synap-tic vesicles at a calyx-type synapse. Neuron 2001a;32(December (6)):1119–31,Available from: http://www.ncbi.nlm.nih.gov/pubmed/11754842.
akaba T, Neher E. Quantitative relationship between transmitter release andcalcium current at the calyx of held synapse. J. Neurosci 2001b;21(January(2)):462–76, Available from: http://www.ncbi.nlm.nih.gov/pubmed/11160426.
chneggenburger R, Han Y, Kochubey O. Ca2+ channels and transmitter releaseat the active zone. Cell Calcium 2012;52(January (3–4)):199–207, Availablefrom: http://www.sciencedirect.com/science/article/pii/S0143416012000814(accessed 18.02.14).
chneggenburger R, Meyer AC, Neher E. Released fraction and total size of apool of immediately available transmitter quanta at a calyx synapse. Neu-ron 1999;23(June (2)):399–409, Available from: http://www.ncbi.nlm.nih.gov/pubmed/10399944.
chneggenburger R, Neher E. Presynaptic calcium and control of vesicle fusion. Curr.Opin. Neurobiol 2005;15(June (3)):266–74, Available from: http://www.ncbi.nlm.nih.gov/pubmed/15919191 (accessed 16.09.13).
chneggenburger R, Sakaba T, Neher E. Vesicle pools and short-term synap-tic depression: lessons from a large synapse. Trends Neurosci 2002;25(April(4)):206–12, Available from: http://www.ncbi.nlm.nih.gov/pubmed/11998689.
chneider T, Wei X, Olcese R, Costantin J, Neely A, Palade P, et al. Molecular analysisand functional expression of the human type E neuronal Ca2+ channel alpha 1subunit. Recept. Channels 1994;2(4):255–70.
ilver RA. Estimation of nonuniform quantal parameters with multiple-probabilityfluctuation analysis: theory, application and limitations. J. Neurosci. Methods2003;130(December (2)):127–41, Available from: http://www.sciencedirect.com/science/article/pii/S0165027003003170 (accessed 27.01.16).
ilver RA, Momiyama A, Cull-Candy SG. Locus of frequency-dependent depressionidentified with multiple-probability fluctuation analysis at rat climbing fibre-Purkinje cell synapses. J. Physiol 1998;510(August (3)):881–902, Available from:http://doi.wiley.com/10.1111/j.1469-7793.1998.881bj.x (accessed 27.01.16).
oong TW, Stea A, Hodson CD, Dubel SJ, Vincent SR, Snutch TP. Structure and func-tional expression of a member of the low voltage-activated calcium channelfamily. Science 1993;260:1133–6.
rinivasan G, Kim JH, von Gersdorff H. The pool of fast releasing vesicles is aug-
mented by myosin light chain kinase inhibition at the calyx of Held synapse. J.Neurophysiol 2008;99(April (4)):1810–24, Available from: http://jn.physiology.org.ezp-prod1.hul.harvard.edu/content/99/4/1810.long (accessed 22.07.15).tevens CF, Williams JH. Discharge of the readily releasable pool withaction potentials at hippocampal synapses. J. Neurophysiol 2007;
oscience Methods 264 (2016) 136–152
98(December (6)):3221–9, Available from: http://www.pubmedcentral.nih.gov/articlerender.fcgi?artid=2201901&tool=pmcentrez&rendertype=Abstract(accessed 05.04.14).
Takahashi T, Kajikawa Y, Tsujimoto T. G-Protein-coupled modulation of presynap-tic calcium currents and transmitter release by a GABA B receptor. J. Neurosci1998;18(9):3138–46.
Taschenberger H, von Gersdorff H. Fine-tuning an auditory synapse for speedand fidelity: developmental changes in presynaptic waveform, EPSC kinetics,and synaptic plasticity. J. Neurosci 2000;20(December (24)):9162–73, Availablefrom: http://www.ncbi.nlm.nih.gov/pubmed/11124994.
Thanawala MS, Regehr WG. Presynaptic calcium influx controls neuro-transmitter release in part by regulating the effective size of thereadily releasable pool. J. Neurosci 2013;33(March (11)):4625–33,Available from: http://www.pubmedcentral.nih.gov/articlerender.fcgi?artid=3711668&tool=pmcentrez&rendertype=Abstract (accessed26.05.14).
Trommershäuser J, Schneggenburger R, Zippelius A, Neher E. Heterogeneouspresynaptic release probabilities: functional relevance for short-term plas-ticity. Biophys. J 2003;84(March (3)):1563–79, Available from: http://www.sciencedirect.com/science/article/pii/S0006349503749674 (accessed 06.02.14).
Trussell LO, Zhang S, Ramant IM. Desensitization of AMPA receptors upon multi-quantal neurotransmitter release. Neuron 1993;10(June (6)):1185–96, Availablefrom: http://www.sciencedirect.com/science/article/pii/089662739390066Z(accessed 06.02.16).
Tsodyks MV, Markram H. The neural code between neocortical pyramidal neuronsdepends on neurotransmitter release probability. Proc. Natl. Acad. Sci. U. S.A 1997;94(January (2)):719–23, Available from: http://www.pubmedcentral.nih.gov/articlerender.fcgi?artid=19580&tool=pmcentrez&rendertype=Abstract(accessed 05.04.14).
Wadiche JI, Jahr CE. Multivesicular release at climbing fiber-purkinje cellsynapses. Neuron 2001;32(October (2)):301–13, Available from: http://www.sciencedirect.com/science/article/pii/S0896627301004883 (accessed 13.08.14).
Wang LY, Kaczmarek LK. High-frequency firing helps replenish the readily releasablepool of synaptic vesicles. Nature 1998;394(July (6691)):384–8, Available from:http://www.ncbi.nlm.nih.gov/pubmed/9690475.
Watkins JC, Pook PC, Sunter DC, Davies J, Honore T. Experiments with kainate andquisqualate agonists and antagonists in relation to the sub-classification of“non-NMDA” receptors. Adv. Exp. Med. Biol 1990;268(January):49–55, Availablefrom: http://www.ncbi.nlm.nih.gov/pubmed/1963751 (accessed 22.01.16).
Wesseling JF, Lo DC. Limit on the role of activity in controlling the release-ready sup-ply of synaptic vesicles. J. Neurosci 2002;22(November (22)):9708–20, Availablefrom: http://www.ncbi.nlm.nih.gov/pubmed/12427826.
Wölfel M, Lou X, Schneggenburger R. A mechanism intrinsic to the vesicle fusionmachinery determines fast and slow transmitter release at a large CNS synapse.J. Neurosci 2007;27(March (12)):3198–210, Available from: http://www.ncbi.nlm.nih.gov/pubmed/17376981 (accessed 12.02.14).
Wu L-G, Borst JGG. The reduced release probability of releasable vesicles dur-ing recovery from short-term synaptic depression. Neuron 1999;23(August(4)):821–32, Available from: http://www.sciencedirect.com/science/article/pii/S0896627301800398 (accessed 01.04.14).
Wu LG, Borst JGG, Sakmann B. R-type Ca2+ currents evoke transmitter release at arat. J. Neurosci 1998;95(April):4720–5.
Wu LG, Westenbroek RE, Borst JGG, Catterall WA, Sakmann B. Calcium channeltypes with distinct presynaptic localization couple differentially to transmitterrelease in single calyx-type synapses. J. Neurosci 1999;19(January (2)):726–36,Available from: http://www.ncbi.nlm.nih.gov/pubmed/9880593.
Yang H, Xu-Friedman MA. Relative roles of different mechanisms of depression atthe mouse endbulb of Held. J. Neurophysiol 2008;99(5):2510–21.
Zamponi GW, Bourinet E, Snutch TP. Nickel block of a family of neuronal cal-cium channels: subtype- and subunit-dependent action at multiple sites. J.
com/10.1007/s002329900059.Zucker RS, Regehr WG. Short-term synaptic plasticity. Annu. Rev. Phys-
iol 2002;64(January):355–405, Available from: http://www.ncbi.nlm.nih.gov/pubmed/11826273 (accessed 21.01.14).