Determining International Bandwidth Tariffs in Pakistan · PDF fileDetermining International...
56
Determining International Bandwidth Tariffs in Pakistan A Case Study Aasif Inam Pakistan Telecommunication Authority
Transcript of Determining International Bandwidth Tariffs in Pakistan · PDF fileDetermining International...

Determining International Bandwidth Tariffs in Pakistan
A Case Study
Aasif InamPakistan Telecommunication Authority

Legislative Framework
Pakistan Telecommunication (Re-organization) Act 2006
Broadband Policy 2004
Pakistan Telecommunication Rules 2000
Fixed-line Tariff Regulations 2004

Broadband Policy 2004
International IP Bandwidth price is a significant factor in an ISP’s cost.Reducing Int’l IP bandwidth tariffs will enable ISPs to offer better dial up and broadband services at affordable prices.With the increased number of LDI service providers and increased competition in the infrastructure available, it is expected that prices of Int’l IP b/w would reduce.

Market Overview of Int’l Bandwidth
At present, there are only two players which are providing Int’l Bandwidth services:
Pakistan Telecommunication Company Ltd.Transworld Int’l Associates Pvt. Ltd.
Upcoming bandwidth providersMultinet (through IRU on SEA-MEA-WE-4)Wateen Telecom
PTCL, being an incumbent operator holds dominance in provision of Int’l bandwidth

Maps for SEA ME WE – 3 & 4TWA - Map

Maps for SEA ME WE – 3 & 4TWA

Need for Regulation
Internet Service Providers Association of Pakistan (ISPAK) approached PTA and informed that bandwidth tariffs charged by PTCL are exorbitant and therefore require regulator’s intervention.
In addition, a group of investors met the President of Pakistan and contested that the tariff structure of PTCL is discouraging foreign investors to invest in IT Enabled Services in Pakistan.

Initiation of Directives – Post Privatization of PTCL - 2006
Ministry of Information Technology
PTARegulator
Reduce PTCL’sInt’l B/w Tariffs
Policy Directive
regu
late
directed

Deregulation of Pakistan’s Telecom Market
Pakistan Telecommunication sector was liberalized in 2003 with the award of new local loop, long distance international and cellular mobile licenses in 2004PTA prioritized its focus on ensuring:
Smooth Implementation of deregulation and Post deregulation activities LicensingInterconnection Competition
PTCL was privatized in mid 2006 and management control was handed over to Etisalat UAE

PTCL’s Bandwidth Prices (Half Circuit)
PTCL, on its own or under instructions from its Ministry reduced prices of bandwidth.
Authority’s focus remained more towards setting the Domestic Leased Line Circuit Tariffs
343,950Aug. 04
606,000June 02
2515,00001-09-00
3232,32501-01-00
3820,00001-05-00
3,000
47,88356,333
Int’l B/w Charges
US $
24July 06
1501-07-9901-07-98
%Date
Source: PTCL

Consultation ProcessPTA initiated consultation process on Int’l Bandwidth in May 2006
Following countries were referred in order to examine regulatory practices:
IndiaJapan & South KoreaSingapore & Hong Kong
It was observed that there had been major decline in the cost of building submarine cables

Issues / Anomalies in Int’l B/w Tariffs
PTCL had segmented its bandwidth tariffs in terms of voice and data services
PTCL IPLC tariffs for data included domestic leg charges (i.e. DPLC charges) and thus IPLC was available in major cities of the country at the same tariffs whereas PTCL’s IPLC tariffs for voice services were based up to landing point.
Regional countries were not differentiating in terms of data and voice services.
The regional countries were observed to be charging IPLC tariffs up to landing points Thus, it was difficult to compare PTCL’s IPLC tariffs with regional countries.
PTCL’s price multiples for IPLC for data services (E1:DS3:STM1) were 1:14:47 which were substantially higher than competitive International benchmarks

Comparison of Half Circuit IPLC (Data & Voice Service) Tariffs for E-1Capacity
3,950
2,852
0
500
1,000
1,500
2,000
2,500
3,000
3,500
4,000
US $ per
month
ISPs LDI Ops
Incl
udin
g do
mes
tic le
g
Up
to la
ndin
g po
int
Source: PTCL

Comparison of IP (Data & Voice Service) Tariffs
2,000
61,913
123,826
10,842
132,929
451,252
050,000
100,000150,000200,000250,000300,000350,000400,000450,000500,000
US $per
month
Data Voice
E-1DS-3STM-1
Source: PTCL

Segregation of IPLC from DPLC
PTCL was also asked to provide basis and details of the formula for calculating IPLC tariffs for ISPs/Data Service Operators i.e. the formula that clearly depicted the basis for allocation of IPLC tariffs up to landing point and DPLC tariffs from landing point to respective destination.
The required information was not provided by PTCL.
In the absence of cost data, PTA had little option but to adopt international benchmarking.

IPLC Tariffs of Regional Countries
1:4:81:5:111:12:291:5:111:5:121:4:81:12:301:8:23Ratio
16,66625,00040,73725,00027,41616,66682,50048,750STM1
8,33314,16616,46910,00011,5008,33333,00016,956DS3
1,1962,7501,4082,0002,3001,9162,7502,119E1
S. KoreaS. PoreMalaysiaH. KongChinaJapanB. DeshIndia
Source: Telegeography & PTA Research
US $ per month

Questions raised in the Consultation Paper
Whether the list of countries selected should be further expanded for benchmarking purposes?Should IPLC be priced up to the landing stations in Pakistan? And DPLC charges for local access should be separated from IPLC tariffs?The level of tariffs in terms of E-1 capacity as well as price multiples for higher capacities should be reviewedShould IPLC tariffs for voice and data services be charged separately? Can different tariffs for IPLC be objectively justified on the basis of costs incurred in providing IPLC for voice and data services?

Issues Highlighted by the Industry
Bandwidth Tariffs are un-regulated. They should be regulated by PTAPTCL’s IPLC tariffs are not competitive when compared with regional countriesMultiples of higher capacities of IPLC are inconsistent with international standardsTariffs for higher capacities i.e. DS-3 & STM-1 are much higher when compared with regional countriesCharges of IP and IPLC are exorbitant as compared to Philippines, Argentina and India

Objections raised by Competitors
TWA and Multinet who were in the process of commencing their services objected Authority’s initiative to regulate international bandwidth tariffs.In their opinion,
Int’l bandwidth was no longer a monopoly. Hence, there was no need for tariff regulation by the Authority.Market forces should be allowed to determine tariffs and price multiples in Pakistan.Competition in international bandwidth would automatically reduce tariffs.
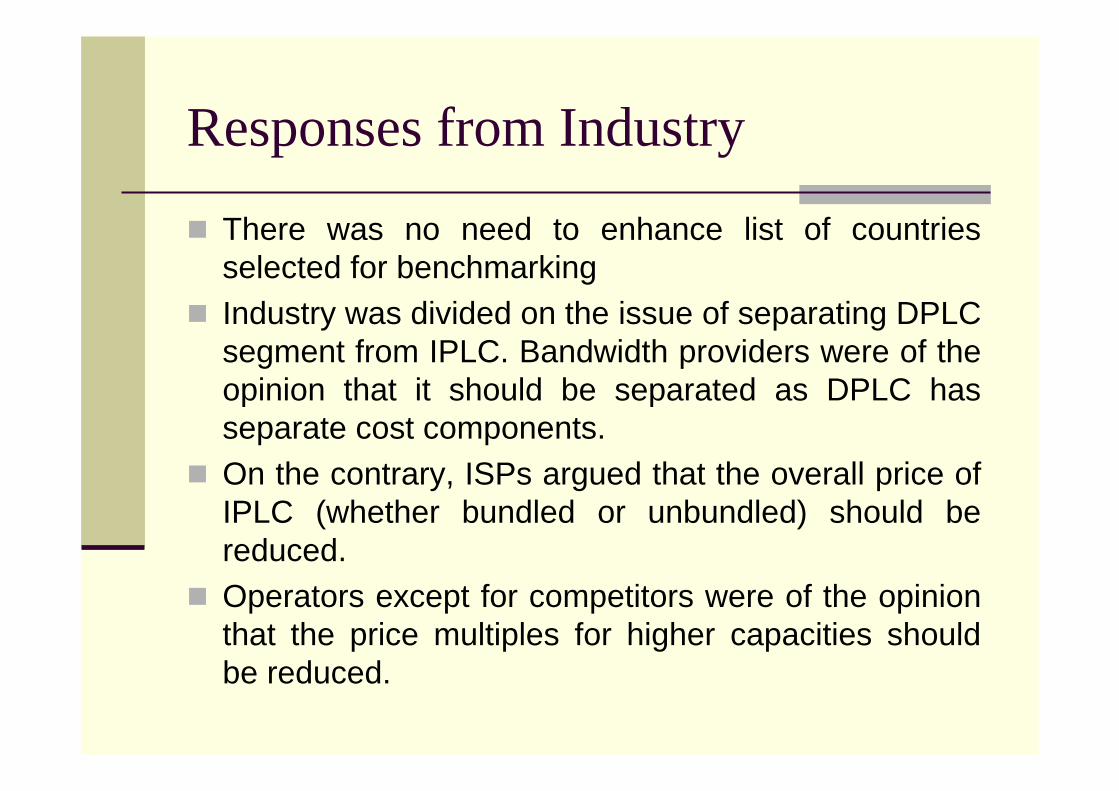
Responses from Industry
There was no need to enhance list of countries selected for benchmarkingIndustry was divided on the issue of separating DPLC segment from IPLC. Bandwidth providers were of the opinion that it should be separated as DPLC has separate cost components.On the contrary, ISPs argued that the overall price of IPLC (whether bundled or unbundled) should be reduced.Operators except for competitors were of the opinion that the price multiples for higher capacities should be reduced.

PTCL’s Concerns on the Consultation Paper
PTA is not entitled to compare PTCL bandwidth tariffs on the basis of international benchmarks due to the following reasons:
The primary obligation of PTA is to set tariffs on cost based which has not been met.PTA has not specified basis of determining the cost and has not provided costing methodology.Benchmarking has not been supported by complete contextual analysis relating to product types, supply and demand, total telephony demand, geography and GDP etc.

PTCL’s Concerns on the Consultation Paper
Choice of countries used for benchmarking has to comply with the following.
Rule 16(4) of Pakistan Telecom Rules 2000 require these to be “similar services provided by telecommunication operators in other countries providing comparable telecommunication services to those of the SMP operator ”
Regulation 11 of Fixed-line Tariff Regulations 2004 require “the international benchmarks to be from “comparable countries” ”

PTCL’s Concerns on the Consultation Paper
International comparisons are not ‘apple to apple’because:
Fiscal policies, incentives and subsidies are not the samePTCL is offering distance-less tariffs while these are distance based tariffs. The cost would increase with distance from the landing station inwards.Developed economies not comparable countries as they are more competitive and have more cable providers.
PTCL proposed to use Digital Access Index, devised by ITU in 2002.

Addressing PTCL’s Concerns
The provision of Telecom Deregulation Policy required PTA to maintain an effective and well defined regulatory regime that is consistent with International Best Practices.
Regulatory bodies through out the world issue consultation papers for soliciting opinion of stakeholders before issuing final orders. PTA also followed the same practice.

Addressing PTCL’s ConcernsPTCL’s objection to determine Int’l bandwidth tariffs on the basis of Int’l Benchmarks was repelled due to following reasons:
As PTCL failed to provide cost information to PTA, thus PTA is justified to use benchmarks for determining PTCL’s bandwidth tariffs.PTA also set mobile termination rates based on the cost studies submitted by mobile operators themselves. PTCL was also involved during the consultation process and did not mention any reservation to the Authority.
Some of the countries considered by PTA were also used by the Govt. of Pakistan in its broadband policy while making internet and broadband comparison. Hence, the choice of countries was consistent with the benchmarking done by GoP.

Consultancy on Cost-Based Charges
PTA has awarded consultancy on Cost based fixed & mobile interconnection charges to Ovum Consulting.
Ovum will also determine IPLC tariffs based on cost as well on benchmarking.
Until determination of cost, PTA determined IPLC tariffs based on International Benchmarks

BenchmarkingThe purpose of benchmarking is to make comparison with other countries where a service is provided at a competitive level.
Since every country has its own unique features - Not possible to base benchmarking process for all issues purely on telecommunication related
geographical, economic and, social indicators
Ranking based on such indicators generally results in placing Pakistan in those categories where competition has not yet been introduced.
Thus, reliance on such comparison would not help in improving the rankings in the context of setting international bandwidth tariffs.

Benchmarking
In light of provisions of the Rules, benchmarking should be done where tariffs are cost based so that their tariffs can be considered as proxy figures.
Based on this principle, PTA determined PTCL’s interconnect charges where PTCL itself had benchmarked the rates with developed countries like UK, Malaysia, Australia and Ireland.
Cost orientation of tariffs can be established either through availability of cost information or through effective competition in the benchmarked countries.

Benchmarking
Level of competition varies from country to country. As also noted by the Gartner Report 2004
“the most competitive markets for international bandwidth are Hong Kong, Singapore, Japan, Taiwan and South Korea, whereas the least competitive markets are Indonesia, India and Malaysia”

Benchmarking Methodologies
Four clusters: Creation of technology, Diffusion of recent Innovations, Diffusion of old Innovations, Human skills.
1998-2000
871(full data)Technology Achievement Index (UNDP)
Three Clusters: Infrastructure, usage, mkt conditions200126171Mobile/Internet Index (ITU)
Five clusters: Infrastructure, Affordability, Knowledge, Quality, Usage.
20028179Digital Access Index (ITU)
Three clusters: Environment, Readiness, Usage. Uses a mix of survey, qualitative and quantitative data.
200348102Network Readiness Index (InfoDev/WEF/INSEAD)
Six clusters: Connectivity, Business environment, Adoption, Legal and policy environment, social and cultural environment, supporting e-services. Uses a mix of quantitative and survey data.
2004/053168E-Readiness Index (EIU/IBM)
Only sparse methodological data is disclosed.20041552Informational Society Index (IDC)
Four cluster: Access, Connectivity, Usage and Policy.20038180ICT Development Index (UNCSTD)
Compares ‘Infostates’,’Infodensity’ and ‘InfoUse’against an Imaginary economy called ‘Hypothetlca’
200317139ICT Opportunity Index (ORBICOM/ITU)
Three clusters: Utilization, Infrastructure and Opportunity
2004/0511180Digital Opportunity Index (ITU/UNCTAD/KADO)
CommentsLatest Data
No. of Indicators
No. of Economies
Name of Index (Organization)
Source: WISR 06
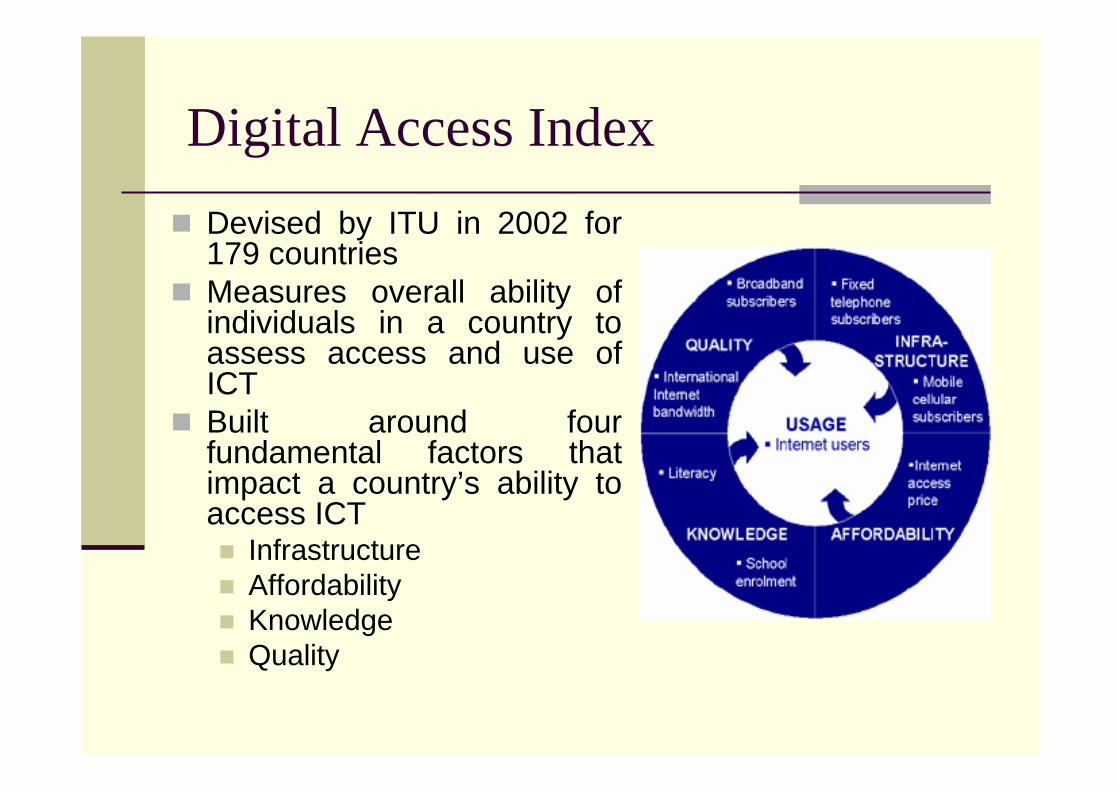
Digital Access IndexDevised by ITU in 2002 for 179 countriesMeasures overall ability of individuals in a country to assess access and use of ICTBuilt around four fundamental factors that impact a country’s ability to access ICT
InfrastructureAffordabilityKnowledgeQuality

Digital Access Index
0.18138Bangladesh0.24128Pakistan
0.18138Yemen0.26127Papua New Guinea
0.19134Nepal0.28126Syria
0.19134Nicaragua0.29124Honduras
0.19134Kenya0.29124Zimbabwe
0.19134Lesotho0.30123Armenia
0.20133Equatorial Guinea
0.31121Uzbekistan
0.21132Tajikistan0.31121Vietnam
0.23131Sao Tome & Principe
0.32119Kyrgyzstan
0.24128Azerbaijan0.32119India
0.24128Vanuatu0.33118Morocco
DAI Score
DAI RankingCountry
DAI Score
DAI RankingCountry
•DAI has classified countries according to
•High
•Upper
•Medium &
•Low ICT Access
• Pakistan was classified with Low ICT Access
• India was classified in the Medium Category

Network Readiness Index (NRI)World Economic Forum has published “Global Information Technology Report 2005-06”.NRI covers 115 economies to measure degree of preparation of a nation to participate in and benefit from ICT developments. NRI is composed of three indexes which ass
Environment of ICT offered by a given countryReadiness of a community key stakeholders –individuals, businesses and governmentsThe usage of ICT among these stakeholders 720.39Russia
710.38Argentina
700.37Philippines
690.37Costa Rica
680.36Indonesia
670.34Pakistan
66-0.33Panama
65-0.31Uruguay
64-0.31Bulgaria
63-0.29Egypt
Rank2005
Score2005
Countries

Digital Opportunity Index (DOI)
ITU issued its World Information Society Report 2006 that present Digital Opportunity Index for 2005 as composite index
Consists of three sub-indices that measure:OpportunityInfrastructureUtilization against an index which can be used to inform and enrich policy making through benchmarking and analysis of performance

Digital Opportunity Index (DOI)

Digital Opportunity Index (DOI)
1360.210.010.020.59Bhutan
1390.200.010.6Bangladesh
1380.210.010.080.53Gambia
1370.2100.030.59Cameroon
1350.2100.020.6Angola
1340.220.010.090.55Kyrgyzstan
1330.2300.030.65Lesotho
1320.240.060.070.6Nicaragua
1310.250.010.070.68Honduras
1300.2600.040.74Djibouti
1290.2600.050.73E Guinea
1280.2600.050.73Pakistan
1270.2600.070.72Turkmenistan
1260.2700.040.76Cuba
1250.270.010.090.71Samoa
1240.2800.060.78Yemen
1230.280.020.060.76Vietnam
1220.290.020.210.63Palestine
1210.290.010.130.72Guyana
1200.290.020.150.7Armenia
1190.290.040.040.8India
World RankDOIUtilizationInfrastructureOpportunityEconomy

Benchmarking with India
Benchmarking based on the aforementioned indicators would have led to comparison with peers which would not have helped the Authority to an objective and purposeful comparison.
India became reasonable choice for comparison owing to the following reasons:
Better performance in all of the above indicesGeographical proximitySimilar level of Per Capita GDPRelatively effective competitionSame undersea cable networks i.e. SEA-ME-WE 3 & 4

Map of Int’l Bandwidth Usage per Capita by Country, 2005
Source: TeleGeographyResearch

Map of Int’l Bandwidth Usage per Capita by Country, 2004

Comparative Analysis of PTCL’s IPLC Tariffs
1:16:381:161:16:381:14:47Price Multiples
-
57,150
3,500
184,950
67,150
3,950
ISPs
112,500
48,000
3,000
-90,000STM
-38,500DS3
2,8522,400E1
LDICall CentersCapacity
1:7:17High Price Multiples
1:4:8Low Price Multiples
E1:DS3:STM1Analysis of Global Price Multiples of
Competitive Countries
Source: PTCL

IPLC Tariffs for E-1 Capacity2852
2,119
2,750
1,916
2,300
2,000
1,408
2,750
1,196
2,400
0 500 1000 1500 2000 2500 3000
India
B.Desh
Japan
China
H.Kong
Malaysia
Singapore
S.Korea
Pakistan
US $
Included DPLC charges – Data Services
Up to landing station
Up to landing station
Up to landing station
Up to landing station
Up to landing station
Up to landing station
Up to landing station
Up to landing station
Up to landing station – Voice Services
Source: TRAI / PTA Research

IPLC Tariffs for DS-3 Capacity
16,956
33,000
8,333
11,500
10,000
16,469
14,166
8,333
48,000
0 10,000 20,000 30,000 40,000 50,000 60,000
India
B.Desh
Japan
China
H.Kong
Malaysia
Singapore
S.Korea
Pakistan
US$
Included DPLC charges – Data Services
Up to landing station
Up to landing station
Up to landing station
Up to landing station
Up to landing station
Up to landing station
Up to landing station
Up to landing station
Source: TRAI / PTA Research

IPLC Tariffs for STM-1 Capacity
48,750
82,500
16,666
27,410
25,000
40,737
25,000
16,666
112,500
0 20,000 40,000 60,000 80,000 100,000 120,000
India
B.Desh
Japan
China
H.Kong
Malaysia
Singapore
S.Korea
Pakistan
US$
Included DPLC charges – Data Services
Up to landing station
Up to landing station
Up to landing station
Up to landing station
Up to landing station
Up to landing station
Up to landing station
Up to landing station
Source: TRAI / PTA Research

PTCL’s IP Bandwidth Tariffs
PTCL segments its IP bandwidth tariffs for voice and data services.
During the consultation process, PTCL further reduced tariffs for data services, thus, further increasing disparity between data and voice services.
However, price multiples were not rationalized.

Comparison of Data & Voice TariffsE-1 Capacity
3,950
20001600
3,500
9,373
10,842
0
2000
4000
6000
8000
10000
12000
US $per
month
Data Voice (Khi) Voice (Lhr) Voice (Isb)Source: PTCL

Comparison of Data & Voice TariffsDS-3 Capacity
61,913
31,34825,000
42,000
114,743
132,929
0
20000
40000
60000
80000
100000
120000
140000
US $per
month
Data Voice (Khi) Voice (Lhr) Voice (Isb)
Source: PTCL

Comparison of Data & Voice TariffsSTM-1 Capacity
123,826
76,00060,000
133,000
387,602
451,252
0
50000
100000
150000
200000
250000
300000
350000
400000
450000
500000
US $
Data Voice (Khi) Voice (Lhr) Voice (Isb)Source: PTCL

Decline in Bandwidth Prices -InternationallyAs per Gartner Report 2004, International Bandwidth prices were expected to continue to decline by 20 – 25% annually during the next three years i.e. from 2005 to 2007.
Internationally, demand / growth in bandwidth has outpaced decline in bandwidth prices.
Monthly Recurring charge for competitive routes that connect Singapore, Hong Kong and Japan are approximately US$ 1000 for an E-1 IPLC.

Decline in Bandwidth Prices -InternationallyAs per Ovum’s research report on “After the Implosion: the market for Int’l Bandwidth”, the end of glut is misplaced perception due to the following reasons:
Supply and Demand are the critical factorsGeography still matters, market equilibrium depends on the region and the route and;Bandwidth shortages are now becoming a possibility on some routes, in some locations

Salient Features of DeterminationIPLC Tariffs
1:8:231:8:231:16:38Price Multiples
52,90048,300-112,500STM-1
18,40016,800-48,000DS-3
2,3002,1002,8523,000E-1
Voice Services
ISPsLDI OpsISPs / DNOPs
Effective 1/1/07(up to landing
station)
Previous Tariffs(Distance-less)
CapacityUSD per month

Salient Features of DeterminationIP Tariffs for Data Services
1:16:311:16:38Price Multiples
46,50060,000STM-1
24,00025,000DS-3
1,5001,600E-1
Effective 1/1/07Previous TariffsCapacityUSD per month

Salient Features of DeterminationIP Tariffs for Data Services
361,000106,35034,3508,700Islamabad
310,10091,80029,5007,500Lahore
106,40033,60010,0802,800Karachi
155 Mbps34 Mbps8 Mbps2 MbpsLocation
238,70077,00026,9507,700Islamabad
201,50065,00022,7506,500Lahore
74,40024,0008,4002,400Karachi
155 Mbps34 Mbps8 Mbps2 MbpsLocation
USD per month
USD per month
Previous Tariffs
Effective Tariffs

PTA Determination on Bandwidth Tariffs
In order to safeguard / protect interest of new players, PTA did not drastically reduce tariffs of International bandwidthAmple margins are still available to new players as well as to PTCL.PTA has segregated DPLC from IPLC and determined IPLC tariffs up to landing point @ US $ 2,100.PTA has narrowed the gap between voice and data servicesAs there are only three active players, there is still room for the investors to take advantage of the situation

The Aftermath….
PTA’s determination on Int’l Bandwidth was challenged by PTCL in the court of Law.Although, the High Court has upheld PTA’s determination, PTCL has again challenged it in the highest apex court i.e. Supreme Court of PakistanTill to date, no stay order has been granted against the decision of High Court. Thus, PTA’s tariffs stand effectiveWith the increase in competition the bandwidth tariffs will become more competitive as the new entrants have started offering similar products at 20-30% discount

Lessons Learned
Every Country / Market has its own dynamics / characteristics. Ideally, the prices of wholesale services should be based on costs in a monopoly scenario but in the long run competition delivers the wonders and the role of the regulator is to play a positive role in the transition periodBenchmarking is a very tricky phenomenon and should not be solely relied upon for all types of tariffs determinations

Thanks