Determining critical atmospheric ammonia levels for … critical atmospheric ammonia levels for...
43
Determining critical atmospheric ammonia levels for cattle, sheep and goats - a literature review Project LIVE.218 Final report prepared for MLA and LiveCorp by: Associate Professor Nick Costa, Dr Jeisane Accioly and Dr Martin Cake School of Veterinary & Biomedical Sciences Murdoch University Published by Meat & Livestock Australia Ltd ABN 39 081 678 364 ISBN: 1 74036 296 9 December 2003 MLA makes no representation as to the accuracy of any information or advice contained in this document and excludes all liability, whether in contract, tort (including negligence or breach of statutory duty) or otherwise as a result of reliance by any person on such information or advice. © Meat and Livestock Australia (2003) The livestock export program is jointly funded by the livestock exporters and producers of Australia
Transcript of Determining critical atmospheric ammonia levels for … critical atmospheric ammonia levels for...
Determining critical atmospheric ammonia levels for cattle, sheep and goats - a literature review
Project LIVE.218 Final report prepared for MLA and LiveCorp by: Associate Professor Nick Costa, Dr Jeisane Accioly and Dr Martin Cake School of Veterinary & Biomedical Sciences Murdoch University Published by Meat & Livestock Australia Ltd ABN 39 081 678 364 ISBN: 1 74036 296 9 December 2003
MLA makes no representation as to the accuracy of any information or advice contained in this document and excludes all liability, whether in contract, tort (including negligence or breach of statutory duty) or otherwise as a result of reliance by any person on such information or advice. © Meat and Livestock Australia (2003)
The livestock export program is jointly funded by the livestock exporters and producers of Australia
LIVE.218 Determining critical ammonia levels
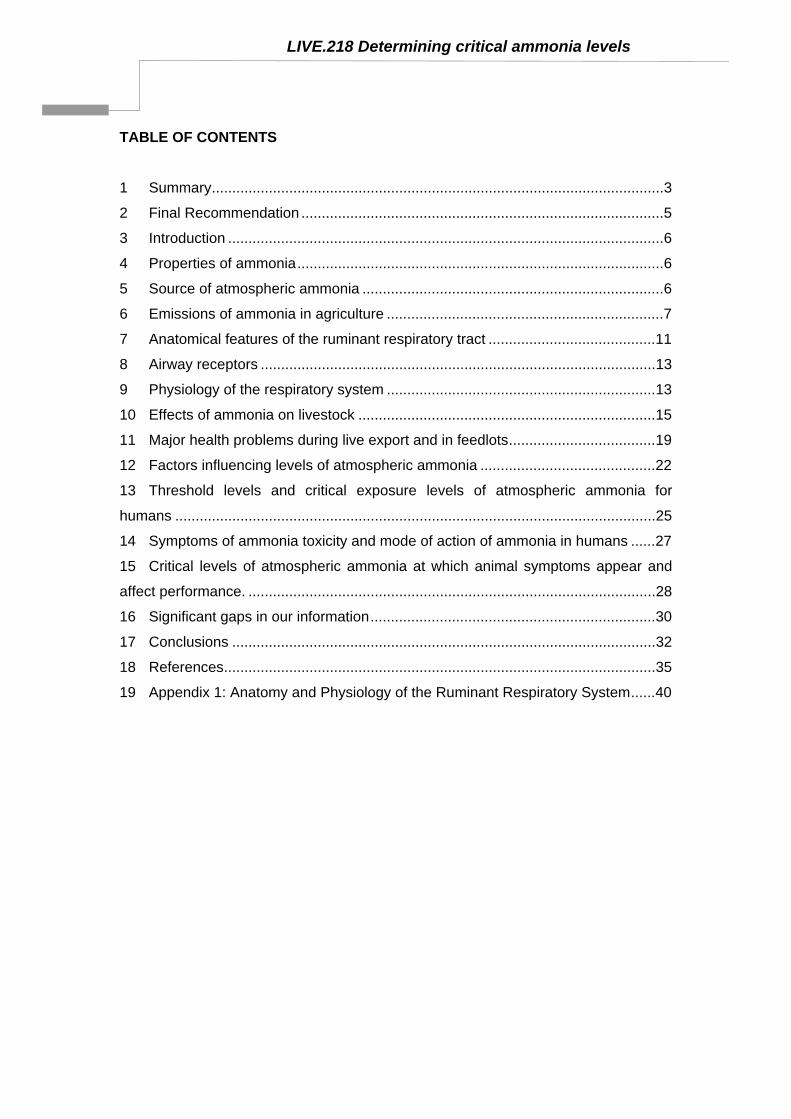
TABLE OF CONTENTS
1 Summary...............................................................................................................3
2 Final Recommendation .........................................................................................5
3 Introduction ...........................................................................................................6
4 Properties of ammonia..........................................................................................6
5 Source of atmospheric ammonia ..........................................................................6
6 Emissions of ammonia in agriculture ....................................................................7
7 Anatomical features of the ruminant respiratory tract .........................................11
8 Airway receptors .................................................................................................13
9 Physiology of the respiratory system ..................................................................13
10 Effects of ammonia on livestock .........................................................................15
11 Major health problems during live export and in feedlots....................................19
12 Factors influencing levels of atmospheric ammonia ...........................................22
13 Threshold levels and critical exposure levels of atmospheric ammonia for
humans ......................................................................................................................25
14 Symptoms of ammonia toxicity and mode of action of ammonia in humans ......27
15 Critical levels of atmospheric ammonia at which animal symptoms appear and
affect performance. ....................................................................................................28
16 Significant gaps in our information......................................................................30
17 Conclusions ........................................................................................................32
18 References..........................................................................................................35
19 Appendix 1: Anatomy and Physiology of the Ruminant Respiratory System......40
LIVE.218 Determining critical ammonia levels
1 Summary This report is a review of the literature on the issue: “The effects of atmospheric ammonia
production on animal health and performance in livestock ships and feedlots.”
The principal findings from the literature are:
• Ammonia gas is volatilised into the atmosphere by the action of bacterial urease enzymes
in the bedding or manure pads, breaking down urea in urine and also undigested protein
in faeces.
• Volatilisation of ammonia from the bedding or pad increases when pH rises above 7.0
and with increasing ambient temperature.
• Atmospheric ammonia concentration is typically 15 ppm (with a range of 10 to 50 ppm)
onboard vessels during transport of cattle and sheep. Common readings below decks
reach 20 to 30 ppm. In cattle feedlots in eastern Australia, typical atmospheric ammonia
concentrations are 14 to 16 ppm. Thus, the average atmospheric ammonia
concentrations are comparable in these two production systems. Of even greater interest
for feedlots, is that atmospheric ammonia is 25 to 30 ppm at heights of 0.25 m from the
ground. Thus, even the upper ranges of atmospheric ammonia for the two systems are
comparable.
• The Australian National Occupational Health and Safety Commission has three standards
for exposure to atmospheric contaminants such as ammonia gas in the occupational
environment: the time-weight average (TWA) exposure limit for humans working for up to
eight-hour shifts on a 40-hour week; the short-term exposure limit (STEL) which is a time-
weight average measured over 15 minutes and should not be exceeded in any working
day; and the permissible exposure limit which is the maximum concentration that humans
are permitted to enter. The time-weighted average (TWA) exposure limit for atmospheric
ammonia for humans is 25 ppm. The short-term exposure limit (STEL) is 35 ppm. The
permissible exposure limit (PEL) for ammonia is 50 ppm.
• Under Australian legislation and workplace conditions, atmospheric ammonia
concentrations should be below the TWA, STEL and PEL concentrations. However, each
of these concentration limits could be exceeded under usual conditions recorded on
vessels used for live export and in Australian feedlots.
• Atmospheric ammonia can be reduced by a number of atmospheric and nutritional
means:
• Establishing adequate ventilation rates onboard vessels.
• Feeding diets that contain good quality cereal hay, lower protein (12% or less) or a
greater proportion of rumen by-pass (RBP) or undegraded intake protein (UIP) (25%
of the ration protein) will decrease the urea-N substrate for ammonia production.
3
LIVE.218 Determining critical ammonia levels
• Using salts such as calcium chloride or ammonium chloride at 1% in rations to acidify
urine and decrease the pH of bedding. The lower pH reduces volatilisation of
ammonia.
• Adding bedding agents that reduce the pH (eg gypsum) to reduce ammonia
volatilisation.
• Production indices such as feed intake, average daily gain and feed conversion efficiency
were all adversely affected in lambs, calves, and pigs by exposure to ammonia levels of
50 ppm or more. However, there was no significant production effect below this
concentration of ammonia. Moreover, the length of exposure is much greater during live
export and feedlots. From the literature, it is not possible to clearly deduce the effects of
these longer exposures to atmospheric ammonia of 25 ppm or more.
• The respiratory system of cattle is poorly adapted anatomically and physiologically to
handle respiratory challenge from ammonia, heat, or exercise.
• High ammonia concentrations can irritate the upper respiratory tract leading to coughing
(particularly on hot days) and rapid breathing. The small airways of the lower respiratory
tract become inflamed after exposure to ammonia.
• Pneumonia is a significant cause of mortalities in cattle during live export. However, in
cattle feedlots, pneumonia is associated with a complex of mycoplasmas and viruses that
induce disease in the first week after entry. Most of the literature on respiratory disorders
in cattle during their period in feedlot concentrates on this early period and not on chronic
effects of 60-day plus exposure.
• The possible role of ammonia in damaging the respiratory tract of cattle and hence
providing the opportunity for pneumonia complex of pathogens to invade and infect the
lungs should be evaluated.
• The notion of atmospheric ammonia playing a role in the aetiology of pneumonia
infections is supported by work in calves, lambs, and pigs. However, the levels of
ammonia used in these studies were either not recorded (calves), or were much higher in
the pig (often 50ppm and 100 ppm and sometimes 150 ppm) and lamb studies (75 ppm)
than commonly observed in vessels during sea transport or in feedlots.
• In contrast to Australian, UK, Canadian and USA authorities, the Commission
Internationale de Génie Rural (CIGR) recommended critical value of atmospheric
ammonia for pigs is 20 ppm for countries in the European Commission. If this critical
value gained wider currency, then cattle feedlots and live export would frequently exceed
this limit.
• The no-observed-effect value for atmospheric ammonia in pigs is debatable. Some
workers propose 15 ppm as the maximal ammonia concentration to be tolerated in the air
of pig buildings, while others suggest 50 ppm. In both systems, feedlot and live export,
the average value for atmospheric ammonia happens to be measured at 15 ppm.
4
LIVE.218 Determining critical ammonia levels
• The critical value of atmospheric ammonia above which cattle welfare and production
could be adversely affected should be set at 25 ppm. This value is the same as the TWA
for humans and 5 ppm above the European standard for pig housing systems. In a
practical sense, setting critical ammonia at 25 ppm is achievable under current production
systems. It is important to remember that the TWA of 25 ppm for humans is set for
regular exposures of 8 to 10 hours maximum, repeated each day for five days. Moreover,
pigs tolerate atmospheric ammonia better than cattle probably due to a better-adapted
respiratory system.
• The rates of ammonia generated by sheep during transport assessed on either a m3/s or
mg/h basis are the same as cattle when measured on the same units of live weight. It is
unlikely that sheep or goats are going to be qualitatively or quantitatively different to cattle
in their respiratory responses to ammonia. Therefore the same critical value for
atmospheric ammonia of 25 ppm should be applied to sheep and goats.
• Assessment of respiratory damage or extent of loss of lung function is difficult in cattle
and sheep. Bronchioalveolar lavage (BAL) could be standardised as a functional test to
assess inflammatory response in the bovine lung after prolonged exposure to high
atmospheric ammonia levels.
• BAL results in cattle showed that ammonia exposure at 22 ppm and 42 ppm for nine days
significantly increased the indicators of inflammation such as white cell count,
macrophages, mononucleated cells and segmented cell fragments in cattle. The
increases were higher at 42 ppm or more than at 22 ppm. The important aspect here is
that there are initial clinical signs of inflammation at 22 ppm atmospheric ammonia. This
infers that the no observed effect value for atmospheric ammonia is less than 25 ppm for
cattle
• Respiratory functions of cattle are affected at lower atmospheric ammonia concentrations
than production functions.
• More work should be done to develop effective tests of respiratory function in ruminants.
• More research, such as dietary acidification, is needed to evaluate methods of reducing
atmospheric ammonia near ground level in feedlots.
2 Final Recommendation The critical value of atmospheric ammonia for cattle, sheep and goats undergoing sea
transport and in feedlots in Australia should be set at 25 ppm, in line with the Australian TWA
for humans. In this way, action to lower atmospheric ammonia is required at the same
concentration point for humans and cattle, sheep or goats.
5
LIVE.218 Determining critical ammonia levels
3 Introduction Defining a critical concentration for atmospheric ammonia above which health problems
develop in cattle and sheep requires review and integration of a number of different
concepts. Firstly, there needs to be a consideration of the fundamental chemical and
physical properties of ammonia itself and how it is generated in animal production systems.
Secondly, since ammonia is affective in the gaseous state, the gaseous exchanges
associated with respiration in cattle and sheep must be considered. This review will provide
a summary of the literature on the effects of atmospheric ammonia on health in animals, and
humans with particular reference to cattle during long haul sea transport and in feedlots.
Moreover, nutritional and atmospheric actions that reduce potential atmospheric ammonia
will be evaluated. Finally, the significant gaps in our understanding and information will be
identified, and possible means of addressing these deficiencies will be presented. All of this
data and information will be used as the basis for finally defining a critical level for
atmospheric ammonia and the associated constraints in applying that level.
4 Properties of ammonia Ammonia is a colourless gas that is strongly alkaline, very soluble in water and has a pungent
highly irritant odour. It is a colourless liquid under pressure and forms ammonium hydroxide
in water. Ammonia gas has a molecular weight of 17.03, a density relative to air of 0.5967
and an absolute density of 0.771 g/L. The Chemical Abstracts Service Registry Number
(CAS No.) for ammonia gas is 7664-41-7.
5 Source of atmospheric ammonia Most of the ammonia in the environment is generated from the action of bacterial urease
enzymes acting on urinary urea-N and faecal protein-N. The temperature optimum for
bacterial ureases is 49oC and pH optimum is 7.7 - 8.0. Therefore ammonia would be
generated from urine and faeces best at high temperature and slightly alkaline pH. At 760
mm of Hg (normal atmospheric pressure), the density of moist air is 1.9 g/L and that of dry air
is 1.2 g/L, so ammonia will rise slowly and disperse rapidly at its relative and absolute
densities.
The ammonia in manure or litter is liable to volatilization to the surrounding air. The rate and
extent of liberation into the air depends on the equilibrium in the liquid and gas phase
according to the equation:
NH4+(l) ⌦ NH3 (l) + H+
6
LIVE.218 Determining critical ammonia levels
The ammonium-ammonia equilibrium is influenced by temperature and pH. Nearly all of the
ammonia is bound as ammonium below a pH of 7.0, and therefore not liable to volatilization.
Higher temperatures favour ammonia concentrations over ammonium, because of the
positive influence that temperature has on the dissociation constant Ka which is defined as:
Ka = [NH3] [H3O+] / [NH4+]
The volatisation equilibrium of ammonia from the liquid to the gas phase follows Henry’s law
for dilute systems:
NH3 (l) ⌦ NH3 (g)
NH3 (g, manure) ⌦ NH3 (g, air)
Therefore the partial pressure of gaseous ammonia, NH3 (g), is proportional to the NH3 (l)
concentration. The volatilization of ammonia from manure to air is defined as the mass flux.
This flux is the product of the difference in partial pressure of ammonia between the liquid and
gas media and a mass transfer coefficient. Higher partial pressure increases flux. Mass
transfer coefficients increase with increasing air velocity. Ventilation brings fresh air into the
area while removing ammonia, water vapour, other gases such as carbon dioxide and air
contaminants such as dust. The ventilation rate and pattern affects not only the overall
composition of the atmosphere around the animals and their manure, but also the
microclimate immediately above the manure or litter.
6 Emissions of ammonia in agriculture The emission of ammonia into the environment is a major political issue in Europe and
emission values and ammonia concentrations have been published for European agriculture
(Gustafsson 1997; Groot Keorkamp et al. 1998; Misselbrook et al. 2000). To calculate the
ammonia losses from farming, the Swedish Boards of Agriculture have established a data
model, STANK, which has used the following standards outlined in Table 1 to calculate
ammonia losses from the barn, and from the storage and spreading of manure.
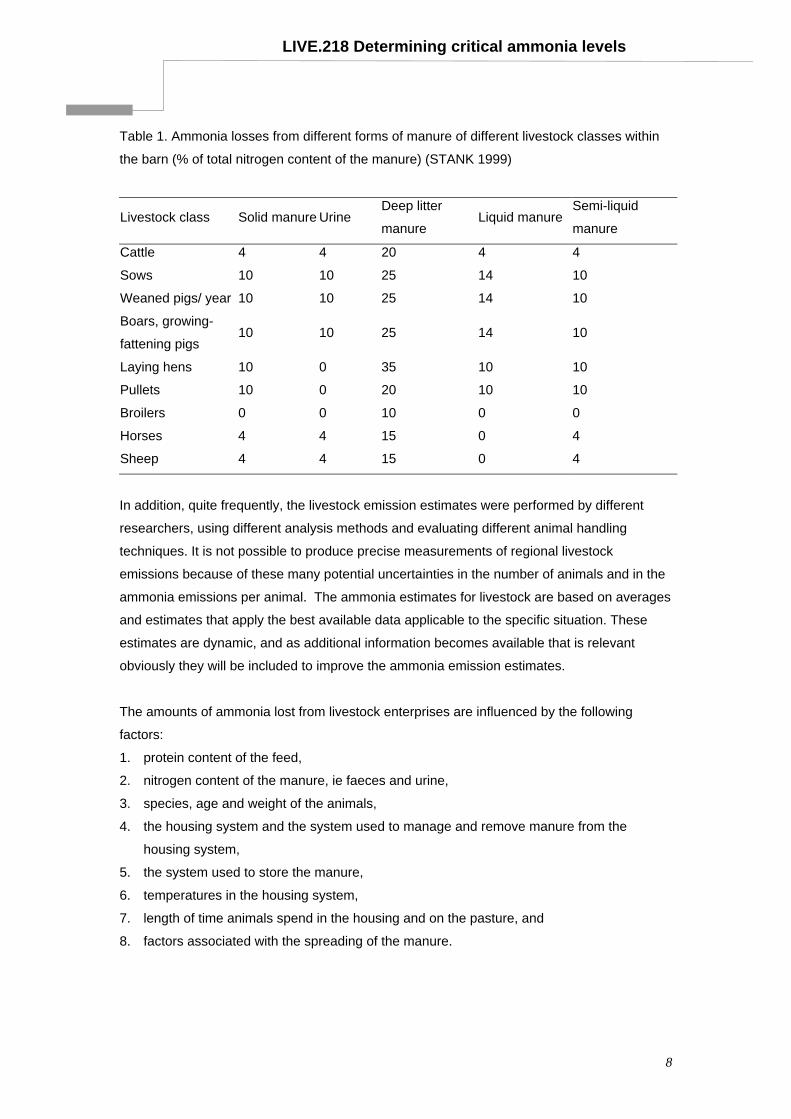
From Table 1, pigs and poultry have the greatest potential for ammonia emission compared
with cattle, sheep or horses. Moreover, estimates of ammonia emissions from cattle are
different for beef cattle, dairy cattle, grazing cattle, feedlot cattle, bulls, heifers, and calves.
To make matters worse, measuring or estimating ammonia emissions from livestock is a
difficult process since they can be substantially affected by the factors listed below.
7
LIVE.218 Determining critical ammonia levels
Table 1. Ammonia losses from different forms of manure of different livestock classes within
the barn (% of total nitrogen content of the manure) (STANK 1999)
Livestock class Solid manure Urine Deep litter
manure Liquid manure
Semi-liquid
manure
Cattle 4 4 20 4 4
Sows 10 10 25 14 10
Weaned pigs/ year 10 10 25 14 10
Boars, growing-
fattening pigs 10 10 25 14 10
Laying hens 10 0 35 10 10
Pullets 10 0 20 10 10
Broilers 0 0 10 0 0
Horses 4 4 15 0 4
Sheep 4 4 15 0 4
In addition, quite frequently, the livestock emission estimates were performed by different
researchers, using different analysis methods and evaluating different animal handling
techniques. It is not possible to produce precise measurements of regional livestock
emissions because of these many potential uncertainties in the number of animals and in the
ammonia emissions per animal. The ammonia estimates for livestock are based on averages
and estimates that apply the best available data applicable to the specific situation. These
estimates are dynamic, and as additional information becomes available that is relevant
obviously they will be included to improve the ammonia emission estimates.
The amounts of ammonia lost from livestock enterprises are influenced by the following
factors:
1. protein content of the feed,
2. nitrogen content of the manure, ie faeces and urine,
3. species, age and weight of the animals,
4. the housing system and the system used to manage and remove manure from the
housing system,
5. the system used to store the manure,
6. temperatures in the housing system,
7. length of time animals spend in the housing and on the pasture, and
8. factors associated with the spreading of the manure.
8
LIVE.218 Determining critical ammonia levels
Feeding more protein than is needed for optimum production results in increased urea
concentrations in the urine. Urea from urine is often rapidly hydrolysed into ammonia in the
soil or bedding. This increases the risk of ammonia losses directly from the soil or bedding.
The mean atmospheric ammonia concentrations varied between 0 to 8 ppm in houses for
dairy cows, beef cattle and calves and were less than 1.5 ppm in England (Groot Keorkamp
et al. 1998). In contrast, the mean atmospheric ammonia values in houses for sows,
weaners, and finishers were 5 to 18 ppm, and in houses for laying hens and broilers they
varied between 5 and 30 ppm (Groot Keorkamp et al. 1998). These ammonia concentrations
were all determined in winter in the Northern Hemisphere with temperatures of 10.1oC for
England, 9.8oC for The Netherlands, 8.4oC for Denmark and 10.5oC for Germany (Groot
Keorkamp et al. 1998). These temperatures are much lower than those that are common in
Australian feedlots or during the transport of cattle and sheep to the Middle East and northern
Africa, or transport of cattle and goats to south-east Asia and north-east Asia. The higher
temperatures in feedlots or during transport from Australia will favour ammonia concentrations
over ammonium, thereby increasing the level of ammonia in the environment. Typical values
measured below decks in vessels transporting cattle and sheep from Australia were 15 ppm
with readings commonly reaching 20 to 30 ppm (MAMIC Ventilation Study SBMR.002, 2001).
These values for ammonia are well above those reported for European production systems.
There appears little information however, on atmospheric ammonia levels in open pens or
how the factors such as pad depth, diet, and washing down of cattle pens influence these
levels.
Feedlots in Australian produce much higher atmospheric ammonia than feedlots in North
America. Ammonia emissions from cattle feedlots were monitored in Canada by the
University of Lethbridge (McGinn and Janzen 1998, McGinn et al. 2003). Ammonia
concentrations were measured in feedlots in the Lethbridge North Irrigation District in
southern Alberta, Canada which is one of the most concentrated beef feedlot areas in
Canada. Four feedlot sites, with capacities of 6,000, 12,000 and two with 25,000 were
monitored for ammonia concentration (McGinn et al. 2003). The peak ammonia
concentrations in the 12,000 and 25,000 feedlots were 1488 and 1050 ug/m3 respectively.
There is a method for converting mg/m3 to ppm via the following expression: ammonia
(mg/m3) = [MW of ammonia x ammonia (ppm)]/24.4 (molar gas constant at 25oC). Thus a
value such as 1488 ug/m3 would be equivalent to (1488/1000) x 24.4/17 = 2.14 ppm
ammonia. Previous studies at three feedlots in Canada showed the following values for
atmospheric ammonia: adjacent an average of 863 ppb, with a peak value of 5140 ppb; at
200 metres a peak value of 3660 ppb; and at 1 km peak measurements of 416 ppb ammonia
(McGinn and Janzen 1998). Further studies reported levels of 400 – 500 ppb ammonia at
distances of 5 km downwind from the feedlots, with levels of 400--50 ppb as the new
9
LIVE.218 Determining critical ammonia levels
background compared with more usual levels of 5 ppb (McGinn and Janzen 1998). The
important point to remember here is that atmospheric ammonia levels were being monitored
for concerns about nuisance odour and human health. No direct measures were made of
levels likely to affect the cattle themselves. The monitoring stations at these feedlots were
either in a tower placed at three metres next to the feedlot or measured miles down wind from
the feedlot.
In contrast, measures of atmospheric ammonia in Australian feedlots were made at varying
heights above the manure pad within the feedlot itself. Therefore, these Australian values
have direct relevance to the cattle themselves. Australian studies (FLOT.317, 2003) found
that ammonia generation from pen surfaces is directly affected by temperature, with higher
ammonia levels measured during the warmer parts of the day. What was of further interest
was the fact that there was little difference noted between ammonia levels within the shaded
and unshaded pens, probably due to the dry weather conditions experienced during the
ammonia measurements. Most importantly, this Australian study found a distinct
concentration profile above the pen surface. Peak concentrations were in the order of 12 to
16 ppm when measured at a height of 1 metre above the surface. However, peak
concentrations measured at a height of 0.3 metres increased to 25 to 30 ppm. These
concentrations of atmospheric ammonia actually measured in Australian feedlots (as distinct
from next feedlots in Canada) place them in the same concentration range as atmospheric
ammonia onboard vessels transporting livestock.
Nevertheless, feedlots in general produce much lower atmospheric ammonia concentrations
than pig production systems. For instance, in Ohio, levels of atmospheric ammonia were 35
ppm and 176 ppm in ventilated and unventilated piggeries respectively. These sorts of
exposure values led to concerns about the occupational health and safety of piggery workers.
Consequently, Ohio passed a new legislative limit for atmospheric ammonia exposure by
humans of 10 ppm for 8 hours. In a review of workplace health in Canada, workers from high
ammonia environments in agriculture had a 4-fold increase in chronic cough, a 7-fold increase
in productive cough and a 4-fold increase in wheezing. Reduced pulmonary function was a
common finding and the respiratory effects showed a dose-dependent relationship to
particulate matter and ammonia. Clearly atmospheric ammonia is an occupational health and
safety concern for humans, and some governments e.g. Sweden and the Ohio state
legislature have responded to those concerns by lowering the limits for exposure to
atmospheric ammonia.
10
LIVE.218 Determining critical ammonia levels
7 Anatomical features of the ruminant respiratory tract Since atmospheric ammonia influences all animals, not just humans, through their respiratory
system, we have reviewed the basic structure and function of the ruminant respiratory
system. This is a comparative review with an emphasis on cattle relative to other species of
the same size eg horses (Appendix 1). The anatomy of the ruminant respiratory tract
highlights some notable differences from that of man and other animals. Some of these
factors – including relative narrowness of the upper respiratory tract, a high degree of
anatomic compartmentalisation, small lung size, abundance of lymphoid tissue, and frequent
exposure to rumen gases – might be predicted to confer an inherent susceptibility to
respiratory pathology and dysfunction. It is in examining the physiological capacity of cattle
that more obvious functional deficiencies become apparent. In reviewing anatomical and
physiological factors predisposing cattle to respiratory disease, Veit and Farrell (1978) noted
their small gaseous exchange capability relative to their basal O2 needs. Using the
reference data of Altman & Dittmer (1971), they demonstrated that the bovine ratio of total
alveolar surface area: basal O2 consumption (VO2) is less than half of the mean mammalian
value. As the mean alveolar diameter is only slightly below (and VO2 only slightly above) that
predicted allometrically (Tenney et al. 1963; Altman et al. 1971), this deficiency appears
mostly due to the small size of the bovine lung. Gehr et al. (1981) found that the measured
volume of a cow lung was only 48% of that predicted by allometric regression (Gehr et al.
1981). The alveolar surface area was also lower (77%) than that predicted allometrically.
The lack of a similar discrepancy in wild African bovids suggests that this loss of respiratory
capacity is the result of domestication and selection for other traits such as digestive
efficiency and muscle mass (Gehr et al. 1981). It is not known if there is a difference in
respiratory capacity or efficiency between Bos taurus and Bos indicus cattle.
The principal functional implications of this reduced respiratory surface are three-fold. Firstly,
greater basal ventilatory activity is necessary. The tidal volume of a 400kg dairy cow is
approximately 3100ml when lying down, or 3700ml when standing (Altman et al. 1971). This
volume is, in itself, appropriate for an animal of this size (Dukes 1955). However, given the
small lung volume, the ratio of resting tidal volume: total volume (percent basal use) is high
in cattle (29%) when compared to the mammalian mean of 13.9% (Veit et al. 1978). Cattle
therefore use a greater proportion of their lung volume for basal respiration. This, in turn,
predisposes to a more extensive and deeper (more distal) pulmonary distribution of any
inhaled irritants. Secondly, the airflow rate per unit lung volume (minute volume / total lung
volume) is also well above the mammalian mean (Veit et al. 1978). This greater airflow rate
might be expected to increase epithelial exposure to inhaled irritants per unit area. In
addition, the greater airflow velocity increases turbulence and epithelial impingement of
11
LIVE.218 Determining critical ammonia levels
airborne material. Thirdly, the small alveolar surface area reduces the functional reserve of
the bovine respiratory system. Thus, the animal’s capacity to increase gas exchange during
exertion or disease is limited. Again, comparison with wild African bovids demonstrates that
domestication has reduced the maximal rate of oxygen consumption (VO2 max) relative to
that predicted allometrically (Taylor et al. 1980). This is shown more dramatically by the
observation that despite similar body size, the horse (a species selected for athleticism) has
a VO2 max more than 3 times that of the cow. Interestingly though, domestication did not
similarly reduce the VO2 max of sheep and goats, which is comparable to that of small wild
ruminants such as gazelle (Taylor et al. 1980).
Several other features reduce the respiratory efficiency of ruminants. Delivery of air to the
lungs is a function of effort by respiratory muscles, elasticity of the lung and thorax, and flow
resistance of the airways (Robinson 1982). The poor compliance of the thoracic wall, and
small size of the upper airways have already been noted. The rigid structure of the chest
results in a high residual volume, further compromising reserve capacity (Dukes 1955).
Epling (1964) subjectively noted the sparsity of elastin fibres in the bovine interalveolar
septum. He also reported lower numbers of alveolar capillaries than other species, though
this qualitative observation has not subsequently been validated (Epling 1964). If true, this
would suggest a comparatively higher proportion of alveolar dead space, hence inherent
inefficiency of the air-blood interface. It would also infer that a given amount of toxic material
would impact on a proportionately smaller endothelial mass, possibly creating greater
vascular exposure to toxins (Veit et al. 1978). The same does not appear to be true of the
small ruminants, as at least one author has noted the alveolar capillary network is extensive
(Atwal et al. 1971). Cattle also have particularly vigorous pulmonary vasoconstrictor
response to hypoxia and hypercapnia. This, combined with their small respiratory capacity,
makes them prone to pulmonary hypertension at high altitudes (Robinson 1982).
As noted above, the respiratory tract of sheep appears to have fewer anatomical and
physiological constraints than that of cattle. However, the thickness of the ovine fleece gives
the respiratory tract great importance in thermoregulation, which to some degree
compromises its respiratory functions. As ambient temperature rises, respiratory minute
volume increases rapidly, principally due to an increase in respiratory rate. A comparison of
Egyptian (Rahmani) and Merino sheep showed that breeds adapted to higher native
temperatures (hence more efficient respiratory thermoregulation) have greater respiratory
dead space and a smaller alveolar surface area, despite a similar lung volume per unit body
weight (Shafie et al. 1978). Thus the Merino is forced to effect a greater increase in its
respiratory rate, and this has a correspondingly greater impact on respiratory alkalosis, and
presumably on exposure to any inhaled irritants.
12
LIVE.218 Determining critical ammonia levels
8 Airway receptors In addition to differences in the basic anatomy and physiology of the respiratory system, there
are many different types of afferent receptors in the airways. The larynx contains at least five
types of receptors: pressure, drive, cold, irritant and C-fibre. In the trachea and bronchi there
are least four different types: slowly and rapidly adapting stretch receptors (SARs and RARs),
C-fibre receptors and those in the neuroepithelial bodies (NEBs) (Widdicombe 2001). Irritant
receptors are found in the epithelium of the conducting airways and are supplied by the
smaller myelinated fibres than stretch receptors.
Irritant receptors are normally silent and are then activated by a wide range of chemical and
mechanical irritants including ammonia and dust respectively (Widdicombe 2001). They are
part of the RAR group of receptors where they mediate the coughing reflex and usually act to
constrict airways. C-fibres have proved difficult to study but they are known to be weakly
responsive to mechanic irritants and stimulated clearly by chemical irritants. In contrast to
irritant receptors the reflex actions of C-fibres are not clear, but may include the pronounced
apnoeas often seen on laryngeal irritation. SARs are different to both of these types of
receptors since they are not very chemosensitive. Thus the RAR receptors, and part of the
action of the C-fibre receptors respond to stimulation by ammonia and act to restrict airways
and induce the coughing reflex.
9 Physiology of the respiratory system The respiratory system has one major physiological function, namely gaseous exchange. In
achieving this function, the respiratory system also has a significant role in homeostasis of
body temperature and regulation of acid-base balance. Generally these functions are not in
conflict but if the animal is exposed to excessive heat load or to acid-base challenge a
conflict may arise. In particular as panting changes from deep breathing to shallow breathing
especially during heat load, the animal’s need to alleviate a rise in core body temperature
may be compromised by its need to balance blood CO2. The CO2 concentration in the blood
has a powerful influence on ventilation. The respiratory centre, which is located in the
medulla part of the brain stem responds to the amount of CO2 in the blood. As blood passes
through the respiratory centre, sensors stimulated by the level of CO2 send impulses to rib
cage muscles to increase the rate of respiration. The overall control of acid-base is a
function of the Henderson-Hasselbalch equation where:
pH = pKa + log [base]/[acid]
The specific case of the body’s major system for regulating acid-base balance, the
bicarbonate system can be represented in Figure 1.
13
LIVE.218 Determining critical ammonia levels
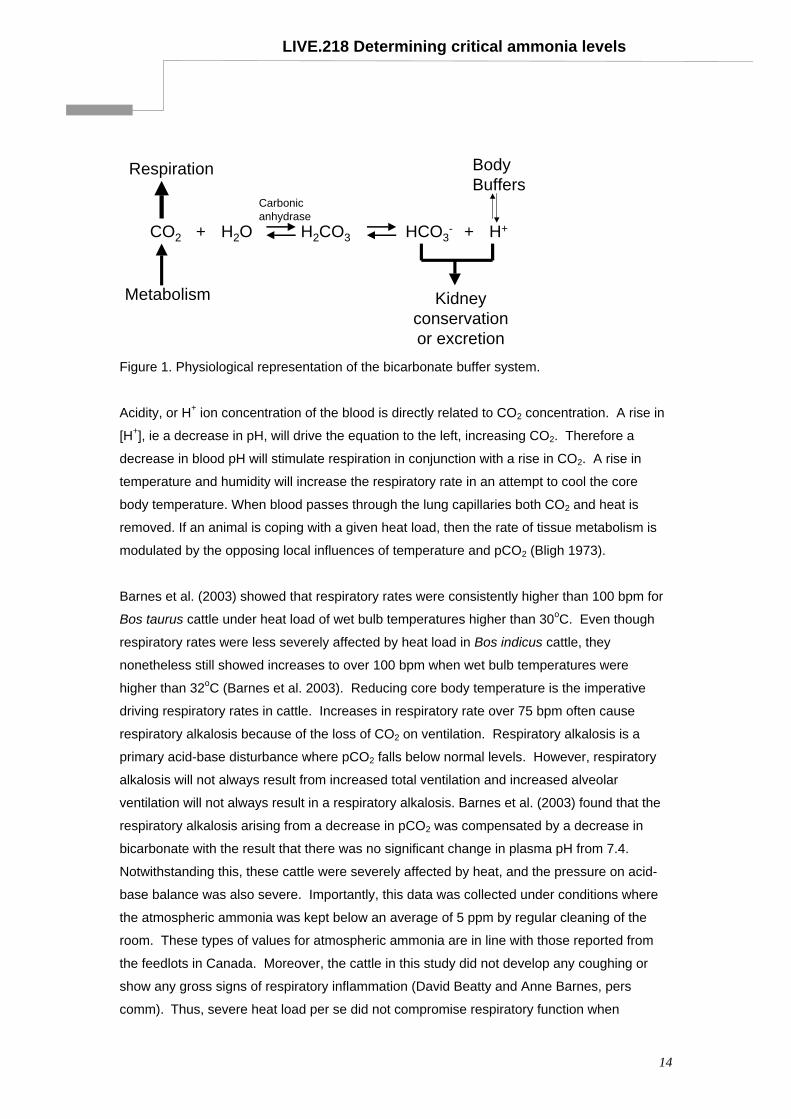
CO2 H2O H2CO3 HCO3- H++ +
Respiration
Metabolism
Carbonicanhydrase
BodyBuffers
Kidneyconservationor excretion
Figure 1. Physiological representation of the bicarbonate buffer system.
Acidity, or H+ ion concentration of the blood is directly related to CO2 concentration. A rise in
[H+], ie a decrease in pH, will drive the equation to the left, increasing CO2. Therefore a
decrease in blood pH will stimulate respiration in conjunction with a rise in CO2. A rise in
temperature and humidity will increase the respiratory rate in an attempt to cool the core
body temperature. When blood passes through the lung capillaries both CO2 and heat is
removed. If an animal is coping with a given heat load, then the rate of tissue metabolism is
modulated by the opposing local influences of temperature and pCO2 (Bligh 1973).
Barnes et al. (2003) showed that respiratory rates were consistently higher than 100 bpm for
Bos taurus cattle under heat load of wet bulb temperatures higher than 30oC. Even though
respiratory rates were less severely affected by heat load in Bos indicus cattle, they
nonetheless still showed increases to over 100 bpm when wet bulb temperatures were
higher than 32oC (Barnes et al. 2003). Reducing core body temperature is the imperative
driving respiratory rates in cattle. Increases in respiratory rate over 75 bpm often cause
respiratory alkalosis because of the loss of CO2 on ventilation. Respiratory alkalosis is a
primary acid-base disturbance where pCO2 falls below normal levels. However, respiratory
alkalosis will not always result from increased total ventilation and increased alveolar
ventilation will not always result in a respiratory alkalosis. Barnes et al. (2003) found that the
respiratory alkalosis arising from a decrease in pCO2 was compensated by a decrease in
bicarbonate with the result that there was no significant change in plasma pH from 7.4.
Notwithstanding this, these cattle were severely affected by heat, and the pressure on acid-
base balance was also severe. Importantly, this data was collected under conditions where
the atmospheric ammonia was kept below an average of 5 ppm by regular cleaning of the
room. These types of values for atmospheric ammonia are in line with those reported from
the feedlots in Canada. Moreover, the cattle in this study did not develop any coughing or
show any gross signs of respiratory inflammation (David Beatty and Anne Barnes, pers
comm). Thus, severe heat load per se did not compromise respiratory function when
14
LIVE.218 Determining critical ammonia levels
atmospheric ammonia levels were low. Bos indicus have a better capacity to tolerate heat
load than Bos taurus. Whether there is also a difference in capacity to handle ammonia load
during heat load remains unresolved.
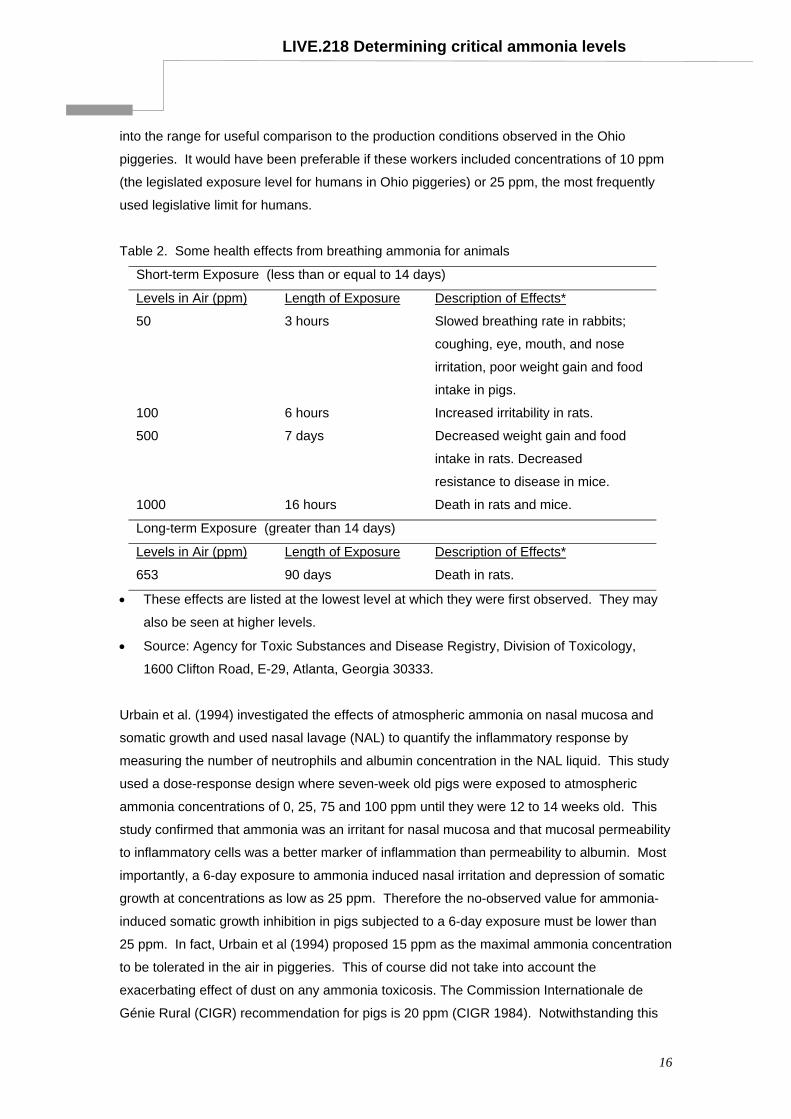
10 Effects of ammonia on livestock Gaseous ammonia is a severe respiratory tract irritant capable of inhibiting the efficiency of
the respiratory system at high levels. The health effects of breathing ammonia have been
documented in rats and are presented in Table 2. The clinical signs of respiratory
compromise developed at atmospheric ammonia from 50 ppm and greater in rats.
The type of effects in rats have been repeated in studies in pigs, poultry, calves and sheep
and will be discussed in more detail later in this review. The effects of atmospheric ammonia
on livestock have been documented mainly in pigs and poultry. However some studies have
been completed in lambs and calves. Respiratory dysfunction is the most frequently
observed sign of ammonia exposure in all species.
Drummond et al. (1978) kept young pigs in ammonia-contaminated atmospheres of either 50
ppm or 75 ppm for 2 hours during which they were also challenged with aerosol containing
bacteria. Pigs exposed to ammonia harboured 51% more bacteria in their lungs than did
control pigs. Notwithstanding the changes in bacterial load in the lungs, short exposures of
two hours at these concentrations of ammonia did not affect either production performance
or gross histopathology of the respiratory tract. However, when Drummond et al. (1980) kept
27-28 day-old pigs in high atmospheric ammonia of 0, 50, 100 or 150 ppm for longer periods
of four weeks, growth rates were significantly reduced by 12, 30, and 29% respectively in the
ammonia-exposed groups of pigs. Interestingly, pigs exposed to 50 or 100 ppm atmospheric
ammonia were more efficient converters of feed to body weight gain than were control or 150
ppm exposed pigs. So the effect of high ammonia on production parameters is not
consistent. Importantly all of these studies had 50 ppm as their lowest value for atmospheric
ammonia that is the same as the short-term exposure studies presented in Table 2.
Acute inflammatory reactions were observed in the tracheal epithelium of pigs exposed to
atmospheric ammonia of 100 and 150 ppm but not in controls or those pigs subjected to 50
ppm. From these results the inflammatory effects in pigs were not acute at atmospheric
ammonia concentrations below 100 ppm. Nevertheless, these reports from Drummond and
co-workers (1978 and 1980) should be applied with caution since the experimental design
showed serious flaws. Two-hour exposures are too brief to detect acute inflammatory
changes below 100 ppm. Moreover, atmospheric ammonia concentrations of 50, 100 and
150 ppm are inappropriate since they begin too high in range and do not extend high enough
15
LIVE.218 Determining critical ammonia levels
into the range for useful comparison to the production conditions observed in the Ohio
piggeries. It would have been preferable if these workers included concentrations of 10 ppm
(the legislated exposure level for humans in Ohio piggeries) or 25 ppm, the most frequently
used legislative limit for humans.
Table 2. Some health effects from breathing ammonia for animals
Short-term Exposure (less than or equal to 14 days)
Levels in Air (ppm) Length of Exposure Description of Effects*
50 3 hours Slowed breathing rate in rabbits;
coughing, eye, mouth, and nose
irritation, poor weight gain and food
intake in pigs.
100 6 hours Increased irritability in rats.
500 7 days Decreased weight gain and food
intake in rats. Decreased
resistance to disease in mice.
1000 16 hours Death in rats and mice.
Long-term Exposure (greater than 14 days)
Levels in Air (ppm) Length of Exposure Description of Effects*
653 90 days Death in rats.
• These effects are listed at the lowest level at which they were first observed. They may
also be seen at higher levels.
• Source: Agency for Toxic Substances and Disease Registry, Division of Toxicology,
1600 Clifton Road, E-29, Atlanta, Georgia 30333.
Urbain et al. (1994) investigated the effects of atmospheric ammonia on nasal mucosa and
somatic growth and used nasal lavage (NAL) to quantify the inflammatory response by
measuring the number of neutrophils and albumin concentration in the NAL liquid. This study
used a dose-response design where seven-week old pigs were exposed to atmospheric
ammonia concentrations of 0, 25, 75 and 100 ppm until they were 12 to 14 weeks old. This
study confirmed that ammonia was an irritant for nasal mucosa and that mucosal permeability
to inflammatory cells was a better marker of inflammation than permeability to albumin. Most
importantly, a 6-day exposure to ammonia induced nasal irritation and depression of somatic
growth at concentrations as low as 25 ppm. Therefore the no-observed value for ammonia-
induced somatic growth inhibition in pigs subjected to a 6-day exposure must be lower than
25 ppm. In fact, Urbain et al (1994) proposed 15 ppm as the maximal ammonia concentration
to be tolerated in the air in piggeries. This of course did not take into account the
exacerbating effect of dust on any ammonia toxicosis. The Commission Internationale de
Génie Rural (CIGR) recommendation for pigs is 20 ppm (CIGR 1984). Notwithstanding this
16
LIVE.218 Determining critical ammonia levels
proposal by Urbain et al. (1994), there has been no move to lower the CIGR recommendation
of 20 ppm for pigs. The major limitation in the study by Urbain et al. (1994) is the fact that
they had no value below 25 ppm for atmospheric ammonia in their dose-response range.
Therefore, this proposal for 15 ppm by Urbain et al. (1994) is not grounded in actual data from
their study. Nevertheless, this data did show that nasal lavage is a more sensitive technique
for evaluation of the effects of atmospheric ammonia than the gross or histo-pathology of
previous methods. The fact that previous studies used less sensitive methods may help to
explain some of the contradictory findings from previous studies. This is particularly so for
the no-observed-effect for atmospheric ammonia of 50ppm in pigs exposed for a period of 6
days (Gustin et al. 1994). Nevertheless, setting a no-observed-effect value for ammonia at 15
ppm for pigs has immediate and important implications. Pigs are often exposed to these
levels of atmospheric ammonia for periods much longer than 6 days under normal production
circumstance. For instance this concentration of ammonia is already exceeded either as a
mean value (17.8 ppm in the Netherlands) in piggeries holding sows on slatted floors or as a
frequently measured value in the same type of animal and housing system through Northern
Europe (Groot Koerkamp et al. 1998). In addition, ammonia levels reported for piggeries in
Ohio were well in excess of 15 ppm. Thus, any broad acceptance of 15ppm as a limit for
atmospheric ammonia would present a number of practical difficulties.
Lambs exposed to an atmosphere of 75 ppm ammonia for 28 days had lower feed conversion
efficiency than lambs in a control atmosphere (Drummond et al. 1976). Control lambs gained
an average of 90 g more liveweight per day and consumed an average of 0.68 kg less feed
(4.53 vs 5.21kg) per kg of liveweight gain compared to the ammonia-exposed lambs.
Moreover, the ammonia-exposed lambs showed clear signs of ammonia toxicosis such as
profuse lacrimation, severe coughing and sneezing, and profuse nasal discharge that at times
was bloody (Drummond et al. 1976). Clearly there was a significant effect on respiratory
function in these lambs. However, these results represent the extremes of ammonia
exposure as it is unlikely that sheep will be exposed to levels of ammonia as high as 75 ppm
for the extended 28-day period as in the Drummond study.
Dewes and Goodall (1995) reported some preliminary studies on the possible relationship
between ammonia production from soiled bedding in calf rearing sheds and calf illness. This
was a limited field study on six farms, where death rates were high (10% and 13.5%) on two
properties. Atmospheric ammonia was not measured directly in this study but was
determined in vitro. The progression of clinical signs in calves continuously exposed to
ammonia for a few days were languid habit, rapid breathing, noticeable coughing on hot days,
shedding of tears, reduced feed consumption, diminished social behaviour and cessation of
weight gain. On post-mortem, histological changes showed that small airways were
destroyed. Their findings from histopathology supported a diagnosis of subacute purulent
17
LIVE.218 Determining critical ammonia levels
pneumonia with distal necrotising bronchiolitis. Interestingly, these authors concluded that
ammonia did not pass in any significant quantity between the aveolar epithelium and the
plasma. They reported a plasma ammonia concentration of 29mM, much less than the 50mM
recorded for humans. Plasma ammonia concentrations are difficult to interpret as they
represent the flux and outflow of ammonia from the rumen, and the hepatic clearance of
ammonia through the urea cycle. In some studies an inverse relationship between ruminal
ammonia and plasma ammonia has been recorded (Leadbetter 1997). The relationship
between atmospheric ammonia and plasma ammonia is even less clear. While it would be
worth investigating the relationship between atmospheric and plasma ammonia, it is unlikely
that plasma ammonia concentration would be a good indicator of atmospheric ammonia load.
The effects of atmospheric ammonia in feedlots have not been quantified in terms of loss of
cattle production. However, the concentrations of ammonia have been measured in feedlots
in Eastern Australia (FLOT.317 2003). Ammonia generation from pen surfaces was directly
affected by temperature, with higher ammonia levels measured during the warmer parts of the
day. Little difference was noted between ammonia levels recorded at a height of 1 metre
within the shaded and unshaded pens. This was attributed to the dry weather conditions
experienced during the ammonia measurements. Higher ammonia concentrations were
noted at lower heights (less than 0.3 m above surface) in the moister areas under shade
compared to the unshaded pens. A clear profile of ammonia concentrations existed above
the pen surface. Peak concentrations were found to be in the order of 12 to 16 ppm when
measured at a height of 1 metre above the surface even a quite high ambient temperatures
(FLOT.317 2003). These peak values are less than the human TWA and are of the order of
the no-observable effect for piggeries (15 ppm) recommended by Urbain et al (1994). So it is
reasonable to conclude that atmospheric ammonia values of 12 to 16 ppm, while pungent,
would not present any observable disturbance to the respiratory system of these cattle.
However, peak concentrations measured at a height of 0.3 metres were 25 to 30 ppm for 30
minutes of measurement from 1300 to 1330h in an unshaded pen on January 22nd 2002
(FLOT.317 2003). These concentrations are at or above the human TWA for ammonia
concentration but were only sustained for relatively short periods. However, there is no
associative study of any potentially harmful effects of these concentrations of ammonia on
cattle. What is noteworthy is that this height (0.25m) would be the height of the feed and
water troughs. Grazing cattle split a 24-hour day into roughly equal parts of grazing,
ruminating and sleeping. If cattle in feedlots follow a pattern where large amounts of time are
spent eating and drinking then they would be exposed to relatively higher concentrations of
atmospheric ammonia. It is unknown whether the pungency of ammonia affects feed or water
intake and, more importantly, whether there is a chronic effect of atmospheric ammonia on
the respiratory system of cattle in feedlots.
18
LIVE.218 Determining critical ammonia levels
11 Major health problems during live export and in feedlots Norris et al. (2000, 2003) surveyed cattle deaths during sea transport from Australia from
1995 to 2000. Although death rates were generally low for cattle during sea transport, the
highest rates were recorded from the major southern ports of Fremantle, Adelaide and
Portland. Monthly death rates varied with season with rates being much higher from April to
July from southern ports. The highest death rates overall occurred on vessels destined for the
Middle East and north Africa. A significant proportion of these deaths (17%) occurred on a
small number of voyages (2.6%) (Norris et al. 2000, 2003). The main cause of death during
sea transport was heat stroke, with Bos taurus cattle more susceptible than Bos indicus cattle
(Norris et al. 2003). Heat stroke could be exacerbated by chronic exposure to atmospheric
ammonia at levels such as 15 ppm frequently observed during voyages (SBMR.002, 2001).
Trauma was another significant cause of death but this appeared to be confined mostly to one
voyage (Norris et al. 2003).
In an earlier report by Norris et al. (2000), a very high proportion of the death rates (32% in
voyage 1 and 22% in voyage 2) were associated with the pneumonia that was severe,
subacute and characteristic of Mannheimia (Pasteurella) multocida and M. haemolytica.
However, in the later report by Norris et al. (2003), respiratory disease figured less
prominently in the causes of death after heat stroke and trauma. Nevertheless, fibrinous
pneumonia and pleuro-pneumonia accounted for 28 out of 34 respiratory disease deaths. The
gross and histopathology was consistent with typical involvement of Mannheimia (Pasteurella)
multocida and M. haemolytica. Mannheimia species are frequently isolated from the upper
respiratory tract of cattle (Rheinberger 2000). The presence of these bacteria in the
respiratory tract does not of itself induce pneumonia unless the innate defenses of the lung
have been compromised. In fact, Mannheimia multocida is part of the mycoplasma-induced
respiratory disease complex (MIRD) and even though P. multocida is often isolated from
pneumonia, some damage to the respiratory system is usually required for it to invade and
infect. Therefore, development of full pneumonia is often contingent on other factors
aggravating the lung. During sea transport of cattle, the prime candidates amongst the other
factors would be the level of atmospheric ammonia, and the extent of dust in the environment.
High temperature, humidity, ammonia and dust are all present as factors during sea transport.
For instance if air is not conditioned in the upper respiratory tract, then cilia on the lower
respiratory tract become dry and cease to function (Rheingberger 2000). The conditions for
drying of the upper respiratory tract can occur in cattle under thermal stress for extended
periods during sea transport to the Middle East and north Africa. The main function of the
19
LIVE.218 Determining critical ammonia levels
ciliated cells is to propel the tracheobronchial secretions towards the pharynx as part of the
“mucociliary escalator”. This is part of the non-inflammatory defense directed towards
prevention of pathogen adherence. Coughing is one of two components of the physical
defense mechanism to eliminate particulate matter such as dust. Ciliated cells reach down to
the respiratory bronchioles. At the terminal bronchii and alveoli, macrophages play an
important role in clearing inhaled particles. Thus macrophages play an important role in
killing and clearing bacteria that have gained entry to the alveoli. Complement and
neutrophils make up that second line of defense. Boyd et al. (1944) found that the naso-
bucco-pharynx acted as a filter for ammonia by absorbing significant amounts of ammonia
thereby protecting the trachea and bronchi but not the small bronchioles and aveoli. If this is
so, then ammonia could affect this second line of cell mediated immunity associated with
macrophages, neutrophils and complement. Exposure to atmospheric ammonia may be a
chronic irritant to airway receptors and may therefore be a key factor in the development of
pneumonia during sea transport.
Confirmation that ammonia can act as one of the primary agents for subsequent MIRD
infection remains a controversial issue. Andreasen et al. (1994) conducted two experiments
in pigs. In the first experiment, pigs were exposed to 5 and 50 ppm ammonia for 59 days
during which time they were also challenged with aerosol containing M. multocida. In this
experiment none of the pigs developed pneumonia. In the second experiment, pigs were
exposed to <5, 50 and 100 ppm ammonia for 59 days during which time they were challenged
with M. multocida. Pigs in the 50 and 100 ppm ammonia-exposed groups did show clinical
signs of pneumonia (coughing and dyspnea) but did not show a dose-dependent increase in
signs. However, there was no difference in rates that M. multocida was re-isolated from the
three groups: 5/17 (<5 ppm), 2/10 (50 ppm) and 3/10 (100 ppm) even though the lesions were
more extensive in the groups exposed to the high ammonia levels. This is not surprising in
the case of pigs exposed at < 5ppm because M. multicoda is probably a normal resident of
nasal passages. Andreasen et al. concluded that ammonia per se was unable to induce the
required damage for M. multocida to invade and infect the lungs in pigs. On the other hand
they also concluded that ammonia increased the extent of pneumonia lesions caused by the
MIRD complex but not in a dose-dependent manner. These studies in pigs did not resolve
the issue given the poorer capacity of bovine lung anatomically, physiologically and possibly
immunologically to meet challenges from ammonia.
In feedlot production systems, the point of entry of cattle is the critical time for health
problems in cattle. Feedlots are a stressful environment for cattle because of transit to the
feedlot, mixing of different groups of cattle, admission procedures, introduction to new forms
of feed and ingredients in feeds, and new water supplies. Respiratory diseases are the most
prevalent health problem in the first three to six weeks in the feedlot (Kelly and Janzen 1986,
20
LIVE.218 Determining critical ammonia levels
Dunn et al., 2000, Sullivan 2000). Bovine respiratory disease (BRD) is the most common
diagnosis. The viruses commonly associated with BRD are: bovine herpesvirus 1, bovine
parainfluenza 3 virus (PI3), bovine viral diarrhoea virus (BVDV), and bovine respiratory
syncytial virus (BRSV). The bacteria associated with BRD in feedlot cattle, including
Mannheimia haemolytica, Mannheimia multocida, (both of these were also isolated from cattle
during live export), Haemophilus somnus and Actinomyces pyogenes, are not often primary
pathogens in healthy unstressed cattle. It is important to remember that BRD is a complex,
multifactorial and not completely defined disease. Therefore diagnosis, management and
prevention are all aimed at controlling BRD in feedlot cattle. However, it is unlikely that
atmospheric ammonia would build up to levels that would exacerbate BRD during the entry
period. On the other hand, atmospheric ammonia does increase in feedlots with time on feed
(FLOT.317, 2003). The specific health effects of atmospheric ammonia in cattle during
feedlot are not documented.
Moreover, the effect of chronic exposure to atmospheric ammonia levels of 15 ppm or more
commonly observed during voyages must be evaluated in the aetiology of heat stress in cattle
during sea transport (Norris et al. 2000, 2003). Ammonia can exacerbate hyperthermia either
directly through its direct action on respiration and the airway receptors or indirectly through
ammonia disturbing the acid-base balance of animals. Cooling during hyperthermia occurs in
significant measure through increased respiratory rate (in addition to sweating through the
skin) in cattle, and is almost solely through increased respiratory rate in sheep. Ammonia
directly decreases respiratory rate in animals, which will obviously work against respiratory
cooling. Moreover, ammonia can induce secondary metabolic alkalosis through the direct
effect of NH4OH on pH. Metabolic alkalosis is a primary acid-base disorder that causes the
plasma bicarbonate to rise to a level higher than normal. The effect on respiration is
hypoventilation, ie a decrease in respiratory rate. The severity of a metabolic alkalosis is
determined by the difference between the actual [HCO3-] and the expected [HCO3
-].
Secondary or compensatory processes that cause an elevation in plasma bicarbonate should
not be confused with the primary processes. An elevation in bicarbonate occurring in
response to a chronic respiratory acidosis should be referred to as a 'compensatory response'
and never as a ‘secondary metabolic alkalosis’. The literature will often refer to a
'compensated metabolic alkalosis' as a 'metabolic alkalosis with a (secondary) respiratory
acidosis'. This is wrong as the hypoventilation is a compensatory process and does not
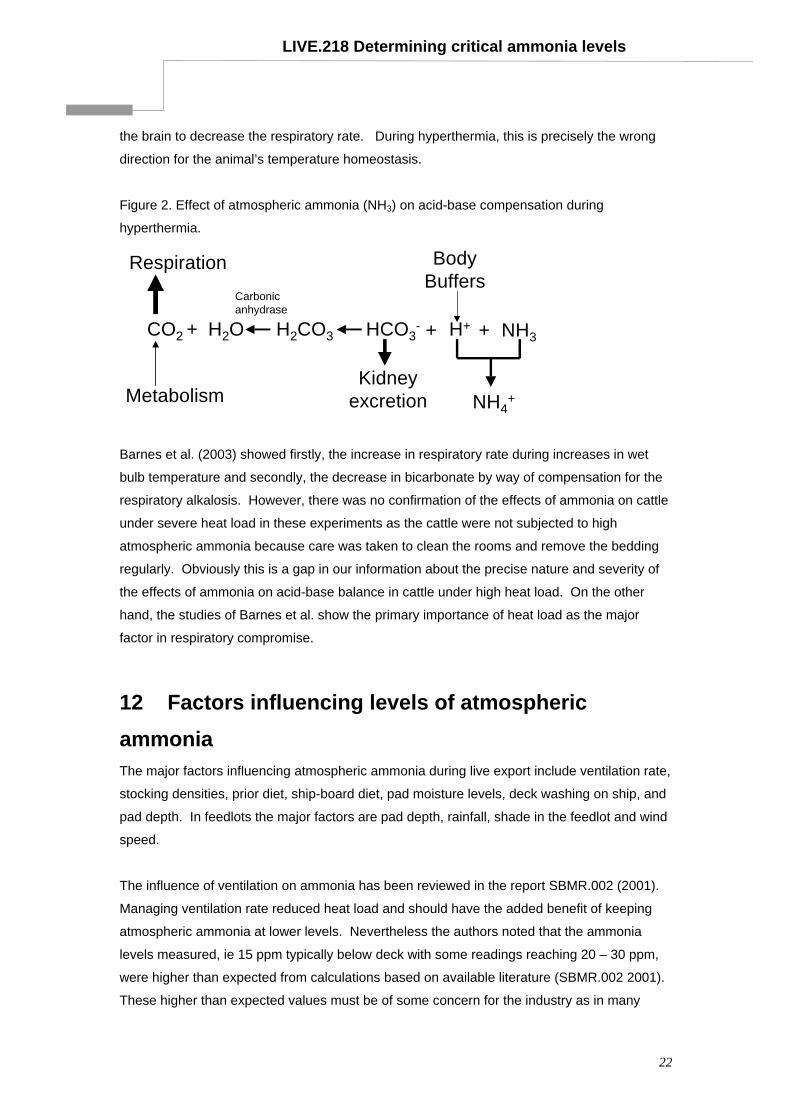
indicate any primary respiratory problem. In fact, atmospheric ammonia combining with the
moisture in the respiratory tract will further decrease the hydrogen ion concentration by pulling
H+ into NH4+ as shown in Figure 2. Removing H+ from the body buffer system will continue
the alkalosis in face of any compensating loss in bicarbonate ions through kidney excretion,
and loss of bicarbonate through ventilation. Thus the acid-base system in the animal will not
be compensating, and the lower H+ will act directly through the respiratory control centre in
21
LIVE.218 Determining critical ammonia levels
the brain to decrease the respiratory rate. During hyperthermia, this is precisely the wrong
direction for the animal’s temperature homeostasis.
Figure 2. Effect of atmospheric ammonia (NH3) on acid-base compensation during
hyperthermia.
CO2 H2O H2CO3 HCO3- H++ +
Respiration
Metabolism
Carbonicanhydrase
BodyBuffers
Kidneyexcretion
NH3+
NH4+
Barnes et al. (2003) showed firstly, the increase in respiratory rate during increases in wet
bulb temperature and secondly, the decrease in bicarbonate by way of compensation for the
respiratory alkalosis. However, there was no confirmation of the effects of ammonia on cattle
under severe heat load in these experiments as the cattle were not subjected to high
atmospheric ammonia because care was taken to clean the rooms and remove the bedding
regularly. Obviously this is a gap in our information about the precise nature and severity of
the effects of ammonia on acid-base balance in cattle under high heat load. On the other
hand, the studies of Barnes et al. show the primary importance of heat load as the major
factor in respiratory compromise.
12 Factors influencing levels of atmospheric ammonia The major factors influencing atmospheric ammonia during live export include ventilation rate,
stocking densities, prior diet, ship-board diet, pad moisture levels, deck washing on ship, and
pad depth. In feedlots the major factors are pad depth, rainfall, shade in the feedlot and wind
speed.
The influence of ventilation on ammonia has been reviewed in the report SBMR.002 (2001).
Managing ventilation rate reduced heat load and should have the added benefit of keeping
atmospheric ammonia at lower levels. Nevertheless the authors noted that the ammonia
levels measured, ie 15 ppm typically below deck with some readings reaching 20 – 30 ppm,
were higher than expected from calculations based on available literature (SBMR.002 2001).
These higher than expected values must be of some concern for the industry as in many
22
LIVE.218 Determining critical ammonia levels
instances the atmospheric ammonia concentration was higher than allowable limits for animal
housing in Europe.
The diets provided for cattle are formulated for palatability and sustained productivity during
sea transport. Most formulations are based on straw because it is chemically consistent and
available in large quantities. As a result of using straw, the grain component of the rations
must have high energy and protein density and therefore comprise mainly barley and lupins,
both of which contain a high proportion of rumen degradable protein especially when they
have been ground for production of pellets. High levels of rumen degradable protein can lead
to high rumen ammonia concentrations that cross the rumen wall and are detoxified as urea
in the liver. This leads to a high output of urinary nitrogen. The urea component of urinary
nitrogen completes the cycle and forms the basis of high atmospheric ammonia during sea
transport. Reformulating these rations using better quality roughage such as cereal hays that
are also lower in nitrogen than lucerne hay decreases the urinary nitrogen output in a cost-
effective manner. In addition using ingredients with lower rumen degradable protein such as
canola meal also reduces the potential nitrogen substrate for atmospheric ammonia. This
type of comparison was tested by Accioly et al. (2002) who fed the following diets shown in
Table 3.
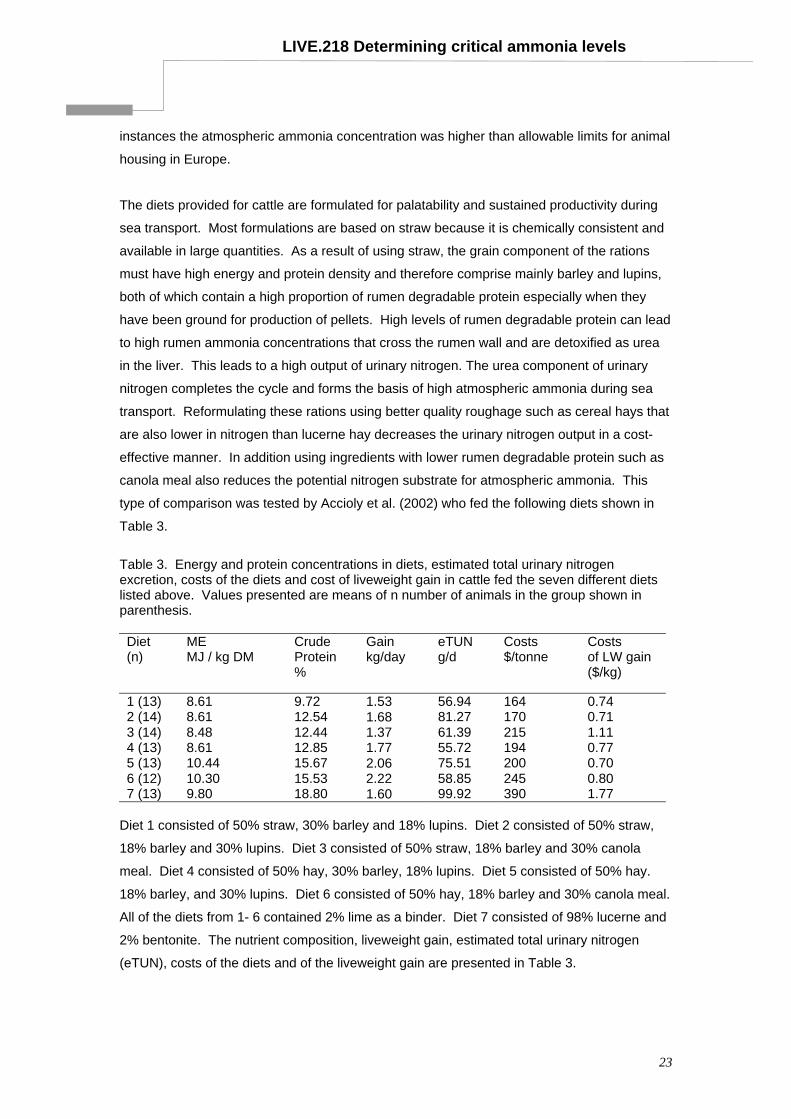
Table 3. Energy and protein concentrations in diets, estimated total urinary nitrogen excretion, costs of the diets and cost of liveweight gain in cattle fed the seven different diets listed above. Values presented are means of n number of animals in the group shown in parenthesis. Diet (n)
ME MJ / kg DM
Crude Protein %
Gain kg/day
eTUN g/d
Costs $/tonne
Costs of LW gain ($/kg)
1 (13) 8.61 9.72 1.53 56.94 164 0.74 2 (14) 8.61 12.54 1.68 81.27 170 0.71 3 (14) 8.48 12.44 1.37 61.39 215 1.11 4 (13) 8.61 12.85 1.77 55.72 194 0.77 5 (13) 10.44 15.67 2.06 75.51 200 0.70 6 (12) 10.30 15.53 2.22 58.85 245 0.80 7 (13) 9.80 18.80 1.60 99.92 390 1.77
Diet 1 consisted of 50% straw, 30% barley and 18% lupins. Diet 2 consisted of 50% straw,
18% barley and 30% lupins. Diet 3 consisted of 50% straw, 18% barley and 30% canola
meal. Diet 4 consisted of 50% hay, 30% barley, 18% lupins. Diet 5 consisted of 50% hay.
18% barley, and 30% lupins. Diet 6 consisted of 50% hay, 18% barley and 30% canola meal.
All of the diets from 1- 6 contained 2% lime as a binder. Diet 7 consisted of 98% lucerne and
2% bentonite. The nutrient composition, liveweight gain, estimated total urinary nitrogen
(eTUN), costs of the diets and of the liveweight gain are presented in Table 3.
23
LIVE.218 Determining critical ammonia levels
Urinary nitrogen excretion was significantly lower in cattle fed diets based on cereal hay
rather than straw even at higher dietary protein percentages (diet 2 vs 5, Table 3). Moreover,
canola meal significantly reduced urinary nitrogen excretion at the same dietary protein
content as lupins (Diet 5 vs 6 Table 3). Thus there is significant scope for reformulating
rations for cattle with the aim of reducing atmospheric ammonia. In addition, the higher cost
of moving in this direction of reducing ammonia levels can be offset by cost-effective
liveweight gain during sea transport (Table 3).
Current live export diets can result in a urinary pH around 8.0 that is a contributing factor to
atmospheric ammonia through the chemistry of ammonia/ ammonium equilibrium that favours
ammonia volatilisation.
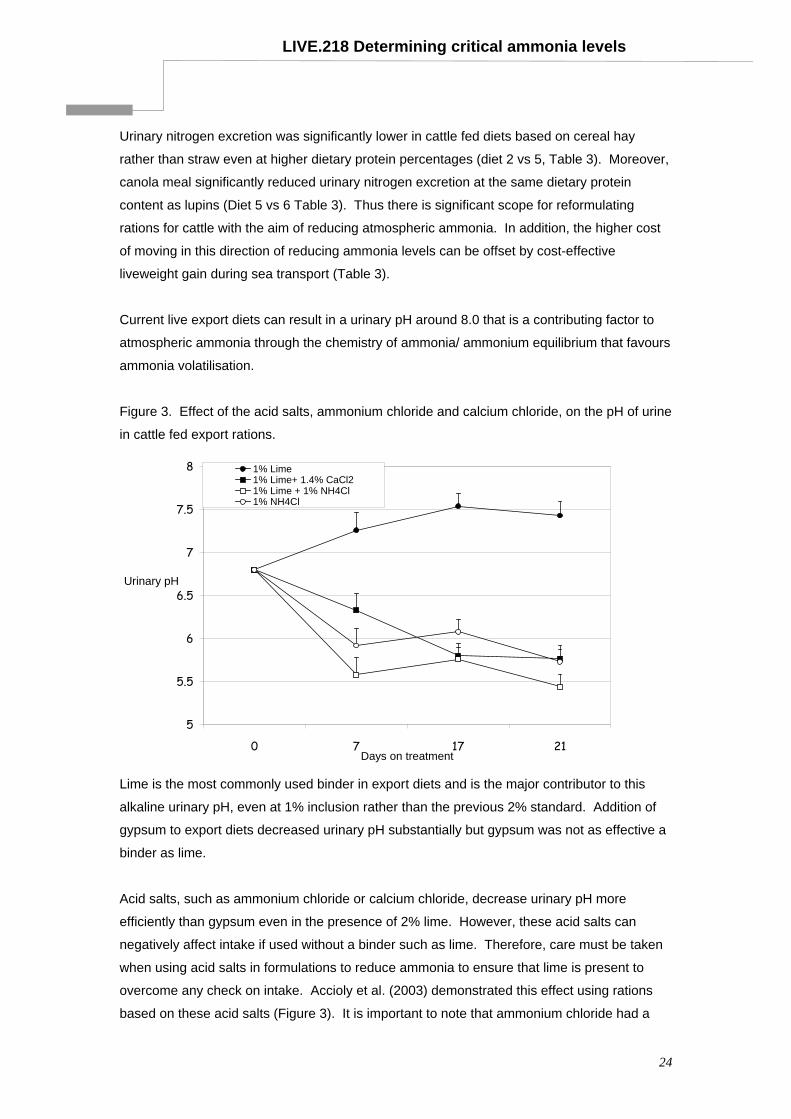
Figure 3. Effect of the acid salts, ammonium chloride and calcium chloride, on the pH of urine
in cattle fed export rations.
5
5.5
6
6.5
7
7.5
8
0 7 17 21Days on treatment
Urinary pH
1% Lime1% Lime+ 1.4% CaCl21% Lime + 1% NH4Cl1% NH4Cl
Lime is the most commonly used binder in export diets and is the major contributor to this
alkaline urinary pH, even at 1% inclusion rather than the previous 2% standard. Addition of
gypsum to export diets decreased urinary pH substantially but gypsum was not as effective a
binder as lime.
Acid salts, such as ammonium chloride or calcium chloride, decrease urinary pH more
efficiently than gypsum even in the presence of 2% lime. However, these acid salts can
negatively affect intake if used without a binder such as lime. Therefore, care must be taken
when using acid salts in formulations to reduce ammonia to ensure that lime is present to
overcome any check on intake. Accioly et al. (2003) demonstrated this effect using rations
based on these acid salts (Figure 3). It is important to note that ammonium chloride had a
24
LIVE.218 Determining critical ammonia levels
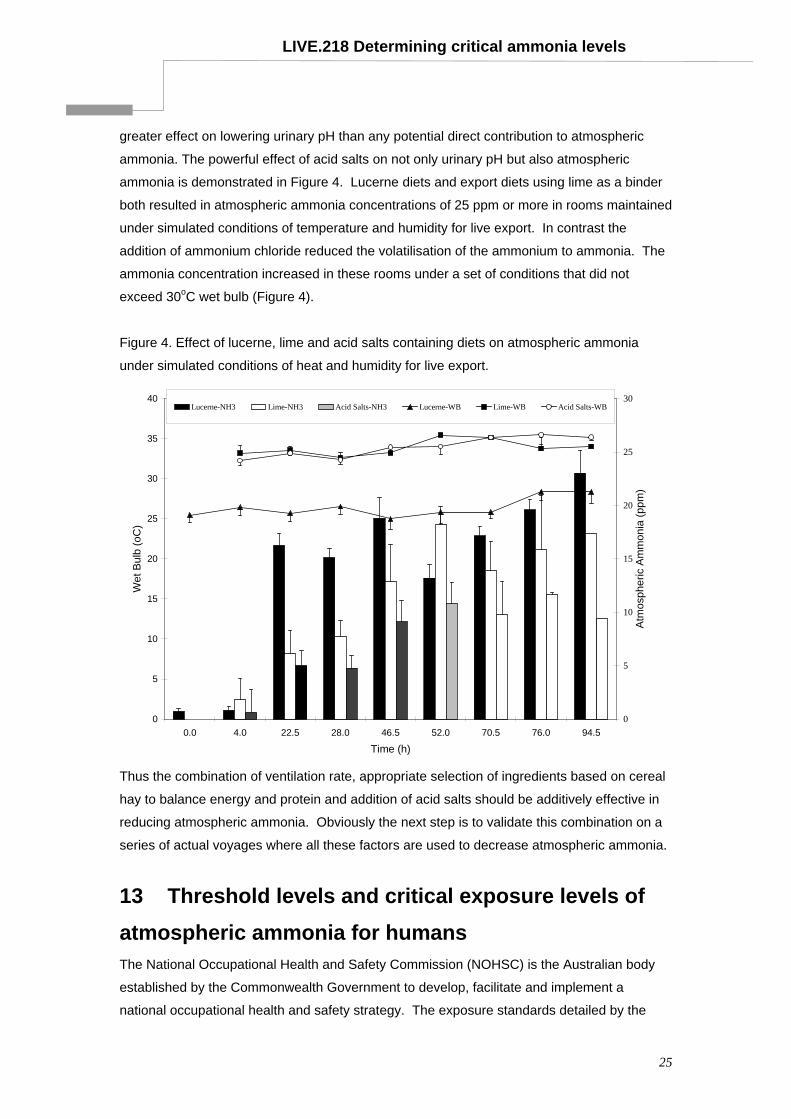
greater effect on lowering urinary pH than any potential direct contribution to atmospheric
ammonia. The powerful effect of acid salts on not only urinary pH but also atmospheric
ammonia is demonstrated in Figure 4. Lucerne diets and export diets using lime as a binder
both resulted in atmospheric ammonia concentrations of 25 ppm or more in rooms maintained
under simulated conditions of temperature and humidity for live export. In contrast the
addition of ammonium chloride reduced the volatilisation of the ammonium to ammonia. The
ammonia concentration increased in these rooms under a set of conditions that did not
exceed 30oC wet bulb (Figure 4).
Figure 4. Effect of lucerne, lime and acid salts containing diets on atmospheric ammonia
under simulated conditions of heat and humidity for live export.
0
5
10
15
20
25
30
35
40
0.0 4.0 22.5 28.0 46.5 52.0 70.5 76.0 94.5
Time (h)
Wet
Bul
b (o
C)
0
5
10
15
20
25
30
Atm
osph
eric
Am
mon
ia (p
pm)
Lucerne-NH3 Lime-NH3 Acid Salts-NH3 Lucerne-WB Lime-WB Acid Salts-WB
Thus the combination of ventilation rate, appropriate selection of ingredients based on cereal
hay to balance energy and protein and addition of acid salts should be additively effective in
reducing atmospheric ammonia. Obviously the next step is to validate this combination on a
series of actual voyages where all these factors are used to decrease atmospheric ammonia.
13 Threshold levels and critical exposure levels of atmospheric ammonia for humans The National Occupational Health and Safety Commission (NOHSC) is the Australian body
established by the Commonwealth Government to develop, facilitate and implement a
national occupational health and safety strategy. The exposure standards detailed by the
25
LIVE.218 Determining critical ammonia levels
NOHSC represent airborne concentrations of ammonia that, according to current knowledge,
should neither impair the health of nor cause undue discomfort to ‘nearly all workers’
(NOHSC:1003 1995). The exposure standards apply to long-term exposure to a substance
over an eight-hour day, for a five-day week, over an entire working life. It is important to note
that exposure standards do not represent ‘no-effect’ levels that guarantee protection to every
worker. Following on from this, exposure standards are not fine dividing lines between
satisfactory and unsatisfactory working conditions or safe levels. However, exposure
standards are indicative of where and when appropriate control measures are required.
The Australian (NOHSC:1003 (1995)), American (OHSA, 1989), Canadian (Canadian Centre
for Occupational Health and Safety 2001) and UK (Groot Hoerkamp et al. 1998) occupational
health and safety authorities list the following limits for exposure to atmospheric ammonia.
Humans can smell ammonia when the concentration exceeds 0.6 ppm (Canadian Centre for
Occupational Health and Safety 2001). The threshold limit value time-weighted average (TLV-
TWA) is 25 ppm over an eight-hour working shift. This limit on exposure recorded as
protective against irritation to the eyes and the respiratory tract and minimizes discomfort. On
the other hand, volunteers noticed nose and throat irritation at 24 ppm (Luttrell 2002). The
threshold limit value for short-term exposure limit (TLV-STEL) and permissible exposure
short-term exposure limit (PEL-STEL) are both 35 ppm. The permissible exposure limit time-
weighted average (PEL-TWA) is 50 ppm. Groups of 5 and 6 human subjects were exposed
to respective ammonia concentrations of 30 and 50 ppm (Luttrell 2000). The volunteers
subjectively rated irritation for the 10-minute exposures. No moderate or higher irritation was
reported from the group at the lower exposure; however four out of 6 people reported
moderate nose and throat irritation at 50 ppm (Luttrell 2002). The threshold for
bronchoconstriction, determined as a 20% increase in airway resistance, was 85 ppm
following 10 breaths of ammonia via a mouthpiece (Douglas and Coe, 1987). The immediate
dangerous to life and health (IDLH) concentration for ammonia is 300 ppm (Luttrell 2002).
Death of humans has occurred following a 5-minute exposure to 5000 ppm (Canadian Centre
for Occupational Health and Safety 2001).
Notwithstanding this consensus on ammonia standards in many countries including Australia,
the TLV-TWA limit is lower [ie 10 ppm for stockmen] in Sweden (The National Swedish Board
of Occupational Safety and Health 1990). This lower limit for Sweden is not justified either
from survey results or on longer working hours than the standard 8-hour, five-day week
accepted for other countries.
The Australian Government’s Department of the Environment and Heritage maintains a
National Pollutant Inventory that includes atmospheric ammonia. On a relative health hazard
spectrum of 0 – 3 ammonia registers as 1.0. A score of 3 represents a very high hazard to
26
LIVE.218 Determining critical ammonia levels
health, 2 represents a medium hazard and 1 is harmful to health. A substance that scores a
relatively high health hazard is arsenic at 2.3, and ammonia is one of the lowest at 1.0. While
the relative health hazard takes inot account ammonia’s toxicity it does not take into account
exposure to ammonia. Human exposure is reflected in National Pollutant Inventory (NPI)
rank given to a substance. Approximately 400 substances were considered for inclusion on
the NPI reporting list. A risk rating is given based on health and environment hazard
identification, and human and atmospheric exposure to the substance. Some substances are
grouped together at the same rank with 208 ranks in total. Ammonia is ranked as 45 out of
the 208 ranks which places it in approximately the bottom 25% of the NPI ranks.
It is important to reiterate the ammonia concentrations reported in the investigation of the
ventilation efficiency on livestock vessel (SBMR.002, 2001): “Typical levels below decks were 15
ppm with readings commonly reaching 20 – 30 ppm”. Therefore, typical values of atmospheric
ammonia on livestock vessels are below the TWA for humans. However, concentrations above
the TWA ie 30 ppm, are commonly reached which is a cause for concern. Of more concern, and
need for action, are the circumstances where the STEL concentration of 35 ppm is exceeded. In
feedlots, the values for atmospheric ammonia of 25 – 30 ppm are also a concern for workers in
feedlots who might be working near feed or water troughs.
14 Symptoms of ammonia toxicity and mode of action of ammonia in humans The symptoms in humans exposed to atmospheric ammonia are summarised in Table 4. The
route of entry of ammonia is most likely to be inhalation, or through the eyes and skin.
Ammonia is severely irritating to the nose, throat and lungs in humans. Symptoms of
ammonia inhalation include burning sensations, coughing, wheezing, shortness of breath,
headache and nausea. Overexposure to atmospheric ammonia is toxic to the central nervous
system with signs including unconsciousness and convulsions. Upper airway damage is
more likely and can result in bronchospasm (closing of the airway). Vocal chords are
particularly vulnerable to corrosive effects at high concentrations. Lower airway damage may
result in fluid build up and haemorrhage. Underlying conditions aggravated by exposure to
ammonia include asthma, emphysema, dermatitis and eye disease. Nevertheless, repeated
exposure to ammonia may develop a tolerance (or acclimatisation) to irritating effects after a
few weeks (Canadian Centre for Occupational Health and Safety 2001). Even after long-term
exposure, ammonia is not a carcinogen or likely carcinogen.
27
LIVE.218 Determining critical ammonia levels
Table 4 Human Health Effects from Breathing Ammonia
Short-term Exposure (less than or equal to 14 days)
Levels in Air (ppm) Length of Exposure Description of Effects*
0.5 Minimal risk level.
50 Less than 1 day Slight, temporary eye and
throat irritation and urge
to cough.
500 30 minutes Increased air intake into
lungs; sore nose and
throat.
5000 Less than 30 minutes Kills quickly.
Long-term Exposure (greater than 14 days)
Levels in Air (ppm) Length of Exposure Description of Effects*
0.3 Minimal risk level
100 6 weeks Eyes, nose and throat
irritation.
*These effects are listed at the lowest level at which they were first observed. They may also
be seen at the higher levels.
Source: Agency for Toxic Substances and Disease Registry, Division of Toxicology, 1600
Clifton Road, E-29, Atlanta, Georgia 30333
15 Critical levels of atmospheric ammonia at which animal symptoms appear and affect performance. The critical value of atmospheric ammonia where cattle welfare and production is adversely
affected should be set at 25 ppm, ie the same as the general TWA for humans and higher
than the 20 ppm European standard for pig housing systems (CIGR 1984). This is achievable
under current production systems as noted in previous reports (SBMR.002, 2001). It is
important to remember that the TWA of 25 ppm for humans is set for regular exposures of 8
to 10 hours maximum, repeated each day for five days. For the majority of the day, such
persons reside in low or no-ammonia environments. However, the level of 25 ppm for
humans is already under review. Sweden has declared a lower TWA of 10 ppm for
agricultural workers notwithstanding the lack of evidence in support of this level. During sea
transport to some overseas markets, cattle are continuously exposed to environments where
ammonia can be 25 ppm or more for at least five, and frequently over 10 days. This means
that cattle during sea transport are exposed to far higher concentrations of atmospheric
ammonia than those measured in most production systems for ruminants in Europe (0 to 8
28
LIVE.218 Determining critical ammonia levels
ppm), and these levels of exposure occur at higher temperatures and humidity than any
measured in Europe or north America. In feedlots in Australia, the TWA for humans can be
exceeded for parts of the day. Given that the TWA is set for at least 8-hours per day, then
atmospheric ammonia values in excess of 25 ppm for short periods should not be an
occupational health concern for humans. However, cattle present a different problem since
they are in this type of atmosphere for longer.
Pigs should have a greater resistance to disease at higher levels of ammonia than cattle
because of the better anatomical structure of their respiratory system. An explanation for this
difference is the poor capacity and response to infection of the bovine (and ruminant)
respiratory system. As part of one of the most effective dose-response studies in pigs, Urbain
et al. (1994) proposed 15 ppm as the maximal ammonia concentration to be tolerated in the
air of pig buildings. During this study, the temperature was 23.7 ± 0.5 oC and the relative
humidity was around 75% which equates to a wet bulb temperature of between 19.8 to 20.8 oC, ie much lower than the wet bulb temperatures during sea transport to the Middle East.
The mean dust concentration was approximately 7 x 10⁶ ± 2 x 10⁶ particles/m3. However, the
authors added a cautionary note that this recommendation of 15 ppm did not take into
account the fact that the effects of ammonia can be enhanced by dust. It is important to note
that not only did Urbain et al. (1994) adopt a more appropriate dose-response range than
most studies, but they also developed a new, more sensitive method for assessment of
ammonia-induced inflammatory response in defining 15ppm as a new no-effect level for
atmospheric ammonia. Nevertheless, they did not have a value below 25 ppm in their range,
so they cannot state with any certainty that 15 ppm is more appropriate than 25 ppm, only
that at 25 ppm they did observe inflammatory responses in pigs.
The rates of ammonia generated by sheep during sea transport assessed on either a m3/s or
mg/h basis are the same as cattle when measured on the same units of live weight
(SBMR.002, 2001). It is unlikely that sheep or goats are going to be qualitatively or
quantitatively different to cattle in their respiratory responses to ammonia. Therefore, the
same critical value for atmospheric ammonia of 25 ppm should be applied to sheep and
goats.
Adopting 25 ppm as a critical level for atmospheric ammonia for ruminants has the advantage
of being in line with most of the North American, British and Australian standards for humans.
Moreover, this level is more conservative than the European standards for humans and
livestock since these are set at lower levels of atmospheric ammonia concentration.
Moreover, this is an achievable level for atmospheric ammonia for sea transport systems and
feedlots. Setting critical atmospheric ammonia at 25 ppm will maintain the welfare and well-
29
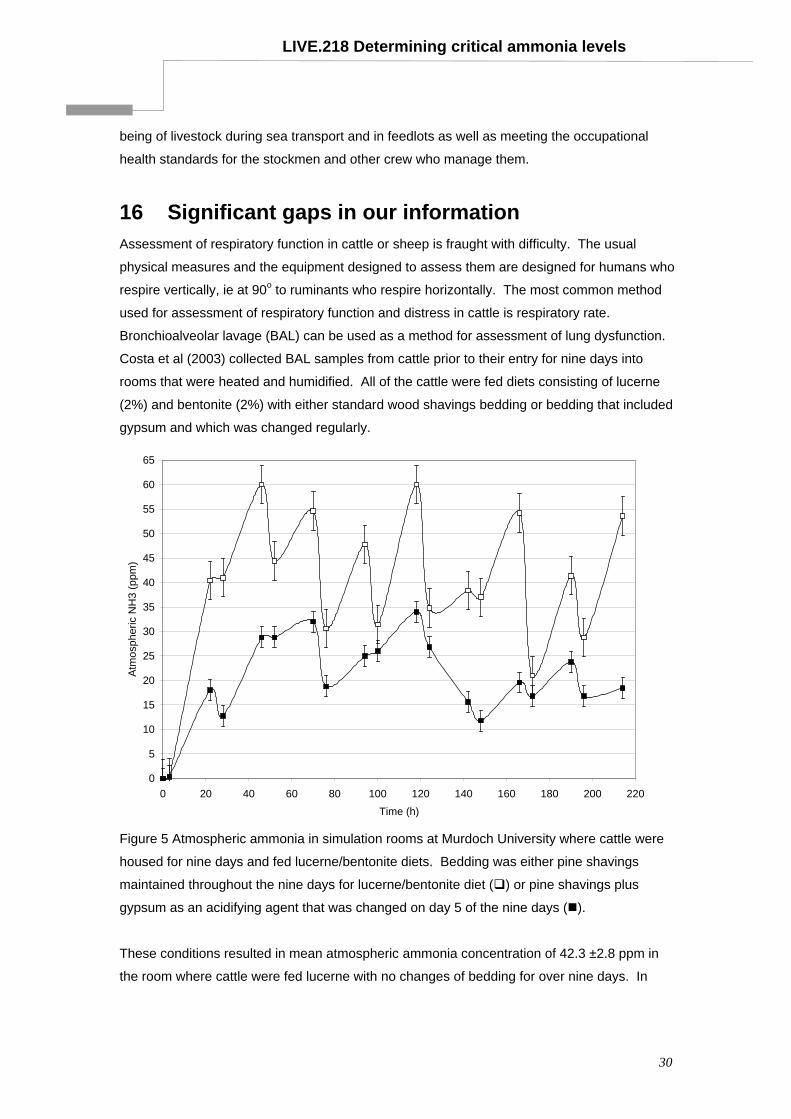
LIVE.218 Determining critical ammonia levels
being of livestock during sea transport and in feedlots as well as meeting the occupational
health standards for the stockmen and other crew who manage them.
16 Significant gaps in our information Assessment of respiratory function in cattle or sheep is fraught with difficulty. The usual
physical measures and the equipment designed to assess them are designed for humans who
respire vertically, ie at 90o to ruminants who respire horizontally. The most common method
used for assessment of respiratory function and distress in cattle is respiratory rate.
Bronchioalveolar lavage (BAL) can be used as a method for assessment of lung dysfunction.
Costa et al (2003) collected BAL samples from cattle prior to their entry for nine days into
rooms that were heated and humidified. All of the cattle were fed diets consisting of lucerne
(2%) and bentonite (2%) with either standard wood shavings bedding or bedding that included
gypsum and which was changed regularly.
0
5
10
15
20
25
30
35
40
45
50
55
60
65
0 20 40 60 80 100 120 140 160 180 200 220Time (h)
Atm
osph
eric
NH
3 (p
pm)
Figure 5 Atmospheric ammonia in simulation rooms at Murdoch University where cattle were
housed for nine days and fed lucerne/bentonite diets. Bedding was either pine shavings
maintained throughout the nine days for lucerne/bentonite diet ( ) or pine shavings plus
gypsum as an acidifying agent that was changed on day 5 of the nine days ( ).
These conditions resulted in mean atmospheric ammonia concentration of 42.3 ±2.8 ppm in
the room where cattle were fed lucerne with no changes of bedding for over nine days. In
30
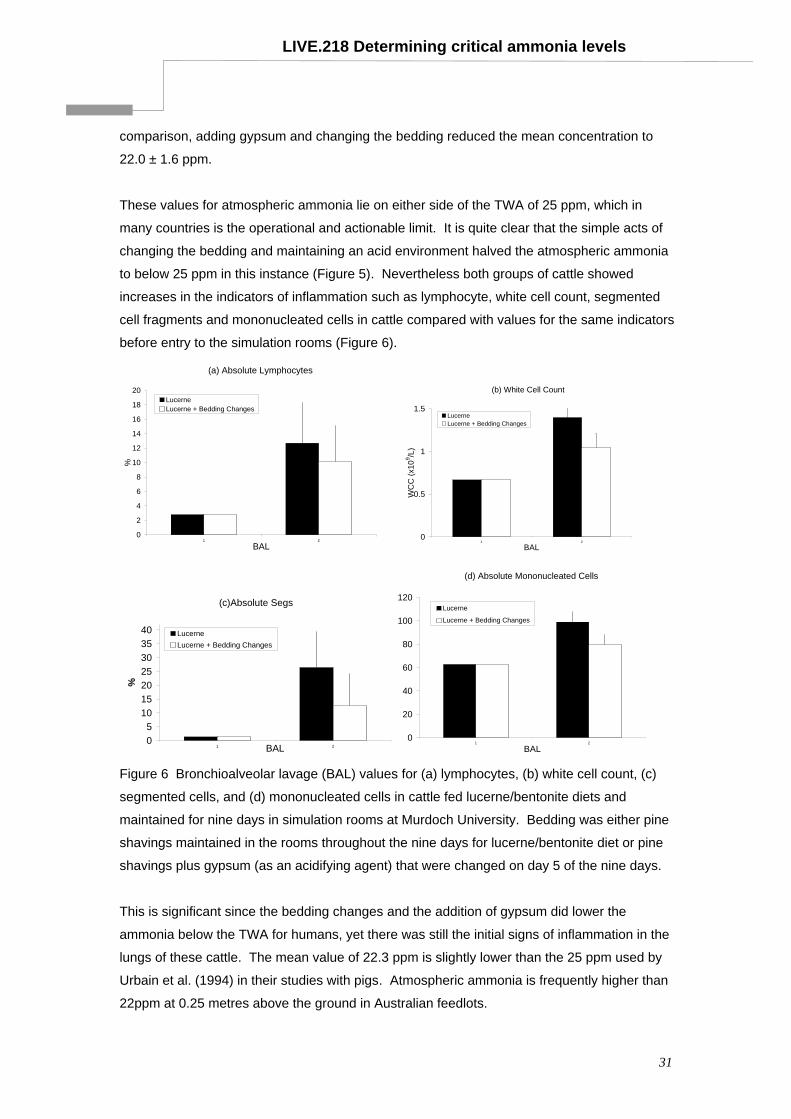
LIVE.218 Determining critical ammonia levels
comparison, adding gypsum and changing the bedding reduced the mean concentration to
22.0 ± 1.6 ppm.
These values for atmospheric ammonia lie on either side of the TWA of 25 ppm, which in
many countries is the operational and actionable limit. It is quite clear that the simple acts of
changing the bedding and maintaining an acid environment halved the atmospheric ammonia
to below 25 ppm in this instance (Figure 5). Nevertheless both groups of cattle showed
increases in the indicators of inflammation such as lymphocyte, white cell count, segmented
cell fragments and mononucleated cells in cattle compared with values for the same indicators
before entry to the simulation rooms (Figure 6).
(a) Absolute Lymphocytes
0
2
4
6
8
10
12
14
16
18
20
1 2
BAL
%
LucerneLucerne + Bedding Changes
(b) White Cell Count
0
0.5
1
1.5
1 2
BAL
WC
C (x
109 /L
)LucerneLucerne + Bedding Changes
(c)Absolute Segs
05
10152025303540
1 2BAL
%
LucerneLucerne + Bedding Changes
(d) Absolute Mononucleated Cells
0
20
40
60
80
100
120
1 2
BAL
Lucerne
Lucerne + Bedding Changes
Figure 6 Bronchioalveolar lavage (BAL) values for (a) lymphocytes, (b) white cell count, (c)
segmented cells, and (d) mononucleated cells in cattle fed lucerne/bentonite diets and
maintained for nine days in simulation rooms at Murdoch University. Bedding was either pine
shavings maintained in the rooms throughout the nine days for lucerne/bentonite diet or pine
shavings plus gypsum (as an acidifying agent) that were changed on day 5 of the nine days.
This is significant since the bedding changes and the addition of gypsum did lower the
ammonia below the TWA for humans, yet there was still the initial signs of inflammation in the
lungs of these cattle. The mean value of 22.3 ppm is slightly lower than the 25 ppm used by
Urbain et al. (1994) in their studies with pigs. Atmospheric ammonia is frequently higher than
22ppm at 0.25 metres above the ground in Australian feedlots.
31
LIVE.218 Determining critical ammonia levels
Moreover, all four parameters of inflammatory response were higher in cattle housed in the
room where the atmospheric ammonia was higher at 42.3 ppm. Nevertheless cattle still
showed inflammatory responses in room with the lower ammonia of 22 ppm, ie below the
TWA of 25 ppm. In fact, both rooms were uncomfortable for humans to work in for long
periods even though the lower ammonia was at a level considered reasonable for 8-hours of
exposure.
Few objective measures of inflammation resulting from exposure to elevated atmospheric
ammonia have been undertaken to date and more work needs to be done. Firstly we need to
confirm the validity of bronchioalveolar lavage as a sensitive method for assessing respiratory
function, and secondly we must develop regression relationships with other factors that would
be more easily assessed onboard vessels. The encouraging feature of bronchioaveolar
lavage in cattle is that it supports the findings using nasal lavage in pigs (Urbain et al. 1994)
that inflammation commenced at or below the human TWA limit of 25 ppm. However in
neither instance for either pigs or cattle were there significant effects on liveweight gain at 25
ppm.
17 Conclusions The totality of the evidence justifies defining a critical level for atmospheric ammonia in cattle,
sheep and goats at 25 ppm. Adoption of this level balances welfare requirements against the
levels that are reasonably achievable by best practice in the industry. Atmospheric ammonia
should not normally exceed these levels in outdoor feedlots. As for cattle undergoing sea
transport, atmospheric ammonia has already exceeded 25 ppm during some voyages and in
some decks. However, actions such as: adequate ventilation, change of bedding and feeding
lower protein diets containing acid salts, should be taken by ship’s masters, stockmen and
feed manufacturing and export industry to comply with the recommendation of 25 ppm for
atmospheric ammonia. As part of this process, more data should be compiled on atmospheric
ammonia levels onboard vessels during sea transport of animals. This would be simplified if
continuous, real-time measurements could be logged. Troublesome areas onboard vessels
could then be confirmed and an appropriate plan of action developed.
In feedlots, shading and keeping moisture levels to minimum should be part of the best
practice to keep atmospheric ammonia levels as low as practicable. Keeping moisture levels
to a minimum, especially under shade, should be part of the best practice. Mean values of 15
ppm should still be assessed for any long-term respiratory effects in cattle given the
conclusions by Urbain et al. (1994) from their studies in pigs. Of greater concern are the
values of 25 ppm or more near the ground, and the length of time that cattle are in that
32
LIVE.218 Determining critical ammonia levels
atmosphere. More accurate specification of protein requirements, and improved formulation of
feedlot diets to optimise the utilisation of feed nitrogen should be a priority for the industry,
from both a profit and atmospheric aspect. Putting dietary acidifiers in feedlot rations should
also decrease atmospheric ammonia. Finally, methods to assess lung function should be
validated, new types of bedding developed and the frequency of replacement established.
There are a number of areas of concern about the effects of atmospheric ammonia where
there is little to no information. These areas warrant further investigation. Firstly, an abattoir
study could be undertaken to quantify any difference in the respiratory capacity and efficiency
for Bos taurus versus Bos indicus. While the differences in respiratory efficiency between
wild ruminants and domesticated cattle have been shown allometrically, no studies are
available to confirm any differences between B. taurus and B. indicus. Practically, this could
be performed on respiratory collected from abattoirs. Live weight, carcase weight, lung
volume and ratios of upper respiratory system to total respiratory size could be measured.
This information will provide a basis for comparison of these cattle to handle ammonia load
during periods of high heat load, especially at high wet-bulb temperatures. Even at
atmospheric ammonia of 22ppm and 28 C wet bulb, cattle showed the initial signs of
respiratory inflammatory response. The simulations rooms at Murdoch University could be
used to study the combined effects of heat load and atmospheric ammonia. The studies led
by Dr Anne Barnes deliberately kept the ammonia levels low (<8 ppm) to remove ammonia as
a confounding factor during heat stress in taurus vs indicus cattle. It would be worthwhile to
set ammonia as close to 25 ppm as possible for an extended period of perhaps 11 days
during which wet-bulb temperatures increased to 32 (for 4-5 days). The standard measures,
including blood electrolyte and gas analysis and respiratory rates used by the Barnes group
could be augmented with BAL assessment. Experiments like this could quantify the direct
(alveolar function) and indirect (acid-base balance) effects of ammonia on heat tolerance.
o
o
Any and all of these parameters are affected by feed intake and composition of the feed.
Most of the ammonia studies in the simulation rooms would provide information of acute
effects on animals under heat load.
On the other hand, the study of chronic effects of ammonia at 15 – 25 ppm on the respiratory
system of cattle in feedlots requires a different approach. There are a number of options to
lower atmospheric ammonia in feedlots. Each of the measures should be aimed at reducing
atmospheric ammonia near ground level. Acidifying feedlot rations with ammonium chloride
or calcium chloride will decrease the volatilisation of ammonia. This is a relatively
straightforward means of reducing ammonia and the levels and effects have been
documented in LIVE.202. Increasing the area of feedlots and decreasing cattle density is
another factor that will decrease ammonia concentration. Moreover, appropriate shading that
still keeps moisture levels to minimum should be part of the best practice to keep atmospheric
33
LIVE.218 Determining critical ammonia levels
ammonia levels as low as practicable. Feeding strategies that limit intake in feedlot cattle
during early summer have been used a successful tool for enhancing animal comfort by
alleviating the combined effects of high climatic and metabolic heat load (Mader et al. 2002).
Optimising the nitrogen content of the feed is an important factor that needs to be taken into
account and more attention could be paid to this nutritional parameter. In all of the above,
dust is also a compounding factor on ammonia effects whether in feedlots or during live
export. Little information is available on the chronic interaction of ammonia and dust on
respiratory capacity.
All of the projects suggested above need to be prioritised and funded if critical ammonia
levels are to put on a sounder basis for feedlot and live export conditions. Nevertheless,
setting critical atmospheric ammonia levels at 25 ppm is a practical level that will allow the
feedlot beef industry and the live export industry to monitor and develop strategies to comply
with this recommendation.
34
LIVE.218 Determining critical ammonia levels
18 References 1. Accioly, J.M., Tudor, G.D., Taylor, E.G., White, C.L., Costa, N.D., Pluske, J.R. and
Pethick, D.W. (2002). “Effect of roughage quality and fermentable energy/protein on
intake, performance and nitrogen excretion in cattle fed export diets” Asia Pacific Journal
of Clin Nutrition 11 (S): S250.
2. Accioly, J.M., Tudor, G.D., Costa, N.D., Pethick, D.W, Pluske, J.R. Taylor, E.G., and
White, C.L. (2003). “Improving Nutritional Performance of Cattle and Decreasing
Ammonia Accumulation on Ship.” pp 22-27. Livestock Export Program LIVE.306.,
Technical Network Forum, Darwin, 17-18 June 2003, Published by Meat & Livestock
Australia Ltd
3. Allan, E. (1978). "Ultrastructure of the brush cell in bovine lung." Res Vet Science 25:
314-317.
4. Altman, P. and D. Dittmer (1971). Respiration and circulation. Bethesda, USA, Federation
of American Societies for Experimental Biology.
5. Andreasen, M., Bækbo, P. and Neilsen, K. (1994) "Effect of aerial ammonia on the MIRD-
complex." p:429. (eds P. Poomvises and P. Ingkaninun) Proceedings of the 13th IPVS
Congress, Bangkok, Thailand, 26 - 30 June 1994,
6. Atwal, O. and P. Sweeny (1971). "Ultrastructure of the interalveolar septum of the lung of
the goat." Am J Vet Res 32(12): 1999-2010.
7. Atwal, O. S. (1999). "Estrogen-induced microvilli and microvillar channels and entrapment
of surfactant-lipids by alveolar type I cells of bovine lung." Anatomical Record 256(3):
300-320.
8. Barnes, A.L., Beatty, D., McCarthy, M., Maloney, S., Stockman, C. and Taylor, E.G.
(2003). "Physiology of Heat Stress in Cattle and Sheep and the Efficacy of Electrolyte
Replacement Therapy" pp 28-32. Livestock Export Program LIVE.306., Technical
Network Forum, Darwin, 17-18 June 2003, Published by Meat & Livestock Australia Ltd
9. Canadian Centre for Occupational Health and safety (CCOHS) (2001) "CHE-MINFO
Sheet for Ammonia Gas." Issue 2001-3.
10. Choi, H. K., W. E. Finkbeiner and J. H. Widdicombe (2000). "A comparative study of
mammalian tracheal mucous glands." Journal of Anatomy 197: 361-372.
11. CIGR: Commission Internationale de Génie Rural. (1984) Report of working group on
climatization of animal houses. Craibstone, Aberdeen: Scottish Farm Building
Investigation Unit.
12. Corstvet, R., J. Rummage and J. Homer (1982). "Recovery of pulmonary alveolar
macrophages from non-anaesthetised calves." Am J Vet Res 43(12): 2253-4.
35
LIVE.218 Determining critical ammonia levels
13. Dewes, H.F. and Goodall, G. (1995) "Some preliminary observations on the possible
relationship between ammonia production from soiled bedding in calf rearing sheds and
calf illness." New Zealand Vet. J. 43: 37-41.
14. Dougherty, R. and H. Cook (1962). "Routes of eructated gas expulsion in cattle - a
quantitative study." am J Vet Res 23: 997-1000.
15. Dougherty, R., W. Stewart, M. Nold, I. Lindahl, C. Mullenax and B. Leek (1962).
"Pulmonary absorption of eructated gas." Am J Vet Res 23: 205-12.
16. Douglas, R.B. and Coe, J.E. (1987). "The relative sentivity of the human eye and lung to
irritant gases." Ann. Occup. Hyg. 31: 265-267.
17. Drummond, J.G., Curtis, S.E., Lewis, J.M., Hinds, F.C. and Simon, J. (1976). "Exposure
of lambs to atmospheric ammonia." J. Anim. Sci 1343.
18. Drummond, J.G., Curtis, S.E., and Simon, J. (1978). "Effects of atmospheric ammonia on
pulmonary bacterial clearance in the young pig." Am.J. Vet.Res. 39: 211-212.
19. Drummond, J.G., Curtis, S.E., Simon, J. and Norton, H.W. (1980). "Effects of aerial
ammonia on growth and health in young pigs." J. Anim. Sci 50: 1085-1091.
20. Dukes, H. (1955). The physiology of domestic animals. 7th Ed. London, Bailliere, Tindall &
Cox.
21. Dunn, S.E., Godwin, J. Hoare, R.J.T., Kirkland, P.D., Walker, S.B., Coverdale, O.R. and
Gibson, J.A. (1994?)
22. Dyce, K., W. Sack and C. Wensing (1987). Textbook of veterinary anatomy. 2nd Ed.
Philadelphia, W.B. Saunders.
23. Epling, G. (1964). "Electron microscopy of the bovine lung: the normal blood-air barrier."
Am J Vet Res 25: 679-89.
24. FLOT.317 (2003). “Measuring the Microclimate of Eastern Australian Feedlots” Report
prepared by E.A. Systems Pty Limited and the University of Southern Queensland for the
MLA.
25. Gehr, P., D. Mwangi, A. Ammann, G. Maloiy, C. Taylor and E. Weibel (1981). "Design of
the mammalian respiratory system. V. Scaling morphometric pulmonary diffusing capacity
to body mass: wild and domestic mammals." Respir Physiol 44: 61-86.
26. Getty, R. (1975). The anatomy of the domestic animals (Sisson and Grossman's). 5th Ed.
Philadelphia, WB Saunders Co.
27. Groot Koerkamp, P.W.G., Metz, J.H.M., Uenk, G.H., Phillips, V.R., Holden, M.R., Sneath,
R.W., Short, J.L., White, R.P., Hartung, J., Seedorf, M., Linkert, K.H., Pedersen, S.,
Takai, H., Johnsen, J.O., and Wathes, C.M. (1998) "Concentrations and emmisions of
ammonia in livestock buildings in Northern Europe." J. agric. Engng. Res. 70: 79-95.
28. Gustin, P., Urbain, B., Prouvost, J-F. and Ansay, M.. (1994) 'Effect of atmospheric
ammonia on pulmonary hemodynamics and vascular reactivity in pigs: interaction with
endotoxins." Toxicl. Appl. Pharmacol. 125: 17-26.
36
LIVE.218 Determining critical ammonia levels
29. Iovannitti, B., H. Pirie and N. Wright (1985). "Scanning electron microscopic study of the
lower respiratory tract in calves and adult cattle." Res Vet Sci 38: 80-7.
30. Jones, C. (1983). "Mucociliary clearance from the calf lung." Can J Comp Med 47: 265-9.
31. Kelly, A.P. and Janzen, E.D. (1986) " A review of morbidity and mortality rates and
disease occurrence in North American feedlot cattle." Can. Vet. J. 27: 496 - 500.
32. Kuhlmann, W., S. Dolezal and M. Fedde (1985). "Effect of ruminal CO2 on gas exchange
and ventilation in the Hereford calf." J Appl Physiol 58(5): 1481-4.
33. Lodge, D. (1969). "A survey of tracheal dimensions in horses and cattle in relation to
endotracheal tube size." Vet. Rec. 85: 300-303.
34. Lodge, D. (1969). "a survey of tracheal dimensions in horses and cattle in relation to
endotracheal tube size." Vet Rec 85: 300-3.Luttrell, W.E. Chemical Health & Safety
(May/June 2002) pp 30-31 Division of Chemical Health and Safety of the American
Chemical Society, Elsevier Science.
35. Mader, T.L., S.M. Holt, G.L. Hahn, M.S. Davis and D.E. Spiers (2002). "Feeding
strageties for managing heat load in feedlot cattle." J. Anim. Sci. 80: 2373-2382.
36. Mariassy, A. and C. Plopper (1983). "Tracheobronchial epithelium of the sheep: I.
Quantitative light-microscopic study of epithelial cell abundance, and distribution." Anat
Rec 205: 263-75.
37. Mariassy, A., C. Plopper and D. Dungworth (1975). "Characteristics of bovine lung as
observed by scanning electron microscopy." Anat Rec 183: 13-26.
38. McGinn, S.M. and H.H. Janzen. (1998). "Ammonia emissions in agriculture and their
measurement." Can. J. Soil. Sci. 78:139-148.
39. McGinn, S.M., H.H. Janzen and T. Coates (2003). " Atmospheric ammonia, volatile fatty
acids, and other odorants near beef feedlots." J. Environ. Qual. 32: 1173-1182.
40. Meban, C. (1980). "Thickness of the air-blood barrier in vertebrate lungs." J Anat 131(2):
299-307.
41. Misselbrook, T.H., Van Der Weerden, T.J., Pain, B.F., Jarvis, S.C., Chambers, B.J.,
Smith, K.A., Phillips, V.R., and Demmers, T.G.M. (2000) " Ammonia emission factors for
UK agriculture." Atmospheric Environment 34: 871-880.
42. MLA and LiveCorp Project Number SBMR.002 "Investigation of the ventilation efficacy on
livestock vessels." July 2001 ISBN 1 74036 1202.
43. Mullenax, C., M. Allison and J. Songer (1964). "Transport of aerosolised microorganisms
from rumen to respiratory system during eructation." Am J Vet Res 25: 1583-93.
44. National Occupational Health and Safety Commission (NOHSC) (1995) "Exposure
Standards for Atmospheric Contaminants in the Occupational Environment."
NOHSC:1003; pp 75, Australian Government Publishing Service, Canberra.
45. Nickel, R., A. Schummer and E. Seiferle (1979). The viscera of domestic animals. 2nd Ed.
Berlin, Verlag Paul Parey.
37
LIVE.218 Determining critical ammonia levels
46. Norris, R.T., Creeper, J.H., Madin, B. and Richards, R.B. (2000) "Cattle death during sea
transport from Australia" Australian Association of Cattle Veterinarians (AACV) Perth
Conference Proceedings, pp8-12.
47. Norris, R.T., Richards, R.B., Creeper, J.H., Jubb, T.F., Madin, B., and Kerr, J.W. (2003).
"Cattle deaths during sea transport from Australia." Aust. Vet. J. 81: 156-161.
48. Occupational Safety and Health Administration (OHSA) (1989). "Industrial exposure
control strategies and technologies for OHSA regulated hazardous substances." Vol 1:
Cincinnati.
49. Petersen et al. (1998). Ammonia losses from urine and dung of grazing cattle: effect of N
intake. Atmospheric Environment 32 (3) 295-300.
50. Phalen, R. and M. Oldham (1983). "Tracheobronchial airway structure as revealed by
casting techniques." Am. Rev. Respir. Dis. 128: S1-S4.
51. Plopper, C. (1983). "Comparative morphological features of bronchiolar epithelial cells."
Am. Rev. Respir. Dis. 128: S37-41.
52. Rheinberger, R.J. (2000) "An introduction to the bovine lung." Australian Association of
Cattle Veterinarians (AACV) Perth Conference Proceedings, pp 69-71.
53. Robinson, N. (1982). "Some functional consequences of species differences in lung
anatomy." Adv. Vet. Sci. Comp. Med. 26: 1-33.
54. Rybicka, K., D. BDT, J. Migliore and J. Norman (1974). "Ultrastructure of pulmonary
alveoli of the calf." Am. J. Vet. Res. 35(2): 213-22.
55. Schmidt, M. C., D. Simmen, M. Hilbe, P. Boderke, G. Ditzinger, J. Sandow, S. Lang, W.
Rubas and H. P. Merkle (2000). "Validation of excised bovine nasal mucosa as in vitro
model to study drug transport and metabolic pathways in nasal epithelium." Journal of
Pharmaceutical Sciences 89(3): 396-407.
56. Shafie, M. and F. Abdelghany (1978). "Structure of the respiratory system of sheep as
related to heat tolerance." Acta Anat. 100: 441-60.
57. Sullivan, K.F. (2000) Diagnosis & treatment of feedlot respiratory disease." Australian
Association of Cattle Veterinarians (AACV) Perth Conference Proceedings, pp 102-109.
58. Taylor, C., G. Maloiy, E. Weibel, V. Langman, J. Kamau, H. Seeherman and N. Heglund
(1980). "Design of the mammalian respiratory system. III. Scaling maximum aerobic
capacity to body mass: wild and domestic animals." Respir. Physiol. 44: 25-37.
59. Tenney, S. and J. Remmers (1963). "Comparative quantitative morphology of the
mammalian lung: diffusing area." Nature 197: 54-6.
60. The National Swedish Board of Occupational Safety and Health. (1990) "Occupational
exposure limit values." p13, AFS, Solna, Sweden.
61. Veit, H. and R. Farrell (1978). "The anatomy and physiology of the bovine respiratory
system relating to pulmonary disease." Cornell Vet. 68: 555-81.
62. Widdicombe, J.H. (2001) "Airway receptors" Respiratory Physiology 125: 3-15
38

LIVE.218 Determining critical ammonia levels
63. Widdicombe, J. H., S. J. Bastacky, D. X. Y. Wu and C. Y. Lee (1997). "Regulation of
depth and composition of airway surface liquid." European Respiratory Journal 10(12):
2892-2897.
64. Wills, P. J., K. Pritchard and P. J. Cole (1998). "Mucus transportability: the bovine trachea
and frog palate models compared." European Respiratory Journal 12(4): 837-841.
65. Yu, S., P. Harding, N. Smith and F. Possmayer (1983). "Bovine pulmonary surfactant:
chemical composition and physical properties." Lipids 18: 522-9.
39
LIVE.218 Determining critical ammonia levels
19 Appendix 1: Anatomy and Physiology of the Ruminant Respiratory System The ruminant respiratory tract is entered via wide nostrils set laterally within the naked
nasolabial plate of cattle, or the smaller, haired nasal plate of sheep and goats (Nickel et al.
1979). The nasal cavity is relatively long, but narrower than might be predicted from its
external dimensions, due to the impingement of large conchae (Dyce et al. 1987). Its
epithelium is typical histologically, with a ciliated respiratory epithelium and scattered T-cell
populations (Schmidt et al. 2000). As in most species, the ventral nasal meatus provides the
principal respiratory passage to the nasopharynx. The middle nasal meatus provides access
to an extensive system of paranasal sinuses, which excavate much of the bone surrounding
the caudal nasal passage and orbit. This sinus complex is particularly well developed in
cattle, where it also surrounds much of the cranial cavity and even enters the horns. The
pharynx is anatomically unremarkable, except for the partial division of the nasopharynx by a
membranous septum, which terminates in a distinct pharyngeal tonsil. Though the
oropharynx is narrow, the palatine arrangement is such that ruminants are capable of mouth
breathing when required (Dyce et al. 1987). Functionally, the pharynx of ruminants is notable
for the continuous flow of saliva, and frequent passage of both regurgitated cud and large
volumes of eructated rumen gases. This results in a comparatively higher incidence of
microbial contamination of the trachea, albeit at a low level (Mullenax et al. 1964).
The ruminant larynx is comparatively short and compact, with the laryngeal entrance
directed relatively dorsally. Vestibular folds and laryngeal ventricles are absent, though a
small median ventricle is present in sheep and goats (Dyce et al. 1987). The transverse
distance between the vocal folds (rima glottidis) represents the limiting dimension for
endotracheal intubation (Lodge 1969). The laryngeal area is well endowed with lymphoid
tissue.
It has been observed that the diameter of the bovine trachea (approximately 33 mm in a 450-
500 kg animal) is proportionately small when compared with, for instance, horses of
comparable size (46 mm). The trachea is smaller again in beef breeds compared to dairy
animals (Lodge 1969). At a length of 650 mm (Getty 1975), the bovine trachea has a
comparatively high ratio of length:diameter (~20), as does the goat (15 x 300 mm) (Phalen et
al. 1983). From these dimensions, a comparatively high degree of tracheal airflow resistance
could be predicted according to Poiseuille’s Law. The ovine trachea (17 x 220 mm) is better
proportioned, but is similarly narrow when compared with, for instance, a 10kg beagle (16
mm etc) (Shafie et al. 1978; Phalen et al. 1983). The ruminant trachea is U-shaped in cross-
section, and is slightly deeper than it is wide. The trachealis muscle is internal to the
LIVE.218 Determining critical ammonia levels
cartilage rings, and covers a concentration of dorsal retromucosal lymphoid tissue (Dyce et
al. 1987).
The bovine thorax is notably short and wide, and the lungs correspondingly small (Getty
1975). Perhaps due to poor compliance of the chest wall (due to their wide stiff ribs), cattle
are relatively more reliant on the diaphragm for breathing than other species (Dyce et al.
1987). The right and left sides of the thorax are completely divided by particularly strong
mediastinal pleura. The right thoracic cavity is considerably larger, reflecting the marked
asymmetry of the lungs. Thick visceral pleura cover the lungs, and are continuous with
pronounced seams of interstitial connective tissue dividing adjacent lobes and lobules. This
very high degree of lobulation prevents collateral ventilation between secondary lobules,
which in some species (for example dogs) can provide up to 96% of normal tidal volume to
obstructed airspaces (Robinson 1982). Thus in cattle (as in pigs) airway obstruction is much
more functionally damaging than in those species with effective collateral ventilatory
pathways. Lobulation also predisposes cattle to interstitial emphysema, which readily
develops during prolonged periods of dyspnoea (Mariassy et al. 1975). However the
connective tissue septa also confer a low degree of mechanical interdependence, thus it is
possible to observe healthy parenchyma directly adjacent to consolidated lobules in
diseases such as chronic bronchopneumonia (Robinson 1982). A similar degree of
lobulation is not obvious in the sheep, and is only observed in the cranial and middle lung
lobes of goats. As might be expected, these species have a greater capacity for collateral
ventilation, due to the presence of accessory bronchiole-alveolar communications (Robinson
1982).
The ruminant tracheobronchial tree is distinguished by a strongly monopodial system of
branching (i.e. diameters of daughter airways at branching are markedly dissimilar) (Phalen
et al. 1983). A tracheal bronchus is present, arising proximal to the main tracheal bifurcation
to supply the right cranial lung lobe (Lodge 1969). Respiratory bronchioles are either short or
absent in cattle, creating a sudden transition from terminal bronchioles to alveolar ducts
(Iovannitti et al. 1985). However, the goat does have 5-6 orders of respiratory bronchioles
(Phalen et al. 1983). The cell population of the tracheobronchial tree is largely similar to that
of other species, though the sheep is better studied than for cattle. Ovine tracheal epithelium
contains 31% ciliated cells, 41% mucous cells, and 28% basal cells. This comparative
abundance of the stem cell-like basal cells suggests an inherent potential for recovery from
cytotoxic injury (Mariassy et al. 1983). Brush cells are present in low numbers and are not
found distal to the small bronchi (Allan 1978). At the level of the bronchiolar transition, the
abundance of mucous and ciliated cells declines rapidly. Below this level, Clara cells are the
only secretory cell present (~65% of cell population) and submucosal glands are absent
(Mariassy et al. 1983). Clara cells are similarly abundant in bovine bronchioles (Iovannitti et
41
LIVE.218 Determining critical ammonia levels
al. 1985). Ovine Clara cells display ample smooth endoplasmic reticulum (SER), and
numerous ovoid secretory granules. By contrast those of cattle lack SER, but contain large
amounts of cytoplasmic glycogen. These characteristics suggest a less important secretory
role for the Clara cells of this species (Plopper 1983).
The bovine mucociliary system is well-developed in the upper airways, but has been shown
to be patchy and incomplete at the level of the smaller bronchioles (Iovannitti et al. 1985).
This system consists of a viscous gel layer overlying a low-viscosity sol, in which the cilia of
the underlying epithelial cells beat. Tracheal ciliary activity is similar to that of humans (Wills
et al. 1998), and the normal rate of mucociliary flow (15 mm/min) is close to the mean for
domestic animals (Veit et al. 1978). This rate is known to be reduced by ammonia, and by
factors which reduce lowering of the head to graze, such as transport (Veit et al. 1978).
Mucus gland openings are asymmetrically distributed, with the number in the ventral portion
much greater than the dorsal half of the trachea, in both sheep (1.01 vs 0.56 per mm2) and
cattle (1.54 vs 0.56 per mm2) (Choi et al. 2000). While the summed volume of bovine
tracheal glands is comparatively large (Choi et al. 2000), the depth of airway surface liquid
(ASL) as measured by freeze-fracture is unremarkable (23±3 µm) (Widdicombe et al. 1997).
Mucociliary clearance has been measured radiometrically in calves, and is comparable with
that of other species (Jones 1983).
The lack of respiratory bronchioles in cattle is accompanied by a relatively simple acinar
arrangement of the alveoli. Mariassy et al. (1975) reported an almost total lack of
interalveolar pores (pores of Kohn), though a subsequent study found them to be more
frequent (Iovannitti et al. 1985). The mean alveolar diameter is 97µm in cattle and 74µm in
sheep (Altman et al. 1971; Shafie et al. 1978). The ruminant blood-air barrier consists of a
thin layer of surfactant fluid, the flattened alveolar type I cell, an epithelial basal lamina, a
continuous and well-developed capillary basal lamina (though this may fuse with that of the
epithelium), and a thin capillary endothelium. The pulmonary capillaries are not fenestrated
(Epling 1964). The thickness of this barrier has been measured in sheep (arithmetic mean
1.87±0.18µm, harmonic mean 0.68±0.03µm) but not in cattle (Meban 1980). Bovine
surfactant (produced by alveolar type II cells) has a similar composition to that of other
species, with the exception of low levels of triacylglycerol and cholesterol ester (Yu et al.
1983). Several authors have noted a low abundance of alveolar macrophages compared to
similar mammals (Rybicka et al. 1974; Mariassy et al. 1975). As these cells are thought to be
important in the maintenance of lung sterility, this would appear to compromise bovine
resistance to bacterial infection (Veit et al. 1978). However alveolar macrophages were
‘readily’ found in another study (Iovannitti et al. 1985), and are recovered in large numbers
by bronchoalveolar lavage (Corstvet et al. 1982). In addition, intravascular macrophages are
42
LIVE.218 Determining critical ammonia levels
common within pulmonary capillaries, and this may represent a substantial local phagocytic
pool (Rybicka et al. 1974).
Alveolar type I cells of the ruminant lung possess several unique properties, such as the
presence on the luminal surface of a substantial glycocalyx, numerous highly anionic
microdomains, and an elaborate complex of tubulocisternal endoplasmic reticulum (a type of
ER thought to be involved in active transepithelial movement of ions). These modifications are
thought to be an adaptation to the unique gaseous environment of the ruminant lung, in which
a cocktail of ruminal gases is delivered deeply into the lung during eructation (Dougherty et al.
1962; Dougherty et al. 1962; Atwal 1999). These gases include methane, hydrogen sulphide,
formaldehyde, ammonia, and CO2 (Kuhlmann et al. 1985), and are inhaled into the lungs in
surprisingly large volumes (eg. 33.9L per hour in a Guernsey cow) (Dougherty et al. 1962).
43