
Determination of Proteins and Peptides with Capillary ... · PA800 plus or P/ACE MDQ (Beckman...
14
Introduction The CEofix™ NTMP kit is using Nitrilotri(trimethyl)phosphonic acid (NTMP) as buffer. NTMP is characterized by 7 pKa’s, al- lowing to design buffers between pH 4 and 7.2. Furthermore it is UV transparent, wich makes it about 40 times more sensitive comparing with a Tris/taurine or borate buffer. To avoid absor - bance of proteins on the capillary the kit contains double dyna- mic coating of the capillary (US Patent 5611903). Methods and Materials Instrumentation Suitable instruments are capillary electrophoresis such as PA800 plus or P/ACE MDQ (Beckman Coulter Brea). Typical capillaries have a length of 60.2 cm (50 cm to the detector) and an internal diameter of 50 μ. Method The kit contains elements for dynamically coating of the capillary and two separation buffers at pH 4 and 7.2. By mixing both buffers intermediate pH may be obtained. The sample may be injected neat or diluted, for example with the sample diluent supplied in the kit. Separation Separation of peptides at different pH Synthetic oligopeptides, used as isoelectric pI markers are mixed and separated at different pH (Figure 1). At pH 4.4 they all migrate before the electro osmotic peak (EOF), while gradually by increasing the pH they will be negatively charged and migrate aer the EOF peak. Separation of Serum Proteins Serum proteins are composed of a family of proteins and can be separated using agarose gel electrophoresis. Figure 2 shows an Immuno Fixation Electrophoresis, where an IgM kappa monoclonal protein is identified. Lane 1 represent the separation of the serum proteins, while lane 2 to 6 aer applying respectively anti IgG, IgA, IgM, kappa and lambda. Figure 3 shows the same sample analyzed with CEofix™ NTMP and immune subtraction to identify the monoclonal band. CEofix™ NTMP Determination of Proteins and Peptides with Capillary Electrophoresis Figure 1. Separation of pI markers made of oligopeptides at different pH Figure 2 Typical separation of serum proteins by agarose gel electrophoresis. The sample contains an IgM kappa monoclonal band. BIO PHARMACEUTICAL ANALYSIS Application note 130404 Figure 3. Same serum protein as in figure 2, with overlay of immunosubtrac- tions. The electropherogram represents the gamma zone.
Transcript of Determination of Proteins and Peptides with Capillary ... · PA800 plus or P/ACE MDQ (Beckman...

IntroductionThe CEofixtrade NTMP kit is using Nitrilotri(trimethyl)phosphonic acid (NTMP) as buffer NTMP is characterized by 7 pKarsquos al-lowing to design buffers between pH 4 and 72 Furthermore it is UV transparent wich makes it about 40 times more sensitive comparing with a Tristaurine or borate buffer To avoid absor-bance of proteins on the capillary the kit contains double dyna-mic coating of the capillary (US Patent 5611903)
Methods and MaterialsInstrumentationSuitable instruments are capillary electrophoresis such as PA800 plus or PACE MDQ (Beckman Coulter Brea) Typical capillaries have a length of 602 cm (50 cm to the detector) and an internal diameter of 50 μ
MethodThe kit contains elements for dynamically coating of the capillary and two separation buffers at pH 4 and 72 By mixing both buffers intermediate pH may be obtained The sample may be injected neat or diluted for example with the sample diluent supplied in the kit
SeparationSeparation of peptides at different pHSynthetic oligopeptides used as isoelectric pI markers are mixed and separated at different pH (Figure 1) At pH 44 they all migrate before the electro osmotic peak (EOF) while gradually by increasing the pH they will be negatively charged and migrate a1048908er the EOF peak
Separation of Serum ProteinsSerum proteins are composed of a family of proteins and can be separated using agarose gel electrophoresis Figure 2 shows an Immuno Fixation Electrophoresis where an IgM kappa monoclonal protein is identified Lane 1 represent the separation of the serum proteins while lane 2 to 6 a1048908er applying respectivelyanti IgG IgA IgM kappa and lambda Figure 3 shows the same sample analyzed with CEofixtrade NTMP and immune subtraction to identify the monoclonal band
CEofixtrade NTMP
Determination of Proteins and Peptides with Capillary Electrophoresis
Figure 1 Separation of pI markers made of oligopeptides at different pH
Figure 2 Typical separation of serum proteins by agarose gel electrophoresis The sample contains an IgM kappa monoclonal band
bio PHARMACEUTiCAL AnALysisApplication note 130404
Figure 3 Same serum protein as in figure 2 with overlay of immunosubtrac-tions The electropherogram represents the gamma zone
CEofixtrade NTMP
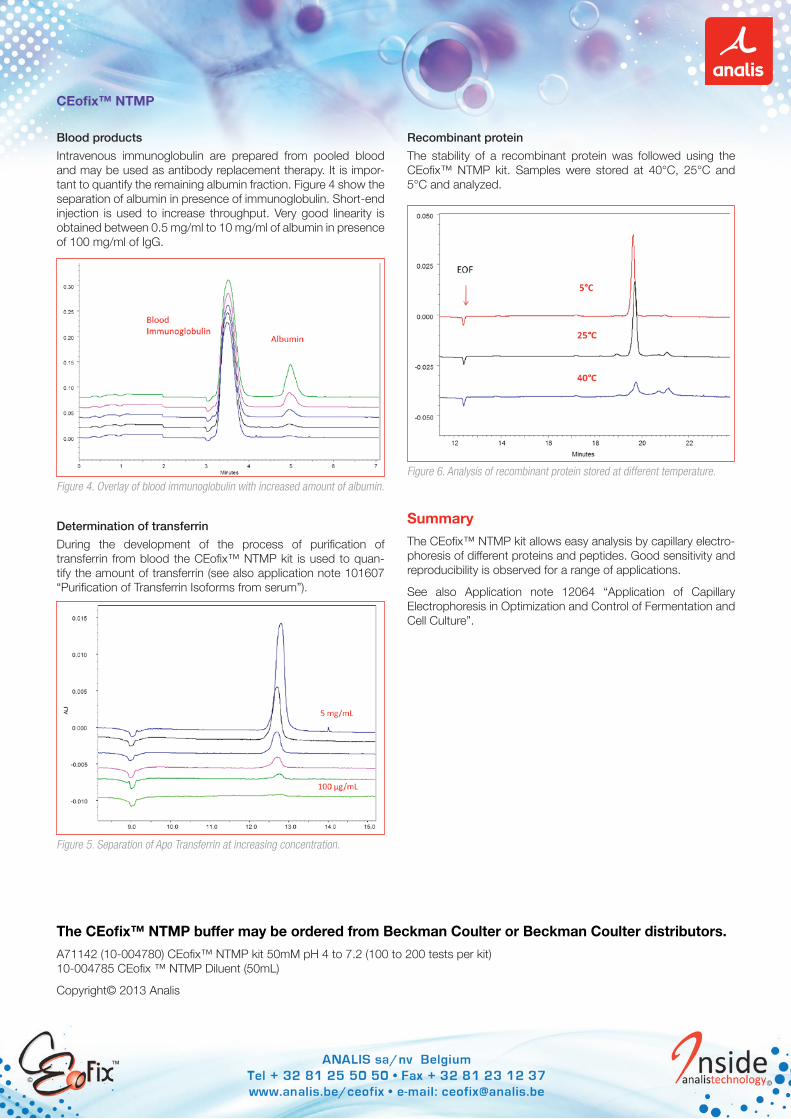
bio PHARMACEUTiCAL AnALysis Blood productsIntravenous immunoglobulin are prepared from pooled blood and may be used as antibody replacement therapy It is impor-tant to quantify the remaining albumin fraction Figure 4 show the separation of albumin in presence of immunoglobulin Short‐end injection is used to increase throughput Very good linearity is obtained between 05 mgml to 10 mgml of albumin in presence of 100 mgml of IgG
Determination of transferrinDuring the development of the process of purification of transferrin from blood the CEofixtrade NTMP kit is used to quan-tify the amount of transferrin (see also application note 101607 ldquoPurification of Transferrin Isoforms from serumrdquo)
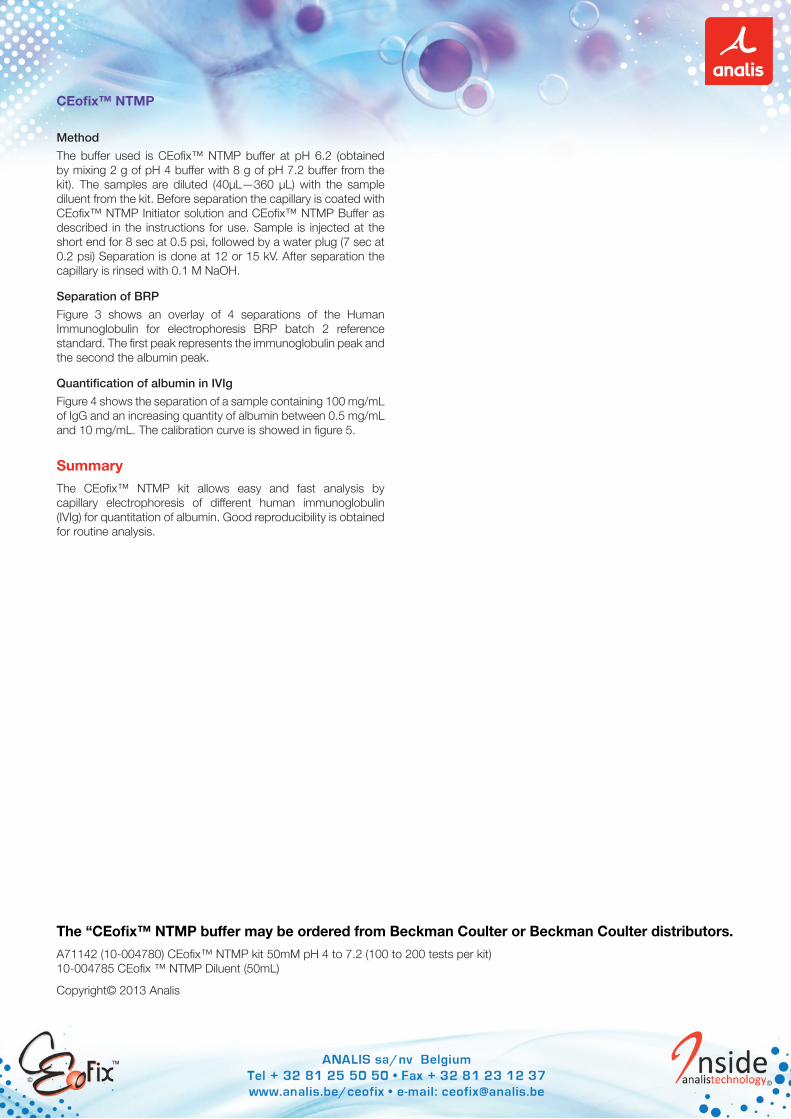
Recombinant proteinThe stability of a recombinant protein was followed using the CEofixtrade NTMP kit Samples were stored at 40degC 25degC and 5degC and analyzed
SummaryThe CEofixtrade NTMP kit allows easy analysis by capillary electro-phoresis of different proteins and peptides Good sensitivity and reproducibility is observed for a range of applications
See also Application note 12064 ldquoApplication of Capillary Electrophoresis in Optimization and Control of Fermentation and Cell Culturerdquo
Figure 4 Overlay of blood immunoglobulin with increased amount of albumin
Figure 5 Separation of Apo‐Transferrin at increasing concentration
Figure 6 Analysis of recombinant protein stored at different temperature
The CEofixtrade NTMP buffer may be ordered from Beckman Coulter or Beckman Coulter distributorsA71142 (10‐004780) CEofixtrade NTMP kit 50mM pH 4 to 72 (100 to 200 tests per kit) 10‐004785 CEofix trade NTMP Diluent (50mL)
Copyrightcopy 2013 Analis
IntroductionHuman normal immunoglobulin for intravenous administration (IVIg) is a liquid or freeze‐dried preparation containing mainly im-munoglobulin G (IgG) while albumin may be added as stabilizer (Ph Eur) Monographs describe that the protein composition should be examine by zone electrophoresis Traditionally this is done using cellulose acetate gel or agarose gel and barbital buffer The method is the same as for serum protein analysis (Figure 1) and quantitation can be done using a gel scanner (Figure 2) We describe here a method using capillary electro-phoresis and CEofixtrade NTMP buffer kit (Analis Suarleacutee Belgium)
Methods and SeparationInstrumentationSuitable instruments are capillary electrophoresis such as PA800 plus or PACE MDQ (Beckman Coulter Brea CA USA) using a UV detector at 200 nm Capillary are fused silica (Polymicro Phoenix AZ USA) 50μm internal diameter 602 cm total length and 10 cm to the detector as the short end injection side is used
CEofixtrade NTMP
Fast analysis of Human normal Immunoglobulin
Figure 3 Analysis of Human immunoglobulin BRP reference solution (EDQM Reference standard) Overlay of 4 runs
Figure 4 Overlay of blood immunoglobulin with increased amount of albumin
bio PHARMACEUTiCAL AnALysisApplication note 130412
Figure 5 Calibration of albumin between 05 and 10 mg mL showing a goodness of fit R2 gt 099
Figure 1 Agarose gel electrophoresis of serum proteins
Figure 2 Gel scan ofserum proteins
CEofixtrade NTMP
bio PHARMACEUTiCAL AnALysis MethodThe buffer used is CEofixtrade NTMP buffer at pH 62 (obtained by mixing 2 g of pH 4 buffer with 8 g of pH 72 buffer from the kit) The samples are diluted (40μLmdash360 μL) with the sample diluent from the kit Before separation the capillary is coated with CEofixtrade NTMP Initiator solution and CEofixtrade NTMP Buffer as described in the instructions for use Sample is injected at the short end for 8 sec at 05 psi followed by a water plug (7 sec at 02 psi) Separation is done at 12 or 15 kV After separation the capillary is rinsed with 01 M NaOH
Separation of BRPFigure 3 shows an overlay of 4 separations of the Human Immunoglobulin for electrophoresis BRP batch 2 reference standard The first peak represents the immunoglobulin peak and the second the albumin peak
Quantification of albumin in IVIgFigure 4 shows the separation of a sample containing 100 mgmL of IgG and an increasing quantity of albumin between 05 mgmL and 10 mgmL The calibration curve is showed in figure 5
SummaryThe CEofixtrade NTMP kit allows easy and fast analysis by capillary electrophoresis of different human immunoglobulin (IVIg) for quantitation of albumin Good reproducibility is obtained for routine analysis
The ldquoCEofixtrade NTMP buffer may be ordered from Beckman Coulter or Beckman Coulter distributorsA71142 (10‐004780) CEofixtrade NTMP kit 50mM pH 4 to 72 (100 to 200 tests per kit)10‐004785 CEofix trade NTMP Diluent (50mL)
Copyrightcopy 2013 Analis
CaPIllary ElECTroPHorESIS
application of Capillary Electrophoresis in optimization and Control of Fermentation and Cell Culture
bio PHARMACEUTiCAL AnALysisApplication note 12064
IntroductionldquoThe performance of fermentation and cell culture are critical to the quality and consistency of production of therapeutic productsrdquo (1) Besides parameters such as temperature pH and dissolved oxygen it is important to follow the nutrients and metabolites produced Capillary electrophoresis is an excellent tool for this purpose as it combines fast separation easy sample preparation and availability of different kits and methods for the same instrument
In this ldquoApplication noterdquo we will describe different methods for analysis of organic acids cations carbohydrates and proteins all using the Beckman Coulter PA 800 plus instrument (Beckman Coulter Brea CA USA)(1) Lobesh Bhattacharyya (2011) BioPharm International Supplements 24 12-22
analysis of Carbohydrates This method is using a direct UV detection at 270 nm by using a DAD detector and a buffer at high pH (126) see figure 1
General conditions used to obtain separation showed in figure 2
bull PA 800 plus with short end injection to obtain an analysis time of 4 minutes
bull CEofixtrade Carbo kit (Analis Suarleacutee Belgium) using an optimized method for carbohydrates analysis (patent pending)
bull Samples are diluted with water no other sample preparation is required
analysis of anions and organic acids Most of the anions and organic acids do not absorb in the UV for this reason indirect UV detection is used at 230 nm by using a buffer at pH 56 (figure 3)
General conditions to obtain separation showed in figure 4
bull PA 800 plus with inverse polarity and indirect detectionbull Anion Analysis kit (Beckman Coulter Brea CA USA)bull Samples are diluted with a solution of 5 mM NaOH
Figure 1 Separation of monondash and disaccharides as well as polyols using CEofixtrade Carbo kit
Figure 2 Follow-up of glucose during fermentation of cell culture in RPMI medium with an analysis time of 4 minutes
Figure 3 Analysis of anions and organic acids standards using Anions Analysis kit
CaPIllary ElECTroPHorESIS
bio PHARMACEUTiCAL AnALysis
analysis of Proteins
Proteins are analyzed using CZE method with a buffer based on nitrilotri (methylphosphonic acid) or NTMP NTMP is very UV transparent and allows buffer preparation between pH 4 and 72 Monoclonal antibody therapy is using monoclonal antibodies (mAb) such as Immunoglobulin G (IgG)General conditions (figure 5)
bull PA 800 plus is used at 200 nmbull CEofixtrade NTMP is used at pH 72bull Samples are diluted with the sample diluent solution from the kitbull For identification IgG are purified using Melontrade Gel IgG
purification kit (Pierce Biotechnology Rockfort IL USA) see figure 6
analysis of CationsCations and aliphatic amines also do not absorb in the UV and an indirect UV detection at 200 nm is selected using a buffer at pH 42
General conditions to obtain separation as showed in figure 7
bull PA 800 plus with normal polarity and indirect detectionbull Cation Analysis kit (Beckman Coulter Brea CA USA)bull Samples are diluted with water
Kits may be obtained from Beckman Coulter Europe or from Beckman Coulter dealers in Europe
Figure 4 Follow-up of lactic acid during fermentation processThe analysis time is below 7 minutes
Figure 5 IgG in cell culture supernatant before and after concentration phase The analysis time is 7 minutes
Figure 6 Analysis of IgG after purification on Melontrade Gel IgG The analysis time is 6 minutes
Figure 7 Follow-up of ammonium during fermentation process The analysis time is below 5 minutes
Partnumber DescriptionB20754 CEofixtrade Carbo kit contains coating
buffer and testmix (200 tests per kit)B19759 Capillary for Carbo kit 25 μm ID x 60 cm
(Package of 3)A53537 Anion Analysis kit contains 3 capillaries
anion coating buffer rinse solution conditioner internal standard and test mix (500 tests per kit)
A53540 Cation Analysis kit contains 3 capillaries coating buffer rinse solution conditioner internal standard and test mix (500 tests per kit)
A71142 CEofixtrade NTMP kit contains coating buffer 50 mM pH 4 and pH 72 (100 to 200 tests per kit)
PHARMACEUTiCAL
aNalySIS oF PHarMaCEuTICal CouNTEr-IoNS uSINg aNIoN aNalySIS kIT (BECkMaN CoulTEr) amp CEofixtrade aNIoNS2
Figure 1
Application Note 040104
IntroductionPharmaceutical compounds are often charged compounds having a counter-ion This counter-ion is an important part of the formula weight This will have an effect on the effective concen-tration of the active compound of thedrug Also it is a requirement from regulatory agencies that pharmaceutical companies should test for the composition of all ingredients Capillary electrophoresis (CE) is a good candidate
to perform this test For basic drug the counter ion will have a negative charge so the CE will be operated with inverse polarity Most counter-ions organic acid or inorganic ion will not absorb in the UV For this reason an indirect detection technique will be used But some of them can be detected at 200 nm Both option are presented in this application note
Separation with CEofixtradeAnalysis with PACE MDQ equipped with UV filter detector at 230nm Capillary 75μm x 60 cm (50cm tot the detector) Separation is performed at 30kV with inverse polarity and indirect detection Anion Analysis kit (Beckman Coulter) is composed of a initiator buffer and an adapted pyridine-dicarboxilic buffer at pH 54 Figure 1 and 2 electropherogram of several anions and organic acids See also table 1 and 2 for recorded migration time Octanoic acid is used as internal standard (IS)
Figure 2
PHARMACEUTiCAL
Table 1ORGANIC ANIONSMT in min Anions 5 Anions 2Acetate 471Benzoate 1036Citrate 421Camphorsulfonate 589Di-benzoyl-tartrate 507Di-p-Toluoyl-tartrate 538Fumarate 6712-Hydroxybenzoate 643Hydroxybutanedioate 3932-Hydroxypropanoate 485Maleate 399Malonate 389Mandelate 840Methanesulfonate 3994-methylbenzenesulfonate 427Oxalate 328 380Propanoate 523Succinate 428Tartrate 373
Table 2INORGANIC ANIONSMT in min Anions 5 Anions 2Nitrate HNO3 293 255Phosphate H3PO4 510Sulfate H2SO4 311Chloride HCl 280Bromide HBr 277 240
Table 1 and 2 Recorded migration time in minutes for the different anions analysed with CEofixtrade Anion Analysis kit (Beckman Coulter) andor CEofixtrade Anions2
Separation with CEofixtrade anions2 (see figure 3)
Analysis with PACE MDQ equipped with UV filter detector at 200nm Capillary 75μm x 60 cm (50cm to the detector) Separation is performed at 30kV with inverse polarity and direct detection
CEofixtradeAnions2 is composed of a initiator buffer and an adapted phosphate buffer at pH 25
Figure 3
ANIoN aNalySIS kIT (BECkMaN CoulTEr) amp CEofixtrade aNIoNS2
PHARMACEUTiCAL
CouNTErIoN aNalySIS
Application Note 061026
IntroductionMost drugsrsquo molecules are charged molecules which are weak bases or acids wich have a counterion Basic drugs may have an inorganic salt or organic acid as a counterion and acidic drugs a metal cation Regulatory agencies (US FDA European Pharmacopeiahellip) require that pharmaceu-tical products should be tested for their composition ie their identity strength quality and purity and this for the active as well as for the inactive ingredients This means that the determination of the counterion is an important part of the determination of the purity of the drug One of the characteristics of many of those ions is that they are UV transparent Most Capillary Electrophoresis instruments are equipped with a UV detector For this reason a special technique called indirect UV detection is often applied Phosphate (PO4) is an interesting molecule owing its three pKa (197 682 and 125) wich may have some disturbing interaction with the capillary wall
general principleBy nature ions are highly charged polar species which means they are very suitable for being analyzed by Capillary Electrophoresis (CE) When carrying out pharmaceutical analyses we usually deal with small organic and inorganic anions and small cations or aliphatic amines
As most anions are characterized by poor UV absorption indirect UV detection is used For this purpose we use in the buffer an absorbing co-ion also called a probe which has the same charge sign as the analyte The analyte will displace the probe in the buffer in such a way that a single charged analyte ion will displace a single charged probe ion while a double charged analyte ion would displace two single charged probe ions (Fig 1) The instrumentrsquos detector will record less absorption or a negative peak When the detector is set in the indirect detection mode we observe an electropherogram with positive peaks (Fig 2) Because of the high mobility of most ions of interest separation is performed in the co-electro osmotic mode This means for anions that the anode is placed at the detector side In this case we speak about reverse polarity or ano-dic separation mode This also means that we need to reverse the EOF (Electro Osmotic Flow) By rinsing the capillary with long-chain aliphatic quaternary ammonium surfactants or with a poly-cation the charge at the inside wall of the charge on the inner surface of the capillary will be positive When current is applied the EOF generated will move towards the anode The cationic polymer surfactants are also called electro-osmo-tic flow modifiers
Phosphate as an example for drug stoichiometry and impurity determination using Capillary Electrophoresis
Figure 2
Figure 1
PHARMACEUTiCAL
Figure 4
Figure 3
CouNTErIoN aNalySIS
Counterion determinationMethod optimisation and resultA testmix was run using Anion Analysis kit (Beckman Coulter) consisting of Chloride Nitrate Sulphate Fluoride Phosphate and Propionate at 20 μgL (Fig 3 trace a) Phosphate and Fluoride clearly show a tailing of their peak which will deteriorate the quantification of the analyte However it was found that by replacing the water in the rinse step (step 7) with a 01 M HCl solution the tailing could be corrected (Fig 3 trace b)
A Primaquine diphosphate (PQ) solution is prepared in order to have a concen-tration in phosphate ions of around 200 mgL in solution (Fig 4) Sodium phosphate standards are prepared at 70 100 and 130 of the nominal value (200 mgL) which corresponds to a concentration of 140 200 and 260 mgL Octanoic acid (C8) is chosen as internal standard A sequence is set up alternating standards 3 times and samples (Table 1)
Instrument and methods
Instrument PACEtrade MDQ (Beckman Coulter Fullerton CA US) Detection indirect UV with filter at 230 nmPolarity set in ldquoreverse polarityrdquo mode
Buffers Anion Analysis kit (Beckman Coulter Brea CA US)Initiator (pyridine-dicarboxylic acid pH 56 with polycation)Accelerator (pyridine-dicarboxylic acid pH 56 with polycation)CEofixtrade Anions8 buffer (Analis Suarleacutee Belgium) consisting ofAnions8 Initiator (pyridine-dicarboxylic acid pH 81 with polycation)Anions8 Accelerator (pyridine-dicarboxylic acid pH 81 with polycation)
Capillary Fused silica capillary (Polymicro Technologies Phoenix AZ US)60 cm total length x 75 micro ID
Method Standard methodrinse 30 sec at 20 psi with Anions Initiator bufferrinse 30 sec at 20 psi with Anions Accelerator bufferinject sample 8 sec at 05 psiinject water plug 10 sec at 01 psiseparate 8 min at 30 KV with a 1 min ramping timerinse 30 sec at 20 psi with NaOH 01 Mrinse 30 sec at 20 psi with H2O The standard method was adapted
Sample Counterion determinationPrimaquine diphosphate 98 (Aldrich ) CAS 63-45-6Impurity profileStandard of phosphate at 04 mgL and on a pharmaceutical sample
CouNTErIoN aNalySIS
Conclusion With a linearity of R2 gt 0999 (Fig 5 and Table 2) a SD on migration time lt 05 and a target value on PQ of 9982 and SD of 011 (Table 3) the kit is suited for determination of phosphate counterion in PQ Y=101x - 00093R2 = 09998
Migration TimeRelative MT
AreaRelative AreaPhosphate C-8 Phosphate C-8
70 5054 6480 0780 34953 50039 06985100 5033 6475 0777 51118 51032 10017130 5017 6483 0774 62969 48111 13088PQ 5029 6467 0778 48824 50915 09589130 5021 6480 0774 62336 47961 1299770 5050 6475 0780 34571 49590 06971100 5033 6475 0777 49882 50173 09942PQ 5029 6471 0777 45283 47314 09571100 5025 6458 0778 50254 50688 09914130 5013 6463 0776 64390 49191 1309070 5037 6446 0781 36527 51926 07034PQ 5017 6442 0779 47990 50048 09589 Mean 5030 6468 0778 49749 SD 025 021 030 279
Table 1 Sequence run of standards at 70 100 and 130 level and Primaquine diphosphate (PQ)
PQ
MeanSD
Area Relative Area09589095710958909583011
Target Value9982996299819975011
4812
48824452834799047365391
Table 3 Primaquine diphosphate (PQ) value regrouping of the data of the samples compared with the target value
Std phosphate
70
Mean SD
Area Relative Area Target Value1711
34953345713652735350293
06985069710703406997047
9979 995910049 9996 047
100
MeanSD
269
51118498825025450418126
1001709942099140995B053
10017 9944 9914 9958 053
130
MeanSD
3510
62969623366439063232166
13088129971309013058041
10068 99981006910045 041
Table 2 Rearrangement of data according to the standard values Relative area is obtained by the ratio of the area by the area of the IS (Octanoic acid) Tar-get Value is the measured value divided by the target value of the standard
CouNTErIoN aNalySIS
Impurity profilingAt pH 56 the phosphate ion bears one negative charge while pyridine-dicarboxylate has two negative charges As a conse-quence two phosphate ions are needed to displace one pyridine-dicarboxylate ion
At pH 81 the phosphate ion carries two negative charges and thus one phosphate ion will displace one pyridine-dicarboxylate ion this results in a peak twice as high for the same concentra-tion of phosphate ions Therefore at pH 81 the LOD and the LOQ of the phosphate ion is lower which is favourable to reach the 01 impurity limit (Fig 6) The migration time of phosphate is shorter because it bears two negative charges and has a higher mobility
Influence of main compound on impurityThe drug of interest is an HCl salt where we want to quantify the phosphate as impurity For this purpose we have analysed the effect of the excess of chloride in a standard phosphate solution
As a general rule the ionic strength of the sample should be 10 times lower than the background electrolyte This might be a challenge where the anionic impurity will be determined in a high salt concentration solution For example an ion with a high mobility such as chloride may have a de-stacking effect on an analyte with a lower mobility the effect being that the peak height of the analyte of interest will be decreased and also the area of the peak On the other and an ion with less mobility may have a stacking effect This technique is used to improve the qua-lity of a minor peak and is called ldquoisotachophoretic (ITP) sample stackingrdquo In classical ITP the sample is injected between a leading electrolyte which contains a high concentration of a high-mobility ion with the same charge as the analyte of interest and a terminating electrolyte which contains an ion with a lower mobility than the analyte of interest An alternative to
ITP is sample self-stacking where the sample contains a leading electrolyte such as a chloride ion and the terminating electrolyte
The influence of stacking was tested on standards to check the robustness of the buffer A sequence was set up with phosphate at 04 mgL as a sample and varying levels of hepthanesulfonate (between 0 and 400 mgL) as the terminating ion The area and height was recorded (Table 4 and Fig 7) We may observe an increase of area and height for the phosphate peak However the RSD at this level being below 10 we chose to analyse without the restacking technique (Fig 8)
ConclusionThe CEofix Anions buffer may be used for impurity profiling when looking for remaining phosphate in a drug
Chloride C-7-S03 HP04 (04 mgL) mgL mgL Area Height
Run 1Run 2Run 3Run 4Run 5Run 6
400400400400400 400
400200100 50 20 0
442456455 395 355396
SD 982
293266264238224250
Table 4 Area of phosphate with variable quantity of terminating ion
FooD - PHARMACEUTiCAL - CHEMiCAL
IntroductionAlkali and alkaline earth metals are routinely analysed in aqueous samples in very different laboratories such as in food and beverage pharmaceutical industries but also in waste plants chemical plants and many othersCapillary electrophoresis (CE) is a analytical technique used in many laboratories CE instruments are usually equipped with a UV detector the problem is that the analysed cations do not absorb sufficient to allow direct photometric detection For this reason an indirect detection technique is used where the buffer is absorbing and the analytes will appear as negative peaks The computer wills inverse the signal to obtain a normal looking electropherogram (figure 2) To improve separation a complexing agent is used such as a crown-ether
MethodAnalyses are performed on PACE MDQ (Beckman Coulter) or equivalent CE instrument Detection is done at 200 nm using indirect detection option The polarity is set in the normal mode from anode to cathode To improve reproducibility a fused silica capillary is dynamically coated () with successive runs of buffered polycation then with a buffered polyanion (figure 3) The capillary is then rinsed with the separation buffer After sample injection and separation the capillary is cleaned with LiOH solution LiOH is used to avoid possible carry-over of Na When Li is the analyte of interest NaOH solution should be used instead
CEofixtrade CaTIoNS Hr
analysis of cations using CEofixtrade Cation Hr
Application Note 043003
Figure 1 Test mix (about 10 mgL) analysed with CEofixtrade Cation HR
Figure 2 Indirect detection the analytes appears as negative peak The software will inverse the signal
Fused silica capillary
Polycation INITIATOR
Polyanion ACCELERATOR
Figure 3 Principle of dynamic double coating of the fused silica capillary
FooD - PHARMACEUTiCAL - CHEMiCAL
Figure 4 Standards injected at 1 5 10 and 25 mgL give excellent linearityrsquosthe goodness of fit (R2)is as follow NH4 09999 Na 09993 K 09991 Mg 09998 Ca 09998
Table 1 Migration time reproducibility will be below 1 when starting with a new capillary after a few runs it drops down to values as described in this table
N=10 NH4 Na K Mg CaMean MT (min) 2663 3137 3368 3652 3817RSD () 005 005 004 006 006
CEofixtrade CaTIoNS Hr
CEofixtrade NTMP
bio PHARMACEUTiCAL AnALysis Blood productsIntravenous immunoglobulin are prepared from pooled blood and may be used as antibody replacement therapy It is impor-tant to quantify the remaining albumin fraction Figure 4 show the separation of albumin in presence of immunoglobulin Short‐end injection is used to increase throughput Very good linearity is obtained between 05 mgml to 10 mgml of albumin in presence of 100 mgml of IgG
Determination of transferrinDuring the development of the process of purification of transferrin from blood the CEofixtrade NTMP kit is used to quan-tify the amount of transferrin (see also application note 101607 ldquoPurification of Transferrin Isoforms from serumrdquo)
Recombinant proteinThe stability of a recombinant protein was followed using the CEofixtrade NTMP kit Samples were stored at 40degC 25degC and 5degC and analyzed
SummaryThe CEofixtrade NTMP kit allows easy analysis by capillary electro-phoresis of different proteins and peptides Good sensitivity and reproducibility is observed for a range of applications
See also Application note 12064 ldquoApplication of Capillary Electrophoresis in Optimization and Control of Fermentation and Cell Culturerdquo
Figure 4 Overlay of blood immunoglobulin with increased amount of albumin
Figure 5 Separation of Apo‐Transferrin at increasing concentration
Figure 6 Analysis of recombinant protein stored at different temperature
The CEofixtrade NTMP buffer may be ordered from Beckman Coulter or Beckman Coulter distributorsA71142 (10‐004780) CEofixtrade NTMP kit 50mM pH 4 to 72 (100 to 200 tests per kit) 10‐004785 CEofix trade NTMP Diluent (50mL)
Copyrightcopy 2013 Analis
IntroductionHuman normal immunoglobulin for intravenous administration (IVIg) is a liquid or freeze‐dried preparation containing mainly im-munoglobulin G (IgG) while albumin may be added as stabilizer (Ph Eur) Monographs describe that the protein composition should be examine by zone electrophoresis Traditionally this is done using cellulose acetate gel or agarose gel and barbital buffer The method is the same as for serum protein analysis (Figure 1) and quantitation can be done using a gel scanner (Figure 2) We describe here a method using capillary electro-phoresis and CEofixtrade NTMP buffer kit (Analis Suarleacutee Belgium)
Methods and SeparationInstrumentationSuitable instruments are capillary electrophoresis such as PA800 plus or PACE MDQ (Beckman Coulter Brea CA USA) using a UV detector at 200 nm Capillary are fused silica (Polymicro Phoenix AZ USA) 50μm internal diameter 602 cm total length and 10 cm to the detector as the short end injection side is used
CEofixtrade NTMP
Fast analysis of Human normal Immunoglobulin
Figure 3 Analysis of Human immunoglobulin BRP reference solution (EDQM Reference standard) Overlay of 4 runs
Figure 4 Overlay of blood immunoglobulin with increased amount of albumin
bio PHARMACEUTiCAL AnALysisApplication note 130412
Figure 5 Calibration of albumin between 05 and 10 mg mL showing a goodness of fit R2 gt 099
Figure 1 Agarose gel electrophoresis of serum proteins
Figure 2 Gel scan ofserum proteins
CEofixtrade NTMP
bio PHARMACEUTiCAL AnALysis MethodThe buffer used is CEofixtrade NTMP buffer at pH 62 (obtained by mixing 2 g of pH 4 buffer with 8 g of pH 72 buffer from the kit) The samples are diluted (40μLmdash360 μL) with the sample diluent from the kit Before separation the capillary is coated with CEofixtrade NTMP Initiator solution and CEofixtrade NTMP Buffer as described in the instructions for use Sample is injected at the short end for 8 sec at 05 psi followed by a water plug (7 sec at 02 psi) Separation is done at 12 or 15 kV After separation the capillary is rinsed with 01 M NaOH
Separation of BRPFigure 3 shows an overlay of 4 separations of the Human Immunoglobulin for electrophoresis BRP batch 2 reference standard The first peak represents the immunoglobulin peak and the second the albumin peak
Quantification of albumin in IVIgFigure 4 shows the separation of a sample containing 100 mgmL of IgG and an increasing quantity of albumin between 05 mgmL and 10 mgmL The calibration curve is showed in figure 5
SummaryThe CEofixtrade NTMP kit allows easy and fast analysis by capillary electrophoresis of different human immunoglobulin (IVIg) for quantitation of albumin Good reproducibility is obtained for routine analysis
The ldquoCEofixtrade NTMP buffer may be ordered from Beckman Coulter or Beckman Coulter distributorsA71142 (10‐004780) CEofixtrade NTMP kit 50mM pH 4 to 72 (100 to 200 tests per kit)10‐004785 CEofix trade NTMP Diluent (50mL)
Copyrightcopy 2013 Analis
CaPIllary ElECTroPHorESIS
application of Capillary Electrophoresis in optimization and Control of Fermentation and Cell Culture
bio PHARMACEUTiCAL AnALysisApplication note 12064
IntroductionldquoThe performance of fermentation and cell culture are critical to the quality and consistency of production of therapeutic productsrdquo (1) Besides parameters such as temperature pH and dissolved oxygen it is important to follow the nutrients and metabolites produced Capillary electrophoresis is an excellent tool for this purpose as it combines fast separation easy sample preparation and availability of different kits and methods for the same instrument
In this ldquoApplication noterdquo we will describe different methods for analysis of organic acids cations carbohydrates and proteins all using the Beckman Coulter PA 800 plus instrument (Beckman Coulter Brea CA USA)(1) Lobesh Bhattacharyya (2011) BioPharm International Supplements 24 12-22
analysis of Carbohydrates This method is using a direct UV detection at 270 nm by using a DAD detector and a buffer at high pH (126) see figure 1
General conditions used to obtain separation showed in figure 2
bull PA 800 plus with short end injection to obtain an analysis time of 4 minutes
bull CEofixtrade Carbo kit (Analis Suarleacutee Belgium) using an optimized method for carbohydrates analysis (patent pending)
bull Samples are diluted with water no other sample preparation is required
analysis of anions and organic acids Most of the anions and organic acids do not absorb in the UV for this reason indirect UV detection is used at 230 nm by using a buffer at pH 56 (figure 3)
General conditions to obtain separation showed in figure 4
bull PA 800 plus with inverse polarity and indirect detectionbull Anion Analysis kit (Beckman Coulter Brea CA USA)bull Samples are diluted with a solution of 5 mM NaOH
Figure 1 Separation of monondash and disaccharides as well as polyols using CEofixtrade Carbo kit
Figure 2 Follow-up of glucose during fermentation of cell culture in RPMI medium with an analysis time of 4 minutes
Figure 3 Analysis of anions and organic acids standards using Anions Analysis kit
CaPIllary ElECTroPHorESIS
bio PHARMACEUTiCAL AnALysis
analysis of Proteins
Proteins are analyzed using CZE method with a buffer based on nitrilotri (methylphosphonic acid) or NTMP NTMP is very UV transparent and allows buffer preparation between pH 4 and 72 Monoclonal antibody therapy is using monoclonal antibodies (mAb) such as Immunoglobulin G (IgG)General conditions (figure 5)
bull PA 800 plus is used at 200 nmbull CEofixtrade NTMP is used at pH 72bull Samples are diluted with the sample diluent solution from the kitbull For identification IgG are purified using Melontrade Gel IgG
purification kit (Pierce Biotechnology Rockfort IL USA) see figure 6
analysis of CationsCations and aliphatic amines also do not absorb in the UV and an indirect UV detection at 200 nm is selected using a buffer at pH 42
General conditions to obtain separation as showed in figure 7
bull PA 800 plus with normal polarity and indirect detectionbull Cation Analysis kit (Beckman Coulter Brea CA USA)bull Samples are diluted with water
Kits may be obtained from Beckman Coulter Europe or from Beckman Coulter dealers in Europe
Figure 4 Follow-up of lactic acid during fermentation processThe analysis time is below 7 minutes
Figure 5 IgG in cell culture supernatant before and after concentration phase The analysis time is 7 minutes
Figure 6 Analysis of IgG after purification on Melontrade Gel IgG The analysis time is 6 minutes
Figure 7 Follow-up of ammonium during fermentation process The analysis time is below 5 minutes
Partnumber DescriptionB20754 CEofixtrade Carbo kit contains coating
buffer and testmix (200 tests per kit)B19759 Capillary for Carbo kit 25 μm ID x 60 cm
(Package of 3)A53537 Anion Analysis kit contains 3 capillaries
anion coating buffer rinse solution conditioner internal standard and test mix (500 tests per kit)
A53540 Cation Analysis kit contains 3 capillaries coating buffer rinse solution conditioner internal standard and test mix (500 tests per kit)
A71142 CEofixtrade NTMP kit contains coating buffer 50 mM pH 4 and pH 72 (100 to 200 tests per kit)
PHARMACEUTiCAL
aNalySIS oF PHarMaCEuTICal CouNTEr-IoNS uSINg aNIoN aNalySIS kIT (BECkMaN CoulTEr) amp CEofixtrade aNIoNS2
Figure 1
Application Note 040104
IntroductionPharmaceutical compounds are often charged compounds having a counter-ion This counter-ion is an important part of the formula weight This will have an effect on the effective concen-tration of the active compound of thedrug Also it is a requirement from regulatory agencies that pharmaceutical companies should test for the composition of all ingredients Capillary electrophoresis (CE) is a good candidate
to perform this test For basic drug the counter ion will have a negative charge so the CE will be operated with inverse polarity Most counter-ions organic acid or inorganic ion will not absorb in the UV For this reason an indirect detection technique will be used But some of them can be detected at 200 nm Both option are presented in this application note
Separation with CEofixtradeAnalysis with PACE MDQ equipped with UV filter detector at 230nm Capillary 75μm x 60 cm (50cm tot the detector) Separation is performed at 30kV with inverse polarity and indirect detection Anion Analysis kit (Beckman Coulter) is composed of a initiator buffer and an adapted pyridine-dicarboxilic buffer at pH 54 Figure 1 and 2 electropherogram of several anions and organic acids See also table 1 and 2 for recorded migration time Octanoic acid is used as internal standard (IS)
Figure 2
PHARMACEUTiCAL
Table 1ORGANIC ANIONSMT in min Anions 5 Anions 2Acetate 471Benzoate 1036Citrate 421Camphorsulfonate 589Di-benzoyl-tartrate 507Di-p-Toluoyl-tartrate 538Fumarate 6712-Hydroxybenzoate 643Hydroxybutanedioate 3932-Hydroxypropanoate 485Maleate 399Malonate 389Mandelate 840Methanesulfonate 3994-methylbenzenesulfonate 427Oxalate 328 380Propanoate 523Succinate 428Tartrate 373
Table 2INORGANIC ANIONSMT in min Anions 5 Anions 2Nitrate HNO3 293 255Phosphate H3PO4 510Sulfate H2SO4 311Chloride HCl 280Bromide HBr 277 240
Table 1 and 2 Recorded migration time in minutes for the different anions analysed with CEofixtrade Anion Analysis kit (Beckman Coulter) andor CEofixtrade Anions2
Separation with CEofixtrade anions2 (see figure 3)
Analysis with PACE MDQ equipped with UV filter detector at 200nm Capillary 75μm x 60 cm (50cm to the detector) Separation is performed at 30kV with inverse polarity and direct detection
CEofixtradeAnions2 is composed of a initiator buffer and an adapted phosphate buffer at pH 25
Figure 3
ANIoN aNalySIS kIT (BECkMaN CoulTEr) amp CEofixtrade aNIoNS2
PHARMACEUTiCAL
CouNTErIoN aNalySIS
Application Note 061026
IntroductionMost drugsrsquo molecules are charged molecules which are weak bases or acids wich have a counterion Basic drugs may have an inorganic salt or organic acid as a counterion and acidic drugs a metal cation Regulatory agencies (US FDA European Pharmacopeiahellip) require that pharmaceu-tical products should be tested for their composition ie their identity strength quality and purity and this for the active as well as for the inactive ingredients This means that the determination of the counterion is an important part of the determination of the purity of the drug One of the characteristics of many of those ions is that they are UV transparent Most Capillary Electrophoresis instruments are equipped with a UV detector For this reason a special technique called indirect UV detection is often applied Phosphate (PO4) is an interesting molecule owing its three pKa (197 682 and 125) wich may have some disturbing interaction with the capillary wall
general principleBy nature ions are highly charged polar species which means they are very suitable for being analyzed by Capillary Electrophoresis (CE) When carrying out pharmaceutical analyses we usually deal with small organic and inorganic anions and small cations or aliphatic amines
As most anions are characterized by poor UV absorption indirect UV detection is used For this purpose we use in the buffer an absorbing co-ion also called a probe which has the same charge sign as the analyte The analyte will displace the probe in the buffer in such a way that a single charged analyte ion will displace a single charged probe ion while a double charged analyte ion would displace two single charged probe ions (Fig 1) The instrumentrsquos detector will record less absorption or a negative peak When the detector is set in the indirect detection mode we observe an electropherogram with positive peaks (Fig 2) Because of the high mobility of most ions of interest separation is performed in the co-electro osmotic mode This means for anions that the anode is placed at the detector side In this case we speak about reverse polarity or ano-dic separation mode This also means that we need to reverse the EOF (Electro Osmotic Flow) By rinsing the capillary with long-chain aliphatic quaternary ammonium surfactants or with a poly-cation the charge at the inside wall of the charge on the inner surface of the capillary will be positive When current is applied the EOF generated will move towards the anode The cationic polymer surfactants are also called electro-osmo-tic flow modifiers
Phosphate as an example for drug stoichiometry and impurity determination using Capillary Electrophoresis
Figure 2
Figure 1
PHARMACEUTiCAL
Figure 4
Figure 3
CouNTErIoN aNalySIS
Counterion determinationMethod optimisation and resultA testmix was run using Anion Analysis kit (Beckman Coulter) consisting of Chloride Nitrate Sulphate Fluoride Phosphate and Propionate at 20 μgL (Fig 3 trace a) Phosphate and Fluoride clearly show a tailing of their peak which will deteriorate the quantification of the analyte However it was found that by replacing the water in the rinse step (step 7) with a 01 M HCl solution the tailing could be corrected (Fig 3 trace b)
A Primaquine diphosphate (PQ) solution is prepared in order to have a concen-tration in phosphate ions of around 200 mgL in solution (Fig 4) Sodium phosphate standards are prepared at 70 100 and 130 of the nominal value (200 mgL) which corresponds to a concentration of 140 200 and 260 mgL Octanoic acid (C8) is chosen as internal standard A sequence is set up alternating standards 3 times and samples (Table 1)
Instrument and methods
Instrument PACEtrade MDQ (Beckman Coulter Fullerton CA US) Detection indirect UV with filter at 230 nmPolarity set in ldquoreverse polarityrdquo mode
Buffers Anion Analysis kit (Beckman Coulter Brea CA US)Initiator (pyridine-dicarboxylic acid pH 56 with polycation)Accelerator (pyridine-dicarboxylic acid pH 56 with polycation)CEofixtrade Anions8 buffer (Analis Suarleacutee Belgium) consisting ofAnions8 Initiator (pyridine-dicarboxylic acid pH 81 with polycation)Anions8 Accelerator (pyridine-dicarboxylic acid pH 81 with polycation)
Capillary Fused silica capillary (Polymicro Technologies Phoenix AZ US)60 cm total length x 75 micro ID
Method Standard methodrinse 30 sec at 20 psi with Anions Initiator bufferrinse 30 sec at 20 psi with Anions Accelerator bufferinject sample 8 sec at 05 psiinject water plug 10 sec at 01 psiseparate 8 min at 30 KV with a 1 min ramping timerinse 30 sec at 20 psi with NaOH 01 Mrinse 30 sec at 20 psi with H2O The standard method was adapted
Sample Counterion determinationPrimaquine diphosphate 98 (Aldrich ) CAS 63-45-6Impurity profileStandard of phosphate at 04 mgL and on a pharmaceutical sample
CouNTErIoN aNalySIS
Conclusion With a linearity of R2 gt 0999 (Fig 5 and Table 2) a SD on migration time lt 05 and a target value on PQ of 9982 and SD of 011 (Table 3) the kit is suited for determination of phosphate counterion in PQ Y=101x - 00093R2 = 09998
Migration TimeRelative MT
AreaRelative AreaPhosphate C-8 Phosphate C-8
70 5054 6480 0780 34953 50039 06985100 5033 6475 0777 51118 51032 10017130 5017 6483 0774 62969 48111 13088PQ 5029 6467 0778 48824 50915 09589130 5021 6480 0774 62336 47961 1299770 5050 6475 0780 34571 49590 06971100 5033 6475 0777 49882 50173 09942PQ 5029 6471 0777 45283 47314 09571100 5025 6458 0778 50254 50688 09914130 5013 6463 0776 64390 49191 1309070 5037 6446 0781 36527 51926 07034PQ 5017 6442 0779 47990 50048 09589 Mean 5030 6468 0778 49749 SD 025 021 030 279
Table 1 Sequence run of standards at 70 100 and 130 level and Primaquine diphosphate (PQ)
PQ
MeanSD
Area Relative Area09589095710958909583011
Target Value9982996299819975011
4812
48824452834799047365391
Table 3 Primaquine diphosphate (PQ) value regrouping of the data of the samples compared with the target value
Std phosphate
70
Mean SD
Area Relative Area Target Value1711
34953345713652735350293
06985069710703406997047
9979 995910049 9996 047
100
MeanSD
269
51118498825025450418126
1001709942099140995B053
10017 9944 9914 9958 053
130
MeanSD
3510
62969623366439063232166
13088129971309013058041
10068 99981006910045 041
Table 2 Rearrangement of data according to the standard values Relative area is obtained by the ratio of the area by the area of the IS (Octanoic acid) Tar-get Value is the measured value divided by the target value of the standard
CouNTErIoN aNalySIS
Impurity profilingAt pH 56 the phosphate ion bears one negative charge while pyridine-dicarboxylate has two negative charges As a conse-quence two phosphate ions are needed to displace one pyridine-dicarboxylate ion
At pH 81 the phosphate ion carries two negative charges and thus one phosphate ion will displace one pyridine-dicarboxylate ion this results in a peak twice as high for the same concentra-tion of phosphate ions Therefore at pH 81 the LOD and the LOQ of the phosphate ion is lower which is favourable to reach the 01 impurity limit (Fig 6) The migration time of phosphate is shorter because it bears two negative charges and has a higher mobility
Influence of main compound on impurityThe drug of interest is an HCl salt where we want to quantify the phosphate as impurity For this purpose we have analysed the effect of the excess of chloride in a standard phosphate solution
As a general rule the ionic strength of the sample should be 10 times lower than the background electrolyte This might be a challenge where the anionic impurity will be determined in a high salt concentration solution For example an ion with a high mobility such as chloride may have a de-stacking effect on an analyte with a lower mobility the effect being that the peak height of the analyte of interest will be decreased and also the area of the peak On the other and an ion with less mobility may have a stacking effect This technique is used to improve the qua-lity of a minor peak and is called ldquoisotachophoretic (ITP) sample stackingrdquo In classical ITP the sample is injected between a leading electrolyte which contains a high concentration of a high-mobility ion with the same charge as the analyte of interest and a terminating electrolyte which contains an ion with a lower mobility than the analyte of interest An alternative to
ITP is sample self-stacking where the sample contains a leading electrolyte such as a chloride ion and the terminating electrolyte
The influence of stacking was tested on standards to check the robustness of the buffer A sequence was set up with phosphate at 04 mgL as a sample and varying levels of hepthanesulfonate (between 0 and 400 mgL) as the terminating ion The area and height was recorded (Table 4 and Fig 7) We may observe an increase of area and height for the phosphate peak However the RSD at this level being below 10 we chose to analyse without the restacking technique (Fig 8)
ConclusionThe CEofix Anions buffer may be used for impurity profiling when looking for remaining phosphate in a drug
Chloride C-7-S03 HP04 (04 mgL) mgL mgL Area Height
Run 1Run 2Run 3Run 4Run 5Run 6
400400400400400 400
400200100 50 20 0
442456455 395 355396
SD 982
293266264238224250
Table 4 Area of phosphate with variable quantity of terminating ion
FooD - PHARMACEUTiCAL - CHEMiCAL
IntroductionAlkali and alkaline earth metals are routinely analysed in aqueous samples in very different laboratories such as in food and beverage pharmaceutical industries but also in waste plants chemical plants and many othersCapillary electrophoresis (CE) is a analytical technique used in many laboratories CE instruments are usually equipped with a UV detector the problem is that the analysed cations do not absorb sufficient to allow direct photometric detection For this reason an indirect detection technique is used where the buffer is absorbing and the analytes will appear as negative peaks The computer wills inverse the signal to obtain a normal looking electropherogram (figure 2) To improve separation a complexing agent is used such as a crown-ether
MethodAnalyses are performed on PACE MDQ (Beckman Coulter) or equivalent CE instrument Detection is done at 200 nm using indirect detection option The polarity is set in the normal mode from anode to cathode To improve reproducibility a fused silica capillary is dynamically coated () with successive runs of buffered polycation then with a buffered polyanion (figure 3) The capillary is then rinsed with the separation buffer After sample injection and separation the capillary is cleaned with LiOH solution LiOH is used to avoid possible carry-over of Na When Li is the analyte of interest NaOH solution should be used instead
CEofixtrade CaTIoNS Hr
analysis of cations using CEofixtrade Cation Hr
Application Note 043003
Figure 1 Test mix (about 10 mgL) analysed with CEofixtrade Cation HR
Figure 2 Indirect detection the analytes appears as negative peak The software will inverse the signal
Fused silica capillary
Polycation INITIATOR
Polyanion ACCELERATOR
Figure 3 Principle of dynamic double coating of the fused silica capillary
FooD - PHARMACEUTiCAL - CHEMiCAL
Figure 4 Standards injected at 1 5 10 and 25 mgL give excellent linearityrsquosthe goodness of fit (R2)is as follow NH4 09999 Na 09993 K 09991 Mg 09998 Ca 09998
Table 1 Migration time reproducibility will be below 1 when starting with a new capillary after a few runs it drops down to values as described in this table
N=10 NH4 Na K Mg CaMean MT (min) 2663 3137 3368 3652 3817RSD () 005 005 004 006 006
CEofixtrade CaTIoNS Hr
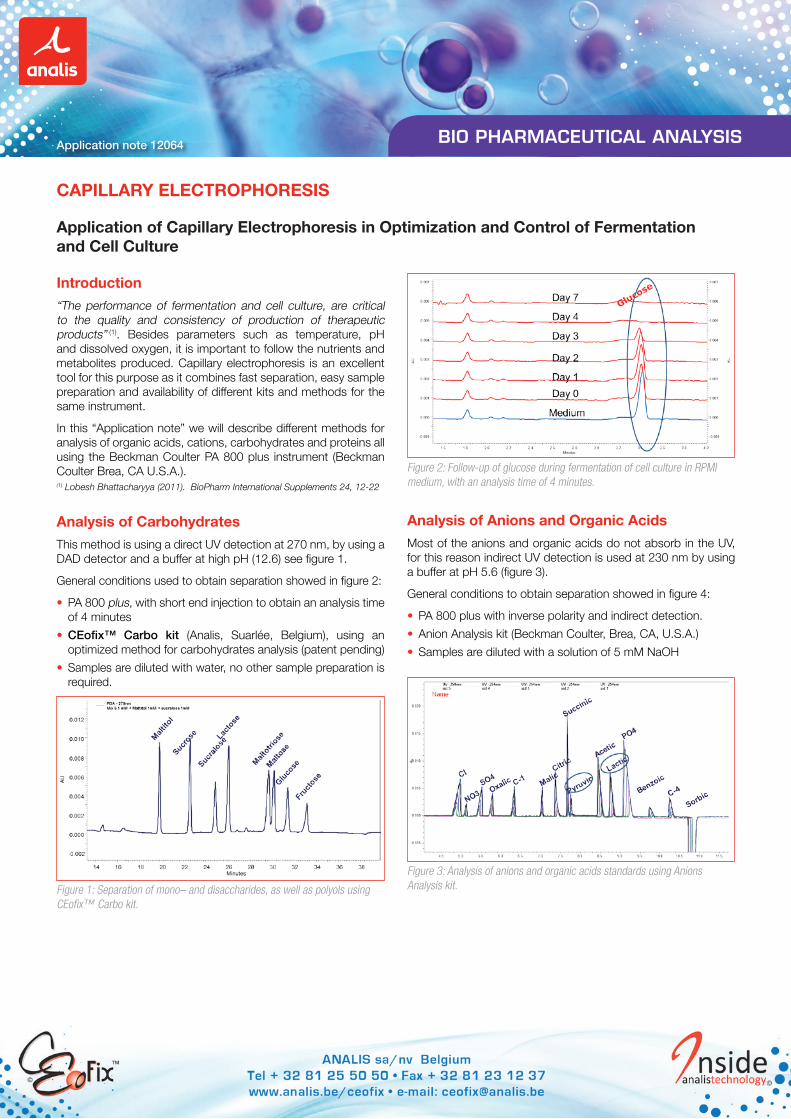
CaPIllary ElECTroPHorESIS
application of Capillary Electrophoresis in optimization and Control of Fermentation and Cell Culture
bio PHARMACEUTiCAL AnALysisApplication note 12064
IntroductionldquoThe performance of fermentation and cell culture are critical to the quality and consistency of production of therapeutic productsrdquo (1) Besides parameters such as temperature pH and dissolved oxygen it is important to follow the nutrients and metabolites produced Capillary electrophoresis is an excellent tool for this purpose as it combines fast separation easy sample preparation and availability of different kits and methods for the same instrument
In this ldquoApplication noterdquo we will describe different methods for analysis of organic acids cations carbohydrates and proteins all using the Beckman Coulter PA 800 plus instrument (Beckman Coulter Brea CA USA)(1) Lobesh Bhattacharyya (2011) BioPharm International Supplements 24 12-22
analysis of Carbohydrates This method is using a direct UV detection at 270 nm by using a DAD detector and a buffer at high pH (126) see figure 1
General conditions used to obtain separation showed in figure 2
bull PA 800 plus with short end injection to obtain an analysis time of 4 minutes
bull CEofixtrade Carbo kit (Analis Suarleacutee Belgium) using an optimized method for carbohydrates analysis (patent pending)
bull Samples are diluted with water no other sample preparation is required
analysis of anions and organic acids Most of the anions and organic acids do not absorb in the UV for this reason indirect UV detection is used at 230 nm by using a buffer at pH 56 (figure 3)
General conditions to obtain separation showed in figure 4
bull PA 800 plus with inverse polarity and indirect detectionbull Anion Analysis kit (Beckman Coulter Brea CA USA)bull Samples are diluted with a solution of 5 mM NaOH
Figure 1 Separation of monondash and disaccharides as well as polyols using CEofixtrade Carbo kit
Figure 2 Follow-up of glucose during fermentation of cell culture in RPMI medium with an analysis time of 4 minutes
Figure 3 Analysis of anions and organic acids standards using Anions Analysis kit
CaPIllary ElECTroPHorESIS
bio PHARMACEUTiCAL AnALysis
analysis of Proteins
Proteins are analyzed using CZE method with a buffer based on nitrilotri (methylphosphonic acid) or NTMP NTMP is very UV transparent and allows buffer preparation between pH 4 and 72 Monoclonal antibody therapy is using monoclonal antibodies (mAb) such as Immunoglobulin G (IgG)General conditions (figure 5)
bull PA 800 plus is used at 200 nmbull CEofixtrade NTMP is used at pH 72bull Samples are diluted with the sample diluent solution from the kitbull For identification IgG are purified using Melontrade Gel IgG
purification kit (Pierce Biotechnology Rockfort IL USA) see figure 6
analysis of CationsCations and aliphatic amines also do not absorb in the UV and an indirect UV detection at 200 nm is selected using a buffer at pH 42
General conditions to obtain separation as showed in figure 7
bull PA 800 plus with normal polarity and indirect detectionbull Cation Analysis kit (Beckman Coulter Brea CA USA)bull Samples are diluted with water
Kits may be obtained from Beckman Coulter Europe or from Beckman Coulter dealers in Europe
Figure 4 Follow-up of lactic acid during fermentation processThe analysis time is below 7 minutes
Figure 5 IgG in cell culture supernatant before and after concentration phase The analysis time is 7 minutes
Figure 6 Analysis of IgG after purification on Melontrade Gel IgG The analysis time is 6 minutes
Figure 7 Follow-up of ammonium during fermentation process The analysis time is below 5 minutes
Partnumber DescriptionB20754 CEofixtrade Carbo kit contains coating
buffer and testmix (200 tests per kit)B19759 Capillary for Carbo kit 25 μm ID x 60 cm
(Package of 3)A53537 Anion Analysis kit contains 3 capillaries
anion coating buffer rinse solution conditioner internal standard and test mix (500 tests per kit)
A53540 Cation Analysis kit contains 3 capillaries coating buffer rinse solution conditioner internal standard and test mix (500 tests per kit)
A71142 CEofixtrade NTMP kit contains coating buffer 50 mM pH 4 and pH 72 (100 to 200 tests per kit)
PHARMACEUTiCAL
aNalySIS oF PHarMaCEuTICal CouNTEr-IoNS uSINg aNIoN aNalySIS kIT (BECkMaN CoulTEr) amp CEofixtrade aNIoNS2
Figure 1
Application Note 040104
IntroductionPharmaceutical compounds are often charged compounds having a counter-ion This counter-ion is an important part of the formula weight This will have an effect on the effective concen-tration of the active compound of thedrug Also it is a requirement from regulatory agencies that pharmaceutical companies should test for the composition of all ingredients Capillary electrophoresis (CE) is a good candidate
to perform this test For basic drug the counter ion will have a negative charge so the CE will be operated with inverse polarity Most counter-ions organic acid or inorganic ion will not absorb in the UV For this reason an indirect detection technique will be used But some of them can be detected at 200 nm Both option are presented in this application note
Separation with CEofixtradeAnalysis with PACE MDQ equipped with UV filter detector at 230nm Capillary 75μm x 60 cm (50cm tot the detector) Separation is performed at 30kV with inverse polarity and indirect detection Anion Analysis kit (Beckman Coulter) is composed of a initiator buffer and an adapted pyridine-dicarboxilic buffer at pH 54 Figure 1 and 2 electropherogram of several anions and organic acids See also table 1 and 2 for recorded migration time Octanoic acid is used as internal standard (IS)
Figure 2
PHARMACEUTiCAL
Table 1ORGANIC ANIONSMT in min Anions 5 Anions 2Acetate 471Benzoate 1036Citrate 421Camphorsulfonate 589Di-benzoyl-tartrate 507Di-p-Toluoyl-tartrate 538Fumarate 6712-Hydroxybenzoate 643Hydroxybutanedioate 3932-Hydroxypropanoate 485Maleate 399Malonate 389Mandelate 840Methanesulfonate 3994-methylbenzenesulfonate 427Oxalate 328 380Propanoate 523Succinate 428Tartrate 373
Table 2INORGANIC ANIONSMT in min Anions 5 Anions 2Nitrate HNO3 293 255Phosphate H3PO4 510Sulfate H2SO4 311Chloride HCl 280Bromide HBr 277 240
Table 1 and 2 Recorded migration time in minutes for the different anions analysed with CEofixtrade Anion Analysis kit (Beckman Coulter) andor CEofixtrade Anions2
Separation with CEofixtrade anions2 (see figure 3)
Analysis with PACE MDQ equipped with UV filter detector at 200nm Capillary 75μm x 60 cm (50cm to the detector) Separation is performed at 30kV with inverse polarity and direct detection
CEofixtradeAnions2 is composed of a initiator buffer and an adapted phosphate buffer at pH 25
Figure 3
ANIoN aNalySIS kIT (BECkMaN CoulTEr) amp CEofixtrade aNIoNS2
PHARMACEUTiCAL
CouNTErIoN aNalySIS
Application Note 061026
IntroductionMost drugsrsquo molecules are charged molecules which are weak bases or acids wich have a counterion Basic drugs may have an inorganic salt or organic acid as a counterion and acidic drugs a metal cation Regulatory agencies (US FDA European Pharmacopeiahellip) require that pharmaceu-tical products should be tested for their composition ie their identity strength quality and purity and this for the active as well as for the inactive ingredients This means that the determination of the counterion is an important part of the determination of the purity of the drug One of the characteristics of many of those ions is that they are UV transparent Most Capillary Electrophoresis instruments are equipped with a UV detector For this reason a special technique called indirect UV detection is often applied Phosphate (PO4) is an interesting molecule owing its three pKa (197 682 and 125) wich may have some disturbing interaction with the capillary wall
general principleBy nature ions are highly charged polar species which means they are very suitable for being analyzed by Capillary Electrophoresis (CE) When carrying out pharmaceutical analyses we usually deal with small organic and inorganic anions and small cations or aliphatic amines
As most anions are characterized by poor UV absorption indirect UV detection is used For this purpose we use in the buffer an absorbing co-ion also called a probe which has the same charge sign as the analyte The analyte will displace the probe in the buffer in such a way that a single charged analyte ion will displace a single charged probe ion while a double charged analyte ion would displace two single charged probe ions (Fig 1) The instrumentrsquos detector will record less absorption or a negative peak When the detector is set in the indirect detection mode we observe an electropherogram with positive peaks (Fig 2) Because of the high mobility of most ions of interest separation is performed in the co-electro osmotic mode This means for anions that the anode is placed at the detector side In this case we speak about reverse polarity or ano-dic separation mode This also means that we need to reverse the EOF (Electro Osmotic Flow) By rinsing the capillary with long-chain aliphatic quaternary ammonium surfactants or with a poly-cation the charge at the inside wall of the charge on the inner surface of the capillary will be positive When current is applied the EOF generated will move towards the anode The cationic polymer surfactants are also called electro-osmo-tic flow modifiers
Phosphate as an example for drug stoichiometry and impurity determination using Capillary Electrophoresis
Figure 2
Figure 1
PHARMACEUTiCAL
Figure 4
Figure 3
CouNTErIoN aNalySIS
Counterion determinationMethod optimisation and resultA testmix was run using Anion Analysis kit (Beckman Coulter) consisting of Chloride Nitrate Sulphate Fluoride Phosphate and Propionate at 20 μgL (Fig 3 trace a) Phosphate and Fluoride clearly show a tailing of their peak which will deteriorate the quantification of the analyte However it was found that by replacing the water in the rinse step (step 7) with a 01 M HCl solution the tailing could be corrected (Fig 3 trace b)
A Primaquine diphosphate (PQ) solution is prepared in order to have a concen-tration in phosphate ions of around 200 mgL in solution (Fig 4) Sodium phosphate standards are prepared at 70 100 and 130 of the nominal value (200 mgL) which corresponds to a concentration of 140 200 and 260 mgL Octanoic acid (C8) is chosen as internal standard A sequence is set up alternating standards 3 times and samples (Table 1)
Instrument and methods
Instrument PACEtrade MDQ (Beckman Coulter Fullerton CA US) Detection indirect UV with filter at 230 nmPolarity set in ldquoreverse polarityrdquo mode
Buffers Anion Analysis kit (Beckman Coulter Brea CA US)Initiator (pyridine-dicarboxylic acid pH 56 with polycation)Accelerator (pyridine-dicarboxylic acid pH 56 with polycation)CEofixtrade Anions8 buffer (Analis Suarleacutee Belgium) consisting ofAnions8 Initiator (pyridine-dicarboxylic acid pH 81 with polycation)Anions8 Accelerator (pyridine-dicarboxylic acid pH 81 with polycation)
Capillary Fused silica capillary (Polymicro Technologies Phoenix AZ US)60 cm total length x 75 micro ID
Method Standard methodrinse 30 sec at 20 psi with Anions Initiator bufferrinse 30 sec at 20 psi with Anions Accelerator bufferinject sample 8 sec at 05 psiinject water plug 10 sec at 01 psiseparate 8 min at 30 KV with a 1 min ramping timerinse 30 sec at 20 psi with NaOH 01 Mrinse 30 sec at 20 psi with H2O The standard method was adapted
Sample Counterion determinationPrimaquine diphosphate 98 (Aldrich ) CAS 63-45-6Impurity profileStandard of phosphate at 04 mgL and on a pharmaceutical sample
CouNTErIoN aNalySIS
Conclusion With a linearity of R2 gt 0999 (Fig 5 and Table 2) a SD on migration time lt 05 and a target value on PQ of 9982 and SD of 011 (Table 3) the kit is suited for determination of phosphate counterion in PQ Y=101x - 00093R2 = 09998
Migration TimeRelative MT
AreaRelative AreaPhosphate C-8 Phosphate C-8
70 5054 6480 0780 34953 50039 06985100 5033 6475 0777 51118 51032 10017130 5017 6483 0774 62969 48111 13088PQ 5029 6467 0778 48824 50915 09589130 5021 6480 0774 62336 47961 1299770 5050 6475 0780 34571 49590 06971100 5033 6475 0777 49882 50173 09942PQ 5029 6471 0777 45283 47314 09571100 5025 6458 0778 50254 50688 09914130 5013 6463 0776 64390 49191 1309070 5037 6446 0781 36527 51926 07034PQ 5017 6442 0779 47990 50048 09589 Mean 5030 6468 0778 49749 SD 025 021 030 279
Table 1 Sequence run of standards at 70 100 and 130 level and Primaquine diphosphate (PQ)
PQ
MeanSD
Area Relative Area09589095710958909583011
Target Value9982996299819975011
4812
48824452834799047365391
Table 3 Primaquine diphosphate (PQ) value regrouping of the data of the samples compared with the target value
Std phosphate
70
Mean SD
Area Relative Area Target Value1711
34953345713652735350293
06985069710703406997047
9979 995910049 9996 047
100
MeanSD
269
51118498825025450418126
1001709942099140995B053
10017 9944 9914 9958 053
130
MeanSD
3510
62969623366439063232166
13088129971309013058041
10068 99981006910045 041
Table 2 Rearrangement of data according to the standard values Relative area is obtained by the ratio of the area by the area of the IS (Octanoic acid) Tar-get Value is the measured value divided by the target value of the standard
CouNTErIoN aNalySIS
Impurity profilingAt pH 56 the phosphate ion bears one negative charge while pyridine-dicarboxylate has two negative charges As a conse-quence two phosphate ions are needed to displace one pyridine-dicarboxylate ion
At pH 81 the phosphate ion carries two negative charges and thus one phosphate ion will displace one pyridine-dicarboxylate ion this results in a peak twice as high for the same concentra-tion of phosphate ions Therefore at pH 81 the LOD and the LOQ of the phosphate ion is lower which is favourable to reach the 01 impurity limit (Fig 6) The migration time of phosphate is shorter because it bears two negative charges and has a higher mobility
Influence of main compound on impurityThe drug of interest is an HCl salt where we want to quantify the phosphate as impurity For this purpose we have analysed the effect of the excess of chloride in a standard phosphate solution
As a general rule the ionic strength of the sample should be 10 times lower than the background electrolyte This might be a challenge where the anionic impurity will be determined in a high salt concentration solution For example an ion with a high mobility such as chloride may have a de-stacking effect on an analyte with a lower mobility the effect being that the peak height of the analyte of interest will be decreased and also the area of the peak On the other and an ion with less mobility may have a stacking effect This technique is used to improve the qua-lity of a minor peak and is called ldquoisotachophoretic (ITP) sample stackingrdquo In classical ITP the sample is injected between a leading electrolyte which contains a high concentration of a high-mobility ion with the same charge as the analyte of interest and a terminating electrolyte which contains an ion with a lower mobility than the analyte of interest An alternative to
ITP is sample self-stacking where the sample contains a leading electrolyte such as a chloride ion and the terminating electrolyte
The influence of stacking was tested on standards to check the robustness of the buffer A sequence was set up with phosphate at 04 mgL as a sample and varying levels of hepthanesulfonate (between 0 and 400 mgL) as the terminating ion The area and height was recorded (Table 4 and Fig 7) We may observe an increase of area and height for the phosphate peak However the RSD at this level being below 10 we chose to analyse without the restacking technique (Fig 8)
ConclusionThe CEofix Anions buffer may be used for impurity profiling when looking for remaining phosphate in a drug
Chloride C-7-S03 HP04 (04 mgL) mgL mgL Area Height
Run 1Run 2Run 3Run 4Run 5Run 6
400400400400400 400
400200100 50 20 0
442456455 395 355396
SD 982
293266264238224250
Table 4 Area of phosphate with variable quantity of terminating ion
FooD - PHARMACEUTiCAL - CHEMiCAL
IntroductionAlkali and alkaline earth metals are routinely analysed in aqueous samples in very different laboratories such as in food and beverage pharmaceutical industries but also in waste plants chemical plants and many othersCapillary electrophoresis (CE) is a analytical technique used in many laboratories CE instruments are usually equipped with a UV detector the problem is that the analysed cations do not absorb sufficient to allow direct photometric detection For this reason an indirect detection technique is used where the buffer is absorbing and the analytes will appear as negative peaks The computer wills inverse the signal to obtain a normal looking electropherogram (figure 2) To improve separation a complexing agent is used such as a crown-ether
MethodAnalyses are performed on PACE MDQ (Beckman Coulter) or equivalent CE instrument Detection is done at 200 nm using indirect detection option The polarity is set in the normal mode from anode to cathode To improve reproducibility a fused silica capillary is dynamically coated () with successive runs of buffered polycation then with a buffered polyanion (figure 3) The capillary is then rinsed with the separation buffer After sample injection and separation the capillary is cleaned with LiOH solution LiOH is used to avoid possible carry-over of Na When Li is the analyte of interest NaOH solution should be used instead
CEofixtrade CaTIoNS Hr
analysis of cations using CEofixtrade Cation Hr
Application Note 043003
Figure 1 Test mix (about 10 mgL) analysed with CEofixtrade Cation HR
Figure 2 Indirect detection the analytes appears as negative peak The software will inverse the signal
Fused silica capillary
Polycation INITIATOR
Polyanion ACCELERATOR
Figure 3 Principle of dynamic double coating of the fused silica capillary
FooD - PHARMACEUTiCAL - CHEMiCAL
Figure 4 Standards injected at 1 5 10 and 25 mgL give excellent linearityrsquosthe goodness of fit (R2)is as follow NH4 09999 Na 09993 K 09991 Mg 09998 Ca 09998
Table 1 Migration time reproducibility will be below 1 when starting with a new capillary after a few runs it drops down to values as described in this table
N=10 NH4 Na K Mg CaMean MT (min) 2663 3137 3368 3652 3817RSD () 005 005 004 006 006
CEofixtrade CaTIoNS Hr
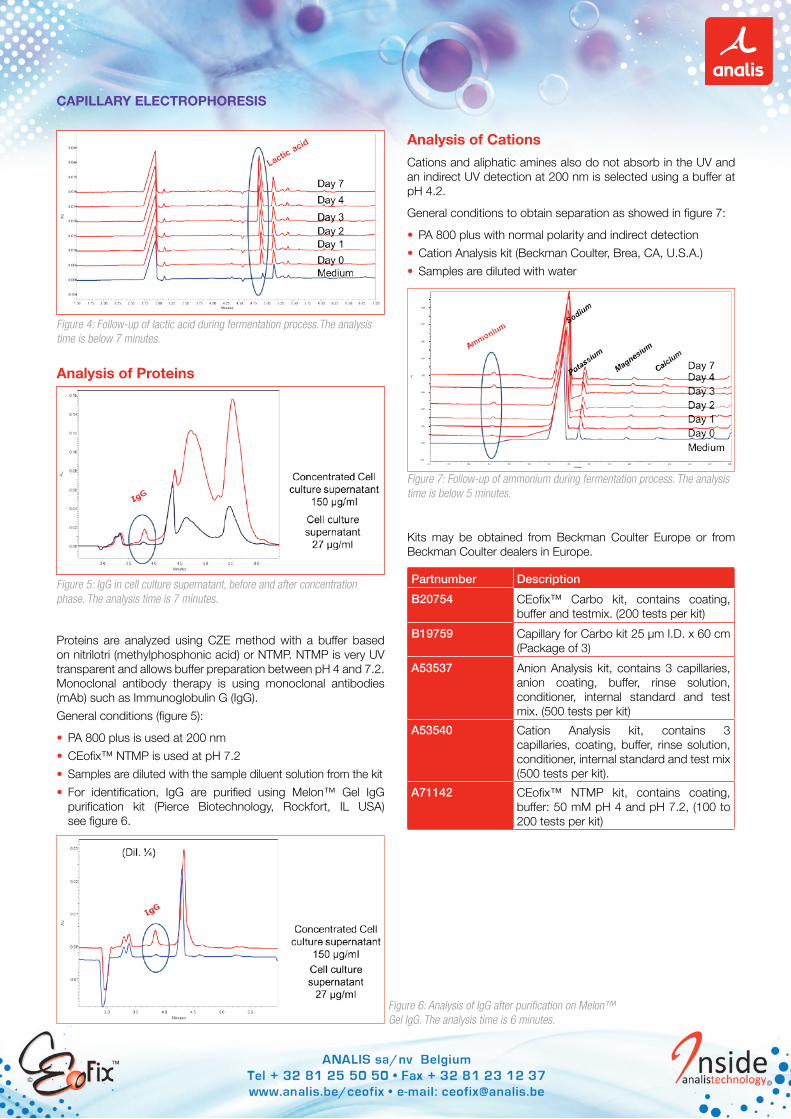
CaPIllary ElECTroPHorESIS
bio PHARMACEUTiCAL AnALysis
analysis of Proteins
Proteins are analyzed using CZE method with a buffer based on nitrilotri (methylphosphonic acid) or NTMP NTMP is very UV transparent and allows buffer preparation between pH 4 and 72 Monoclonal antibody therapy is using monoclonal antibodies (mAb) such as Immunoglobulin G (IgG)General conditions (figure 5)
bull PA 800 plus is used at 200 nmbull CEofixtrade NTMP is used at pH 72bull Samples are diluted with the sample diluent solution from the kitbull For identification IgG are purified using Melontrade Gel IgG
purification kit (Pierce Biotechnology Rockfort IL USA) see figure 6
analysis of CationsCations and aliphatic amines also do not absorb in the UV and an indirect UV detection at 200 nm is selected using a buffer at pH 42
General conditions to obtain separation as showed in figure 7
bull PA 800 plus with normal polarity and indirect detectionbull Cation Analysis kit (Beckman Coulter Brea CA USA)bull Samples are diluted with water
Kits may be obtained from Beckman Coulter Europe or from Beckman Coulter dealers in Europe
Figure 4 Follow-up of lactic acid during fermentation processThe analysis time is below 7 minutes
Figure 5 IgG in cell culture supernatant before and after concentration phase The analysis time is 7 minutes
Figure 6 Analysis of IgG after purification on Melontrade Gel IgG The analysis time is 6 minutes
Figure 7 Follow-up of ammonium during fermentation process The analysis time is below 5 minutes
Partnumber DescriptionB20754 CEofixtrade Carbo kit contains coating
buffer and testmix (200 tests per kit)B19759 Capillary for Carbo kit 25 μm ID x 60 cm
(Package of 3)A53537 Anion Analysis kit contains 3 capillaries
anion coating buffer rinse solution conditioner internal standard and test mix (500 tests per kit)
A53540 Cation Analysis kit contains 3 capillaries coating buffer rinse solution conditioner internal standard and test mix (500 tests per kit)
A71142 CEofixtrade NTMP kit contains coating buffer 50 mM pH 4 and pH 72 (100 to 200 tests per kit)
PHARMACEUTiCAL
aNalySIS oF PHarMaCEuTICal CouNTEr-IoNS uSINg aNIoN aNalySIS kIT (BECkMaN CoulTEr) amp CEofixtrade aNIoNS2
Figure 1
Application Note 040104
IntroductionPharmaceutical compounds are often charged compounds having a counter-ion This counter-ion is an important part of the formula weight This will have an effect on the effective concen-tration of the active compound of thedrug Also it is a requirement from regulatory agencies that pharmaceutical companies should test for the composition of all ingredients Capillary electrophoresis (CE) is a good candidate
to perform this test For basic drug the counter ion will have a negative charge so the CE will be operated with inverse polarity Most counter-ions organic acid or inorganic ion will not absorb in the UV For this reason an indirect detection technique will be used But some of them can be detected at 200 nm Both option are presented in this application note
Separation with CEofixtradeAnalysis with PACE MDQ equipped with UV filter detector at 230nm Capillary 75μm x 60 cm (50cm tot the detector) Separation is performed at 30kV with inverse polarity and indirect detection Anion Analysis kit (Beckman Coulter) is composed of a initiator buffer and an adapted pyridine-dicarboxilic buffer at pH 54 Figure 1 and 2 electropherogram of several anions and organic acids See also table 1 and 2 for recorded migration time Octanoic acid is used as internal standard (IS)
Figure 2
PHARMACEUTiCAL
Table 1ORGANIC ANIONSMT in min Anions 5 Anions 2Acetate 471Benzoate 1036Citrate 421Camphorsulfonate 589Di-benzoyl-tartrate 507Di-p-Toluoyl-tartrate 538Fumarate 6712-Hydroxybenzoate 643Hydroxybutanedioate 3932-Hydroxypropanoate 485Maleate 399Malonate 389Mandelate 840Methanesulfonate 3994-methylbenzenesulfonate 427Oxalate 328 380Propanoate 523Succinate 428Tartrate 373
Table 2INORGANIC ANIONSMT in min Anions 5 Anions 2Nitrate HNO3 293 255Phosphate H3PO4 510Sulfate H2SO4 311Chloride HCl 280Bromide HBr 277 240
Table 1 and 2 Recorded migration time in minutes for the different anions analysed with CEofixtrade Anion Analysis kit (Beckman Coulter) andor CEofixtrade Anions2
Separation with CEofixtrade anions2 (see figure 3)
Analysis with PACE MDQ equipped with UV filter detector at 200nm Capillary 75μm x 60 cm (50cm to the detector) Separation is performed at 30kV with inverse polarity and direct detection
CEofixtradeAnions2 is composed of a initiator buffer and an adapted phosphate buffer at pH 25
Figure 3
ANIoN aNalySIS kIT (BECkMaN CoulTEr) amp CEofixtrade aNIoNS2
PHARMACEUTiCAL
CouNTErIoN aNalySIS
Application Note 061026
IntroductionMost drugsrsquo molecules are charged molecules which are weak bases or acids wich have a counterion Basic drugs may have an inorganic salt or organic acid as a counterion and acidic drugs a metal cation Regulatory agencies (US FDA European Pharmacopeiahellip) require that pharmaceu-tical products should be tested for their composition ie their identity strength quality and purity and this for the active as well as for the inactive ingredients This means that the determination of the counterion is an important part of the determination of the purity of the drug One of the characteristics of many of those ions is that they are UV transparent Most Capillary Electrophoresis instruments are equipped with a UV detector For this reason a special technique called indirect UV detection is often applied Phosphate (PO4) is an interesting molecule owing its three pKa (197 682 and 125) wich may have some disturbing interaction with the capillary wall
general principleBy nature ions are highly charged polar species which means they are very suitable for being analyzed by Capillary Electrophoresis (CE) When carrying out pharmaceutical analyses we usually deal with small organic and inorganic anions and small cations or aliphatic amines
As most anions are characterized by poor UV absorption indirect UV detection is used For this purpose we use in the buffer an absorbing co-ion also called a probe which has the same charge sign as the analyte The analyte will displace the probe in the buffer in such a way that a single charged analyte ion will displace a single charged probe ion while a double charged analyte ion would displace two single charged probe ions (Fig 1) The instrumentrsquos detector will record less absorption or a negative peak When the detector is set in the indirect detection mode we observe an electropherogram with positive peaks (Fig 2) Because of the high mobility of most ions of interest separation is performed in the co-electro osmotic mode This means for anions that the anode is placed at the detector side In this case we speak about reverse polarity or ano-dic separation mode This also means that we need to reverse the EOF (Electro Osmotic Flow) By rinsing the capillary with long-chain aliphatic quaternary ammonium surfactants or with a poly-cation the charge at the inside wall of the charge on the inner surface of the capillary will be positive When current is applied the EOF generated will move towards the anode The cationic polymer surfactants are also called electro-osmo-tic flow modifiers
Phosphate as an example for drug stoichiometry and impurity determination using Capillary Electrophoresis
Figure 2
Figure 1
PHARMACEUTiCAL
Figure 4
Figure 3
CouNTErIoN aNalySIS
Counterion determinationMethod optimisation and resultA testmix was run using Anion Analysis kit (Beckman Coulter) consisting of Chloride Nitrate Sulphate Fluoride Phosphate and Propionate at 20 μgL (Fig 3 trace a) Phosphate and Fluoride clearly show a tailing of their peak which will deteriorate the quantification of the analyte However it was found that by replacing the water in the rinse step (step 7) with a 01 M HCl solution the tailing could be corrected (Fig 3 trace b)
A Primaquine diphosphate (PQ) solution is prepared in order to have a concen-tration in phosphate ions of around 200 mgL in solution (Fig 4) Sodium phosphate standards are prepared at 70 100 and 130 of the nominal value (200 mgL) which corresponds to a concentration of 140 200 and 260 mgL Octanoic acid (C8) is chosen as internal standard A sequence is set up alternating standards 3 times and samples (Table 1)
Instrument and methods
Instrument PACEtrade MDQ (Beckman Coulter Fullerton CA US) Detection indirect UV with filter at 230 nmPolarity set in ldquoreverse polarityrdquo mode
Buffers Anion Analysis kit (Beckman Coulter Brea CA US)Initiator (pyridine-dicarboxylic acid pH 56 with polycation)Accelerator (pyridine-dicarboxylic acid pH 56 with polycation)CEofixtrade Anions8 buffer (Analis Suarleacutee Belgium) consisting ofAnions8 Initiator (pyridine-dicarboxylic acid pH 81 with polycation)Anions8 Accelerator (pyridine-dicarboxylic acid pH 81 with polycation)
Capillary Fused silica capillary (Polymicro Technologies Phoenix AZ US)60 cm total length x 75 micro ID
Method Standard methodrinse 30 sec at 20 psi with Anions Initiator bufferrinse 30 sec at 20 psi with Anions Accelerator bufferinject sample 8 sec at 05 psiinject water plug 10 sec at 01 psiseparate 8 min at 30 KV with a 1 min ramping timerinse 30 sec at 20 psi with NaOH 01 Mrinse 30 sec at 20 psi with H2O The standard method was adapted
Sample Counterion determinationPrimaquine diphosphate 98 (Aldrich ) CAS 63-45-6Impurity profileStandard of phosphate at 04 mgL and on a pharmaceutical sample
CouNTErIoN aNalySIS
Conclusion With a linearity of R2 gt 0999 (Fig 5 and Table 2) a SD on migration time lt 05 and a target value on PQ of 9982 and SD of 011 (Table 3) the kit is suited for determination of phosphate counterion in PQ Y=101x - 00093R2 = 09998
Migration TimeRelative MT
AreaRelative AreaPhosphate C-8 Phosphate C-8
70 5054 6480 0780 34953 50039 06985100 5033 6475 0777 51118 51032 10017130 5017 6483 0774 62969 48111 13088PQ 5029 6467 0778 48824 50915 09589130 5021 6480 0774 62336 47961 1299770 5050 6475 0780 34571 49590 06971100 5033 6475 0777 49882 50173 09942PQ 5029 6471 0777 45283 47314 09571100 5025 6458 0778 50254 50688 09914130 5013 6463 0776 64390 49191 1309070 5037 6446 0781 36527 51926 07034PQ 5017 6442 0779 47990 50048 09589 Mean 5030 6468 0778 49749 SD 025 021 030 279
Table 1 Sequence run of standards at 70 100 and 130 level and Primaquine diphosphate (PQ)
PQ
MeanSD
Area Relative Area09589095710958909583011
Target Value9982996299819975011
4812
48824452834799047365391
Table 3 Primaquine diphosphate (PQ) value regrouping of the data of the samples compared with the target value
Std phosphate
70
Mean SD
Area Relative Area Target Value1711
34953345713652735350293
06985069710703406997047
9979 995910049 9996 047
100
MeanSD
269
51118498825025450418126
1001709942099140995B053
10017 9944 9914 9958 053
130
MeanSD
3510
62969623366439063232166
13088129971309013058041
10068 99981006910045 041
Table 2 Rearrangement of data according to the standard values Relative area is obtained by the ratio of the area by the area of the IS (Octanoic acid) Tar-get Value is the measured value divided by the target value of the standard
CouNTErIoN aNalySIS
Impurity profilingAt pH 56 the phosphate ion bears one negative charge while pyridine-dicarboxylate has two negative charges As a conse-quence two phosphate ions are needed to displace one pyridine-dicarboxylate ion
At pH 81 the phosphate ion carries two negative charges and thus one phosphate ion will displace one pyridine-dicarboxylate ion this results in a peak twice as high for the same concentra-tion of phosphate ions Therefore at pH 81 the LOD and the LOQ of the phosphate ion is lower which is favourable to reach the 01 impurity limit (Fig 6) The migration time of phosphate is shorter because it bears two negative charges and has a higher mobility
Influence of main compound on impurityThe drug of interest is an HCl salt where we want to quantify the phosphate as impurity For this purpose we have analysed the effect of the excess of chloride in a standard phosphate solution
As a general rule the ionic strength of the sample should be 10 times lower than the background electrolyte This might be a challenge where the anionic impurity will be determined in a high salt concentration solution For example an ion with a high mobility such as chloride may have a de-stacking effect on an analyte with a lower mobility the effect being that the peak height of the analyte of interest will be decreased and also the area of the peak On the other and an ion with less mobility may have a stacking effect This technique is used to improve the qua-lity of a minor peak and is called ldquoisotachophoretic (ITP) sample stackingrdquo In classical ITP the sample is injected between a leading electrolyte which contains a high concentration of a high-mobility ion with the same charge as the analyte of interest and a terminating electrolyte which contains an ion with a lower mobility than the analyte of interest An alternative to
ITP is sample self-stacking where the sample contains a leading electrolyte such as a chloride ion and the terminating electrolyte
The influence of stacking was tested on standards to check the robustness of the buffer A sequence was set up with phosphate at 04 mgL as a sample and varying levels of hepthanesulfonate (between 0 and 400 mgL) as the terminating ion The area and height was recorded (Table 4 and Fig 7) We may observe an increase of area and height for the phosphate peak However the RSD at this level being below 10 we chose to analyse without the restacking technique (Fig 8)
ConclusionThe CEofix Anions buffer may be used for impurity profiling when looking for remaining phosphate in a drug
Chloride C-7-S03 HP04 (04 mgL) mgL mgL Area Height
Run 1Run 2Run 3Run 4Run 5Run 6
400400400400400 400
400200100 50 20 0
442456455 395 355396
SD 982
293266264238224250
Table 4 Area of phosphate with variable quantity of terminating ion
FooD - PHARMACEUTiCAL - CHEMiCAL
IntroductionAlkali and alkaline earth metals are routinely analysed in aqueous samples in very different laboratories such as in food and beverage pharmaceutical industries but also in waste plants chemical plants and many othersCapillary electrophoresis (CE) is a analytical technique used in many laboratories CE instruments are usually equipped with a UV detector the problem is that the analysed cations do not absorb sufficient to allow direct photometric detection For this reason an indirect detection technique is used where the buffer is absorbing and the analytes will appear as negative peaks The computer wills inverse the signal to obtain a normal looking electropherogram (figure 2) To improve separation a complexing agent is used such as a crown-ether
MethodAnalyses are performed on PACE MDQ (Beckman Coulter) or equivalent CE instrument Detection is done at 200 nm using indirect detection option The polarity is set in the normal mode from anode to cathode To improve reproducibility a fused silica capillary is dynamically coated () with successive runs of buffered polycation then with a buffered polyanion (figure 3) The capillary is then rinsed with the separation buffer After sample injection and separation the capillary is cleaned with LiOH solution LiOH is used to avoid possible carry-over of Na When Li is the analyte of interest NaOH solution should be used instead
CEofixtrade CaTIoNS Hr
analysis of cations using CEofixtrade Cation Hr
Application Note 043003
Figure 1 Test mix (about 10 mgL) analysed with CEofixtrade Cation HR
Figure 2 Indirect detection the analytes appears as negative peak The software will inverse the signal
Fused silica capillary
Polycation INITIATOR
Polyanion ACCELERATOR
Figure 3 Principle of dynamic double coating of the fused silica capillary
FooD - PHARMACEUTiCAL - CHEMiCAL
Figure 4 Standards injected at 1 5 10 and 25 mgL give excellent linearityrsquosthe goodness of fit (R2)is as follow NH4 09999 Na 09993 K 09991 Mg 09998 Ca 09998
Table 1 Migration time reproducibility will be below 1 when starting with a new capillary after a few runs it drops down to values as described in this table
N=10 NH4 Na K Mg CaMean MT (min) 2663 3137 3368 3652 3817RSD () 005 005 004 006 006
CEofixtrade CaTIoNS Hr

PHARMACEUTiCAL
aNalySIS oF PHarMaCEuTICal CouNTEr-IoNS uSINg aNIoN aNalySIS kIT (BECkMaN CoulTEr) amp CEofixtrade aNIoNS2
Figure 1
Application Note 040104
IntroductionPharmaceutical compounds are often charged compounds having a counter-ion This counter-ion is an important part of the formula weight This will have an effect on the effective concen-tration of the active compound of thedrug Also it is a requirement from regulatory agencies that pharmaceutical companies should test for the composition of all ingredients Capillary electrophoresis (CE) is a good candidate
to perform this test For basic drug the counter ion will have a negative charge so the CE will be operated with inverse polarity Most counter-ions organic acid or inorganic ion will not absorb in the UV For this reason an indirect detection technique will be used But some of them can be detected at 200 nm Both option are presented in this application note
Separation with CEofixtradeAnalysis with PACE MDQ equipped with UV filter detector at 230nm Capillary 75μm x 60 cm (50cm tot the detector) Separation is performed at 30kV with inverse polarity and indirect detection Anion Analysis kit (Beckman Coulter) is composed of a initiator buffer and an adapted pyridine-dicarboxilic buffer at pH 54 Figure 1 and 2 electropherogram of several anions and organic acids See also table 1 and 2 for recorded migration time Octanoic acid is used as internal standard (IS)
Figure 2
PHARMACEUTiCAL
Table 1ORGANIC ANIONSMT in min Anions 5 Anions 2Acetate 471Benzoate 1036Citrate 421Camphorsulfonate 589Di-benzoyl-tartrate 507Di-p-Toluoyl-tartrate 538Fumarate 6712-Hydroxybenzoate 643Hydroxybutanedioate 3932-Hydroxypropanoate 485Maleate 399Malonate 389Mandelate 840Methanesulfonate 3994-methylbenzenesulfonate 427Oxalate 328 380Propanoate 523Succinate 428Tartrate 373
Table 2INORGANIC ANIONSMT in min Anions 5 Anions 2Nitrate HNO3 293 255Phosphate H3PO4 510Sulfate H2SO4 311Chloride HCl 280Bromide HBr 277 240
Table 1 and 2 Recorded migration time in minutes for the different anions analysed with CEofixtrade Anion Analysis kit (Beckman Coulter) andor CEofixtrade Anions2
Separation with CEofixtrade anions2 (see figure 3)
Analysis with PACE MDQ equipped with UV filter detector at 200nm Capillary 75μm x 60 cm (50cm to the detector) Separation is performed at 30kV with inverse polarity and direct detection
CEofixtradeAnions2 is composed of a initiator buffer and an adapted phosphate buffer at pH 25
Figure 3
ANIoN aNalySIS kIT (BECkMaN CoulTEr) amp CEofixtrade aNIoNS2
PHARMACEUTiCAL
CouNTErIoN aNalySIS
Application Note 061026
IntroductionMost drugsrsquo molecules are charged molecules which are weak bases or acids wich have a counterion Basic drugs may have an inorganic salt or organic acid as a counterion and acidic drugs a metal cation Regulatory agencies (US FDA European Pharmacopeiahellip) require that pharmaceu-tical products should be tested for their composition ie their identity strength quality and purity and this for the active as well as for the inactive ingredients This means that the determination of the counterion is an important part of the determination of the purity of the drug One of the characteristics of many of those ions is that they are UV transparent Most Capillary Electrophoresis instruments are equipped with a UV detector For this reason a special technique called indirect UV detection is often applied Phosphate (PO4) is an interesting molecule owing its three pKa (197 682 and 125) wich may have some disturbing interaction with the capillary wall
general principleBy nature ions are highly charged polar species which means they are very suitable for being analyzed by Capillary Electrophoresis (CE) When carrying out pharmaceutical analyses we usually deal with small organic and inorganic anions and small cations or aliphatic amines
As most anions are characterized by poor UV absorption indirect UV detection is used For this purpose we use in the buffer an absorbing co-ion also called a probe which has the same charge sign as the analyte The analyte will displace the probe in the buffer in such a way that a single charged analyte ion will displace a single charged probe ion while a double charged analyte ion would displace two single charged probe ions (Fig 1) The instrumentrsquos detector will record less absorption or a negative peak When the detector is set in the indirect detection mode we observe an electropherogram with positive peaks (Fig 2) Because of the high mobility of most ions of interest separation is performed in the co-electro osmotic mode This means for anions that the anode is placed at the detector side In this case we speak about reverse polarity or ano-dic separation mode This also means that we need to reverse the EOF (Electro Osmotic Flow) By rinsing the capillary with long-chain aliphatic quaternary ammonium surfactants or with a poly-cation the charge at the inside wall of the charge on the inner surface of the capillary will be positive When current is applied the EOF generated will move towards the anode The cationic polymer surfactants are also called electro-osmo-tic flow modifiers
Phosphate as an example for drug stoichiometry and impurity determination using Capillary Electrophoresis
Figure 2
Figure 1
PHARMACEUTiCAL
Figure 4
Figure 3
CouNTErIoN aNalySIS
Counterion determinationMethod optimisation and resultA testmix was run using Anion Analysis kit (Beckman Coulter) consisting of Chloride Nitrate Sulphate Fluoride Phosphate and Propionate at 20 μgL (Fig 3 trace a) Phosphate and Fluoride clearly show a tailing of their peak which will deteriorate the quantification of the analyte However it was found that by replacing the water in the rinse step (step 7) with a 01 M HCl solution the tailing could be corrected (Fig 3 trace b)
A Primaquine diphosphate (PQ) solution is prepared in order to have a concen-tration in phosphate ions of around 200 mgL in solution (Fig 4) Sodium phosphate standards are prepared at 70 100 and 130 of the nominal value (200 mgL) which corresponds to a concentration of 140 200 and 260 mgL Octanoic acid (C8) is chosen as internal standard A sequence is set up alternating standards 3 times and samples (Table 1)
Instrument and methods
Instrument PACEtrade MDQ (Beckman Coulter Fullerton CA US) Detection indirect UV with filter at 230 nmPolarity set in ldquoreverse polarityrdquo mode
Buffers Anion Analysis kit (Beckman Coulter Brea CA US)Initiator (pyridine-dicarboxylic acid pH 56 with polycation)Accelerator (pyridine-dicarboxylic acid pH 56 with polycation)CEofixtrade Anions8 buffer (Analis Suarleacutee Belgium) consisting ofAnions8 Initiator (pyridine-dicarboxylic acid pH 81 with polycation)Anions8 Accelerator (pyridine-dicarboxylic acid pH 81 with polycation)
Capillary Fused silica capillary (Polymicro Technologies Phoenix AZ US)60 cm total length x 75 micro ID
Method Standard methodrinse 30 sec at 20 psi with Anions Initiator bufferrinse 30 sec at 20 psi with Anions Accelerator bufferinject sample 8 sec at 05 psiinject water plug 10 sec at 01 psiseparate 8 min at 30 KV with a 1 min ramping timerinse 30 sec at 20 psi with NaOH 01 Mrinse 30 sec at 20 psi with H2O The standard method was adapted
Sample Counterion determinationPrimaquine diphosphate 98 (Aldrich ) CAS 63-45-6Impurity profileStandard of phosphate at 04 mgL and on a pharmaceutical sample
CouNTErIoN aNalySIS
Conclusion With a linearity of R2 gt 0999 (Fig 5 and Table 2) a SD on migration time lt 05 and a target value on PQ of 9982 and SD of 011 (Table 3) the kit is suited for determination of phosphate counterion in PQ Y=101x - 00093R2 = 09998
Migration TimeRelative MT
AreaRelative AreaPhosphate C-8 Phosphate C-8
70 5054 6480 0780 34953 50039 06985100 5033 6475 0777 51118 51032 10017130 5017 6483 0774 62969 48111 13088PQ 5029 6467 0778 48824 50915 09589130 5021 6480 0774 62336 47961 1299770 5050 6475 0780 34571 49590 06971100 5033 6475 0777 49882 50173 09942PQ 5029 6471 0777 45283 47314 09571100 5025 6458 0778 50254 50688 09914130 5013 6463 0776 64390 49191 1309070 5037 6446 0781 36527 51926 07034PQ 5017 6442 0779 47990 50048 09589 Mean 5030 6468 0778 49749 SD 025 021 030 279
Table 1 Sequence run of standards at 70 100 and 130 level and Primaquine diphosphate (PQ)
PQ
MeanSD
Area Relative Area09589095710958909583011
Target Value9982996299819975011
4812
48824452834799047365391
Table 3 Primaquine diphosphate (PQ) value regrouping of the data of the samples compared with the target value
Std phosphate
70
Mean SD
Area Relative Area Target Value1711
34953345713652735350293
06985069710703406997047
9979 995910049 9996 047
100
MeanSD
269
51118498825025450418126
1001709942099140995B053
10017 9944 9914 9958 053
130
MeanSD
3510
62969623366439063232166
13088129971309013058041
10068 99981006910045 041
Table 2 Rearrangement of data according to the standard values Relative area is obtained by the ratio of the area by the area of the IS (Octanoic acid) Tar-get Value is the measured value divided by the target value of the standard
CouNTErIoN aNalySIS
Impurity profilingAt pH 56 the phosphate ion bears one negative charge while pyridine-dicarboxylate has two negative charges As a conse-quence two phosphate ions are needed to displace one pyridine-dicarboxylate ion
At pH 81 the phosphate ion carries two negative charges and thus one phosphate ion will displace one pyridine-dicarboxylate ion this results in a peak twice as high for the same concentra-tion of phosphate ions Therefore at pH 81 the LOD and the LOQ of the phosphate ion is lower which is favourable to reach the 01 impurity limit (Fig 6) The migration time of phosphate is shorter because it bears two negative charges and has a higher mobility
Influence of main compound on impurityThe drug of interest is an HCl salt where we want to quantify the phosphate as impurity For this purpose we have analysed the effect of the excess of chloride in a standard phosphate solution
As a general rule the ionic strength of the sample should be 10 times lower than the background electrolyte This might be a challenge where the anionic impurity will be determined in a high salt concentration solution For example an ion with a high mobility such as chloride may have a de-stacking effect on an analyte with a lower mobility the effect being that the peak height of the analyte of interest will be decreased and also the area of the peak On the other and an ion with less mobility may have a stacking effect This technique is used to improve the qua-lity of a minor peak and is called ldquoisotachophoretic (ITP) sample stackingrdquo In classical ITP the sample is injected between a leading electrolyte which contains a high concentration of a high-mobility ion with the same charge as the analyte of interest and a terminating electrolyte which contains an ion with a lower mobility than the analyte of interest An alternative to
ITP is sample self-stacking where the sample contains a leading electrolyte such as a chloride ion and the terminating electrolyte
The influence of stacking was tested on standards to check the robustness of the buffer A sequence was set up with phosphate at 04 mgL as a sample and varying levels of hepthanesulfonate (between 0 and 400 mgL) as the terminating ion The area and height was recorded (Table 4 and Fig 7) We may observe an increase of area and height for the phosphate peak However the RSD at this level being below 10 we chose to analyse without the restacking technique (Fig 8)
ConclusionThe CEofix Anions buffer may be used for impurity profiling when looking for remaining phosphate in a drug
Chloride C-7-S03 HP04 (04 mgL) mgL mgL Area Height
Run 1Run 2Run 3Run 4Run 5Run 6
400400400400400 400
400200100 50 20 0
442456455 395 355396
SD 982
293266264238224250
Table 4 Area of phosphate with variable quantity of terminating ion
FooD - PHARMACEUTiCAL - CHEMiCAL
IntroductionAlkali and alkaline earth metals are routinely analysed in aqueous samples in very different laboratories such as in food and beverage pharmaceutical industries but also in waste plants chemical plants and many othersCapillary electrophoresis (CE) is a analytical technique used in many laboratories CE instruments are usually equipped with a UV detector the problem is that the analysed cations do not absorb sufficient to allow direct photometric detection For this reason an indirect detection technique is used where the buffer is absorbing and the analytes will appear as negative peaks The computer wills inverse the signal to obtain a normal looking electropherogram (figure 2) To improve separation a complexing agent is used such as a crown-ether
MethodAnalyses are performed on PACE MDQ (Beckman Coulter) or equivalent CE instrument Detection is done at 200 nm using indirect detection option The polarity is set in the normal mode from anode to cathode To improve reproducibility a fused silica capillary is dynamically coated () with successive runs of buffered polycation then with a buffered polyanion (figure 3) The capillary is then rinsed with the separation buffer After sample injection and separation the capillary is cleaned with LiOH solution LiOH is used to avoid possible carry-over of Na When Li is the analyte of interest NaOH solution should be used instead
CEofixtrade CaTIoNS Hr
analysis of cations using CEofixtrade Cation Hr
Application Note 043003
Figure 1 Test mix (about 10 mgL) analysed with CEofixtrade Cation HR
Figure 2 Indirect detection the analytes appears as negative peak The software will inverse the signal
Fused silica capillary
Polycation INITIATOR
Polyanion ACCELERATOR
Figure 3 Principle of dynamic double coating of the fused silica capillary
FooD - PHARMACEUTiCAL - CHEMiCAL
Figure 4 Standards injected at 1 5 10 and 25 mgL give excellent linearityrsquosthe goodness of fit (R2)is as follow NH4 09999 Na 09993 K 09991 Mg 09998 Ca 09998
Table 1 Migration time reproducibility will be below 1 when starting with a new capillary after a few runs it drops down to values as described in this table
N=10 NH4 Na K Mg CaMean MT (min) 2663 3137 3368 3652 3817RSD () 005 005 004 006 006
CEofixtrade CaTIoNS Hr
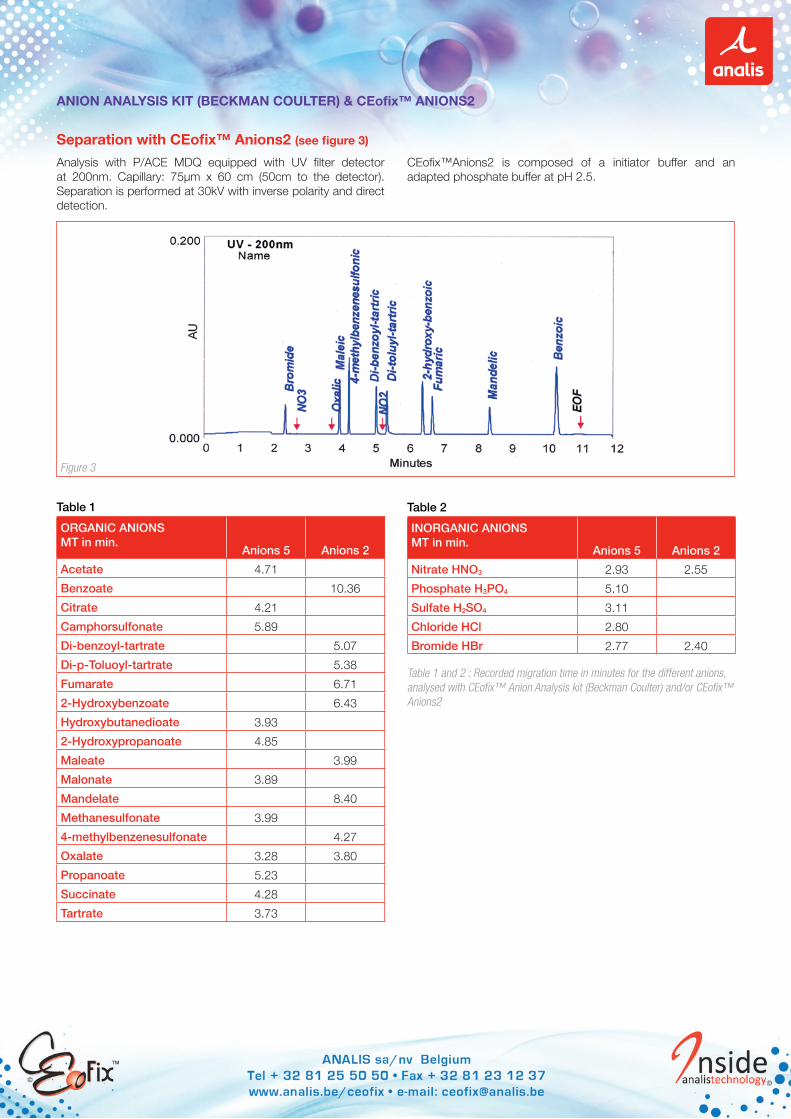
PHARMACEUTiCAL
CouNTErIoN aNalySIS
Application Note 061026
IntroductionMost drugsrsquo molecules are charged molecules which are weak bases or acids wich have a counterion Basic drugs may have an inorganic salt or organic acid as a counterion and acidic drugs a metal cation Regulatory agencies (US FDA European Pharmacopeiahellip) require that pharmaceu-tical products should be tested for their composition ie their identity strength quality and purity and this for the active as well as for the inactive ingredients This means that the determination of the counterion is an important part of the determination of the purity of the drug One of the characteristics of many of those ions is that they are UV transparent Most Capillary Electrophoresis instruments are equipped with a UV detector For this reason a special technique called indirect UV detection is often applied Phosphate (PO4) is an interesting molecule owing its three pKa (197 682 and 125) wich may have some disturbing interaction with the capillary wall
general principleBy nature ions are highly charged polar species which means they are very suitable for being analyzed by Capillary Electrophoresis (CE) When carrying out pharmaceutical analyses we usually deal with small organic and inorganic anions and small cations or aliphatic amines
As most anions are characterized by poor UV absorption indirect UV detection is used For this purpose we use in the buffer an absorbing co-ion also called a probe which has the same charge sign as the analyte The analyte will displace the probe in the buffer in such a way that a single charged analyte ion will displace a single charged probe ion while a double charged analyte ion would displace two single charged probe ions (Fig 1) The instrumentrsquos detector will record less absorption or a negative peak When the detector is set in the indirect detection mode we observe an electropherogram with positive peaks (Fig 2) Because of the high mobility of most ions of interest separation is performed in the co-electro osmotic mode This means for anions that the anode is placed at the detector side In this case we speak about reverse polarity or ano-dic separation mode This also means that we need to reverse the EOF (Electro Osmotic Flow) By rinsing the capillary with long-chain aliphatic quaternary ammonium surfactants or with a poly-cation the charge at the inside wall of the charge on the inner surface of the capillary will be positive When current is applied the EOF generated will move towards the anode The cationic polymer surfactants are also called electro-osmo-tic flow modifiers
Phosphate as an example for drug stoichiometry and impurity determination using Capillary Electrophoresis
Figure 2
Figure 1
PHARMACEUTiCAL
Figure 4
Figure 3
CouNTErIoN aNalySIS
Counterion determinationMethod optimisation and resultA testmix was run using Anion Analysis kit (Beckman Coulter) consisting of Chloride Nitrate Sulphate Fluoride Phosphate and Propionate at 20 μgL (Fig 3 trace a) Phosphate and Fluoride clearly show a tailing of their peak which will deteriorate the quantification of the analyte However it was found that by replacing the water in the rinse step (step 7) with a 01 M HCl solution the tailing could be corrected (Fig 3 trace b)
A Primaquine diphosphate (PQ) solution is prepared in order to have a concen-tration in phosphate ions of around 200 mgL in solution (Fig 4) Sodium phosphate standards are prepared at 70 100 and 130 of the nominal value (200 mgL) which corresponds to a concentration of 140 200 and 260 mgL Octanoic acid (C8) is chosen as internal standard A sequence is set up alternating standards 3 times and samples (Table 1)
Instrument and methods
Instrument PACEtrade MDQ (Beckman Coulter Fullerton CA US) Detection indirect UV with filter at 230 nmPolarity set in ldquoreverse polarityrdquo mode
Buffers Anion Analysis kit (Beckman Coulter Brea CA US)Initiator (pyridine-dicarboxylic acid pH 56 with polycation)Accelerator (pyridine-dicarboxylic acid pH 56 with polycation)CEofixtrade Anions8 buffer (Analis Suarleacutee Belgium) consisting ofAnions8 Initiator (pyridine-dicarboxylic acid pH 81 with polycation)Anions8 Accelerator (pyridine-dicarboxylic acid pH 81 with polycation)
Capillary Fused silica capillary (Polymicro Technologies Phoenix AZ US)60 cm total length x 75 micro ID
Method Standard methodrinse 30 sec at 20 psi with Anions Initiator bufferrinse 30 sec at 20 psi with Anions Accelerator bufferinject sample 8 sec at 05 psiinject water plug 10 sec at 01 psiseparate 8 min at 30 KV with a 1 min ramping timerinse 30 sec at 20 psi with NaOH 01 Mrinse 30 sec at 20 psi with H2O The standard method was adapted
Sample Counterion determinationPrimaquine diphosphate 98 (Aldrich ) CAS 63-45-6Impurity profileStandard of phosphate at 04 mgL and on a pharmaceutical sample
CouNTErIoN aNalySIS
Conclusion With a linearity of R2 gt 0999 (Fig 5 and Table 2) a SD on migration time lt 05 and a target value on PQ of 9982 and SD of 011 (Table 3) the kit is suited for determination of phosphate counterion in PQ Y=101x - 00093R2 = 09998
Migration TimeRelative MT
AreaRelative AreaPhosphate C-8 Phosphate C-8
70 5054 6480 0780 34953 50039 06985100 5033 6475 0777 51118 51032 10017130 5017 6483 0774 62969 48111 13088PQ 5029 6467 0778 48824 50915 09589130 5021 6480 0774 62336 47961 1299770 5050 6475 0780 34571 49590 06971100 5033 6475 0777 49882 50173 09942PQ 5029 6471 0777 45283 47314 09571100 5025 6458 0778 50254 50688 09914130 5013 6463 0776 64390 49191 1309070 5037 6446 0781 36527 51926 07034PQ 5017 6442 0779 47990 50048 09589 Mean 5030 6468 0778 49749 SD 025 021 030 279
Table 1 Sequence run of standards at 70 100 and 130 level and Primaquine diphosphate (PQ)
PQ
MeanSD
Area Relative Area09589095710958909583011
Target Value9982996299819975011
4812
48824452834799047365391
Table 3 Primaquine diphosphate (PQ) value regrouping of the data of the samples compared with the target value
Std phosphate
70
Mean SD
Area Relative Area Target Value1711
34953345713652735350293
06985069710703406997047
9979 995910049 9996 047
100
MeanSD
269
51118498825025450418126
1001709942099140995B053
10017 9944 9914 9958 053
130
MeanSD
3510
62969623366439063232166
13088129971309013058041
10068 99981006910045 041
Table 2 Rearrangement of data according to the standard values Relative area is obtained by the ratio of the area by the area of the IS (Octanoic acid) Tar-get Value is the measured value divided by the target value of the standard
CouNTErIoN aNalySIS
Impurity profilingAt pH 56 the phosphate ion bears one negative charge while pyridine-dicarboxylate has two negative charges As a conse-quence two phosphate ions are needed to displace one pyridine-dicarboxylate ion
At pH 81 the phosphate ion carries two negative charges and thus one phosphate ion will displace one pyridine-dicarboxylate ion this results in a peak twice as high for the same concentra-tion of phosphate ions Therefore at pH 81 the LOD and the LOQ of the phosphate ion is lower which is favourable to reach the 01 impurity limit (Fig 6) The migration time of phosphate is shorter because it bears two negative charges and has a higher mobility
Influence of main compound on impurityThe drug of interest is an HCl salt where we want to quantify the phosphate as impurity For this purpose we have analysed the effect of the excess of chloride in a standard phosphate solution
As a general rule the ionic strength of the sample should be 10 times lower than the background electrolyte This might be a challenge where the anionic impurity will be determined in a high salt concentration solution For example an ion with a high mobility such as chloride may have a de-stacking effect on an analyte with a lower mobility the effect being that the peak height of the analyte of interest will be decreased and also the area of the peak On the other and an ion with less mobility may have a stacking effect This technique is used to improve the qua-lity of a minor peak and is called ldquoisotachophoretic (ITP) sample stackingrdquo In classical ITP the sample is injected between a leading electrolyte which contains a high concentration of a high-mobility ion with the same charge as the analyte of interest and a terminating electrolyte which contains an ion with a lower mobility than the analyte of interest An alternative to
ITP is sample self-stacking where the sample contains a leading electrolyte such as a chloride ion and the terminating electrolyte
The influence of stacking was tested on standards to check the robustness of the buffer A sequence was set up with phosphate at 04 mgL as a sample and varying levels of hepthanesulfonate (between 0 and 400 mgL) as the terminating ion The area and height was recorded (Table 4 and Fig 7) We may observe an increase of area and height for the phosphate peak However the RSD at this level being below 10 we chose to analyse without the restacking technique (Fig 8)
ConclusionThe CEofix Anions buffer may be used for impurity profiling when looking for remaining phosphate in a drug
Chloride C-7-S03 HP04 (04 mgL) mgL mgL Area Height
Run 1Run 2Run 3Run 4Run 5Run 6
400400400400400 400
400200100 50 20 0
442456455 395 355396
SD 982
293266264238224250
Table 4 Area of phosphate with variable quantity of terminating ion
FooD - PHARMACEUTiCAL - CHEMiCAL
IntroductionAlkali and alkaline earth metals are routinely analysed in aqueous samples in very different laboratories such as in food and beverage pharmaceutical industries but also in waste plants chemical plants and many othersCapillary electrophoresis (CE) is a analytical technique used in many laboratories CE instruments are usually equipped with a UV detector the problem is that the analysed cations do not absorb sufficient to allow direct photometric detection For this reason an indirect detection technique is used where the buffer is absorbing and the analytes will appear as negative peaks The computer wills inverse the signal to obtain a normal looking electropherogram (figure 2) To improve separation a complexing agent is used such as a crown-ether
MethodAnalyses are performed on PACE MDQ (Beckman Coulter) or equivalent CE instrument Detection is done at 200 nm using indirect detection option The polarity is set in the normal mode from anode to cathode To improve reproducibility a fused silica capillary is dynamically coated () with successive runs of buffered polycation then with a buffered polyanion (figure 3) The capillary is then rinsed with the separation buffer After sample injection and separation the capillary is cleaned with LiOH solution LiOH is used to avoid possible carry-over of Na When Li is the analyte of interest NaOH solution should be used instead
CEofixtrade CaTIoNS Hr
analysis of cations using CEofixtrade Cation Hr
Application Note 043003
Figure 1 Test mix (about 10 mgL) analysed with CEofixtrade Cation HR
Figure 2 Indirect detection the analytes appears as negative peak The software will inverse the signal
Fused silica capillary
Polycation INITIATOR
Polyanion ACCELERATOR
Figure 3 Principle of dynamic double coating of the fused silica capillary
FooD - PHARMACEUTiCAL - CHEMiCAL
Figure 4 Standards injected at 1 5 10 and 25 mgL give excellent linearityrsquosthe goodness of fit (R2)is as follow NH4 09999 Na 09993 K 09991 Mg 09998 Ca 09998
Table 1 Migration time reproducibility will be below 1 when starting with a new capillary after a few runs it drops down to values as described in this table
N=10 NH4 Na K Mg CaMean MT (min) 2663 3137 3368 3652 3817RSD () 005 005 004 006 006
CEofixtrade CaTIoNS Hr

PHARMACEUTiCAL
Figure 4
Figure 3
CouNTErIoN aNalySIS
Counterion determinationMethod optimisation and resultA testmix was run using Anion Analysis kit (Beckman Coulter) consisting of Chloride Nitrate Sulphate Fluoride Phosphate and Propionate at 20 μgL (Fig 3 trace a) Phosphate and Fluoride clearly show a tailing of their peak which will deteriorate the quantification of the analyte However it was found that by replacing the water in the rinse step (step 7) with a 01 M HCl solution the tailing could be corrected (Fig 3 trace b)
A Primaquine diphosphate (PQ) solution is prepared in order to have a concen-tration in phosphate ions of around 200 mgL in solution (Fig 4) Sodium phosphate standards are prepared at 70 100 and 130 of the nominal value (200 mgL) which corresponds to a concentration of 140 200 and 260 mgL Octanoic acid (C8) is chosen as internal standard A sequence is set up alternating standards 3 times and samples (Table 1)
Instrument and methods
Instrument PACEtrade MDQ (Beckman Coulter Fullerton CA US) Detection indirect UV with filter at 230 nmPolarity set in ldquoreverse polarityrdquo mode
Buffers Anion Analysis kit (Beckman Coulter Brea CA US)Initiator (pyridine-dicarboxylic acid pH 56 with polycation)Accelerator (pyridine-dicarboxylic acid pH 56 with polycation)CEofixtrade Anions8 buffer (Analis Suarleacutee Belgium) consisting ofAnions8 Initiator (pyridine-dicarboxylic acid pH 81 with polycation)Anions8 Accelerator (pyridine-dicarboxylic acid pH 81 with polycation)
Capillary Fused silica capillary (Polymicro Technologies Phoenix AZ US)60 cm total length x 75 micro ID
Method Standard methodrinse 30 sec at 20 psi with Anions Initiator bufferrinse 30 sec at 20 psi with Anions Accelerator bufferinject sample 8 sec at 05 psiinject water plug 10 sec at 01 psiseparate 8 min at 30 KV with a 1 min ramping timerinse 30 sec at 20 psi with NaOH 01 Mrinse 30 sec at 20 psi with H2O The standard method was adapted
Sample Counterion determinationPrimaquine diphosphate 98 (Aldrich ) CAS 63-45-6Impurity profileStandard of phosphate at 04 mgL and on a pharmaceutical sample
CouNTErIoN aNalySIS
Conclusion With a linearity of R2 gt 0999 (Fig 5 and Table 2) a SD on migration time lt 05 and a target value on PQ of 9982 and SD of 011 (Table 3) the kit is suited for determination of phosphate counterion in PQ Y=101x - 00093R2 = 09998
Migration TimeRelative MT
AreaRelative AreaPhosphate C-8 Phosphate C-8
70 5054 6480 0780 34953 50039 06985100 5033 6475 0777 51118 51032 10017130 5017 6483 0774 62969 48111 13088PQ 5029 6467 0778 48824 50915 09589130 5021 6480 0774 62336 47961 1299770 5050 6475 0780 34571 49590 06971100 5033 6475 0777 49882 50173 09942PQ 5029 6471 0777 45283 47314 09571100 5025 6458 0778 50254 50688 09914130 5013 6463 0776 64390 49191 1309070 5037 6446 0781 36527 51926 07034PQ 5017 6442 0779 47990 50048 09589 Mean 5030 6468 0778 49749 SD 025 021 030 279
Table 1 Sequence run of standards at 70 100 and 130 level and Primaquine diphosphate (PQ)
PQ
MeanSD
Area Relative Area09589095710958909583011
Target Value9982996299819975011
4812
48824452834799047365391
Table 3 Primaquine diphosphate (PQ) value regrouping of the data of the samples compared with the target value
Std phosphate
70
Mean SD
Area Relative Area Target Value1711
34953345713652735350293
06985069710703406997047
9979 995910049 9996 047
100
MeanSD
269
51118498825025450418126
1001709942099140995B053
10017 9944 9914 9958 053
130
MeanSD
3510
62969623366439063232166
13088129971309013058041
10068 99981006910045 041
Table 2 Rearrangement of data according to the standard values Relative area is obtained by the ratio of the area by the area of the IS (Octanoic acid) Tar-get Value is the measured value divided by the target value of the standard
CouNTErIoN aNalySIS
Impurity profilingAt pH 56 the phosphate ion bears one negative charge while pyridine-dicarboxylate has two negative charges As a conse-quence two phosphate ions are needed to displace one pyridine-dicarboxylate ion
At pH 81 the phosphate ion carries two negative charges and thus one phosphate ion will displace one pyridine-dicarboxylate ion this results in a peak twice as high for the same concentra-tion of phosphate ions Therefore at pH 81 the LOD and the LOQ of the phosphate ion is lower which is favourable to reach the 01 impurity limit (Fig 6) The migration time of phosphate is shorter because it bears two negative charges and has a higher mobility
Influence of main compound on impurityThe drug of interest is an HCl salt where we want to quantify the phosphate as impurity For this purpose we have analysed the effect of the excess of chloride in a standard phosphate solution
As a general rule the ionic strength of the sample should be 10 times lower than the background electrolyte This might be a challenge where the anionic impurity will be determined in a high salt concentration solution For example an ion with a high mobility such as chloride may have a de-stacking effect on an analyte with a lower mobility the effect being that the peak height of the analyte of interest will be decreased and also the area of the peak On the other and an ion with less mobility may have a stacking effect This technique is used to improve the qua-lity of a minor peak and is called ldquoisotachophoretic (ITP) sample stackingrdquo In classical ITP the sample is injected between a leading electrolyte which contains a high concentration of a high-mobility ion with the same charge as the analyte of interest and a terminating electrolyte which contains an ion with a lower mobility than the analyte of interest An alternative to
ITP is sample self-stacking where the sample contains a leading electrolyte such as a chloride ion and the terminating electrolyte
The influence of stacking was tested on standards to check the robustness of the buffer A sequence was set up with phosphate at 04 mgL as a sample and varying levels of hepthanesulfonate (between 0 and 400 mgL) as the terminating ion The area and height was recorded (Table 4 and Fig 7) We may observe an increase of area and height for the phosphate peak However the RSD at this level being below 10 we chose to analyse without the restacking technique (Fig 8)
ConclusionThe CEofix Anions buffer may be used for impurity profiling when looking for remaining phosphate in a drug
Chloride C-7-S03 HP04 (04 mgL) mgL mgL Area Height
Run 1Run 2Run 3Run 4Run 5Run 6
400400400400400 400
400200100 50 20 0
442456455 395 355396
SD 982
293266264238224250
Table 4 Area of phosphate with variable quantity of terminating ion
FooD - PHARMACEUTiCAL - CHEMiCAL
IntroductionAlkali and alkaline earth metals are routinely analysed in aqueous samples in very different laboratories such as in food and beverage pharmaceutical industries but also in waste plants chemical plants and many othersCapillary electrophoresis (CE) is a analytical technique used in many laboratories CE instruments are usually equipped with a UV detector the problem is that the analysed cations do not absorb sufficient to allow direct photometric detection For this reason an indirect detection technique is used where the buffer is absorbing and the analytes will appear as negative peaks The computer wills inverse the signal to obtain a normal looking electropherogram (figure 2) To improve separation a complexing agent is used such as a crown-ether
MethodAnalyses are performed on PACE MDQ (Beckman Coulter) or equivalent CE instrument Detection is done at 200 nm using indirect detection option The polarity is set in the normal mode from anode to cathode To improve reproducibility a fused silica capillary is dynamically coated () with successive runs of buffered polycation then with a buffered polyanion (figure 3) The capillary is then rinsed with the separation buffer After sample injection and separation the capillary is cleaned with LiOH solution LiOH is used to avoid possible carry-over of Na When Li is the analyte of interest NaOH solution should be used instead
CEofixtrade CaTIoNS Hr
analysis of cations using CEofixtrade Cation Hr
Application Note 043003
Figure 1 Test mix (about 10 mgL) analysed with CEofixtrade Cation HR
Figure 2 Indirect detection the analytes appears as negative peak The software will inverse the signal
Fused silica capillary
Polycation INITIATOR
Polyanion ACCELERATOR
Figure 3 Principle of dynamic double coating of the fused silica capillary
FooD - PHARMACEUTiCAL - CHEMiCAL
Figure 4 Standards injected at 1 5 10 and 25 mgL give excellent linearityrsquosthe goodness of fit (R2)is as follow NH4 09999 Na 09993 K 09991 Mg 09998 Ca 09998
Table 1 Migration time reproducibility will be below 1 when starting with a new capillary after a few runs it drops down to values as described in this table
N=10 NH4 Na K Mg CaMean MT (min) 2663 3137 3368 3652 3817RSD () 005 005 004 006 006
CEofixtrade CaTIoNS Hr

CouNTErIoN aNalySIS
Conclusion With a linearity of R2 gt 0999 (Fig 5 and Table 2) a SD on migration time lt 05 and a target value on PQ of 9982 and SD of 011 (Table 3) the kit is suited for determination of phosphate counterion in PQ Y=101x - 00093R2 = 09998
Migration TimeRelative MT
AreaRelative AreaPhosphate C-8 Phosphate C-8
70 5054 6480 0780 34953 50039 06985100 5033 6475 0777 51118 51032 10017130 5017 6483 0774 62969 48111 13088PQ 5029 6467 0778 48824 50915 09589130 5021 6480 0774 62336 47961 1299770 5050 6475 0780 34571 49590 06971100 5033 6475 0777 49882 50173 09942PQ 5029 6471 0777 45283 47314 09571100 5025 6458 0778 50254 50688 09914130 5013 6463 0776 64390 49191 1309070 5037 6446 0781 36527 51926 07034PQ 5017 6442 0779 47990 50048 09589 Mean 5030 6468 0778 49749 SD 025 021 030 279
Table 1 Sequence run of standards at 70 100 and 130 level and Primaquine diphosphate (PQ)
PQ
MeanSD
Area Relative Area09589095710958909583011
Target Value9982996299819975011
4812
48824452834799047365391
Table 3 Primaquine diphosphate (PQ) value regrouping of the data of the samples compared with the target value
Std phosphate
70
Mean SD
Area Relative Area Target Value1711
34953345713652735350293
06985069710703406997047
9979 995910049 9996 047
100
MeanSD
269
51118498825025450418126
1001709942099140995B053
10017 9944 9914 9958 053
130
MeanSD
3510
62969623366439063232166
13088129971309013058041
10068 99981006910045 041
Table 2 Rearrangement of data according to the standard values Relative area is obtained by the ratio of the area by the area of the IS (Octanoic acid) Tar-get Value is the measured value divided by the target value of the standard
CouNTErIoN aNalySIS
Impurity profilingAt pH 56 the phosphate ion bears one negative charge while pyridine-dicarboxylate has two negative charges As a conse-quence two phosphate ions are needed to displace one pyridine-dicarboxylate ion
At pH 81 the phosphate ion carries two negative charges and thus one phosphate ion will displace one pyridine-dicarboxylate ion this results in a peak twice as high for the same concentra-tion of phosphate ions Therefore at pH 81 the LOD and the LOQ of the phosphate ion is lower which is favourable to reach the 01 impurity limit (Fig 6) The migration time of phosphate is shorter because it bears two negative charges and has a higher mobility
Influence of main compound on impurityThe drug of interest is an HCl salt where we want to quantify the phosphate as impurity For this purpose we have analysed the effect of the excess of chloride in a standard phosphate solution
As a general rule the ionic strength of the sample should be 10 times lower than the background electrolyte This might be a challenge where the anionic impurity will be determined in a high salt concentration solution For example an ion with a high mobility such as chloride may have a de-stacking effect on an analyte with a lower mobility the effect being that the peak height of the analyte of interest will be decreased and also the area of the peak On the other and an ion with less mobility may have a stacking effect This technique is used to improve the qua-lity of a minor peak and is called ldquoisotachophoretic (ITP) sample stackingrdquo In classical ITP the sample is injected between a leading electrolyte which contains a high concentration of a high-mobility ion with the same charge as the analyte of interest and a terminating electrolyte which contains an ion with a lower mobility than the analyte of interest An alternative to
ITP is sample self-stacking where the sample contains a leading electrolyte such as a chloride ion and the terminating electrolyte
The influence of stacking was tested on standards to check the robustness of the buffer A sequence was set up with phosphate at 04 mgL as a sample and varying levels of hepthanesulfonate (between 0 and 400 mgL) as the terminating ion The area and height was recorded (Table 4 and Fig 7) We may observe an increase of area and height for the phosphate peak However the RSD at this level being below 10 we chose to analyse without the restacking technique (Fig 8)
ConclusionThe CEofix Anions buffer may be used for impurity profiling when looking for remaining phosphate in a drug
Chloride C-7-S03 HP04 (04 mgL) mgL mgL Area Height
Run 1Run 2Run 3Run 4Run 5Run 6
400400400400400 400
400200100 50 20 0
442456455 395 355396
SD 982
293266264238224250
Table 4 Area of phosphate with variable quantity of terminating ion
FooD - PHARMACEUTiCAL - CHEMiCAL
IntroductionAlkali and alkaline earth metals are routinely analysed in aqueous samples in very different laboratories such as in food and beverage pharmaceutical industries but also in waste plants chemical plants and many othersCapillary electrophoresis (CE) is a analytical technique used in many laboratories CE instruments are usually equipped with a UV detector the problem is that the analysed cations do not absorb sufficient to allow direct photometric detection For this reason an indirect detection technique is used where the buffer is absorbing and the analytes will appear as negative peaks The computer wills inverse the signal to obtain a normal looking electropherogram (figure 2) To improve separation a complexing agent is used such as a crown-ether
MethodAnalyses are performed on PACE MDQ (Beckman Coulter) or equivalent CE instrument Detection is done at 200 nm using indirect detection option The polarity is set in the normal mode from anode to cathode To improve reproducibility a fused silica capillary is dynamically coated () with successive runs of buffered polycation then with a buffered polyanion (figure 3) The capillary is then rinsed with the separation buffer After sample injection and separation the capillary is cleaned with LiOH solution LiOH is used to avoid possible carry-over of Na When Li is the analyte of interest NaOH solution should be used instead
CEofixtrade CaTIoNS Hr
analysis of cations using CEofixtrade Cation Hr
Application Note 043003
Figure 1 Test mix (about 10 mgL) analysed with CEofixtrade Cation HR
Figure 2 Indirect detection the analytes appears as negative peak The software will inverse the signal
Fused silica capillary
Polycation INITIATOR
Polyanion ACCELERATOR
Figure 3 Principle of dynamic double coating of the fused silica capillary
FooD - PHARMACEUTiCAL - CHEMiCAL
Figure 4 Standards injected at 1 5 10 and 25 mgL give excellent linearityrsquosthe goodness of fit (R2)is as follow NH4 09999 Na 09993 K 09991 Mg 09998 Ca 09998
Table 1 Migration time reproducibility will be below 1 when starting with a new capillary after a few runs it drops down to values as described in this table
N=10 NH4 Na K Mg CaMean MT (min) 2663 3137 3368 3652 3817RSD () 005 005 004 006 006
CEofixtrade CaTIoNS Hr
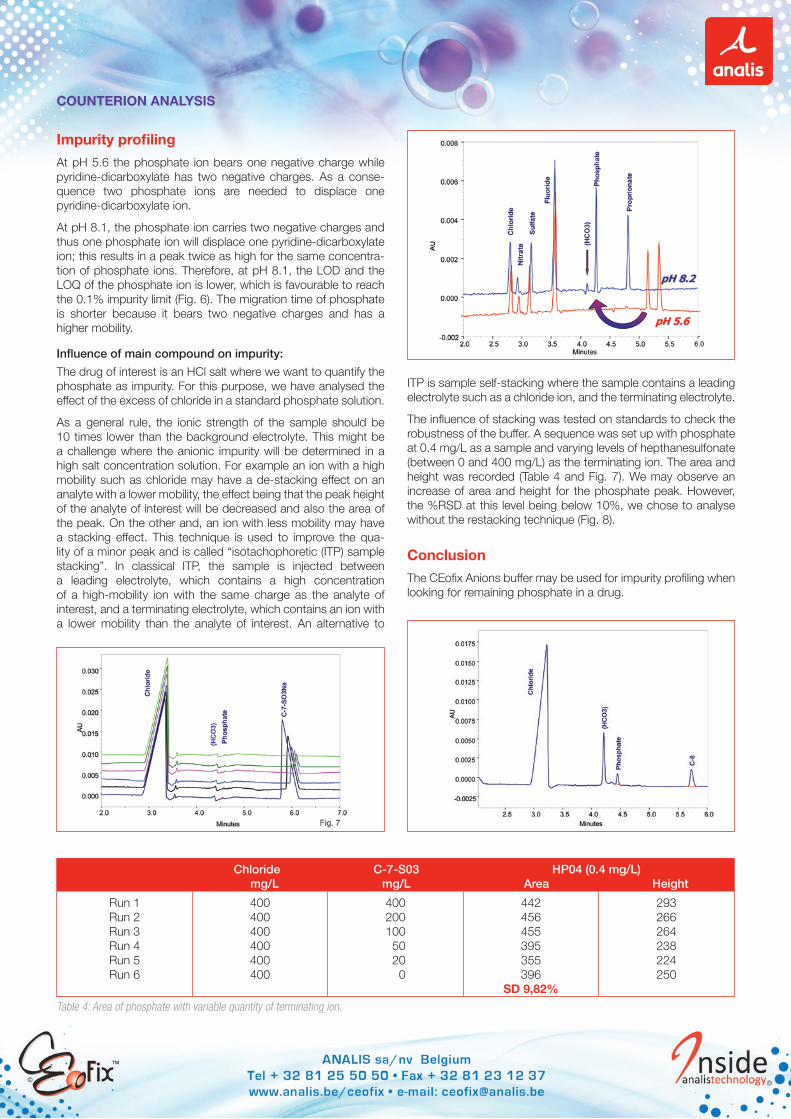
CouNTErIoN aNalySIS
Impurity profilingAt pH 56 the phosphate ion bears one negative charge while pyridine-dicarboxylate has two negative charges As a conse-quence two phosphate ions are needed to displace one pyridine-dicarboxylate ion
At pH 81 the phosphate ion carries two negative charges and thus one phosphate ion will displace one pyridine-dicarboxylate ion this results in a peak twice as high for the same concentra-tion of phosphate ions Therefore at pH 81 the LOD and the LOQ of the phosphate ion is lower which is favourable to reach the 01 impurity limit (Fig 6) The migration time of phosphate is shorter because it bears two negative charges and has a higher mobility
Influence of main compound on impurityThe drug of interest is an HCl salt where we want to quantify the phosphate as impurity For this purpose we have analysed the effect of the excess of chloride in a standard phosphate solution
As a general rule the ionic strength of the sample should be 10 times lower than the background electrolyte This might be a challenge where the anionic impurity will be determined in a high salt concentration solution For example an ion with a high mobility such as chloride may have a de-stacking effect on an analyte with a lower mobility the effect being that the peak height of the analyte of interest will be decreased and also the area of the peak On the other and an ion with less mobility may have a stacking effect This technique is used to improve the qua-lity of a minor peak and is called ldquoisotachophoretic (ITP) sample stackingrdquo In classical ITP the sample is injected between a leading electrolyte which contains a high concentration of a high-mobility ion with the same charge as the analyte of interest and a terminating electrolyte which contains an ion with a lower mobility than the analyte of interest An alternative to
ITP is sample self-stacking where the sample contains a leading electrolyte such as a chloride ion and the terminating electrolyte
The influence of stacking was tested on standards to check the robustness of the buffer A sequence was set up with phosphate at 04 mgL as a sample and varying levels of hepthanesulfonate (between 0 and 400 mgL) as the terminating ion The area and height was recorded (Table 4 and Fig 7) We may observe an increase of area and height for the phosphate peak However the RSD at this level being below 10 we chose to analyse without the restacking technique (Fig 8)
ConclusionThe CEofix Anions buffer may be used for impurity profiling when looking for remaining phosphate in a drug
Chloride C-7-S03 HP04 (04 mgL) mgL mgL Area Height
Run 1Run 2Run 3Run 4Run 5Run 6
400400400400400 400
400200100 50 20 0
442456455 395 355396
SD 982
293266264238224250
Table 4 Area of phosphate with variable quantity of terminating ion
FooD - PHARMACEUTiCAL - CHEMiCAL
IntroductionAlkali and alkaline earth metals are routinely analysed in aqueous samples in very different laboratories such as in food and beverage pharmaceutical industries but also in waste plants chemical plants and many othersCapillary electrophoresis (CE) is a analytical technique used in many laboratories CE instruments are usually equipped with a UV detector the problem is that the analysed cations do not absorb sufficient to allow direct photometric detection For this reason an indirect detection technique is used where the buffer is absorbing and the analytes will appear as negative peaks The computer wills inverse the signal to obtain a normal looking electropherogram (figure 2) To improve separation a complexing agent is used such as a crown-ether
MethodAnalyses are performed on PACE MDQ (Beckman Coulter) or equivalent CE instrument Detection is done at 200 nm using indirect detection option The polarity is set in the normal mode from anode to cathode To improve reproducibility a fused silica capillary is dynamically coated () with successive runs of buffered polycation then with a buffered polyanion (figure 3) The capillary is then rinsed with the separation buffer After sample injection and separation the capillary is cleaned with LiOH solution LiOH is used to avoid possible carry-over of Na When Li is the analyte of interest NaOH solution should be used instead
CEofixtrade CaTIoNS Hr
analysis of cations using CEofixtrade Cation Hr
Application Note 043003
Figure 1 Test mix (about 10 mgL) analysed with CEofixtrade Cation HR
Figure 2 Indirect detection the analytes appears as negative peak The software will inverse the signal
Fused silica capillary
Polycation INITIATOR
Polyanion ACCELERATOR
Figure 3 Principle of dynamic double coating of the fused silica capillary
FooD - PHARMACEUTiCAL - CHEMiCAL
Figure 4 Standards injected at 1 5 10 and 25 mgL give excellent linearityrsquosthe goodness of fit (R2)is as follow NH4 09999 Na 09993 K 09991 Mg 09998 Ca 09998
Table 1 Migration time reproducibility will be below 1 when starting with a new capillary after a few runs it drops down to values as described in this table
N=10 NH4 Na K Mg CaMean MT (min) 2663 3137 3368 3652 3817RSD () 005 005 004 006 006
CEofixtrade CaTIoNS Hr

FooD - PHARMACEUTiCAL - CHEMiCAL
Figure 4 Standards injected at 1 5 10 and 25 mgL give excellent linearityrsquosthe goodness of fit (R2)is as follow NH4 09999 Na 09993 K 09991 Mg 09998 Ca 09998
Table 1 Migration time reproducibility will be below 1 when starting with a new capillary after a few runs it drops down to values as described in this table
N=10 NH4 Na K Mg CaMean MT (min) 2663 3137 3368 3652 3817RSD () 005 005 004 006 006
CEofixtrade CaTIoNS Hr


![Capillary thermostatting in capillary electrophoresis · Capillary thermostatting in capillary electrophoresis ... 75 µm BF 3 Injection: ... 25-µm id BF 5 capillary. Voltage [kV]](https://static.fdocuments.net/doc/165x107/5c176ff509d3f27a578bf33a/capillary-thermostatting-in-capillary-electrophoresis-capillary-thermostatting.jpg)