Determination of Equilibrium binding constants for LPS ...
67
Graduate Theses, Dissertations, and Problem Reports 2010 Determination of Equilibrium binding constants for LPS Determination of Equilibrium binding constants for LPS interaction with TLR4 interaction with TLR4 Santhoshi P. Dixit West Virginia University Follow this and additional works at: https://researchrepository.wvu.edu/etd Recommended Citation Recommended Citation Dixit, Santhoshi P., "Determination of Equilibrium binding constants for LPS interaction with TLR4" (2010). Graduate Theses, Dissertations, and Problem Reports. 2155. https://researchrepository.wvu.edu/etd/2155 This Thesis is protected by copyright and/or related rights. It has been brought to you by the The Research Repository @ WVU with permission from the rights-holder(s). You are free to use this Thesis in any way that is permitted by the copyright and related rights legislation that applies to your use. For other uses you must obtain permission from the rights-holder(s) directly, unless additional rights are indicated by a Creative Commons license in the record and/ or on the work itself. This Thesis has been accepted for inclusion in WVU Graduate Theses, Dissertations, and Problem Reports collection by an authorized administrator of The Research Repository @ WVU. For more information, please contact [email protected].
Transcript of Determination of Equilibrium binding constants for LPS ...
Graduate Theses, Dissertations, and Problem Reports
2010
Determination of Equilibrium binding constants for LPS Determination of Equilibrium binding constants for LPS
interaction with TLR4 interaction with TLR4
Santhoshi P. Dixit West Virginia University
Follow this and additional works at: https://researchrepository.wvu.edu/etd
Recommended Citation Recommended Citation Dixit, Santhoshi P., "Determination of Equilibrium binding constants for LPS interaction with TLR4" (2010). Graduate Theses, Dissertations, and Problem Reports. 2155. https://researchrepository.wvu.edu/etd/2155
This Thesis is protected by copyright and/or related rights. It has been brought to you by the The Research Repository @ WVU with permission from the rights-holder(s). You are free to use this Thesis in any way that is permitted by the copyright and related rights legislation that applies to your use. For other uses you must obtain permission from the rights-holder(s) directly, unless additional rights are indicated by a Creative Commons license in the record and/ or on the work itself. This Thesis has been accepted for inclusion in WVU Graduate Theses, Dissertations, and Problem Reports collection by an authorized administrator of The Research Repository @ WVU. For more information, please contact [email protected].
Determination of Equilibrium binding constants for LPS
interaction with TLR4
Santhoshi P. Dixit
Thesis submitted to the
College of Engineering and Mineral Resources
at WEST VIRGINIA UNIVERSITY
in partial fulfillment of requirements
for the degree of
MASTER OF SCIENCE
in
Chemical Engineering
Advisor
Dr. David J Klinke
Committee Members
Dr. David J. Klinke
Dr. Charter D. Stinespring
Dr Robin S. Farmer
Morgantown, West Virginia
2010
Keywords: Innate immunity, Lipopolysaccharide, Toll-like receptors, TLR-4,
SDS-PAGE, Flow cytometry, Trypan blue
ABSTRACT
Determination of LPS-TLR4 binding constants for LPS interaction with TLR4
Santhoshi Dixit
Toll-like receptors (TLRs) are the best characterized Pathogen Recognition Receptors
(PRRs) and are directly responsible for initiating an appropriate defense against bacterial
and viral infection. Among all the TLRs known, only TLR4 is able to activate both
MyD88-dependent induction of genes encoding inflammatory molecules and TRIF-
dependent production of type I interferon. Therefore, in this study we report the binding
of TLR4 by Lipopolysaccharide (LPS) which is the component on the cell-wall of gram-
negative bacteria. Binding of LPS is a prerequisite for the activation of Toll-like receptor
4 (TLR4) by LPS which increases the expression of critical proinflammatory cytokines
that organize potent immune responses. The binding of LPS to TLR4 was studied using
IC21 mice macrophage cell line and fluorescently labeled LPS molecule, called FITC-
LPS by flow cytometry. The series of cell staining experiments were performed, which
included binding of FITC-LPS to TLR4 at different temperatures as temperature
influences cellular trafficking of TLR4. Since, trafficking or internalization of LPS
depends on its aggregation behavior; the molecular state of LPS under experimental
conditions is detected using SDS-PAGE. Trypan blue was used to identify surface bond
versus internalized FITC-LPS.
iii
DEDICATION
This thesis is dedicated to my grandfather, who taught me to that the best kind of
knowledge to have is that which is learned for its own sake. It is also dedicated to my
parents, who taught me that even largest task can be accomplished if it is done one step at
a time.

iv
ACKNOWLEDGEMENT
I would like to thank all people who have helped and inspired me during my master’s
study.
I especially want to thank my advisor Dr. David J. Klinke, for his guidance during my
research and study, at West Virginia University. His perpetual energy and enthusiasm in
research had motivated all his advisees, including me. In addition, he was always
accessible and willing to help his students with their research. As a result, research life
became smooth and rewarding for me.
I was delighted to interact with Dr. Rodney Brundage and Dr. Kathyleen Brundage, who
supported me throughout my research work.
All my lab buddies made it a convivial place to work. In particular I would like to thank
Dr. Yogesh Kulkarni and Viviana Suarez for their friendship and help during the lab
work. All other folks had inspired me in research through our interactions during the long
hours in the lab. Thanks
My deepest gratitude goes to my family for their unflagging love and support throughout
my life; this dissertation is simply impossible without them. I am indebted to my father,
Ashok Dixit, for his care and love. I cannot ask for more from my mother, as she is
simply perfect. I have no suitable word that can fully describe her everlasting love to me.
I remember many sleepless nights with her accompanying me when I was studying for
examinations. I remember her constant support when I encountered difficulties and I
remember, most of all, her delicious dishes. Mother, I love you.
The generous support from my best friend Ramanjaneyulu Katta is greatly appreciated.
He was the person who stood beside me at toughest times.
Last but not least, Thanks to God for my life through all tests in the past seven years. You
have made my life more bountiful. May your name be exalted, honored and glorified.

v
Table of Contents
ABSTRACT ........................................................................................................................ ii
DEDICATION ................................................................................................................... iii
ACKNOWLEDGEMENT ................................................................................................. iv
List of Figures .................................................................................................................. vii
List of Tables ...................................................................................................................... x
Chapter 1. Introduction ....................................................................................................... 1
2.1. Macrophages ........................................................................................................... 4
2.2. Lipopolysaccharide ................................................................................................. 5
2.3. LPS receptor complex ............................................................................................. 7
2.4. Toll-like receptor signaling ...................................................................................... 7
2.5. Toll-like receptor 4 (TLR4) ..................................................................................... 8
2.6. LPS-monomer or aggregate? ................................................................................. 10
2.7. LPS-TLR4 binding ................................................................................................. 11
2.8. Fluorescence quenching ......................................................................................... 12
2.9. Flow cytometry ...................................................................................................... 12
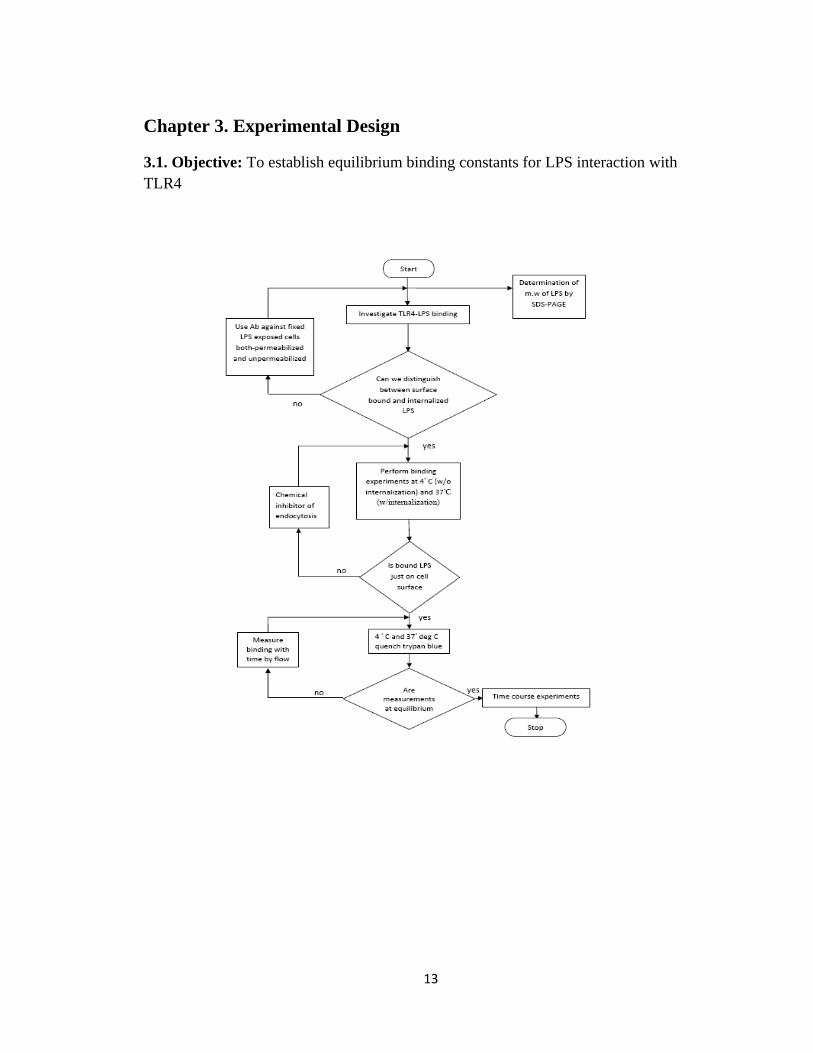
Chapter 3. Experimental Design ....................................................................................... 13
3.1. Objective: To establish equilibrium binding constants for LPS interaction with
TLR4 ............................................................................................................................. 13
3.2. Materials and methods .......................................................................................... 13
3.2.1. Determination of LPS molecular weight by using SDS-PAGE .......................... 14
3.2.2. Determination of LPS-TLR4 binding at 4 °C ..................................................... 15
3.2.3. Determination of LPS-TLR4 binding at 37 °C .................................................. 17
3.2.4. Fluorescence quenching using Trypan blue ....................................................... 18
3.2.5. Determination of LPS-TLR4 binding with respect to time ................................ 18
3.2.6. Determination of Dissociation Constant ............................................................ 18
vi
3.3. Results .................................................................................................................... 21
3.3.1. Lipopolysaccharide (LPS) analysis by SDS-PAGE ........................................ 21
3.3.2. Determination of LPS-TLR4 binding at 4 °C .................................................. 26
3.3.3. Determination of LPS-TLR4 binding at 37 °C ............................................... 31
3.3.5. Study of LPS-TLR4 binding with respect to time .......................................... 42
Chapter 4. Discussion ....................................................................................................... 45
4.1. Conclusion ............................................................................................................. 49
4.2 Future Work ............................................................................................................ 49
Chapter 5. Safety Considerations ..................................................................................... 50
References: ........................................................................................................................ 51

vii
List of Figures
FIGURE 1. GENERAL STRUCTURE OF LPS. LPS OF ENTEROBACTERIACEAE CONSISTS OF THREE COVALENTLY
LINKED DOMAINS: THE LIPID A MOIETY SERVES AS THE HYDROPHOBIC ANCHOR FOR LPS IN THE OUTER
MOST BACTERIAL MEMBRANES AND CONFERS ENDOTOXIC PROPERTIES TO THE LPS, THE CORE REGION
IS THE PHOSPHORYLATED NON-REPEATING OLIGOSACCHARIDE THAT LINKS LIPID A TO THE
HYPERVARIABLE O-ANTIGEN POLYMER.13 ............................................................................................... 6
FIGURE 2. TLR4 SIGNAL TRANSDUCTION PATHWAY. LPS BINDS TO THE LPS-BINDING PROTEIN (LBP)
THEREBY TRANSFERRING LIPIDS TO CD14. CD14 SUBSEQUENTLY TRANSFERS LPS TO THE TLR/MD-2
COMPLEXES. TLR4/MD-2 COMPLEX TRANSMITS SIGNALS THROUGH MYD88 DEPENDENT PATHWAY
THROUGH TOLLIP AND TIRAP, LEADING TO THE SECRETION OF CYTOKINES. ......................................... 9
FIGURE 3. SCANNED IMAGE OF LPS SAMPLES IN SDS-PAGE. WELLS FORMED IN STACKING GEL WERE
NUMBERED FROM 6 TO 0. IN THE WELL 6, MOLECULAR WEIGHT MARKER WAS FILLED. IN WELLS 5 AND
4, 5µG AND 1µG BOILED LPS SAMPLES IN PRESENCE OF PBS WAS ADDED. IN WELLS 3 AND 2, 5 µG AND
1µG LPS SAMPLES IN PRESENCE OF PBS WAS ADDED. IN WELLS 1 AND 0, LPS 5µG AND 1µG LPS
SAMPLES IN PRESENCE OF FBS AND PBS WAS ADDED. .......................................................................... 22
FIGURE 4. FORWARD SCATTER-SIDE SCATTER PLOTS FOR LPS-TLR4 BINDING AT 4 °C. THE DOTS
SCATTERED OUTSIDE THE CONTOUR ARE THE CELLS REJECTED. PLOT A REPRESENTS THE FSC-SSC FOR
UNSTAINED IC21 MICE CELLS AT 4 °C, B FOR CELLS STAINED WITH 1 µG/ML LPS, C REPRESENTS PLOT
OF CONCENTRATION OF LPS VERSUS FSC FOR UNSTAINED CELL, D REPRESENTS PLOT OF LOG OF
CONCENTRATION OF LPS VERSUS FSC FOR CELLS STAINED WITH 1 µG/ML LPS, E AND F REPRESENTS
THE PLOTS OF CONCENTRATION OF LPS VERSUS FSC FOR 3 AND 7 µG/ML RESPECTIVELY. ................... 24
FIGURE 5. HISTOGRAM OF LPS-TLR4 BINDING AT 4 °C. THE AREA UNDER EACH CURVE REPRESENTS THE
POPULATION DENSITY EXHIBITING FLUORESCENCE MEASURED ALONG HORIZONTAL AXIS. BLACK
CURVE REPRESENTS THE BACKGROUND FLUORESCENCE EXHIBITED BY UNSTAINED CELLS AT 4 °C, RED,
GREEN, VIOLET, BLUE AND PINK CURVES REPRESENTS THE FLUORESCENCE EXHIBITED BY THE IC21
MICE CELLS STAINED WITH 1, 3,7,25,50 µG/ML LPS RESPECTIVELY. ..................................................... 25
FIGURE 6. FORWARD SCATTER- SIDE SCATTER PLOTS FOR FLUORESCENCE QUENCHING AT 4 °C. THE DOTS
SCATTERED OUTSIDE THE CONTOUR ARE THE CELLS REJECTED. PLOT A REPRESENTS THE FSC-SSC FOR
UNSTAINED IC21 MICE CELLS QUENCHED WITH TRYPAN BLUE AT 4 °C, B FOR CELLS STAINED WITH 1
µG/ML LPS, QUENCHED WITH TRYPAN BLUE, C REPRESENTS PLOT OF CONCENTRATION OF LPS VERSUS
FSC FOR UNSTAINED CELL, QUENCHED WITH TRYPAN BLUE, D REPRESENTS PLOT OF LOG OF
CONCENTRATION OF LPS VERSUS FSC FOR CELLS STAINED WITH 1 µG/ML LPS, QUENCHED WITH
TRYPAN BLUE. ....................................................................................................................................... 28
FIGURE 7. HISTOGRAM OF FLUORESCENCE QUENCHING BY TRYPAN BLUE OBTAINED AT 4 °C. EACH
SUBPANEL HAS THREE CURVES, ONE REPRESENTING BACKGROUND FLUORESCENCE, AND OTHER TWO
REPRESENTING DENSITY DISTRIBUTION OF FLUORESCENCE INTENSITY OBTAINED WITH AND WITHOUT
ADDITION OF TRYPAN BLUE FOR DIFFERENT LIGAND CONCENTRATIONS. A REPRESENTS THE DENSITY
DISTRIBUTION CURVES OF UNSTAINED CELLS WITH AND WITHOUT ADDITION OF TRYPAN BLUE. B, C, D,
E AND F REPRESENTS THE DENSITY DISTRIBUTION CURVES FOR CELLS STAINED 1, 3, 7, 25 AND 50 µG/ML
LIGAND CONCENTRATION, WITH AND WITHOUT ADDITION OF TRYPAN BLUE. WE CAN SEE THAT
FLUORESCENCE EXPRESSED BY CELLS FOR 1, 3, 7 µM CONCENTRATION OF FITC-LPS WAS ALMOST
EQUAL TO THE BACKGROUND FLUORESCENCE. AT HIGHER LIGAND CONCENTRATION, FLUORESCENCE
WAS PARTIALLY QUENCHED. ................................................................................................................. 30

viii
FIGURE 8. DOSE-RESPONSES PLOT OF LPS-TLR4 BINDING AT 4 °C. EXPERIMENTAL DOSE RESPONSE
CORRESPONDS TO THE FLUORESCENT INTENSITY MEASURED BY FLOW CYTOMETER, MODEL FIT CURVE IS
OBTAINED BY SIMULATION, USING EQUATION 8, MENTIONED IN MATERIALS AND METHODS
SECTION.THE DISSOCIATION CONSTANT KD OBTAINED FROM THE KINETICS PLOTS WAS 16.0 µM, RTOT
OR MAXIMUM INTENSITY OBTAINED WAS 1800, AND KNS, NON-SPECIFIC BINDING CONSTANT WAS
CALCULATED TO BE 6.5 µM -1(ASSUMING, SINGLE BINDING SITE FOR EACH CELL). ................................ 31
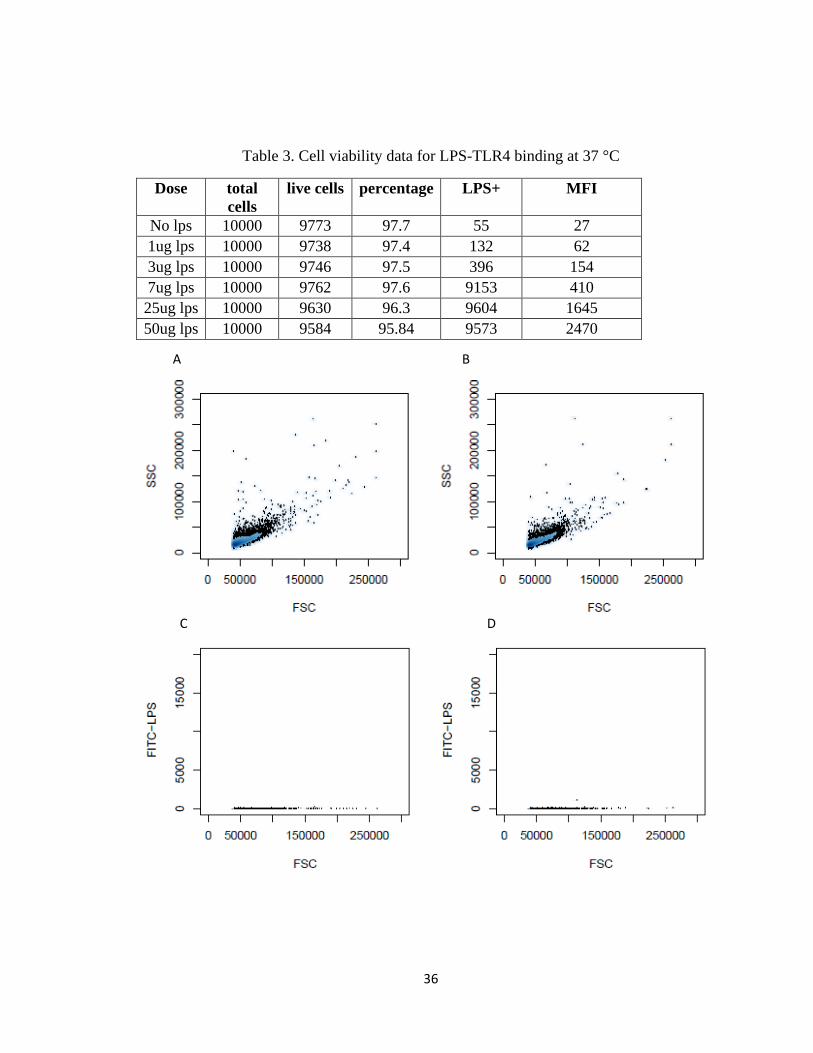
FIGURE 9. FORWARD SCATTER-SIDE SCATTER PLOTS FOR LPS-TLR4 BINDING AT 37 °C. THE DOTS
SCATTERED OUTSIDE THE CONTOUR ARE THE CELLS REJECTED. PLOT A REPRESENTS THE FSC-SSC FOR
UNSTAINED IC21 MICE CELLS AT 37 °C, B FOR CELLS STAINED WITH 1 µG/ML LPS, C REPRESENTS PLOT
OF CONCENTRATION OF LPS VERSUS FSC FOR UNSTAINED CELL, D REPRESENTS PLOT OF LOG OF
CONCENTRATION OF LPS VERSUS FSC FOR CELLS STAINED WITH 1 µG/ML LPS, E AND F REPRESENTS
THE PLOTS OF CONCENTRATION OF LPS VERSUS FSC FOR 3 AND 7 µG/ML RESPECTIVELY. ................... 34
FIGURE 10. HISTOGRAM OF LPS-TLR4 BINDING AT 37 °C. THE AREA UNDER EACH CURVE REPRESENTS THE
POPULATION DENSITY EXHIBITING FLUORESCENCE MEASURED ALONG HORIZONTAL AXIS. THE BLACK
CURVE REPRESENTS THE FLUORESCENCE EXHIBITED BY UNSTAINED CELLS OR BACKGROUND
FLUORESCENCE, AND THE REMAINING CURVES REPRESENT THE DOSE RESPONSE, WHICH INCREASED
WITH INCREASE IN THE CONCENTRATION OF FITC-LPS. ....................................................................... 35
FIGURE 11. FORWARD SCATTER-SIDE SCATTER PLOTS FOR FLUORESCENCE QUENCHING AT 37 °C. THE DOTS
SCATTERED OUTSIDE THE CONTOUR ARE THE CELLS REJECTED. PLOT A REPRESENTS THE FSC-SSC FOR
UNSTAINED IC21 MICE CELLS QUENCHED WITH TRYPAN BLUE AT 4 °C, B FOR CELLS STAINED WITH 1
µG/ML LPS, QUENCHED WITH TRYPAN BLUE, C REPRESENTS PLOT OF CONCENTRATION OF LPS VERSUS
FSC FOR UNSTAINED CELL, QUENCHED WITH TRYPAN BLUE, D REPRESENTS PLOT OF LOG OF
CONCENTRATION OF LPS VERSUS FSC FOR CELLS STAINED WITH 1 µG/ML LPS, QUENCHED WITH
TRYPAN BLUE. ....................................................................................................................................... 37
FIGURE 12. HISTOGRAM OF FLUORESCENCE QUENCHING AT 37 °C. EACH SUBPANEL HAS THREE CURVES, ONE
REPRESENTING BACKGROUND FLUORESCENCE, AND OTHER TWO REPRESENTING DENSITY DISTRIBUTION
OF FLUORESCENCE INTENSITY OBTAINED WITH AND WITHOUT ADDITION OF TRYPAN BLUE FOR
DIFFERENT LIGAND CONCENTRATIONS. A REPRESENTS THE DENSITY DISTRIBUTION CURVES OF
UNSTAINED CELLS WITH AND WITHOUT ADDITION OF TRYPAN BLUE. B, C, D, E AND F REPRESENTS THE
DENSITY DISTRIBUTION CURVES FOR CELLS STAINED 1, 3, 7, 25 AND 50 µG/ML LIGAND
CONCENTRATION, WITH AND WITHOUT ADDITION OF TRYPAN BLUE. WE CAN SEE THAT FLUORESCENCE
EXPRESSED BY CELLS FOR 1, 3, 7 µM CONCENTRATION OF FITC-LPS WAS ALMOST EQUAL TO THE
BACKGROUND FLUORESCENCE. AT HIGHER LIGAND CONCENTRATION, FLUORESCENCE WAS PARTIALLY
QUENCHED. WE CAN SEE THAT FLUORESCENCE EXPRESSED BY CELLS FOR 1, 3, 7 µM CONCENTRATION
OF FITC-LPS WAS ALMOST EQUAL TO THE BACKGROUND FLUORESCENCE. AT HIGHER LIGAND
CONCENTRATION, FLUORESCENCE WAS PARTIALLY QUENCHED. ........................................................... 39
FIGURE 13. DOSE RESPONSE PLOT OF LPS-TLR4 BINDING AT 37 °C. EXPERIMENTAL DOSE RESPONSE
CORRESPONDS TO THE FLUORESCENT INTENSITY MEASURED BY FLOW CYTOMETER, MODEL FIT CURVE IS
OBTAINED BY SIMULATION, USING EQUATION 8, MENTIONED IN MATERIALS AND METHODS SECTION.
THE DISSOCIATION CONSTANT KD OBTAINED FROM THE KINETICS PLOTS WAS 56.30 µM, RTOT OR
MAXIMUM INTENSITY OBTAINED WAS 2500, AND KNS, NON-SPECIFIC BINDING CONSTANT WAS
CALCULATED TO BE 1.92 µM -1(ASSUMING, SINGLE BINDING SITE FOR EACH CELL). .............................. 40
ix
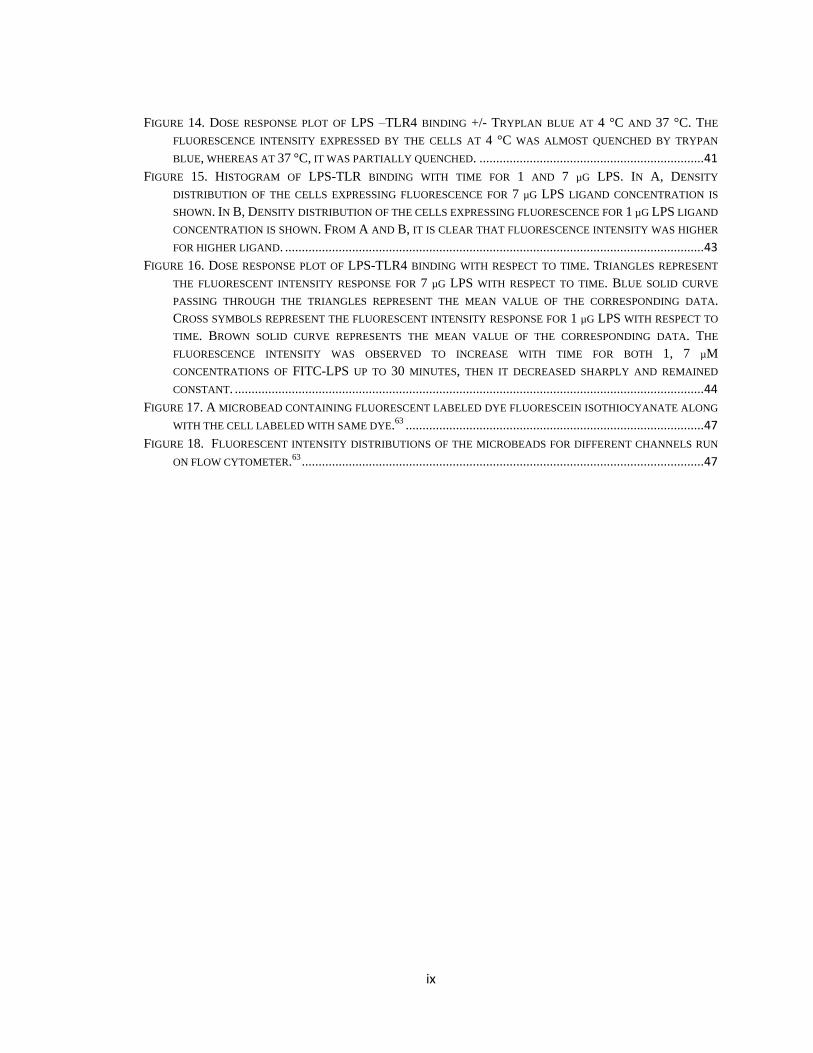
FIGURE 14. DOSE RESPONSE PLOT OF LPS –TLR4 BINDING +/- TRYPLAN BLUE AT 4 °C AND 37 °C. THE
FLUORESCENCE INTENSITY EXPRESSED BY THE CELLS AT 4 °C WAS ALMOST QUENCHED BY TRYPAN
BLUE, WHEREAS AT 37 °C, IT WAS PARTIALLY QUENCHED. ................................................................... 41
FIGURE 15. HISTOGRAM OF LPS-TLR BINDING WITH TIME FOR 1 AND 7 µG LPS. IN A, DENSITY
DISTRIBUTION OF THE CELLS EXPRESSING FLUORESCENCE FOR 7 µG LPS LIGAND CONCENTRATION IS
SHOWN. IN B, DENSITY DISTRIBUTION OF THE CELLS EXPRESSING FLUORESCENCE FOR 1 µG LPS LIGAND
CONCENTRATION IS SHOWN. FROM A AND B, IT IS CLEAR THAT FLUORESCENCE INTENSITY WAS HIGHER
FOR HIGHER LIGAND. ............................................................................................................................. 43
FIGURE 16. DOSE RESPONSE PLOT OF LPS-TLR4 BINDING WITH RESPECT TO TIME. TRIANGLES REPRESENT
THE FLUORESCENT INTENSITY RESPONSE FOR 7 µG LPS WITH RESPECT TO TIME. BLUE SOLID CURVE
PASSING THROUGH THE TRIANGLES REPRESENT THE MEAN VALUE OF THE CORRESPONDING DATA.
CROSS SYMBOLS REPRESENT THE FLUORESCENT INTENSITY RESPONSE FOR 1 µG LPS WITH RESPECT TO
TIME. BROWN SOLID CURVE REPRESENTS THE MEAN VALUE OF THE CORRESPONDING DATA. THE
FLUORESCENCE INTENSITY WAS OBSERVED TO INCREASE WITH TIME FOR BOTH 1, 7 µM
CONCENTRATIONS OF FITC-LPS UP TO 30 MINUTES, THEN IT DECREASED SHARPLY AND REMAINED
CONSTANT. ............................................................................................................................................ 44
FIGURE 17. A MICROBEAD CONTAINING FLUORESCENT LABELED DYE FLUORESCEIN ISOTHIOCYANATE ALONG
WITH THE CELL LABELED WITH SAME DYE.63 ......................................................................................... 47
FIGURE 18. FLUORESCENT INTENSITY DISTRIBUTIONS OF THE MICROBEADS FOR DIFFERENT CHANNELS RUN
ON FLOW CYTOMETER.63 ........................................................................................................................ 47

x
List of Tables
TABLE 1. CELL VIABILITY DATA FOR LPS-TLR4 BINDING AT 4 °C ................................................................ 26
TABLE 2. CELL VIABILITY DATA FOR FLUORESCENCE QUENCHING OF LPS AT 4 °C ....................................... 30
TABLE 3. CELL VIABILITY DATA FOR LPS-TLR4 BINDING AT 37 °C .............................................................. 36
TABLE 4. CELL VIABILITY DATA FOR FLUORESCENCE QUENCHING AT 37 °C .................................................. 39
TABLE 5. DISSOCIATION , NONSPECIFIC BINDING CONSTANT AND TOTAL RECEPTOR CONCENTRATION AT 4 °C
AND 37 °C FOR LPS-TLR4 ASSOCIATION .............................................................................................. 45
1
Chapter 1. Introduction
The living organism contains an amazing array of systems to protect it from invading
pathogens -called the immune system. The immune system is complex and interesting.
Higher animals have two types of immunity. The first line of defense is called innate
immunity; adaptive immunity is the second line of defense against infections. Innate
immunity is responsible for defense against bacterial antigens. Lipopolysaccharide or
LPS is found on the cell walls of gram negative bacteria such as Escherichia coli. LPS is
recognized by innate immune system resulting in an inflammatory response. Front-line
anti-microbial defense is accomplished by the innate immune system with the help of
pattern recognition receptors (PRRs), such as Toll-like receptors, in early detection of
pathogens. There are several types of PRRs including complement, glucan, mannose,
scavenger, and toll-like receptors, each bind specific pathogen associated molecular
patterns (PAMP). PAMPs are the broad classes of pathogens which express a set of class-
specific, mutation resistant molecules. PAMPs include formulated peptides, and diverse
bacterial cell wall components, such as lipopolysaccharide (LPS), lipopeptides,
peptidoglycans, and teichoic acids.
Among all the TLRs, TLR4 is generally considered as a LPS receptor. TLR4 is
expressed by B cells, dendritic cells, monocytes, macrophages and T cells. Among all
these, macrophages are the cells which express high levels of TLR4, therefore
macrophage cells are used to study the binding of LPS. The purpose of this study is to
investigate the equilibrium binding constants of LPS to TLR4 of IC21 mice macrophage
cells. The stimulation of TLR4 by LPS increases the expression of critical pro-
inflammatory cytokines that are requisite to induce potent immune responses. LPS-TLR4
signaling has been intensively studied in past few years. LPS is mostly studied because it
is a well characterized PAMP in which Lipid A portion is invariant and is present in
every species of bacteria, but the O antigen portion is variant. And also LPS is found to

2
exhibit aggregation behavior in culture medium, so effective molecular weight of LPS
during interaction with TLR4 is to be determined. SDS-PAGE is the proposed method to
analyze LPS. TLR4 is chosen among all TLRs because TLR4 is the only TLR that can
activate both MyD88-dependent induction of genes encoding inflammatory molecules
and TRIF-dependent production of type I interferon. Therefore LPS when encountered by
macrophages initiates a cascade of events resulting in the release of inflammatory
cytokines and tissue factors. In this study, we investigate the kinetics involved in LPS-
TLR4 binding because, we believe, the upstream binding processes directly affect the
downstream signaling processes and the release of transcription factors and cytokines.
Therefore, once LPS is analyzed, its interaction with TLR4 can be investigated and
quantified.
3
Chapter 2. Literature Survey
2.0 Innate immunity
The immune system is composed of two major subdivisions; the innate and the
adaptive immune system. The innate immune system provides early defense against
pathogen invasion and it alerts the adaptive immune system about the pathogen invasion.1
Each of the major subdivision has both cellular and humoral components by which they
carry out their protective function. In addition, innate immune system has anatomical
features that functions as barriers to infection. Although these two arms of the immune
system have distinct functions, there is interplay between these systems (i.e., components
of the innate immune system influence the adaptive immune system and vice versa).
There are two phases to the immune response: pathogen recognition and pathogen
removal. Although the innate and adaptive immune systems both function to protect
against invading organisms, they differ in a number of ways. The adaptive immune
system requires some time to react to an invading organism, whereas the innate immune
system includes defenses that are mostly present and ready to be mobilized upon
infection. Second, the adaptive immune system is specific against new antigens identified
as dangerous. In contrast, the innate immune system reacts to a small subset of patterns
encoded within the genome and does not change. Finally, the adaptive immune system
demonstrates immunological memory. It “remembers” that it has encountered an
invading organism and reacts more rapidly on subsequent exposure to the same organism.
In contrast, the innate immune system does not demonstrate immunological memory.
The innate immune system contains anatomical barriers such as skin, mucous
membrane, saliva etc. However, when anatomical barriers are breached by tissue damage,
inflammatory and cellular barriers come into play. 2 The cells that mediate innate immune
response include macrophages, neutrophils, eosinophils, mast cells and natural killer
cells. Pathogen recognition by innate immune system occurs through PRRs found in all
cells of the innate immune system. These PRRs recognize the broad spectrum of
molecular patterns PAMPs found in pathogens but not in the host. A particular PRR can

4
recognize a molecular pattern that may be present on a number of different pathogens
enabling the receptor to recognize a variety of different pathogens.
2.1. Macrophages
Macrophages are the key players in the immune response to foreign invaders such
as infectious microorganisms. Blood monocytes migrate into the tissues of the body and
there evolve into macrophages. They are found in almost every tissue in the body, where
they participate in various biological processes, ranging from development, to bone
remodeling and wound healing. They express full repertoire of functions; they detect,
ingest and destroy infectious agents; they initiate T-cell responses by antigen
presentation, and they act as effector cells for both humoral and cell mediated responses.
Macrophages express a broad range of plasma membrane receptors that mediate their
interactions with natural and altered-self components of the host as well as a range of
microorganisms. Macrophages express several receptor families responding to specific
ligands and performing specific functions. Among which toll-like receptors respond to
LPS. Recognition is followed by surface changes, uptake, signaling and altered gene
expression, contributing to homeostasis, host defense, innate effector mechanisms, and
the induction of acquired immunity.3
Two major classes of pattern recognition receptors exist in macrophages;
endocytic pattern-recognition receptors and signaling pattern recognition receptors.
Endocytic pattern-recogniton receptors are found on the phagocytic cells (neutrophils,
monocytes and macrophages); these receptors attach microorganisms to phagocytes
leading to engulfment and destruction. These include mannose receptors, scavanger
receptors, opsonin receptors and N-formyl-met receptors. Signaling pattern-recognition
receptors bind to PAMPs and promote the synthesis and secretion of intracellular
regulatory molecules called as cytokines which are necessary to initiate innate immunity
and adaptive immunity.4 A series of signaling PRRs are found on the macrophages and
5
dendritic cells, these are known as toll-like receptors (TLRs). These receptors play an
important role in induction of innate immunity and adaptive immunity. On binding of
PAMPs to its TLR, a signal is transmitted to the host cell’s nucleus leading to the
induction of pro-inflammatory cytokines. These cytokines in turn bind to the cytokine
receptors present on other defense cells such as cells of the adaptive immunity, thus
initiating the induction of adaptive immunity.3
2.2. Lipopolysaccharide
Fever was one of the first recorded physical findings in medicine. Early
investigators hypothesized that inducer of fever were physical entities and named them
pyrogens, derived from the Greek root pyr, meaning fire. Then there was a controversy in
stating fever as a disease or a host defense mechanism against illness. Albrecht von
Haller, a pioneer in the field of LPS showed that decomposing tissue could induce fever
when re-injected intravenously.5 In 1892, Richard Pfeiffer published that Vibrio cholera
had a toxin “closely attached to, and probably an integral part of, the bacterial body”.5
This came at a time when most scientists believed pyrogens to be secreted proteins like
the other known bacterial toxins. Pfeiffer is credited with coining the term endotoxin
(although he never published it), which is still used today.6
Endotoxin was first purified around by Andre Boivin and Lydia Mesrobeanu
using a trichloroacetic acid (TCA)-based method. Soon after, Walter T.J. Morgan and
Walther F. Goebel used organic solvents and water to purify endotoxin. Both groups
found endotoxin to be composed of lipid and polysaccharide with very little if any
associated protein.5
The bacterial endotoxin lipopolysaccharide (LPS) is the major constituent of
gram-negative bacteria that activates TLRs. LPS consists of three covalently linked
domains (Fig. 1). Lipid A (endotoxin), the core region and the O antigen polymer.
Studies in several different laboratories determined that O antigen was a complex of
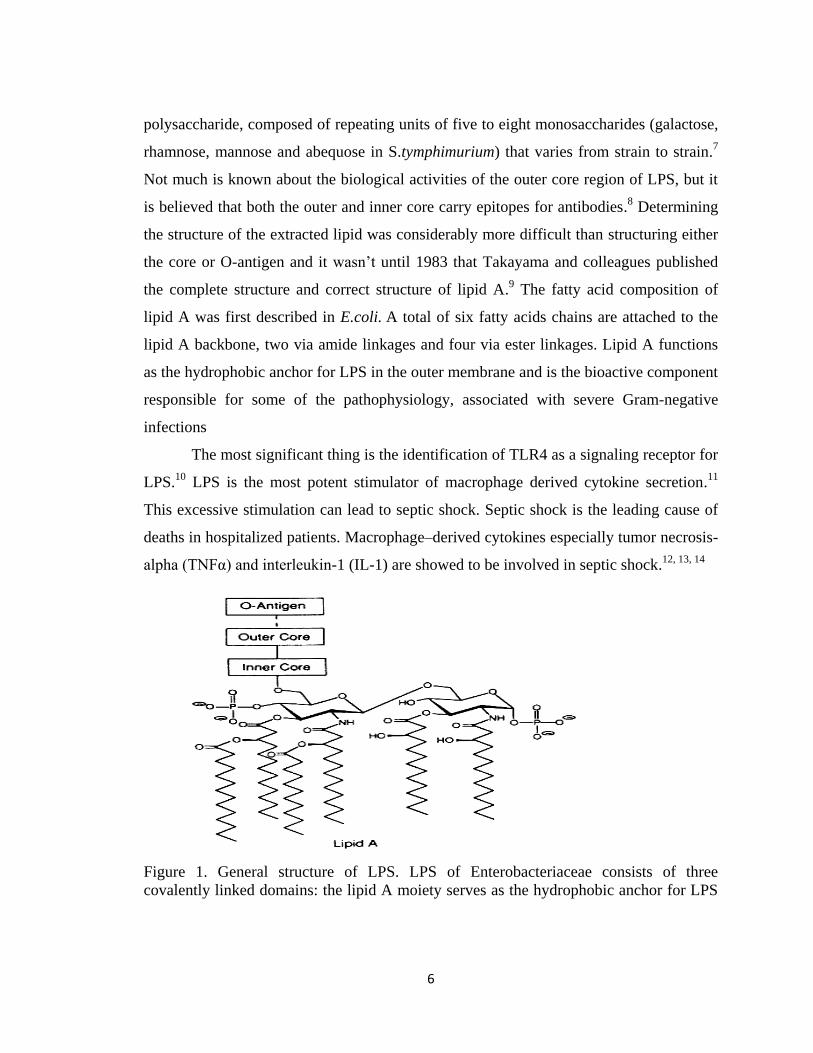
6
polysaccharide, composed of repeating units of five to eight monosaccharides (galactose,
rhamnose, mannose and abequose in S.tymphimurium) that varies from strain to strain.7
Not much is known about the biological activities of the outer core region of LPS, but it
is believed that both the outer and inner core carry epitopes for antibodies.8 Determining
the structure of the extracted lipid was considerably more difficult than structuring either
the core or O-antigen and it wasn’t until 1983 that Takayama and colleagues published
the complete structure and correct structure of lipid A.9 The fatty acid composition of
lipid A was first described in E.coli.
A total of six fatty acids chains are attached to the
lipid A backbone, two via amide linkages and four via ester linkages. Lipid A functions
as the hydrophobic anchor for LPS in the outer membrane and is the bioactive component
responsible for some of the pathophysiology, associated with severe Gram-negative
infections
The most significant thing is the identification of TLR4 as a signaling receptor for
LPS.10
LPS is the most potent stimulator of macrophage derived cytokine secretion.11
This excessive stimulation can lead to septic shock. Septic shock is the leading cause of
deaths in hospitalized patients. Macrophage–derived cytokines especially tumor necrosis-
alpha (TNFα) and interleukin-1 (IL-1) are showed to be involved in septic shock.12, 13, 14
Figure 1. General structure of LPS. LPS of Enterobacteriaceae consists of three
covalently linked domains: the lipid A moiety serves as the hydrophobic anchor for LPS
7
in the outer most bacterial membranes and confers endotoxic properties to the LPS, the
core region is the phosphorylated non-repeating oligosaccharide that links lipid A to the
hypervariable O-antigen polymer.13
2.3. LPS receptor complex
LPS receptor complex is comprised of LBP (Lipobinding protein), Toll-like
receptor 4 (TLR4), MD-2 and CD14. CD14 is a myeloid marker antigen.16
The role of
CD14 in LPS activation of monocytes and macrophages has been demonstrated both
biochemically and genetically.17
For example, over expression of human CD14 in
transgenic mice renders these mice hypersensitive to LPS, as evidenced by their
increased susceptibility to endotoxin shock. In contrast, CD14 deficient mice are hypo-
responsive to LPS and are at least 10 times less sensitive to LPS than normal mice.18
Although CD14 is known to bind LPS it has little signaling capacity because it is bound
to the cell membrane by glycosyl phosphatidylinositol (GPI) linkage. MD-2 is a
glycoprotein that forms complex with the TLR4. The importance of MD-2 in LPS
recognition can be understood by the fact that MD-2 deficient mice exhibit no response to
LPS. There is now clear evidence that Toll like receptors (TLRs) mediate the response to
LPS.
2.4. Toll-like receptor signaling
Mammalian cells express Toll-like receptors (TLRs) as detectors for variety of
molecular patterns on microorganisms.20
Akira et al. studied that families of pattern-
recognition receptors detect the microbes which leads to the activation of innate and
adaptive immune responses.22, 23
Toll-like receptors (TLRs) are the best characterized
PRRs and are directly responsible for the defense against bacterial and viral infection.21
After microbial detection, one or more adaptor protein(s) containing a Toll-interleukin 1
8
(IL-1) receptor (TIR) domain bind(s) to the cytosolic TIR domains of TLRs. Four TIR
domain-containing adaptors are involved in propagating TLR signaling: MyD88, TIRAP,
TRAM and TRIF. These adaptors link activated TLRs with downstream kinases of the
IL-1 receptor associated kinase and mitogen activated protein kinase families, as well as
with members of the TRAF family of E3 ubiquitin ligases. Activation of these enzymes
leads to the activation of transcriptional regulators such as NF- B, AP-1 and several
interferon-regulatory factors (IRFs), which induce hundreds of genes involved in immune
defense.19
The studies made by Hayashi, F. et al. and Toshchakov et al. have notified a
link between receptor localization, the type of transcriptional response induced and the
class of microbe detected.27, 28
For example, TLR2, TLR4 and TLR5 all recognize
different components of bacterial cell wall and, appropriately, are found on the cell
surface, where they induce the production of pro-inflammatory cytokines after the
detection of microbes.24,26
In contrast, TLR3, TLR7 and TLR9 detect viral nucleic acids
and are found in endolysosomal compartments, where they are poised to detect nucleic
acids released after viral degradation.29, 30, 31
Kagan et al. studied that TLR4 is unique
among TLRs. First, TLR4 is the only known TLR able to activate both MyD88-
dependent induction of genes encoding inflammatory molecules and TRIF-dependent
production of type I interferon.25
Second, with the exception of TLR4, all other known
TLRs are sensors of nucleic acids and induce activation of IRF3 or IRF7 from
intracellular compartments. Finally, TLR4 is the only known TLR that engages all four
TIR domain-containing adaptors.32, 33
2.5. Toll-like receptor 4 (TLR4)
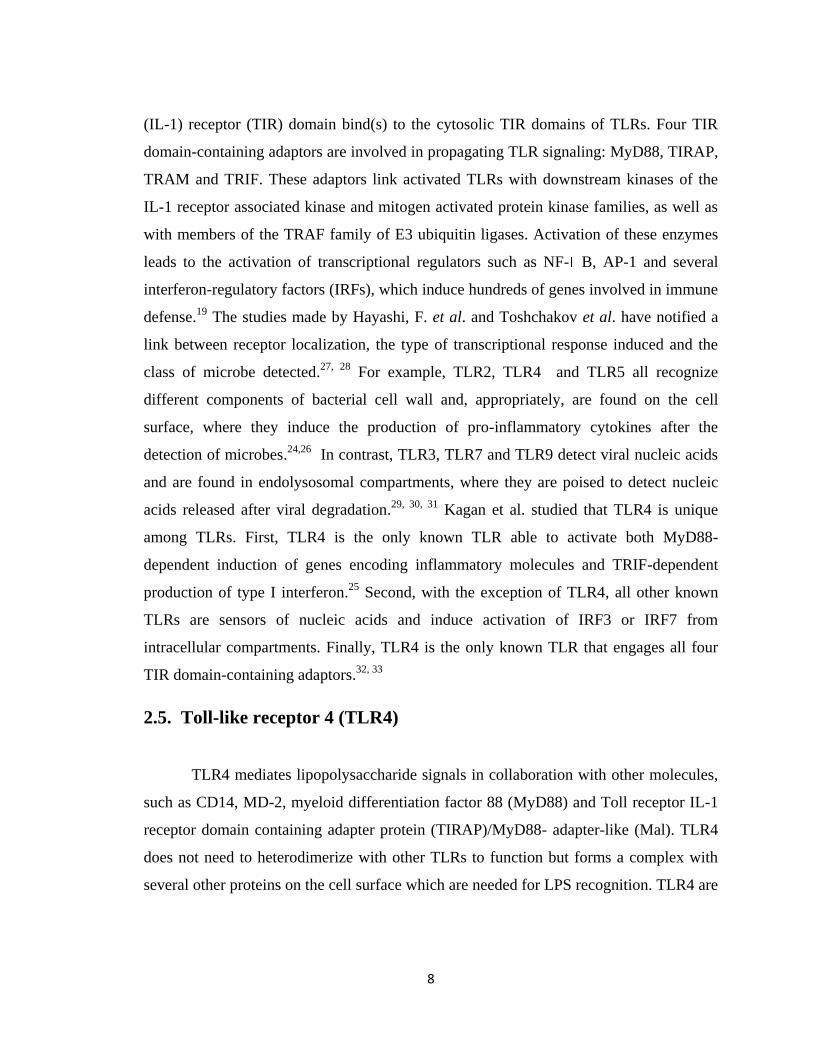
TLR4 mediates lipopolysaccharide signals in collaboration with other molecules,
such as CD14, MD-2, myeloid differentiation factor 88 (MyD88) and Toll receptor IL-1
receptor domain containing adapter protein (TIRAP)/MyD88- adapter-like (Mal). TLR4
does not need to heterodimerize with other TLRs to function but forms a complex with
several other proteins on the cell surface which are needed for LPS recognition. TLR4 are
9
often enriched in endosomes after activation. This enrichment leads to increased TLR
recognition of PAMPs from phagocytosed pathogens, enhancing activation of TLR
signaling pathways and innate immune response.
Figure 2. TLR4 signal transduction pathway. LPS binds to the LPS-binding protein
(LBP) thereby transferring lipids to CD14. CD14 subsequently transfers LPS to the
TLR/MD-2 complexes. TLR4/MD-2 complex transmits signals through MyD88
dependent pathway through Tollip and TIRAP, leading to the secretion of cytokines.
LPS is recognized in mammals by a receptor complex, composed of CD14, TLR4 and
MD-2.35, 36
To elucidate the function of TLR4 Fitzgerald et al. constructed chimeric TLR
molecules, C-terminally fused to fluorescent proteins and stably expressed these
chimerical constructs in cells.34
These TLR constructs allowed them to study the sub-
10
cellular localization, dynamics, and ligand interaction of TLRs in the environment of the
living cell. Their results demonstrate that:
i. TLR4 is both a surface protein and a Golgi-localized protein.
ii. TLR4 recycles from the surface of cells back and forth to the Golgi.
iii. LPS traffics to the Golgi (this trafficking is not independent of, but occurs
together with, its binding receptor; CD-14).37, 38
iv. The trafficking of LPS to the Golgi is not necessary for the initiation of cellular
activation.
2.6. LPS-monomer or aggregate?
The molecular structure of LPS prepared from R (rough) Escherichia Coli O8-,
SR (semi-rough) Salmonella typhimurium and S (smooth) strains E.coli O8 and
Citrobacter 396 are analyzed by Jann et al
using
SDS-PAGE and compared the results
from the same LPS preparations by degradation analysis. They showed that in SDS-
PAGE, the lipid A content of the different lipopolysaccharide varied and was expressed
in their electrophoretic mobilities.39, 40
Since LPS is heterogeneous and tends to form
aggregates of varying sizes, the molecular weight is not very meaningful. The reported
range is 2-4 million dalton or greater. When the LPS is treated with SDS and heat, the
molecular weight is in the range of 50-100 kDa. In their purest form, in the presence of
strong surface active agents, and in the absence of divalent cations, bacterial endotoxins
consist of 10-20 kDa macromolecules. In the absence of surface active agents and in the
presence of divalent cation sequestering agents such as EDTA, LPS is believed to arrange
itself into a micellar structure with a molecular weight of approximately 1,000 kDa. The
self aggregation of LPS is generally a function of the lipid A component of the molecule,
which also confers the ability to bind to hydrophobic surfaces.
But the active form of LPS, monomer or aggregate, is controversial. Therefore
Sasaki et al. had examined the aggregation behavior of a nearly homogeneous LPS,

11
Kdo2-Lipid A.41
It is difficult to interpret the immuno-stimulation data using the
biophysical multimerization data because the conditions under which cell stimulation
experiments are performed are usually different.42, 43
For instance, critical aggregation
concentration in culture medium could be different due to the binding of LPS to serum
components such as LBP, sCD14, and lipoproteins.44,45
Rivera et al. were able to analyze
the size heterogeneity of LPS using both gel filtration and SDS-PAGE.46
2.7. LPS-TLR4 binding
The mammalian toll-like receptors (TLRs) are germline-encoded receptors
expressed by cells of the innate immune system. These receptors are stimulated by
structural motifs expressed by bacteria, viruses and fungi known as PAMPs. Importantly,
TLR interactions trigger the expression of pro-inflammatory cytokines and help in the
functioning of antigen presenting cells of the innate immune system. Many PAMPs have
been identified that can stimulate a particular TLRs. For example, the TLR2/TLR6
heterodimer can be stimulated by, lipoteichoic acids (LTA) and peptidolycan (PG). TLR9
is stimulated by viral DNA rich in unmethylated CpG motifs. TLR3 interacts with viral
double stranded RNA. Evidences suggests that TLR4 can be stimulated by several
PAMPs such as LPS from gram-negative bacteria, fusion (F) protein from respiratory
syncytical virus (RSV) and the envelope protein from mouse mammary tumor virus
(MMTV).47
LPS is one of the best studied immune-stimulatory components of bacteria
capable to induce systemic inflammation and sepsis if excessive signals occur.48
Upon
LPS recognition TLR4 undergoes oligomerization and recruits downstream adaptors
through the interaction with TIR domain.
The relationship between receptor-ligand binding and processing and cellular
responses may be explained, at least in part, by determining values of the rate constants
for receptor-ligand binding and processing.52, 53, 54
Shin et al. used the Plasmon
Resonance technique to investigate the kinetics involved in the binding of LPS to the
recombinant CD14, MD-2 and TLR4 proteins produced in insect cells.49
12
2.8. Fluorescence quenching
At temperature between 0-4 °C, endocytosis is mostly stopped. The use of
chemical inhibitors for receptor mediated endocytosis was stated by Nieland et al. in their
study, where they discovered and characterized small molecules BLT-1, BLT-5 that
inhibit the transfer of lipids between HDL and cells mediated by HDL receptor SR-BI.55
Trypan blue was used to quench surface fluorescence for the flow cytometric assays.
Loike et al. were able to demonstrate that trypan blue can quench the fluorescence of
glutaraldehyde- fixed red blood cells.50, 51
2.9. Flow cytometry
Flow cytometry is a technology that allows a single cell to be measured for a
variety of characteristics, determined by looking at how they flow in liquid. Instruments
used for this can gather information about cells by measuring visible and fluorescent light
emissions, allowing cell sorting based on physical, biochemical and antigenic traits.
When a fluorescently labeled ligand is available its binding to the receptor can be
monitored using spectrofluorometry or flow cytometry. Compared to radioligand
methods, flow cytometry offers the advantage of monitoring ligand binding to single cells
in real-time without the need to separate bound from unbound ligands. Sklar and Finney
described that the total number of receptors on the cell membrane can be found by using
equilibrium binding assay at 4 °C.56
Hoffman et al. found that at 4 °C internalization,
receptor up-regulation and recycling is minimized, and thus the total number of surface
receptors can be assumed constant.57
13
Chapter 3. Experimental Design
3.1. Objective: To establish equilibrium binding constants for LPS interaction with
TLR4
3.2. Materials and methods
14
Cell line: IC21 mice macrophage cells were isolated and purified for in vitro culture.
Cells were grown and maintained at an appropriate temperature and gas mixture (37 C,
5% CO2 and fetal calf serum) in a cell incubator. Usually it takes 3-4 days for the cells to
grow up to 80% confluence. After cells were grown they were separated from the growth
medium by centrifugation for 5 minutes at 1200 rpm.
Reagents: Phosphate Buffer Saline (PBS), Trypan Blue, FITC-LPS from Escherichia
coli 0111:B4 purchased from Sigma-Aldrich. SDS-PAGE gels were prepared and run
using 1x running buffer. 10 ml of 10% separating gel was formed with 4ml of water, 3.3
ml of 30% acrylamide mix, 2.5 ml of 1.5M Tris (pH 8.8), 0.1 ml of 10% SDS, 0.1 ml of
10% ammonium persulfate and 0.004ml of TEMED. 5% stacking gel of 6ml volume if
formed with 4.1 ml of water, 1ml of 30% acrylamide mix, 0.75ml of 1.0M Tris (pH 6.8),
0.06 ml of 10% SDS, 0.06ml of 10% ammonium persulfate and 0.006ml of TEMED.
Kaleodoscope molecular weight ladder purchased from Biorad.
3.2.1. Determination of LPS molecular weight by using SDS-PAGE
Molecular weight of LPS was determined by using Polyacrylamide gel
electrophoresis. Separating gel was poured into the casting setup up to the 4cm mark
from the top of the glass plates. The gel was overlaid with water. The gel was allowed to
polymerize for 45 minutes. Then, the stacking gel was poured and the comb was inserted
with making sure that no air bubbles are formed around the wells. Then the stacking gel
was allowed to polymerize for 45 minutes. Then the comb was removed carefully. The
formed wells were rinsed several times with water using a squirt bottle and a 100 µl tip.
The wells were filled with1x running buffer. Three different types of LPS samples are
prepared one with PBS, second without PBS, and the last one with PBS and FBS.
Duplicate samples were prepared of each kind with each one of the kind sample boiled
for 5 minutes. And the rest of the samples remained unboiled. The lower buffer chamber
was filled with 1 liter 1x running buffer, and the gel assembly was placed into the lower
chamber. Slowly, 500ml of 1x running buffer was poured into a corner of the upper

15
chamber. The gel was run at 75 volts for 3 hours. The gel is imaged under the scanner
using blue light of 50 Å wavelengths under 600 Volts.
3.2.2. Determination of LPS-TLR4 binding at 4 °C
IC21 mice macrophage cells were cultured separated from the growth medium
and were counted. The cells were washed twice with PBS and spun in centrifuge at 1250
rpm for 5 minutes. The cells were poured into the wells of 96-well plate at the rate of
20,000 cells per each well. Then cells were stained by the desired concentration of FITC-
LPS. The chosen FITC-LPS concentrations are 1, 3, 7, 25, 50 µg/µl. LPS stained cells
were placed in an ice bucket for 30 minutes. The 96-well plate was wrapped with
aluminum foil to avoid exposure of light. Then, 200 µl of PBS was added to the cells in
the wells. Then the samples from each well were transferred into the falcon tubes. The
falcon tubes were sent through the FACSAria flow cytometer to measure the
fluorescence. The fluorescence intensity of the cells is the direct measure of binding. The
experimental results were exported from the flow cytometer in FCS3.0 version (e.g.,
foo.fcs) following data acquisition.
Flow cytometry data was analyzed using R/Bioconductor.58
Following installation
of R, basic Bioconductor packages and additional packages that are required to process
flow cytometry data were downloaded from web within R using:
>source ("http://www.bioconductor.org/biocLite.R")
>biocLite("flowCore")
>biocLite("flowViz")
>biocLite("flowUtils")
>biocLite("geneplotter")
>open Vignette()

16
The .fcs files were stored in a new working directory. An array was defined as
fclist that contained the data files to be analyzed and were loaded into the R workspace
using a single command:
> fs <- read.flowSet(fclist, transformation = FALSE)
A summary of the loaded flowSet can be shown by typing the variable name at
the command line:
> fs
A flowSet with 18 experiments.
column names:
FSC-A SSC-A FITC-A Time
Gating on cell size
The cell size was gated to exclude non-cellular debris and dead cells which forms
non-specific staining. The live cells were separated from the entire cell population by a
rectangular gate that selects cells with a certain forward scatter area (e.g. 25000) and
maximum intensity (e.g. infinity). Next data driven gate was created that was centered at
the median of the specified cell population. The statistics associated with gating were
calculated to determine the number of cells retained for subsequent analysis. The live
cells were shown in blue using a contour overlay that indicated the density of the cell
population.
Linear-Log data Transformation
To eliminate the negative values created after background fluorescent subtraction,
the linear values of the fluorescence intensity were transformed into logarithmic values.
The relationship used for this transformation was encoded as a function within the script:
17
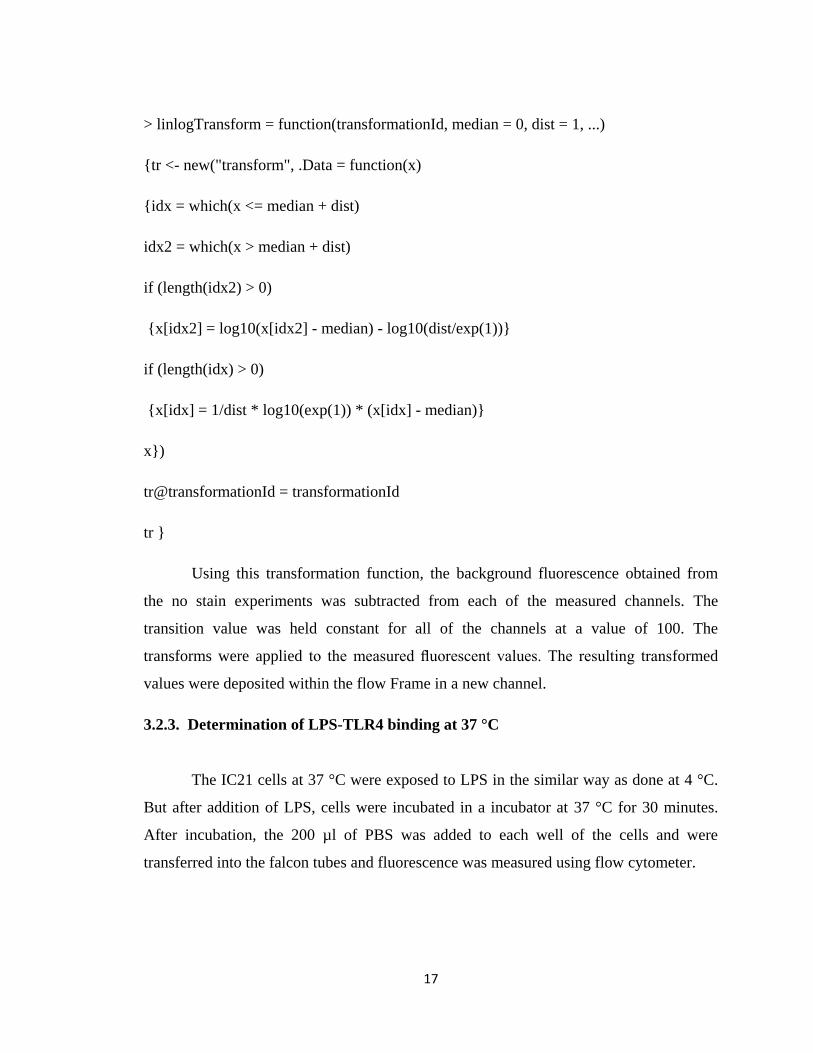
> linlogTransform = function(transformationId, median = 0, dist = 1, ...)
{tr <- new("transform", .Data = function(x)
{idx = which(x <= median + dist)
idx2 = which(x > median + dist)
if (length(idx2) > 0)
{x[idx2] = log10(x[idx2] - median) - log10(dist/exp(1))}
if (length(idx) > 0)
{x[idx] = 1/dist * log10(exp(1)) * (x[idx] - median)}
x})
tr@transformationId = transformationId
tr }
Using this transformation function, the background fluorescence obtained from
the no stain experiments was subtracted from each of the measured channels. The
transition value was held constant for all of the channels at a value of 100. The
transforms were applied to the measured fluorescent values. The resulting transformed
values were deposited within the flow Frame in a new channel.
3.2.3. Determination of LPS-TLR4 binding at 37 °C
The IC21 cells at 37 °C were exposed to LPS in the similar way as done at 4 °C.
But after addition of LPS, cells were incubated in a incubator at 37 °C for 30 minutes.
After incubation, the 200 µl of PBS was added to each well of the cells and were
transferred into the falcon tubes and fluorescence was measured using flow cytometer.

18
3.2.4. Fluorescence quenching using Trypan blue
Trypan blue was used to quench the fluorescence on the cell surface membrane.
Hence after the cells were exposed to LPS and incubated for half an hour at 4 °C and 37
°C, the cells were added with 200µl of 0.02% trypan blue. The cells at the rate of 20000
cells per each well were incubated with trypan blue for 15 minutes and the fluorescence
was measured using flow cytometer.
3.2.5. Determination of LPS-TLR4 binding with respect to time
Binding of LPS to TLR4 with time at 37 °C was found by adding FITC-LPS to
the IC 21 mice cells at different intervals of time, up to 3 hours. Fluorescence of cells was
measured at different time points. The obtained data was analyzed by using R, to
determine the equilibrium binding time.
3.2.6. Determination of Dissociation Constant
The Dissociation constant, kD, was determined using binding assay at 4 °C After
subtraction of background fluorescence from the total fluorescence obtained for each
ligand concentration, the concentration of free ligand and receptor-ligand complexes was
determined. The total number of surface TLR4 receptor, Rtot and the apparent equilibrium
dissociation constant kD were evaluated by minimizing the squared residual of the data
points in a fit to a one site model.
As a base model of receptor-ligand binding, monovalent ligand model was considered
where ligand, L, binds reversibly to a monovalent receptor, R, to form a receptor-ligand
complex, C;
CLR (1)
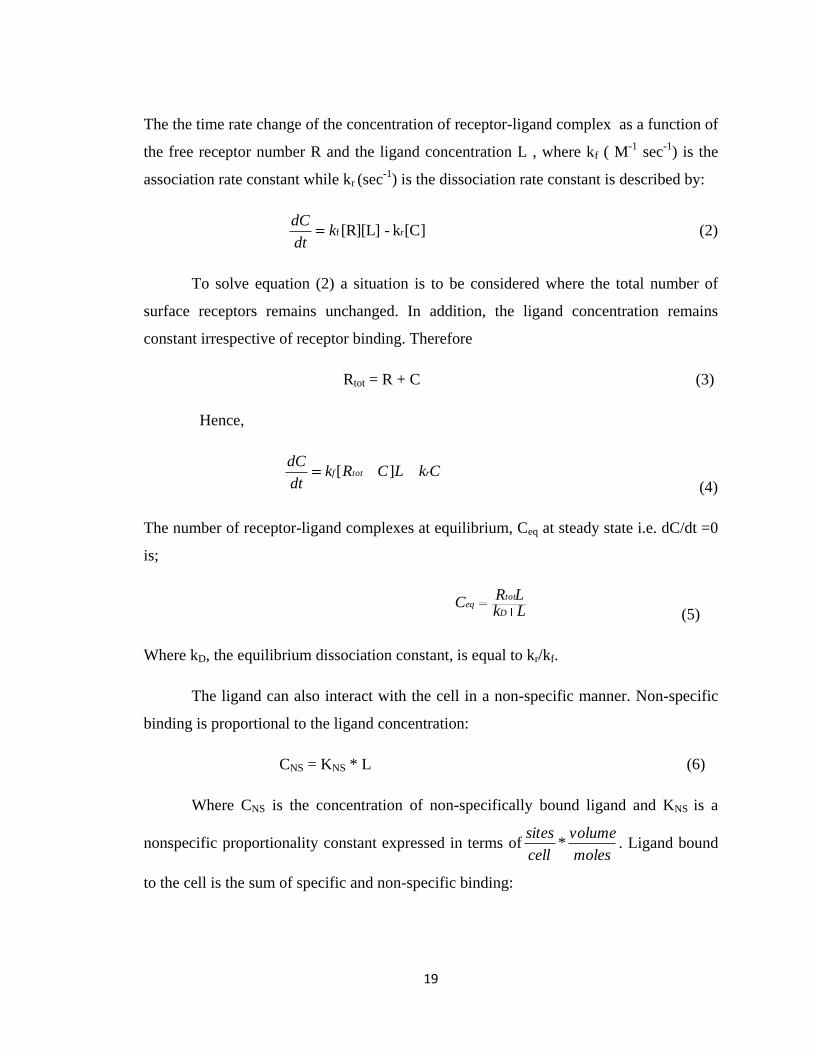
19
The the time rate change of the concentration of receptor-ligand complex as a function of
the free receptor number R and the ligand concentration L , where kf ( M-1
sec-1
) is the
association rate constant while kr (sec-1
) is the dissociation rate constant is described by:
[C]k - [R][L] r fkdt
dC (2)
To solve equation (2) a situation is to be considered where the total number of
surface receptors remains unchanged. In addition, the ligand concentration remains
constant irrespective of receptor binding. Therefore
Rtot = R + C (3)
Hence,
CkLCRkdt
dCrtotf ][
(4)
The number of receptor-ligand complexes at equilibrium, Ceq at steady state i.e. dC/dt =0
is;
LkLR
CD
toteq
(5)
Where kD, the equilibrium dissociation constant, is equal to kr/kf.
The ligand can also interact with the cell in a non-specific manner. Non-specific
binding is proportional to the ligand concentration:
CNS = KNS * L (6)
Where CNS is the concentration of non-specifically bound ligand and KNS is a
nonspecific proportionality constant expressed in terms ofmoles
volume
cell
sites* . Ligand bound
to the cell is the sum of specific and non-specific binding:
20
ccc NSeqtot (7)
LKLK
LRC NS
D
tottot *
(8)
Therefore, the two terms in the R.H.S of the equation # 8 represent specific and non-
specific binding respectively.
Now, the equation # 8 was used to determine the constants Rtot, KD and KNS.
As, the fluorescence intensity measure of the cells obtained was the result of both specific
and non-specific binding of the ligand, fluorescence intensity was calculated by making
suitable assumptions and many iterations were made until the error between
experimentally obtained fluorescent measure and theoretically obtained fluorescent
measure was minimized. The calculations were done in excel sheets.

21
3.3. Results
3.3.1. Lipopolysaccharide (LPS) analysis by SDS-PAGE
An applied electric field across the gel caused the negatively charged sample
molecules to migrate across the gel towards the anode. Depending upon the size, the
molecules moved differently through the gel: low-molecular-weight molecules moving
more easily than the high-molecular-weight ones. The gel is calibrated by running the
kaleidoscope molecular-weight marker in the separate lane. The scanned image of the gel
is obtained and molecular weight of the FITC-LPS samples in the gel is determined by
comparing the distance travelled by the sample relative to the molecular-weight marker.
Figure 1 shows the scanned image of the FITC-LPS samples in the polyacrylamide being
compared with the molecular weight marker.
As we see from the figure the image of the FITC-LPS sample in the presence of
FBS has high-molecular-weight than the other two FITC-LPS samples. This may be
attributed to the fact that FBS contains lipoproteins which adhered to LPS molecules,
thereby increasing the size of the molecule. The other two samples did not differ much in
their size indicating that boiling had a minimal effect on the molecular weight of the LPS
samples before running through the gel. The image of the high concentration LPS
samples was darker than the low concentration LPS samples.

22
Figure 3. Scanned image of LPS samples in SDS-PAGE. Wells formed in stacking gel
were numbered from 6 to 0. In the well 6, Molecular weight marker was filled. In wells 5
and 4, 5µg and 1µg boiled LPS samples in presence of PBS was added. In wells 3 and 2,
5 µg and 1µg LPS samples in presence of PBS was added. In wells 1 and 0, LPS 5µg and
1µg LPS samples in presence of FBS and PBS was added.
6 5 4 3 2 1 0
75 KD
50 KD
37 KD
25 KD

23
A B
C D

24
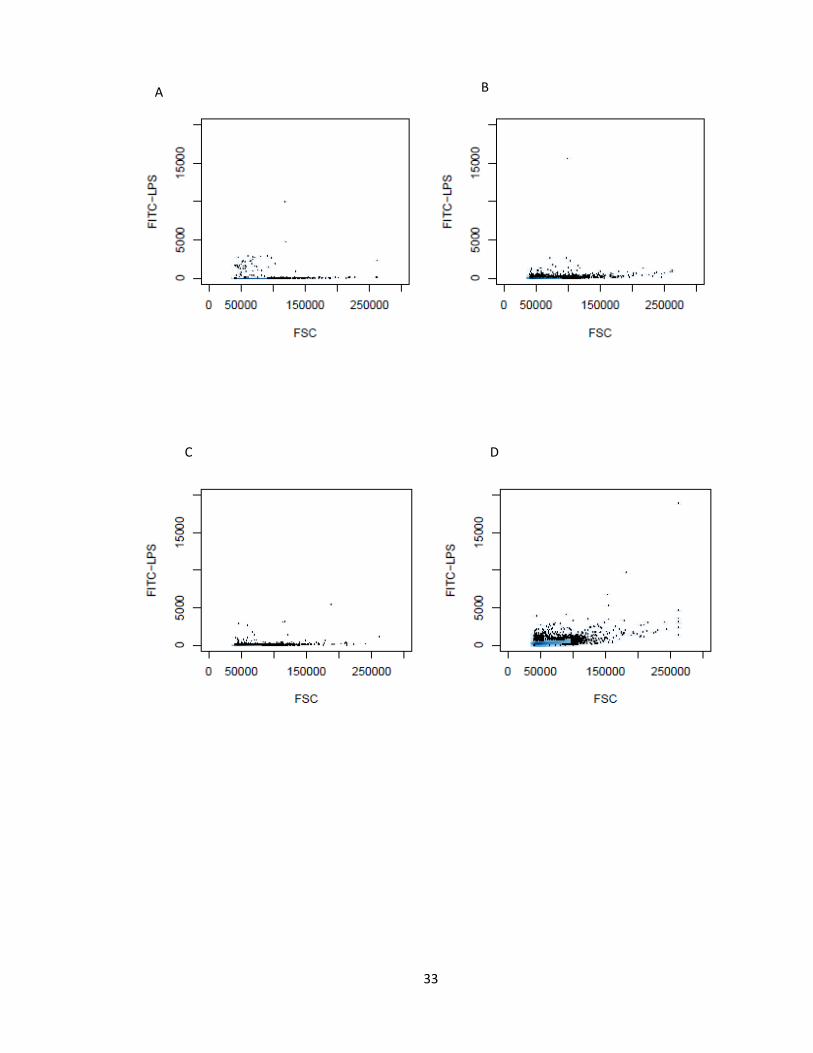
Figure 4. Forward Scatter-Side Scatter plots for LPS-TLR4 binding at 4 °C. The dots
scattered outside the contour are the cells rejected. Plot A represents the FSC-SSC for
unstained IC21 mice cells at 4 °C, B for cells stained with 1 µg/ml LPS, C represents plot
of concentration of LPS versus FSC for unstained cell, D represents plot of log of
concentration of LPS versus FSC for cells stained with 1 µg/ml LPS, E and F represents
the plots of concentration of LPS versus FSC for 3 and 7 µg/ml respectively.
E F

25
Figure 5. Histogram of LPS-TLR4 binding at 4 °C. The area under each curve represents
the population density exhibiting fluorescence measured along horizontal axis. Black
curve represents the background fluorescence exhibited by unstained cells at 4 °C, red,
green, violet, blue and pink curves represents the fluorescence exhibited by the IC21
mice cells stained with 1, 3,7,25,50 µg/ml LPS respectively.
01
23
45
Histogram
MFI FITC-LPS
De
nsity
-100 0 100 103
104
105
nolps4#1.fcs1uglps4#1.fcs
3uglps4#1.fcs7uglps4#1.fcs25uglps4#1.fcs50uglps4#1.fcs
26
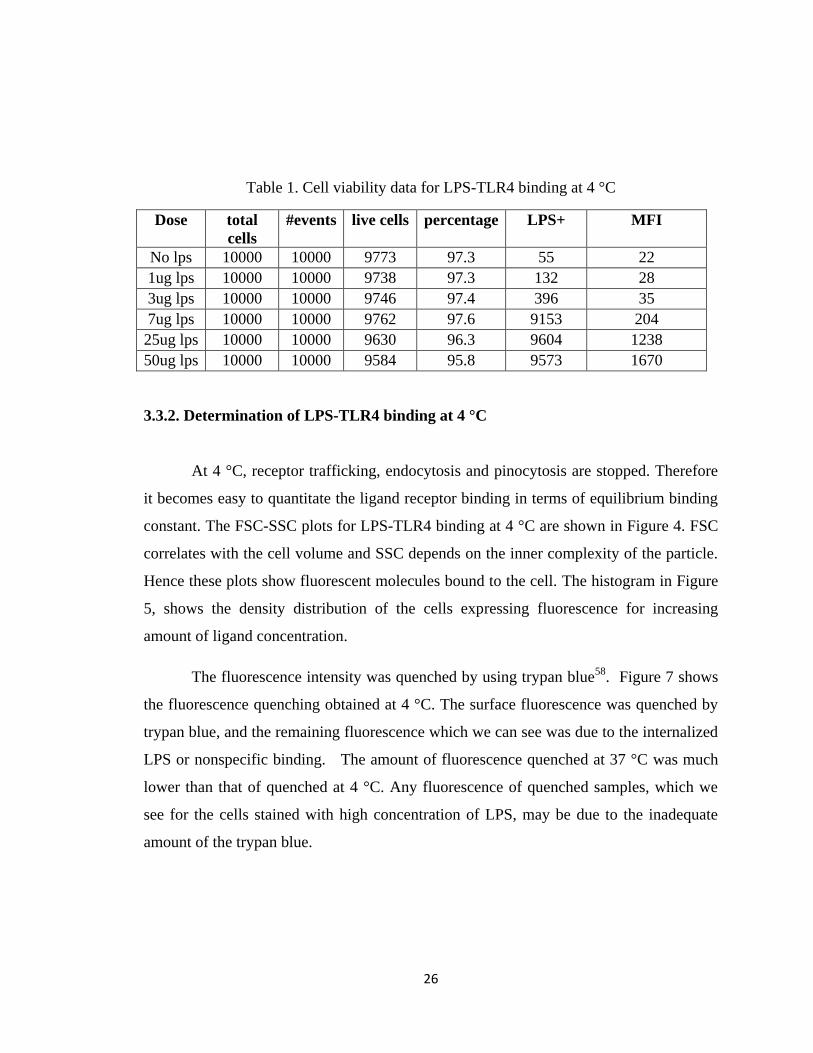
Table 1. Cell viability data for LPS-TLR4 binding at 4 °C
Dose total
cells
#events live cells percentage LPS+ MFI
No lps 10000 10000 9773 97.3 55 22
1ug lps 10000 10000 9738 97.3 132 28
3ug lps 10000 10000 9746 97.4 396 35
7ug lps 10000 10000 9762 97.6 9153 204
25ug lps 10000 10000 9630 96.3 9604 1238
50ug lps 10000 10000 9584 95.8 9573 1670
3.3.2. Determination of LPS-TLR4 binding at 4 °C
At 4 °C, receptor trafficking, endocytosis and pinocytosis are stopped. Therefore
it becomes easy to quantitate the ligand receptor binding in terms of equilibrium binding
constant. The FSC-SSC plots for LPS-TLR4 binding at 4 °C are shown in Figure 4. FSC
correlates with the cell volume and SSC depends on the inner complexity of the particle.
Hence these plots show fluorescent molecules bound to the cell. The histogram in Figure
5, shows the density distribution of the cells expressing fluorescence for increasing
amount of ligand concentration.
The fluorescence intensity was quenched by using trypan blue58
. Figure 7 shows
the fluorescence quenching obtained at 4 °C. The surface fluorescence was quenched by
trypan blue, and the remaining fluorescence which we can see was due to the internalized
LPS or nonspecific binding. The amount of fluorescence quenched at 37 °C was much
lower than that of quenched at 4 °C. Any fluorescence of quenched samples, which we
see for the cells stained with high concentration of LPS, may be due to the inadequate
amount of the trypan blue.
27
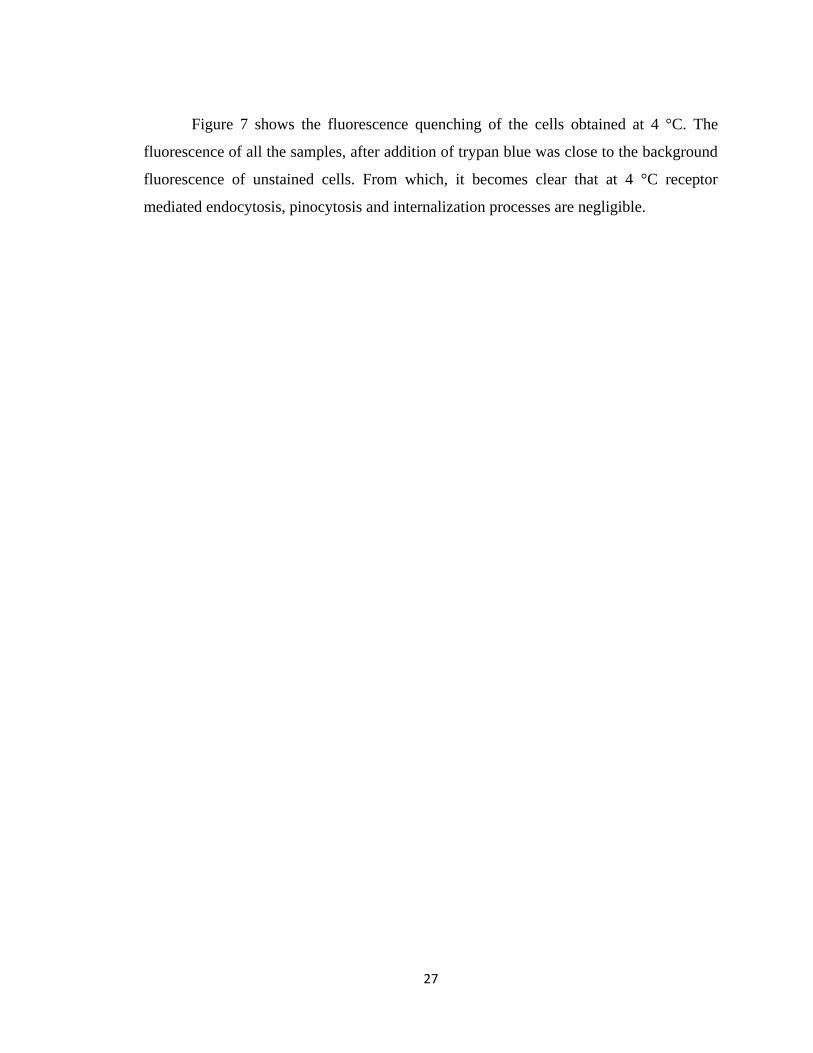
Figure 7 shows the fluorescence quenching of the cells obtained at 4 °C. The
fluorescence of all the samples, after addition of trypan blue was close to the background
fluorescence of unstained cells. From which, it becomes clear that at 4 °C receptor
mediated endocytosis, pinocytosis and internalization processes are negligible.

28
Figure 6. Forward Scatter- Side Scatter plots for fluorescence quenching at 4 °C. The
dots scattered outside the contour are the cells rejected. Plot A represents the FSC-SSC
for unstained IC21 mice cells quenched with trypan blue at 4 °C, B for cells stained with
1 µg/ml LPS, quenched with trypan blue, C represents plot of concentration of LPS
versus FSC for unstained cell, quenched with trypan blue, D represents plot of log of
concentration of LPS versus FSC for cells stained with 1 µg/ml LPS, quenched with
trypan blue.
A B
C D

29
A B
C D
30
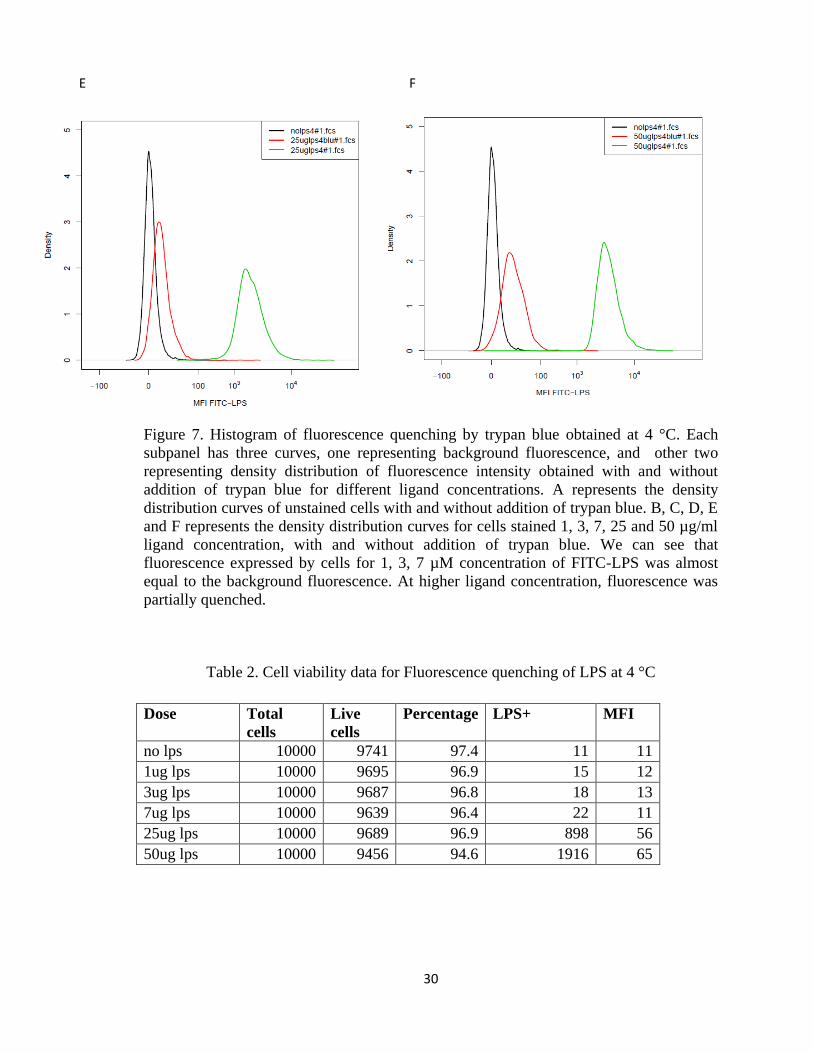
Figure 7. Histogram of fluorescence quenching by trypan blue obtained at 4 °C. Each
subpanel has three curves, one representing background fluorescence, and other two
representing density distribution of fluorescence intensity obtained with and without
addition of trypan blue for different ligand concentrations. A represents the density
distribution curves of unstained cells with and without addition of trypan blue. B, C, D, E
and F represents the density distribution curves for cells stained 1, 3, 7, 25 and 50 µg/ml
ligand concentration, with and without addition of trypan blue. We can see that
fluorescence expressed by cells for 1, 3, 7 µM concentration of FITC-LPS was almost
equal to the background fluorescence. At higher ligand concentration, fluorescence was
partially quenched.
Table 2. Cell viability data for Fluorescence quenching of LPS at 4 °C
Dose Total
cells
Live
cells
Percentage LPS+ MFI
no lps 10000 9741 97.4 11 11
1ug lps 10000 9695 96.9 15 12
3ug lps 10000 9687 96.8 18 13
7ug lps 10000 9639 96.4 22 11
25ug lps 10000 9689 96.9 898 56
50ug lps 10000 9456 94.6 1916 65
E F
31
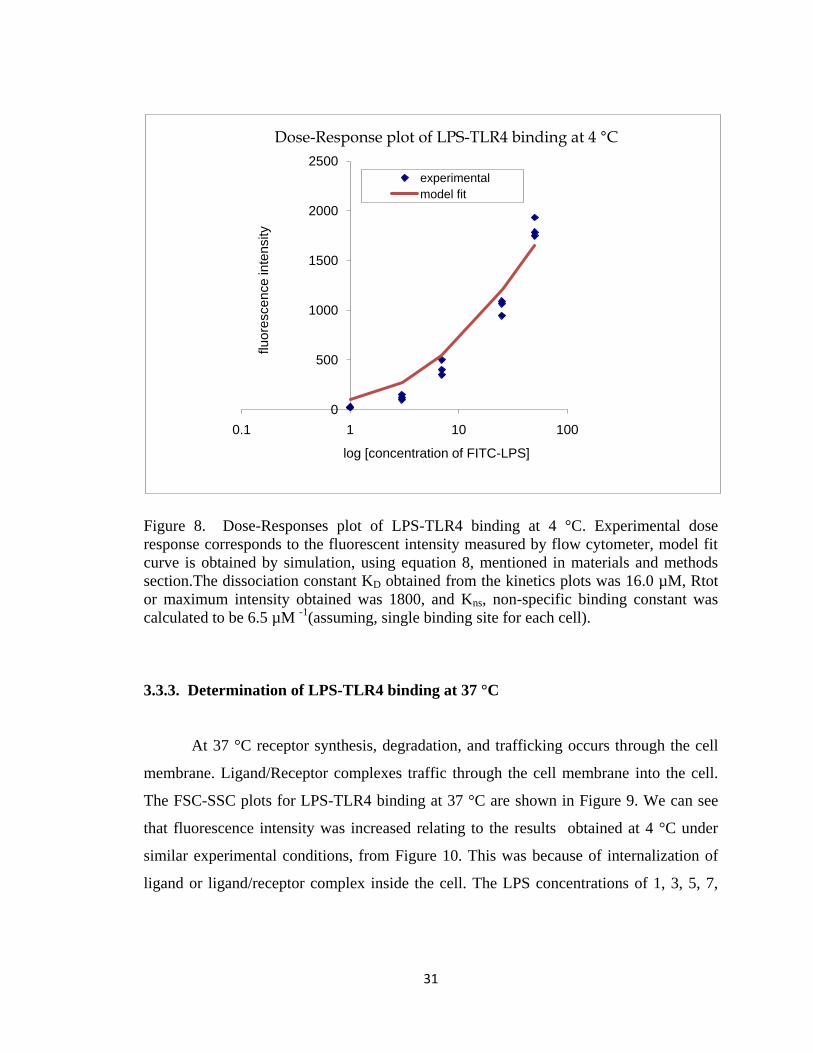
Figure 8. Dose-Responses plot of LPS-TLR4 binding at 4 °C. Experimental dose
response corresponds to the fluorescent intensity measured by flow cytometer, model fit
curve is obtained by simulation, using equation 8, mentioned in materials and methods
section.The dissociation constant KD obtained from the kinetics plots was 16.0 µM, Rtot
or maximum intensity obtained was 1800, and Kns, non-specific binding constant was
calculated to be 6.5 µM -1
(assuming, single binding site for each cell).
3.3.3. Determination of LPS-TLR4 binding at 37 °C
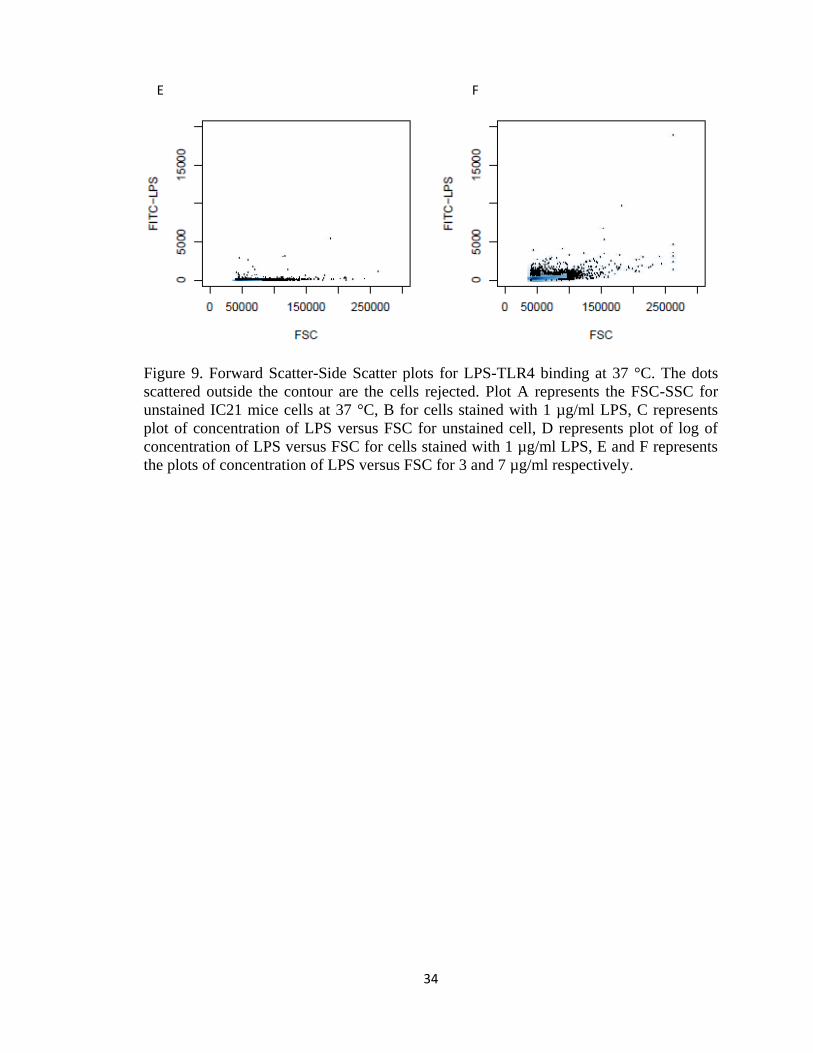
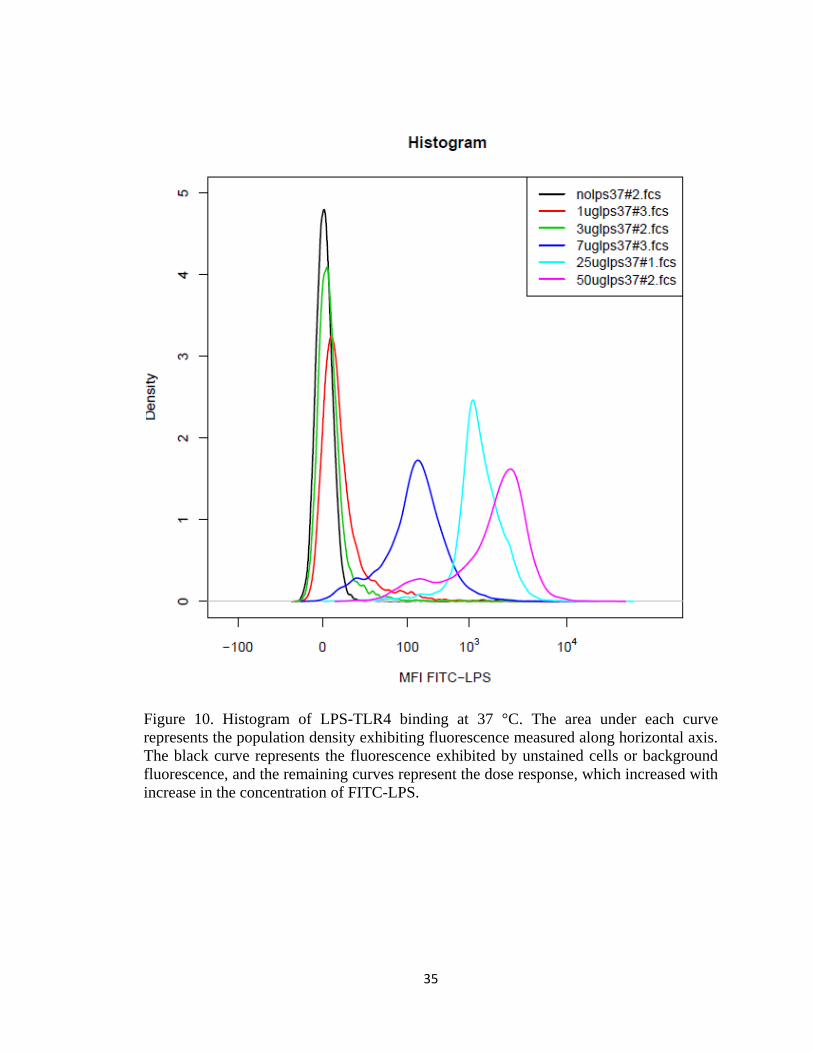
At 37 °C receptor synthesis, degradation, and trafficking occurs through the cell
membrane. Ligand/Receptor complexes traffic through the cell membrane into the cell.
The FSC-SSC plots for LPS-TLR4 binding at 37 °C are shown in Figure 9. We can see
that fluorescence intensity was increased relating to the results obtained at 4 °C under
similar experimental conditions, from Figure 10. This was because of internalization of
ligand or ligand/receptor complex inside the cell. The LPS concentrations of 1, 3, 5, 7,
0
500
1000
1500
2000
2500
0.1 1 10 100
flu
ore
sce
nce
in
ten
sity
log [concentration of FITC-LPS]
Dose-Response plot of LPS-TLR4 binding at 4 °C
experimental
model fit

32
25, 50 µM were added to the cells at 37 °C. Figure 8 shows the dose response of the cells.
The fluorescence intensity continuously increased with the increase in concentration of
the ligand added. Trypan blue was added to determine the internalized LPS at 37 °C.
Trypan blue quenched the fluorescence obtained at 37 °C, but was comparatively less
than that quenched at 4 °C. Figure 12, shows the histogram of population distribution
expressing fluorescence after the addition of trypan blue at 37 °C.
Figure 13 shows the dose response plot of the flow cytometry data for
experiments with and without addition of trypan blue at 4 °C and 37 °C.
33
A B
C D
34
Figure 9. Forward Scatter-Side Scatter plots for LPS-TLR4 binding at 37 °C. The dots
scattered outside the contour are the cells rejected. Plot A represents the FSC-SSC for
unstained IC21 mice cells at 37 °C, B for cells stained with 1 µg/ml LPS, C represents
plot of concentration of LPS versus FSC for unstained cell, D represents plot of log of
concentration of LPS versus FSC for cells stained with 1 µg/ml LPS, E and F represents
the plots of concentration of LPS versus FSC for 3 and 7 µg/ml respectively.
E F
35
Figure 10. Histogram of LPS-TLR4 binding at 37 °C. The area under each curve
represents the population density exhibiting fluorescence measured along horizontal axis.
The black curve represents the fluorescence exhibited by unstained cells or background
fluorescence, and the remaining curves represent the dose response, which increased with
increase in the concentration of FITC-LPS.
36
Table 3. Cell viability data for LPS-TLR4 binding at 37 °C
Dose total
cells
live cells percentage LPS+ MFI
No lps 10000 9773 97.7 55 27
1ug lps 10000 9738 97.4 132 62
3ug lps 10000 9746 97.5 396 154
7ug lps 10000 9762 97.6 9153 410
25ug lps 10000 9630 96.3 9604 1645
50ug lps 10000 9584 95.84 9573 2470
A B
C D

37
Figure 11. Forward Scatter-Side Scatter plots for fluorescence quenching at 37 °C. The
dots scattered outside the contour are the cells rejected. Plot A represents the FSC-SSC
for unstained IC21 mice cells quenched with trypan blue at 4 °C, B for cells stained with
1 µg/ml LPS, quenched with trypan blue, C represents plot of concentration of LPS
versus FSC for unstained cell, quenched with trypan blue, D represents plot of log of
concentration of LPS versus FSC for cells stained with 1 µg/ml LPS, quenched with
trypan blue.
E F
38
A B
A
C
A
D
A
39
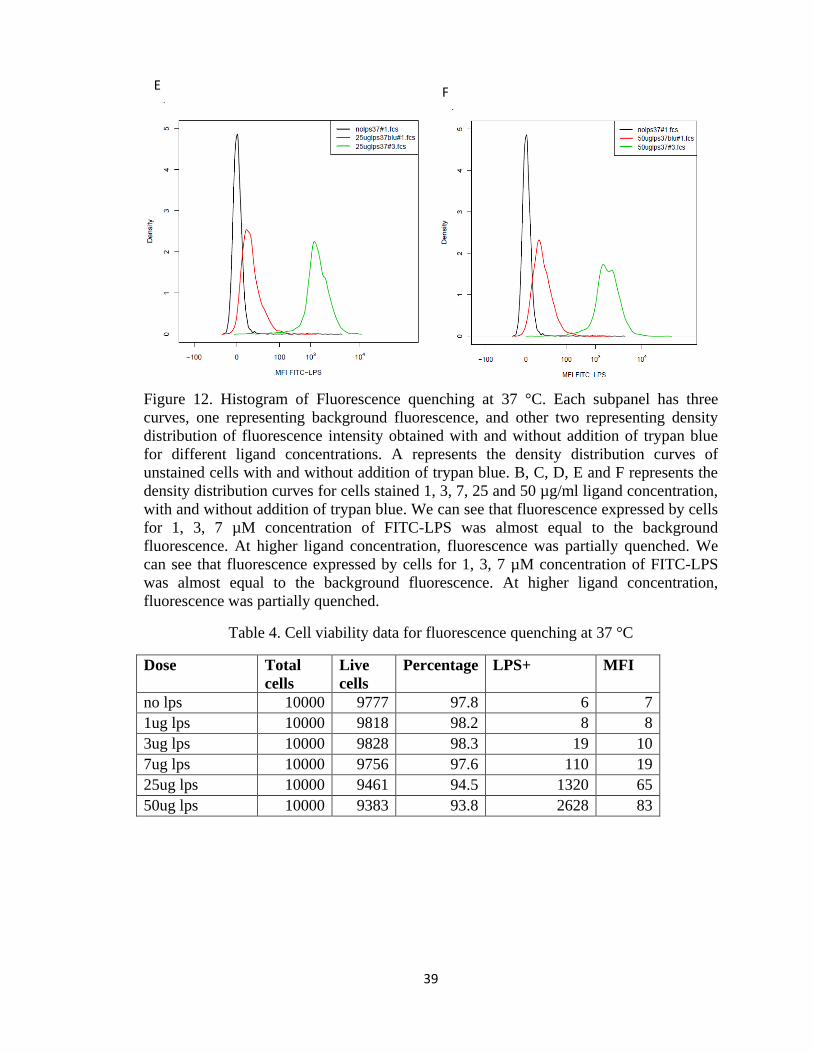
Figure 12. Histogram of Fluorescence quenching at 37 °C. Each subpanel has three
curves, one representing background fluorescence, and other two representing density
distribution of fluorescence intensity obtained with and without addition of trypan blue
for different ligand concentrations. A represents the density distribution curves of
unstained cells with and without addition of trypan blue. B, C, D, E and F represents the
density distribution curves for cells stained 1, 3, 7, 25 and 50 µg/ml ligand concentration,
with and without addition of trypan blue. We can see that fluorescence expressed by cells
for 1, 3, 7 µM concentration of FITC-LPS was almost equal to the background
fluorescence. At higher ligand concentration, fluorescence was partially quenched. We
can see that fluorescence expressed by cells for 1, 3, 7 µM concentration of FITC-LPS
was almost equal to the background fluorescence. At higher ligand concentration,
fluorescence was partially quenched.
Table 4. Cell viability data for fluorescence quenching at 37 °C
Dose Total
cells
Live
cells
Percentage LPS+ MFI
no lps 10000 9777 97.8 6 7
1ug lps 10000 9818 98.2 8 8
3ug lps 10000 9828 98.3 19 10
7ug lps 10000 9756 97.6 110 19
25ug lps 10000 9461 94.5 1320 65
50ug lps 10000 9383 93.8 2628 83
E
A
F
A
40
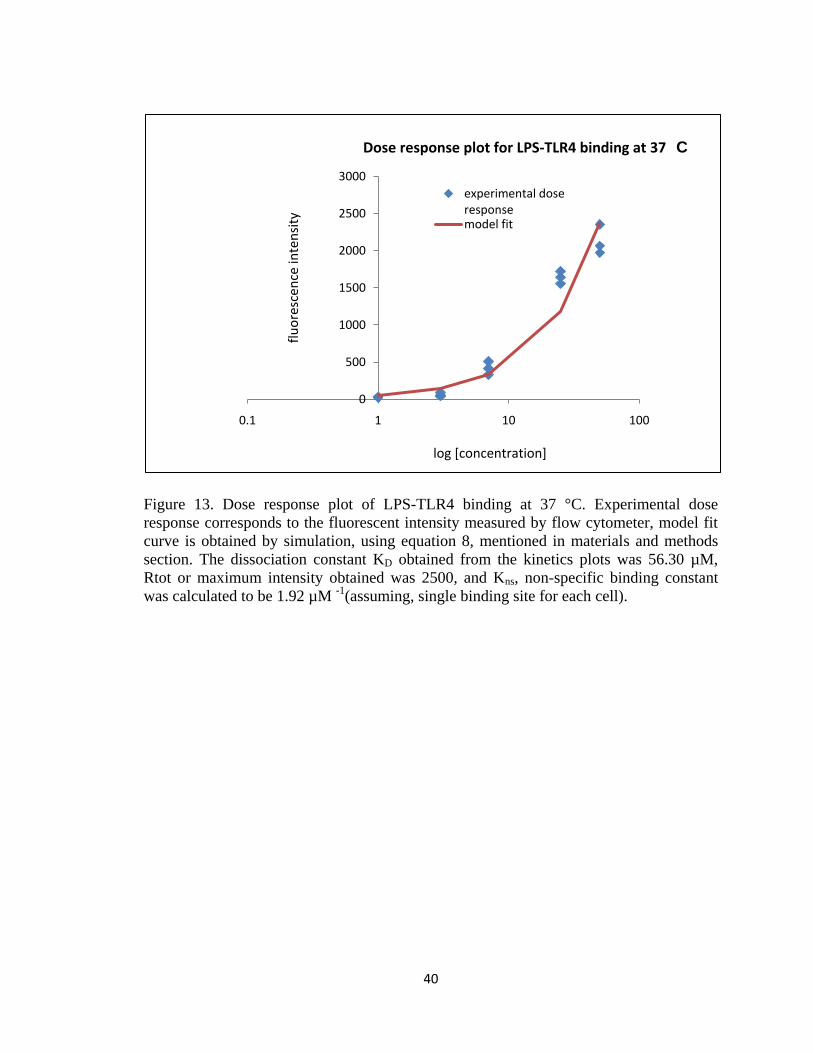
Figure 13. Dose response plot of LPS-TLR4 binding at 37 °C. Experimental dose
response corresponds to the fluorescent intensity measured by flow cytometer, model fit
curve is obtained by simulation, using equation 8, mentioned in materials and methods
section. The dissociation constant KD obtained from the kinetics plots was 56.30 µM,
Rtot or maximum intensity obtained was 2500, and Kns, non-specific binding constant
was calculated to be 1.92 µM -1
(assuming, single binding site for each cell).
0
500
1000
1500
2000
2500
3000
0.1 1 10 100
experimental dose responsemodel fit
log [concentration]
flu
ore
scen
ce in
ten
sity
Dose response plot for LPS-TLR4 binding at 37 C

41
Figure 14. Dose response plot of LPS –TLR4 binding +/- Tryplan blue at 4 °C and 37 °C.
The fluorescence intensity expressed by the cells at 4 °C was almost quenched by trypan
blue, whereas at 37 °C, it was partially quenched.
0
200
400
600
800
1000
1200
1400
1600
1800
2000
2200
2400
2600
0 5 10 15 20 25 30 35 40 45 50 55
Flu
ore
scen
ce i
nte
nsi
ty
LPS, µM
Dose response plot of LPS-TLR4 binding at 4 C and 37 C
37 deg C w/o try blue
37 deg C w try blue
4 deg C w/o try blue
4 deg C w try blue

42
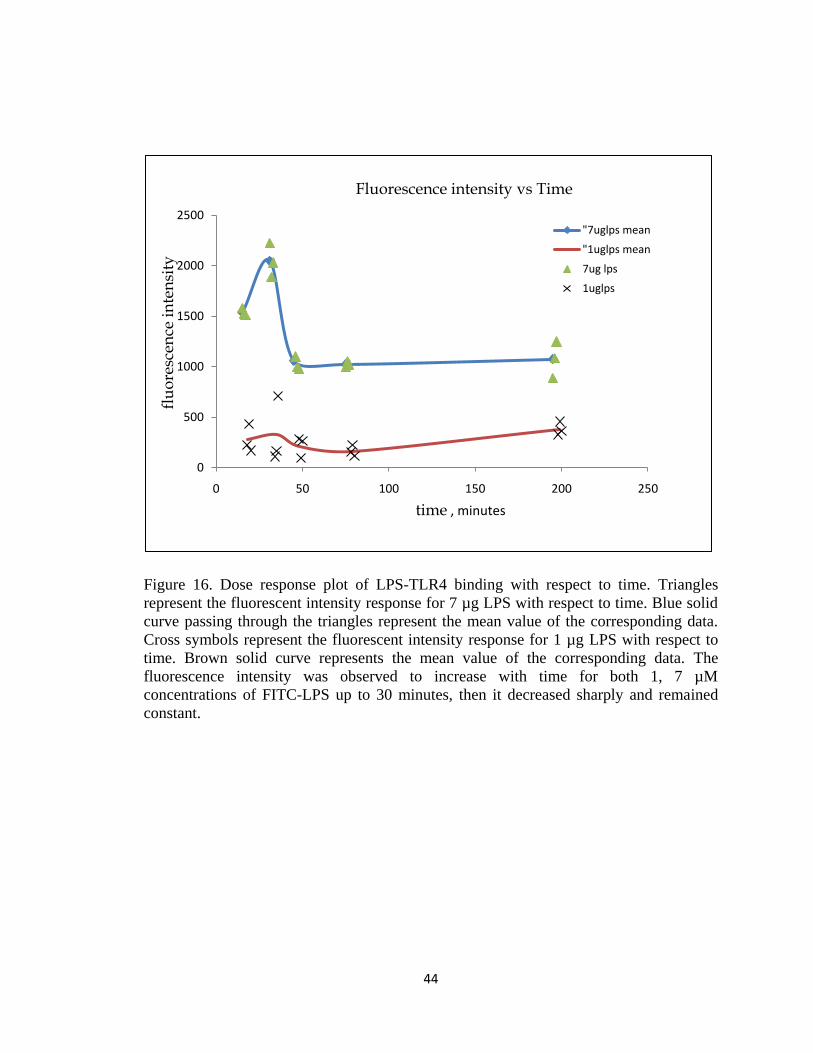
3.3.5. Study of LPS-TLR4 binding with respect to time
LPS binding with respect to time was studied to determine the equilibrium binding.
Time-course experiments were carried out at 5 different time points with 2 different
concentration 1, 7 µg/µl of LPS. Figure 13 shows the histogram of LPS-TLR4 binding at
different time points at 37 °C. Figure 14 shows the histogram of fluorescence quenching
obtained for time course experiments. Figure 15 shows the plot of the dose response of
the LPS-TLR4 binding with respect to time. From Figure 14, we can see the gradual
increase of fluorescence intensity with respect to time upto 30 minutes for all the
samples. Therefore the equilibrium binding was supposed to take place at 30 minutes.

43
Figure 15. Histogram of LPS-TLR binding with time for 1 and 7 µg LPS. In A, Density
distribution of the cells expressing fluorescence for 7 µg LPS ligand concentration is
shown. In B, Density distribution of the cells expressing fluorescence for 1 µg LPS
ligand concentration is shown. From A and B, it is clear that fluorescence intensity was
higher for higher ligand.
01
23
45
Histogram
MFI FITC-LPS
De
nsity
-100 0 200 103
104
nolps0#1.fcs7uglps0#1.fcs
7uglps15#1.fcs7uglps30#1.fcs7uglps1h#1.fcs7uglps3h#1.fcs
01
23
45
Histogram
MFI FITC-LPSD
en
sity
-100 0 200 103
104
nolps0#1.fcs1uglps0#1.fcs
1uglps15#1.fcs1uglps30#1.fcs1uglps1h#1.fcs1uglps3h#1.fcs
A B
44
Figure 16. Dose response plot of LPS-TLR4 binding with respect to time. Triangles
represent the fluorescent intensity response for 7 µg LPS with respect to time. Blue solid
curve passing through the triangles represent the mean value of the corresponding data.
Cross symbols represent the fluorescent intensity response for 1 µg LPS with respect to
time. Brown solid curve represents the mean value of the corresponding data. The
fluorescence intensity was observed to increase with time for both 1, 7 µM
concentrations of FITC-LPS up to 30 minutes, then it decreased sharply and remained
constant.
0
500
1000
1500
2000
2500
0 50 100 150 200 250
"7uglps mean
"1uglps mean
7ug lps
1uglps
Fluorescence intensity vs Time
time , minutes
flu
ore
scen
ce i
nte
nsi
ty

45
Chapter 4. Discussion
The molecular weight of LPS which was found to be close to 50 kDa using SDS-
PAGE method, was in well agreement with the range it exhibits in the presence of SDS
and heat treatment. And also, since critical aggregation concentration in culture medium
could be different due to the binding of LPS to serum components such as LBP, sCD14,
and lipoproteins we were able to determine the actual size of LPS using SDS-PAGE.
Table 5. Dissociation , nonspecific binding constant and Total Receptor concentration at
4 °C and 37 °C for LPS-TLR4 association
Constants 4°C 37 °C
KD 18 µM 56.3 µM
Rtot 1800 MFI 2500 MFI
KNS 6.5 µM-1
1.93 µM -1
* MFI – mean fluorescence intensity
The Dissociation constant, KD, non-specific binding constant and total receptor
concentration for LPS-TLR4 binding at 4 °C and 37 °C are reported in Table 5. There has
been much interest in the kinetics of receptor-ligand interactions, especially in the case of
molecules involved in immune responses. 60
For the LPS-mouse TLR4/MD-2 interaction,
the reported affinity was about 3-10 nM, this binding assay used immunoprecipitation
and was different from conventional ligand binding assay. They could not directly
compare the LPS interaction with TLR4-MD-2 or CD14 complexes because LPS was not
coprecipitated with CD14 or MD-2 due to the presence of detergents.61
The dissociation
constant for LPS-human MD-2 interaction was reported as 65 nM.62
The Dissociation
constant for LPS-TLR4 interaction, reported by Shin et al. was 20 µM at 25 °C.
Differences in assay sytems, interaction forces of molecules, may contribute to the
observed differences. With affinities differing by three orders of magnitude, it is hard to
rationalize the current model of LPS interaction with TLR4.
46
As, it is known that LPS does not interact with TLR4 alone, and it also binds to
other receptor proteins significantly, we include non-specific binding term, accounting
for the binding of LPS to its receptor proteins. Clearly, from Table 5, we can see that KD
and Rtot values are higher at 37 °C than that obtained at 4 °C, which was expected
because at 37 °C, conditions are rigorous and LPS undergoes internalization along with
its receptor. Trypan blue addition quenched the surface fluorescence obtained at both 4
°C and 37 °C, enabling us to quantify the fluorescence obtained by internalization and
surface binding.
Time course experiments show gradual increase in fluorescence exhibition, up to
30 minutes, drops and levels off. This means, equilibrium binding was attained at 30
minutes which confirms that, the data obtained for LPS-TLR4 binding at both 4 °C and
37 with 30 minutes incubation period was at equilibrium. But non-specific binding
constant was found to be higher for LPS-TLR4 binding at 4 °C than at 37 °C. As
expected, the total receptor concentration was higher at 37 °C than that of obtained at 4
°C.
To determine the quantitative differences between the subpopulations of cells, and
moreover, to give individual populations a subtle relevance, standards are necessary with
known amounts of fluorescence to which these samples can be compared. In Figure 17. a
microbead containing a fluorescent dye, fluorescein-isothio cyanate (FITC), is shown
along with the cell labeled with same dye. If a series of such microbeads containing
varying amounts of the fluorescent dye is run on a flow cytometer, the resulting
distributions will be obtained as in Figure 18 indicated by “Bead1, Bead 2 and Bead 3”.
Now if a cell population stained with same dye is also on flow cytometer under same
conditions, then the fluorescence intensity of the cells can be quantitatively compared to
those of the calibrated microbeads.

47
Figure 17. A microbead containing fluorescent labeled dye fluorescein isothiocyanate
along with the cell labeled with same dye.63
Figure 18. Fluorescent intensity distributions of the microbeads for different channels
run on flow cytometer.63

48
The linear plot of FITC molecules versus mean fluorescence intensity obtained from the
peaks obtained in the figure 18, quantitates the fluorescence to which the cell samples can
be compared.

49
4.1. Conclusion
We conclude from the series of experiments conducted at 4 °C and 37 °C that
dissociation constant for LPS-TLR4 was found to be 18µM and 56µM respectively. The
non-specific binding constants obtained were 6.5µM-1
and 1.93 µM-1
at 4 °C and 37 °C
respectively. The molecular weight of LPS was found to be 50 kDa using SDS-PAGE.
At 37 °C, measured fluorescence was more than that measured at 4 °C, because of the
internalization process. The fluorescence quenching observed at 37 °C and 4 °C using
trypan blue was incomplete and imposed questions on occurrence of pinocytosis. The
LPS-TLR4 binding with respect to time was found to increase up to certain time and
become constant. The equilibrium binding time was observed to be around 30 minutes.
4.2 Future Work
In this study, non-specific binding of LPS to TLR4 in-vitro, was not inhibited.
Inhibiton of non-specific binding of FITC-LPS to TLR4/MD-2 or CD14 can be done
using blocking agents such as antibodies against TLR4 complexes, through which
binding constants can be determined more accurately. And a model describing the
interaction of FITC-LPS to TLR4/MD-2 complexes leading to a signaling cascade that
induces the activation of transcription factors such as NF-
controls cell growth and cytokine production.
50
Chapter 5. Safety Considerations
1. Before using any chemical Material Safety Data Sheet (MSDS) is always to be
reviewed.
2. Universal lab safety rules such as not eating, drinking or smoking in the
laboratory are strictly to be followed.
3. In the laboratory open-toe shoes should not to be worn as they leave us vulnerable
if there is a spill.
4. Always lab coat must be worn while performing experiment.
5. Suitable hand gloves must be used while performing experiment, against
potentially dangerous materials.
6. Acquaintance with laboratory safety rules is necessary and should be very well
aware of the location of first aid kit, the radiation and chemical spill kit, eyewash
and safety showers.
7. Emergency phone numbers should be memorized to call upon in an emergency
situation.
51
References:
1. http://www.ncbi.nlm.nih.gov/books/bv.fcgi?rid=imm.section.2367.
2. Aderem, A. A. underhill, D. M., 1999, Mechanisms of phagocytosis in
macrophages Annu. Rev. Immnunol. 17, 593-623.
3. P.R. Taylor, L.Martinez-Pomares, M. Stacey, H-H. Lin, G.D. Brown, and
S.Gordon, Annu.Rev. Imunol. 2005, 23:901-44.
4. Janeway, C. A., Medzhitov, R., 1998. The role of innate immunity in adaptive
immune response. Semin. Immunol. 10, 349-350.
5. Rietschel,E.T. and O.Westphal. 1999. Endotoxin: Historical perspectives. In
Endotoxin in Health and Disease. H.Brade, S.M.Opal, S.N.Vogel, and
D.C.Morrison, editors. Marcel Dekker, Inc., New York. 1-30.
6. Hitchcock,P.J., L.Leive, P.H.Makela, E.T.Rietschel, W.Strittmatter, and
D.C.Morrison. 1986. Lipopolysaccharide nomenclature - past, present, and future.
J Bacteriol 166:699-705.
7. Ulevitch, R.J., Tobias, P.S., 1999. Recognition of Gram negative bacteria and
endotoxin by the innate immune system. Curr. Opin. Immunol. 11, 19-22.
8. Rietschel,E.T., L.Brade, B.Lindner, and U.Zahringer. 1992. Molecular
biochemistry of lipopolysaccharides. In Bacterial Endotoxic Lipopolysaccharides.
D.C.Morrison and J.L.Ryan, editors. CRC Press, Boca Raton,FL. 3-42.
9. Qureshi,N., K.Takayama, D.Heller, and C.Fenselau. 1983. Position of ester
groups in the lipid A backbone of lipopolysaccharides obtained from Salmonella
typhimurium. J.Biol.Chem. 258:12947-12951.
10. Raetz C.R. Whitfield C. Annu. Rev. Biochem 2002;71 :635-700.
11. Raetz C.R.H, R.J.Ulevitch, S.D.Wright, C.H.Sibley, A.Ding and C.F.Nathan,
1991. Gram–negative endotoxin: an extraordinary lipid with profound effects on
eukaryotic signal transduction. FASEB J. 5: 2652-2660.
12. Calendra T., J.D. Baumgartner, G.F.Grau, M.M.Wu, P.H.Lambert, J.Schellekens,
J.Verhoef and M.P.Glausner, 1990.Prognostic values of tumor necrosis factor
cachectin, interleukin 1, interleukin-alpha and interferon-gamma in the serum of

52
patients with septic shock Swiss-Ditch J5 immunoglobulin study group J.
Infect.Dis.161:982-987.
13. Creasey A.A, P.Stevens, J.Kenney, A.C.Allison, K.Warren, R.Catlett, L.Hinshaw,
and F.B.J.Taylor,1991. Endotoxin and cytokine profile in plasma of baboons
challenged with lethal and sublethal Escherichia Coli. Circ.Shock 33:84-91.
14. Debets J.M, R.Kampmejjer, M.P.Van der Linden, W.A.Buurman, and C.J.van der
Linden.1989.Plasma tumor necrosis factor and mortality in critically ill septic
patients. Crit.Care.Med. 17:489-494.
15. Raetz, C.R.H., 1990. Biochemistry of endotoxins. Annu. Rev. Biochem. 59, 129-
70.
16. Goyert, S.m., Ferrero, E.M., Seremetis, S.V., Winchester, R.J., Silver, J.,
Mattison, A.C., 1986. Biochemistry and expression of myelomonocytic antigens.
J.Immunol.137. 3909-3914.
17. Ferrero, E., Jiao, D., Tsuberi, B.Z., Tesio, L., Rong, G.W., haziot, A., Goyert,
S.M., 1993. Transgenic mice expressing human CD14 are hypersensitive to
lipopolysaccharide. Proc.Natl. Acad. Sci. USA 90, 2380-2384.
18. Haziot, A., Ferrero, E., lin, X.Y, Stewart, C.L., Goyert, S.m., 1995. CD14-
deficient mice are exquisitely insensitive to the effect of LPS. Prog. Clin. Biol.
Res.392, 349-351.
19. Anderson, K.V., 2000. Toll signaling pathway in innate immune responses. Curr.
Opin. Immunol. 12, 13-19.
20. Akira S, Hemmi H. Recognition of pathogen-associated molecular patterns by
TLR family. Immunol Lett 2003; 85:85-95.
21. Medzhitov R, Janeway Jr CA. Innate immunity: the virtues of a nonclonal syatem
of recognition. Cell 1997; 91:295-298.
22. Akira, S., Uematsu, S. & Takeuchi, O. Pathogen recognition and innate immunity.
Cell 124, 783-801 (2006).
23. Janeway, C.A.Jr & Medzhitov, R. Innate immune recognition. Annu. Rev.
Immunol.20, 197-216 (2002).
53
24. Hirotani, T. et al. Regulation of lipopolysaccharide-inducible genes by MyD88
and Toll/IL-1 domain containing adaptor inducing IFN- Biochem. Biophys.
Res. Commun. 328, 383-392 (2005).
25. Barton, G.M, Kagan, J.C. & Medzhitov, R. Intracellular localization of Toll-like
receptor 9 prevents recognition of self DNA but facilitates access to viral DNA.
Nat. Immunol. 7, 49-56 (2006).
26. Latz, E. et al. TLR9 signals after translocating from the ER to CpG DNA in the
lysosome. Nat. Immunol. 5, 190-198 (2004).
27. Hayashi, F. et al. The innate immune response to bacterial flagellin is mediated by
Toll-like receptor 5. Nature 410, 1099-1103 (2001).
28. Toshchakov, V. et al. TLR4, but not TLR2, mediates IFN- -induced
-dependent gene expression in macrophages. Nat. Immunol. 3, 392-
398 (2002)
29. Alexopoulou, L., Holt, A.C., Medzhitov, R. & Flavell, R.A. Recognition of
double-stranded RNA and activation of NF- -like receptor 3. Nature
413, 732-738 (2001).
30. Lund, J.m. et al. Recognition of single-stranded RNA viruses by Toll-like
receptor 7. Proc. Natl. Acad. Sci. USA 101, 5598-5603 (2004).
31. Diebold, S.S., Kaisho, T., Hemmi, H., Akira, S. & Reis e Sousa, C. Innate
antiviral responses by means of TLR7-mediated recognition of single stranded
RNA. Science 303, 1529-1531 (2004).
32. Barton, G.M. & Medzhitov, R. Toll-like receptor signaling pathways. Science
300, 1524-1525 (2003).
33. O’Neill, L.A. & Bowie, A.G. The family of five; TIR-domain-containing adaptors
in Toll-like receptor signaling. Nat. Rev. Immunol. 7, 353-364 (2007).
34. Kate A. Fitzgerald et al. Journal of Endotoxin Research, Vol. 9, No.6, 2003.
35. Kitchens RL, Wang P, Munford RS. Bacterial lipopolysaccharide can enter
monocytes via two CD14-dependent pathways. J Immunol 1998; 161:5534-5545.
54
36. Nagai Y, Akashi S, Nagafuku M et al. Essential role of MD-2 in LPS
responsiveness and TLR distribution. Nat Immunol 2002;3: 667-672.
37. Thieblemont N, Wrigt SD. Transport of bacterial lipopolysaccharide to the Golgi
apparatus. J Exp Med 1999; 190: 523-534.
38. Hornef MW, Frisan T, Vandewalle A, Normark S, Ritcher-Dahlfors A. Toll-like
receptor 4 resides in the Golgi apparatus and colocalizes with internalized
lipopolysaccharide in intestinal epithelial cells. J Exp Med 2002; 195:559-570.
39. Jann, B., et al., Heterogeneity of lipopolysaccharide chain lengths by sodium
dodecylsulfatepolyacrylamide gel electrophoresis. Eur. J. Biochem., 60, 239-246
(1975).
40. Leive, l., and Morrison, D.C., Isolation of LIpopolysaccharides from bacteria.
Methods in Enzymology, 28, 254-263 (1972).
41. Hirotaka Sasaki and Stephen H.White Biophysical Journal Volume 95 July 2008
986-993.
42. Mueller, M., B. Lindner, S. Kusumoto, K. Fukase, A.B. Schromm, and U. Seydel.
2004. Aggregates are the biologically active units of endotoxin J.
Biol.Chem.279;26307-26313.
43. Takayama, K., D.H.mitchell, Z.Z. Din, P.Mukerjee, C.Li, and D.L. Coleman,
1994. Monomeric Re lipopolysaccharide from Escherichia coli is more active
than the aggregated form in the limulus amebocyte lysate essay and in inducing
Egr-1 m-RNA in murine peritoneal macrophages. J. Biol. Chem. 269; 2241-2244.
44. Ulevitch, R.J., and P.S. Tobias. 1995. Receptor-dependent mechanisms of cell
stimulation by bacterial endotoxin. Annu. Rev. Immunol.13;437-457.
45. Miyake, K.2004. Innate recognition of lipopolysaccharide by Toll-like receptor 4-
MD-2. Trends Microbiol. 12:186-192.
46. Rivera et al., Journal of bacteriology, Feb. 1988, p. 512-521 Vol. 170, No.2.
47. A. Pichlmair and C. Reis e Sousa, Innate recognition of viruses, Immunity 27
(2007), pp. 370–383.
55
48. B. Beutler and E.T. Rietschel, Innate immune sensing and its roots: the story of
endotoxin, Nat Rev Immunol 3 (2003), pp. 169–176.
49. Ha Jae Shin, Hayyoung Lee, Jong dae Park, Hak Chul Hyun, Hyung Ok Sohn,
Dong Wook Lee, and Young Sang Kim, April 16, 2007; Mol. Cells, Vol. 24, No.
1, pp. 119-124.
50. Loike JD, Silverstein SC, J. Immunol methods, 1993 feb 25; 57(1-3)373-9.
51. Sahlin S, Hed J, Rundquist I. J. Immunol methods 1983 May 27; 60(1-2):115-24.
52. Linderman JJ. Kinetic modeling approaches to understanding ligand efficacy. In:
Kenakin T, Angus JA, Black JW, Barr AJ, editors. The pharmacology of
functional, biochemical,a nd recombinant receptor systems. Handbook of
experimental pharmacology. New York: Springer-Verlag; 2000. P 119-146.
53. Lauffenburger DA, Linderman JJ, Receptors: models for binding, trafficking, and
signaling. New York: Oxford University Press; 1993. 365 p.
54. Sklar LA, Jesaitis AJ, Painter RG, Cochrane CG. LIgand/receptor internalization:
a spectroscopic analysis and acomparison of ligand binding. Cellular response,
and internalization by human neutrophils. J Cell Biochem 1982; 20:193-202.
55. Thomas J.F. Nieland*, Marsha Penman*, Limor Dori, Montey Kreiger and
Tomas Kirchhausen, Dicovery of chemical inhibitors of the selective transfer of
lipids mediated by the HDL receptor SR-BI. PNAS,November 26,2002,
vol.99,no.24 15422-15427.
56. Sklar LA, Finney DA. Analysis of ligand-receptor interactions with the
fluorescence activated cell sorter. Cytometry 1982; 3: 161-165.
57. Hoffman JF, Keil ML, Riccobene TA, Omann GM, Lindermann JJ.
Interconverting receptor states at 4 degrees C for the neutrophil N-formyl peptide
receptor. Biochemistry 1996; 35:13047-13055.
58. Klinke, D. J. *; Brundage, K. M. ; “Scalable analysis of flow cytometry data using
R/Bioconductor”, cytometry A 75 (2009) 699-706
59. Van Amersfoot ES, Van Strijp JA. Evaluation of a flow cytometric fluorescence
quenching assay of phagocytosis of sensitized sheep erythrocytes by
56
polymorphonuclear leukocytes. Wiley Interscience March 8, 2005, Volume 12
Issue 4, pages 294-301.
60. Vales-Gomez, M., Reyburn, H. T., Mandelboim, M., and Strominger, J. L. (1998)
Kinetics of interaction of HLA-C ligands with natural killer cell inhibitory
receptors. Immmunity 9, 337-344.
61. Akashi, S., Saitoh, S., Wakabayashi, Y., Kikuchi, T., Takamura, N., et al. (2003)
Lipopolysaccharide interaction with cell surface Toll-like receptor 4-MD-2:
higher affinity than that with MD-2 or CD-14. J. Exp. Med. 198, 1035-1042.
62. Viriyakosol, S., Mathison, J. C., Tobias, P. S., and Kirkland, T. N. (2000)
Structure-function analysis of CD14 as a soluble receptor for lipopolysaccharide.
J. Biol. Chem. 275, 3144-3149.
63. Abraham Schwartz, Durham, NC, Fluorescent calibration microbeads simulating
stained cells, patent number 4,714, 682, filed April 3, 1987.
![gguo...ò ' ! LPS LBP LPS Bacteria LPS mCD 14 MONOCYTE TNF-A mCD14 ± f_f[jZggucj_p_ilhjfZdjhnZ]h\ - ©magZ_lªebihihebkZoZjb^ EIK ò ' ! LPS LBP LPS Bacteria LPS LBP LPS mCD 14 …](https://static.fdocuments.net/doc/165x107/60e7d4891f692c03dd4a8287/-lps-lbp-lps-bacteria-lps-mcd-14-monocyte-tnf-a-mcd14-ffjzggucjpilhjfzdjhnzh.jpg)