Determination of dissolved organic carbon in seawater using high temperature catalytic oxidation...
9
Determination of dissolved organic carbon in seawater using high temperature catalytic oxidation techniques Georgina Spyres* University of Plymouth, Drake Circus, Plymouth PL4 8AA, UK, and Centre for Coastal and Marine Sciences- PML, Prospect Place, West Hoe, Plymouth PL1 3DH, UK Malcolm Nimmo, Paul J. Worsfold, Eric P. Achterberg University of Plymouth, Drake Circus, Plymouth PL4 8AA, UK Axel E.J. Miller University of Highlands and Islands Project, P.O. Box 3, Oban, Argyll PA34 4AD, UK The high temperature catalytic oxidation ( HTCO )^ discrete injection method for liquid samples is cur- rently the preferred analytical technique for the determination of dissolved organic carbon (DOC) in natural water samples. This approach yields equivalent or greater amounts of DOC than wet chemical oxidation methods, is suitable for routine analyses and is stable for shipboard deter- minations. However, a limited understanding of evaluation criteria for instrument performance presents a number of analytical challenges. This article discusses current practical problems encountered in the (i) collection and handling, ( ii ) preservation, ( iii ) decarbonation and ( iv ) anal- ysis of seawater samples and reviews recent improvements in HTCO systems. Particular refer- ence is made to the issue of certi¢ed reference mate- rials and the oxidation ef¢ciency of the tech- nique. z2000 Elsevier Science B.V. All rights reserved. Keywords: Dissolved organic carbon; High temperature catalytic oxidation; Seawater; Certi¢ed reference materials 1. Introduction The dissolved organic carbon (DOC) (Table 1) pool in the oceans is equivalent to that of atmos- pheric CO 2 [ 1 ] and is measured at V10 18 g C [ 2,3 ] which quantitatively represents the most important organic reservoir in the oceans. Particulate organic carbon (POC ) is V20% or less of the DOC pool [ 4 ]. DOC is fundamental in many oceanic processes ( e.g. linked to the biogeochemical cycling of trace elements and nutrients ), although it is probably also the least known in terms of its composition and function in biological and geochemical cycles [ 5 ]. The accurate measurement of DOC and the understanding of its role in the marine carbon cycle ( Fig. 1 ) are important in regional environ- mental and global climate contexts [ 1 ]. The measurement of DOC in seawater has been a dif¢cult and often controversial procedure [ 6 ]. There has been uncertainty in the accuracy of past and current methods used [ 7 ], which has resulted in limited and questionable information on the distri- bution of DOC in the global ocean, its spatial and temporal variability, and reactivity in the marine environment [ 6 ]. Current methodologies for the determination of DOC and nitrogen in seawater samples have been well documented by Cauwet [8]. As measured by historical methods ( i.e. wet chemical oxidation (WCO ) techniques ), vertical distributions of DOC in the oceans were shown to be relatively homogeneous and it was presumed that the material was of a refractory nature. It was not until 1988 that Sugimura and Suzuki [ 9 ] pre- sented the high temperature catalytic oxidation (HTCO) method as a rapid and precise technique ( þ 1^2%) for the determination of non-volatile DOC in seawater. Their ¢ndings exhibited 1.5^5 times higher concentrations of DOC ( 180^280 WM C) and dissolved organic nitrogen ( DON ) ( 10^45 WM N ) [ 10 ] in surface oceanic waters than had been 0165-9936/00/$ ^ see front matter ß 2000 Elsevier Science B.V. All rights reserved. PII:S0165-9936(00)00022-4 *Corresponding author 498 trends in analytical chemistry, vol. 19, no. 8, 2000
-
Upload
georgina-spyres -
Category
Documents
-
view
215 -
download
1
Transcript of Determination of dissolved organic carbon in seawater using high temperature catalytic oxidation...

TRAC 2645 19-7-00
Determination of dissolved organic carbon inseawater using high temperature catalyticoxidation techniquesGeorgina Spyres*University of Plymouth, Drake Circus, Plymouth PL4 8AA, UK, and Centre for Coastal and Marine Sciences-PML, Prospect Place, West Hoe, Plymouth PL1 3DH, UK
Malcolm Nimmo, Paul J. Worsfold, Eric P. AchterbergUniversity of Plymouth, Drake Circus, Plymouth PL4 8AA, UK
Axel E.J. MillerUniversity of Highlands and Islands Project, P.O. Box 3, Oban, Argyll PA34 4AD, UK
The high temperature catalytic oxidation (HTCO)^discrete injection method for liquid samples is cur-rently the preferred analytical technique for thedetermination of dissolved organic carbon(DOC) in natural water samples. This approachyields equivalent or greater amounts of DOC thanwet chemical oxidation methods, is suitable forroutine analyses and is stable for shipboard deter-minations. However, a limited understanding ofevaluation criteria for instrument performancepresents a number of analytical challenges. Thisarticle discusses current practical problemsencountered in the ( i ) collection and handling,( ii ) preservation, ( iii ) decarbonation and ( iv) anal-ysis of seawater samples and reviews recentimprovements in HTCO systems. Particular refer-ence is made to the issue of certi¢ed reference mate-rials and the oxidation ef¢ciency of the tech-nique. z2000 Elsevier Science B.V. All rightsreserved.
Keywords: Dissolved organic carbon; High temperaturecatalytic oxidation; Seawater; Certi¢ed reference materials
1. Introduction
The dissolved organic carbon (DOC) (Table 1)pool in the oceans is equivalent to that of atmos-pheric CO2 [ 1 ] and is measured at V1018 g C [ 2,3 ]which quantitatively represents the most importantorganic reservoir in the oceans. Particulate organic
carbon (POC) isV20% or less of the DOC pool [ 4 ].DOC is fundamental in many oceanic processes(e.g. linked to the biogeochemical cycling of traceelements and nutrients ), although it is probablyalso the least known in terms of its compositionand function in biological and geochemical cycles[ 5 ]. The accurate measurement of DOC and theunderstanding of its role in the marine carboncycle (Fig. 1 ) are important in regional environ-mental and global climate contexts [ 1 ].
The measurement of DOC in seawater has been adif¢cult and often controversial procedure [ 6 ].There has been uncertainty in the accuracy of pastand current methods used [ 7 ], which has resulted inlimited and questionable information on the distri-bution of DOC in the global ocean, its spatial andtemporal variability, and reactivity in the marineenvironment [ 6 ]. Current methodologies for thedetermination of DOC and nitrogen in seawatersamples have been well documented by Cauwet[ 8 ].
As measured by historical methods ( i.e. wetchemical oxidation (WCO) techniques), verticaldistributions of DOC in the oceans were shown tobe relatively homogeneous and it was presumedthat the material was of a refractory nature. It wasnot until 1988 that Sugimura and Suzuki [ 9 ] pre-sented the high temperature catalytic oxidation(HTCO) method as a rapid and precise technique( þ 1^2%) for the determination of non-volatile DOCin seawater. Their ¢ndings exhibited 1.5^5 timeshigher concentrations of DOC (180^280 WM C)and dissolved organic nitrogen (DON) (10^45 WMN) [ 10 ] in surface oceanic waters than had been
0165-9936/00/$ ^ see front matter ß 2000 Elsevier Science B.V. All rights reserved.PII: S 0 1 6 5 - 9 9 3 6 ( 0 0 ) 0 0 0 2 2 - 4
*Corresponding author
498 trends in analytical chemistry, vol. 19, no. 8, 2000

TRAC 2645 19-7-00
previously reported by WCO methods. Large verti-cal gradients of DOC in the upper water column,and a strong inverse correlation with apparent oxy-gen utilisation (AOU) were observed. Further stud-ies using similar HTCO techniques were focused onverifying the technique's capability to oxidise pre-viously undetected oceanic DOC [ 11^14 ]. Analystsdid not always reproduce Sugimura and Suzuki's¢ndings ( i.e. higher in comparison with WCOmethods) and did not always ¢nd a strong inversecorrelation with AOU [ 15,16 ]. However, the above¢ndings instigated the re-evaluation of the relativeimportance of marine DOC in the global carboncycle.
The procedure for the determination of DOC innatural waters by HTCO is outlined by several dis-tinct stages: ( i ) sampling, ( ii ) preservation ( i.e. ¢l-tration, acidi¢cation and cold storage), ( iii ) decar-bonation ( i.e. removal of dissolved inorganiccarbon, DIC) and ( iv) analysis. The operationalclassi¢cation of DOC and other aquatic carbon spe-cies is shown in Fig. 2 [ 17 ]. The determination ofDOC involves the oxidation of organic matter in asample to CO2 through interaction with a catalyst,usually impregnated with platinum (Pt ), main-tained at high temperatures ( s 680³C). The gasproduced is subsequently measured with a CO2-speci¢c detector. Within the multiple stages of the
analytical system ( i.e. reagents, furnace, catalyst,detector ), various artefacts could compromise theanalysis and the integrity of the results. This paperdiscusses these factors at each stage of the HTCOmethodology and suggests modi¢cations to elimi-nate or minimise sources of error. Particular refer-ence is made to the issue of certi¢ed referencematerials (CRMs) and oxidation ef¢ciency of thetechnique.
2. Sample collection
Sample collection protocols should be designedto minimise changes in sample composition result-ing from contamination, sorption onto containerwalls, biological and £occulation processes [ 18 ].Due to the low background concentrations ofDOC (40^50 WM C) in marine waters [ 19 ], seawatersamples are easily contaminated via: ( i ) the atmos-phere (e.g. engine exhaust fumes), ( ii ) samplingbottles ( i.e. incomplete cleaning, leaching oforganic substances from new plastic parts ) and( iii ) careless handling ( i.e. not wearing gloves,dirty laboratory working space). Niskin and Go-Flo bottles are commonly used for sampling theseawater column; they are designed to minimisecontamination and they can pass the air /sea inter-
Fig. 1. The organic carbon cycle in the marine environment [ 4 ].
trends in analytical chemistry, vol. 19, no. 8, 2000 499

TRAC 2645 19-7-00
face closed. This avoids contamination from theorganic-rich micro-layer on the ocean surfacewhere surface-active organic materials are present.Glass and plastic containers (e.g. polysulphone,polycarbonate) that have been thoroughly cleanedand `aged' ( i.e. all leachable components removed)are used as temporary storage bottles [ 18,20,21 ].Sorption of DOC onto the container walls isreported to be negligible [ 22^24 ].
3. Sample preservation
3.1. Filtration
Filtration immediately after sample collection isrecommended since biological processes occurringwithin the sample could result in a net increase ( i.e.release from any organisms present ) or decrease ofDOC ( i.e. microbial consumption) within hours ofcollection. POC and the majority of organismspresent in the sample can be removed by ¢ltration;the pore size commonly used ranges from 0.2 to 0.7Wm. Contamination by carbon leaching from the¢lter may be signi¢cant and should be removed
by thorough cleaning. Glass ¢bre ¢lters (0.7 Wm;GFF, Whatman) are robust and are easily cleanedin a furnace by combustion at high temperatures(e.g. 450³C for s 4 h). Negligible contaminationfrom GFF ¢lters has been observed [ 14 ], althoughtheir pore size allows passage of some particles(e.g. bacteria and viruses) [ 25 ]. It is argued thatthe fraction of POC in the ¢ltrate is negligible com-pared to DOC and their contribution is lost in theprecision error of the analysis. Moran et al. [ 26 ]recently investigated DOC adsorption onto GFF ¢l-ters. Results indicated that there was adsorption ofDOC onto the ¢lter (V2^5 WM C) when used for¢ltering seawater for POC analysis. Alternative ¢l-ters with a smaller pore size (0.2 Wm) include poly-carbonate and polysulphone ¢lters. However,investigations have shown that these ¢lters can sig-ni¢cantly contaminate the sample by leaching ofcarbon from their matrix [ 11,27 ]. Cleaning ¢ltersof an organic matrix is a very time-consuming pro-cess [ 25 ]. A promising alternative is the Anopore1Al2O3 ( inorganic matrix ) ¢lter with pore sizes rang-ing from 0.02 to 0.7 Wm. Investigations have shownthat, with the use of Anopore1 ¢lters, little effect onDOC concentrations in water samples occurs [ 28 ].However, rapid clogging presents a problem when
Table 1List of terms and abbreviations used in the text
Acronym Meaning
AOU Apparent oxygen utilisationCRMs Certi¢ed reference materialsDIC Dissolved inorganic carbonDOC Dissolved organic carbonDOM Dissolved organic matterDON Dissolved organic nitrogenGFF Glass ¢bre ¢lterHTCO High temperature catalytic oxidationHTCO^DI High temperature catalytic oxidation^discrete
injectionIRGA Infrared gas analyserLCW Low-carbon waterNDIR Non-dispersive infraredNVOC Non-volatile organic carbonPOC Particulate organic carbonSTC Sealed tube combustionTDN Total dissolved nitrogenTDP Total dissolved phosphorusTIC Total inorganic carbonTOC Total organic carbonUHP Ultra high purityVOC Volatile organic carbonWCO Wet chemical oxidation
Fig. 2. An operational classi¢cation of aquatic carbon species[ 17 ].
500 trends in analytical chemistry, vol. 19, no. 8, 2000

TRAC 2645 19-7-00
¢ltering highly productive waters ( i.e. waters withhigh concentrations of phytoplanktonic organ-isms). Clogging reduces the £ow rate, may reducethe effective pore size of the ¢lter, and increases theback-pressure with time causing DOC from celllysis to leach into the ¢ltrate [ 29 ]. In oligotrophicwaters where the particle loading is minimal (6 1%of total organic carbon, TOC), the ¢ltration stepmay be omitted [ 20 ].
3.2. Acidi¢cation
When immediate analysis is not possible, preser-vation of the samples is necessary ( i.e. acidi¢cationand cold storage). Sample acidi¢cation to pH 2^3 isperformed for the removal of DIC and to arrest bio-logical processes from occurring. Mercuric chloridehad been used until it was suggested that it mightdeactivate the catalyst [ 20,30 ]. Hydrochloric acid(HCl) and orthophosphoric acid (H3PO4 ) areboth used for this purpose. However, H3PO4 is pre-ferred to HCl because the Cl3 ion, which may cor-rode the detector cell, must be removed from thecarrier gas stream through the use of halide scrub-bers [ 18 ]. High purity orthophosphoric acid is com-mercially available and does not contribute signi¢-cantly to the procedural blank [ 9,21,24,25 ]; it ispossible to acidify seawater samples with a smallervolume of H3PO4 than HCl ( i.e. H3PO4 producesthree H� ). Several possible effects of acidi¢cationinclude the production of volatile products fromhydrolysis of organic matter, precipitation of mac-romolecules and for DON, absorption of atmos-pheric ammonia and volatile organic amines [ 18 ].However, no studies on these effects have beenreported to date and therefore this aspect requiresfurther investigation.
3.3. Storage
Common methods of storage of acidi¢ed sam-ples include quick freezing to320³C, and cold stor-age at 4³C. Tupas et al. [ 24 ] found that there wereinsigni¢cant differences between freezing and coldstorage when samples are acidi¢ed. However, coldstorage without acidi¢cation is not an appropriatestorage method. Wiebinga and de Baar [ 32 ]observed that acidi¢cation (H3PO4 ) and subse-quent cold storage (5³C) up to 15 months did nothave a signi¢cant effect on the DOC concentrationof the water samples. It is recommended that air-tight glass ampoules should be used for the storage
of samples as plastic containers can leach organicsubstances and contaminate the sample over time[ 33 ].
4. Sample decarbonation
DIC concentration is at least an order of magni-tude greater than DOC concentration in seawater,and therefore it must be removed before analysis[ 21 ]. This is achieved by subsequent purging of theacidi¢ed sample with CO2-free gas (e.g. ultra highpurity (UHP) nitrogen, oxygen or helium) [ 30 ].Contamination from UHP gas is not signi¢cant[ 21 ], but purging removes organic volatiles fromthe sample. The volatile organic carbon (VOC) frac-tion lost is usually minor (6 1% of TOC), thus theerror introduced is generally insigni¢cant [ 29 ]. Thesuccess of the DIC removal largely depends on thegas £ow rate, the duration of the £ow, the pH of thesample and its volume. Some commercial TOC ana-lysers (e.g. TOC-5000) are able to measure DOCand DIC, thus presenting a practical way to deter-mine the purging speci¢cations for completeremoval of DIC from a seawater sample. A constantpurging time for all samples to be analysed is nec-essary to ensure reproducibility. Coagulation of col-loidal matter on the bubbles [ 34 ], £occulation andprecipitation processes during purging could resultin heterogeneity of the sample and therefore mix-ing of the sample prior to injection may be neces-sary [ 18 ].
5. Analysis of DOC
5.1. Principle of operation
There are two types of HTCO methods: ( i ) drycombustion and ( ii ) direct aqueous injection. Thedry combustion method involves acidi¢cation anddrying of the sample, and subsequent combustionof the residue in a sealed tube usually in the pres-ence of a catalyst; copper oxide or platinum-basedcatalysts are commonly used. Following combus-tion, the gas stream is passed through a number ofpuri¢ers and traps. After puri¢cation, the CO2 gasproduced is quanti¢ed using an infrared gas analy-ser ( IRGA). There are some major disadvantagesassociated with this technique that limit its use,including the high susceptibility to contamination[ 33 ] and the labour-intensive analytical procedure.
trends in analytical chemistry, vol. 19, no. 8, 2000 501

TRAC 2645 19-7-00
In addition, the analytical system cannot be auto-mated and is restricted to laboratory use only ( i.e.not suitable for shipboard ¢eldwork). Dry combus-tion is usually used in stable isotope analysis ofDOC, because it can analyse relatively large sam-ples, providing a suf¢ciently high analytical signal[ 29 ].
Direct injection of aqueous solution is the pre-ferred technique in the measurement of DOC inseawater samples. Such systems operate on theprinciple of HTCO of organic carbon compoundsin aqueous samples and the subsequent quanti¢ca-tion of the generated CO2 by an IRGA. An aliquot(e.g. 200 Wl typical volume) of each sample is man-ually or automatically injected onto the oxidationcolumn ¢lled with catalyst (e.g. platinum on alumi-nium oxide, cobalt oxide, copper oxide) at 600^900³C in a carbon-free, pure gas atmosphere (e.g.oxygen, nitrogen). The organic matter present inthe sample is oxidised on the catalyst to CO2. Thestream of gas products is dried using a dehumidi¢er(e.g. electronic dehumidi¢er, magnesium perchlo-rate) and puri¢ed by means of gas scrubbers (e.g.halogen scrubber) and particle ¢lters before ¢nal
determination with the IRGA. The signal (voltage)from the IRGA is recorded using a data collection /integration system; the peak area is used to calcu-late the amount of carbon present in the sample.The system is calibrated using a carbon compound(e.g. potassium hydrogen phthalate, sulphathia-zole, sodium bicarbonate, sucrose) diluted inlow-carbon water (LCW). A schematic of a typicalHTCO^discrete injection (HTCO^DI) system ispresented in Fig. 3.
5.2. Analytical problems associated with HTCO^DItechniques
Although current HTCO techniques can providehighly precise ( þ 1^2%) data (Table 2), some ana-lytical problems are encountered. Quantitatively,the most signi¢cant sources of error are: ( i )mechanical effects associated with HTCO tech-niques (e.g. sample injection, salt deposition, mem-ory effects ) [ 19,32,35 ], ( ii ) the estimation of thesystem blank ( i.e. carbon emission from the catalystand components of the analytical hardware) and( iii ) the oxidation ef¢ciency.
Fig. 3. A schematic diagram of a typical HTCO^DI system for the analysis of DOC (IC, inorganic carbon; IRGA, infrared gasanalyser ).
502 trends in analytical chemistry, vol. 19, no. 8, 2000

TRAC 2645 19-7-00
Table 2A summary of analytical ¢gures of merit for HTCO systems ( r2, regression coef¢cient of standard calibration; C.V.%, coef¢cient of variation)
Analyser Detector Catalyst type Standardmaterial, r2
Oxidation ef¢ciency(percent recovery)
DOCrange(WM C)
Precision(C.V.%)
Refer-encesa
SumigraphTOC-90
NDIR(Beckman880)
3% Pt /Al,Cuprox,Sul¢x
KHP, glucose,sodium carbonate( s 0.99)
91^96% 78^148 þ 0.2^1.3% [ 14,23 ]
Sharp (1973)clone
NDIR 1. 5% Pt on TritonKaowool /Co2O3 onAl beads
KHP (v 0.995) 91^111% 76^164 1^2% [ 45 ]
2. Pure Pt catalyst Glucose, antipyrine,sulfathiazole, urea,thiourea, glycine,methyl orange
Sealed tube /dry combus-tion (STC)
Capacitancemanometer
Dissolved chloro-platinic acid
1. Sulfathiazole 1. 82 þ 2 200^800 None quoted [ 46 ]
2. Thiourea 2. 102 þ 43. Caffeine 3. 103 þ 34. Dextrose 4. 98 þ 15. Vanilla 5. 95 þ 26. Tannic acid 6. 99 þ 4
1. Home-made
1. NDIR(Horiba)
1. 3% Pt /Al /CuO /Sul¢x
Glucose s 99%(in comparisonwith CO2 )
40^250 þ 3^5% on land [ 31]
2. Ionics555 2. NDIR 2. Pt gauze pillows þ 5^10% at sea3. ShimadzuTOC-5000
3. IRGA 3. Pt quartz wool
Dry combus-tion
Capacitancemanometer
Chloroplatinic acid 1. Thiourea 1. 94% 43^114 Typicallyþ 2^5%, up toþ 24%
[ 33 ]
2. Tannic acid 2. 98%3. Dextrose 3. 99%4. Caffeine 4. 100%KHP, glucose
1. STC 1. Capaci-tance mano-meter
1. Platinic chloride 1. None quoted 1. Reference method 40^400 þ 2% [ 47 ]
2. Home-made
2. NDIR(LicorLI6252)
2. 3% Pt on alumina /CuO /Sul¢x
2. 0.9984 2. 95% average
3. ShimadzuTOC-5000
3. IRGA 3. Pt on aluminabeads
3. 0.9994 3. 98.2^100.6%
Home-made NDIR(LicorLi6252)
Quartz beads /CuO /Sul¢x
1. Antipyrine 1. 99.99 þ 1.36 100^400 V þ 0.6% [ 35 ]
2. Caffeine 2. 102.76 þ 1.063. EDTA 3. 99.65 þ 0.594. GTD 4. 103.39 þ 0.515. Phthalate 5. 99.80 þ 1.146. Sulfathiazole 6. 100.68 þ 0.327. Thiourea 7. 103.05 þ 0.29
ShimadzuTOC-5000
NDIR(LicorLi6252)
0.5%Pt on alumina
KHP (0.9989) None quoted forDOC (V99%average for Ncompounds)
0^200 9 1.5% [ 19 ]
aThe references are presented in ascending chronological order.
trends in analytical chemistry, vol. 19, no. 8, 2000 503
TRAC 2645 19-7-00
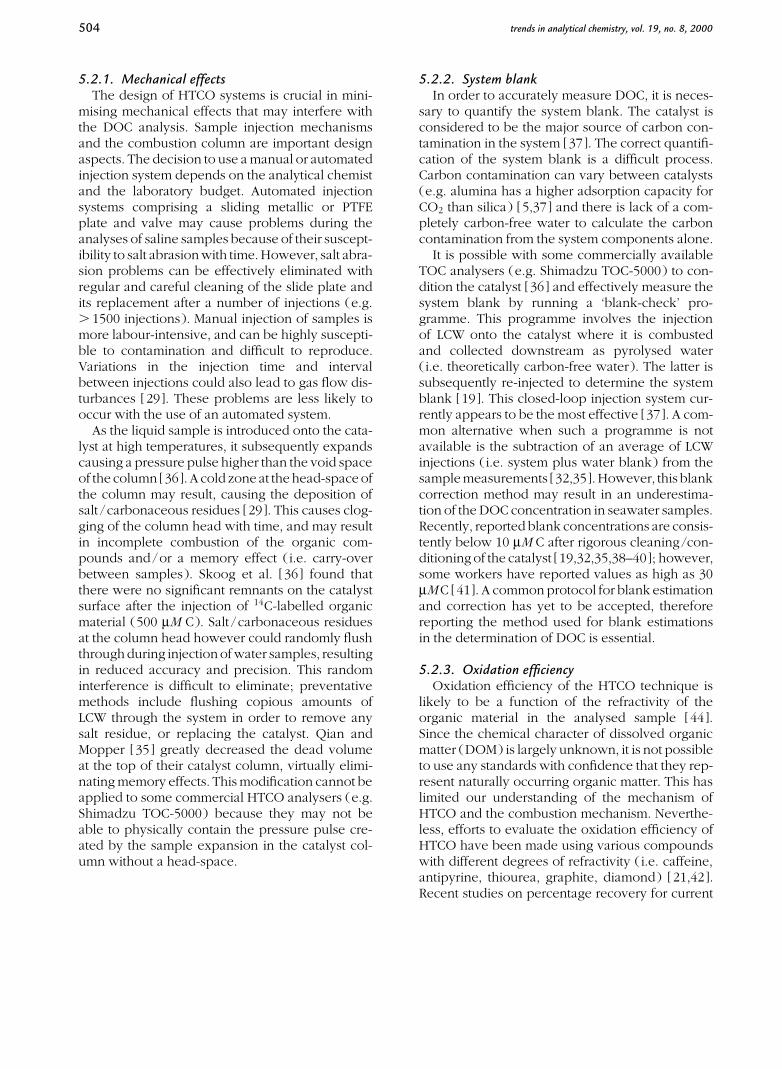
5.2.1. Mechanical effectsThe design of HTCO systems is crucial in mini-
mising mechanical effects that may interfere withthe DOC analysis. Sample injection mechanismsand the combustion column are important designaspects. The decision to use a manual or automatedinjection system depends on the analytical chemistand the laboratory budget. Automated injectionsystems comprising a sliding metallic or PTFEplate and valve may cause problems during theanalyses of saline samples because of their suscept-ibility to salt abrasion with time. However, salt abra-sion problems can be effectively eliminated withregular and careful cleaning of the slide plate andits replacement after a number of injections (e.g.s 1500 injections). Manual injection of samples ismore labour-intensive, and can be highly suscepti-ble to contamination and dif¢cult to reproduce.Variations in the injection time and intervalbetween injections could also lead to gas £ow dis-turbances [ 29 ]. These problems are less likely tooccur with the use of an automated system.
As the liquid sample is introduced onto the cata-lyst at high temperatures, it subsequently expandscausing a pressure pulse higher than the void spaceof the column [ 36 ]. A cold zone at the head-space ofthe column may result, causing the deposition ofsalt /carbonaceous residues [ 29 ]. This causes clog-ging of the column head with time, and may resultin incomplete combustion of the organic com-pounds and /or a memory effect ( i.e. carry-overbetween samples). Skoog et al. [ 36 ] found thatthere were no signi¢cant remnants on the catalystsurface after the injection of 14C-labelled organicmaterial (500 WM C). Salt /carbonaceous residuesat the column head however could randomly £ushthrough during injection of water samples, resultingin reduced accuracy and precision. This randominterference is dif¢cult to eliminate; preventativemethods include £ushing copious amounts ofLCW through the system in order to remove anysalt residue, or replacing the catalyst. Qian andMopper [ 35 ] greatly decreased the dead volumeat the top of their catalyst column, virtually elimi-nating memory effects. This modi¢cation cannot beapplied to some commercial HTCO analysers (e.g.Shimadzu TOC-5000) because they may not beable to physically contain the pressure pulse cre-ated by the sample expansion in the catalyst col-umn without a head-space.
5.2.2. System blankIn order to accurately measure DOC, it is neces-
sary to quantify the system blank. The catalyst isconsidered to be the major source of carbon con-tamination in the system [ 37 ]. The correct quanti¢-cation of the system blank is a dif¢cult process.Carbon contamination can vary between catalysts(e.g. alumina has a higher adsorption capacity forCO2 than silica ) [ 5,37 ] and there is lack of a com-pletely carbon-free water to calculate the carboncontamination from the system components alone.
It is possible with some commercially availableTOC analysers (e.g. Shimadzu TOC-5000) to con-dition the catalyst [ 36 ] and effectively measure thesystem blank by running a `blank-check' pro-gramme. This programme involves the injectionof LCW onto the catalyst where it is combustedand collected downstream as pyrolysed water( i.e. theoretically carbon-free water ). The latter issubsequently re-injected to determine the systemblank [ 19 ]. This closed-loop injection system cur-rently appears to be the most effective [ 37 ]. A com-mon alternative when such a programme is notavailable is the subtraction of an average of LCWinjections ( i.e. system plus water blank) from thesample measurements [ 32,35 ]. However, this blankcorrection method may result in an underestima-tion of the DOC concentration in seawater samples.Recently, reported blank concentrations are consis-tently below 10 WM C after rigorous cleaning /con-ditioning of the catalyst [ 19,32,35,38^40 ]; however,some workers have reported values as high as 30WM C [ 41 ]. A common protocol for blank estimationand correction has yet to be accepted, thereforereporting the method used for blank estimationsin the determination of DOC is essential.
5.2.3. Oxidation ef¢ciencyOxidation ef¢ciency of the HTCO technique is
likely to be a function of the refractivity of theorganic material in the analysed sample [ 44 ].Since the chemical character of dissolved organicmatter (DOM) is largely unknown, it is not possibleto use any standards with con¢dence that they rep-resent naturally occurring organic matter. This haslimited our understanding of the mechanism ofHTCO and the combustion mechanism. Neverthe-less, efforts to evaluate the oxidation ef¢ciency ofHTCO have been made using various compoundswith different degrees of refractivity ( i.e. caffeine,antipyrine, thiourea, graphite, diamond) [ 21,42 ].Recent studies on percentage recovery for current
504 trends in analytical chemistry, vol. 19, no. 8, 2000

TRAC 2645 19-7-00
HTCO techniques quote s 94% [ 29,33,35 ], how-ever a direct comparison between techniques isnot often possible due to the use of different cata-lysts and reference compounds. A summary of ana-lytical ¢gures of merit from recent studies on theoxidation ef¢ciency of HTCO systems is given inTable 2. Some studies have shown that completeoxidation can be achieved without a catalyst (e.g.using pure quartz beads) [ 28,35 ] and using a carriergas that does not include oxygen [ 36 ], bringing intoquestion the combustion mechanism occurring inHTCO systems. It is recommended that a set of com-pounds of different refractivity, each at varying con-centrations, should be injected to test the ability ofthe system to oxidise organic matter ef¢ciently. Theoxidation ef¢ciency should be determined on eachday of analysis until constant percent recovery pat-terns can be established for each method and /orinstrument, after which periodic assessment is suf-¢cient [ 43 ].
5.2.4. CRMsAnalyses of DOC in seawater samples by HTCO
techniques can generally display unreliability on adaily basis [ 16 ]. CRMs are essential for checking theperformance of the HTCO techniques and for thequantitative validation of the measurement but theyare not readily available. In the past 5 years, aninternational intercomparison exercise for DOCanalysis was carried out [ 16 ]. A deep ocean sampleand a deep ocean sample spiked with glucose weredistributed and subsequently analysed by 47 labo-ratories. The majority of the results were withinþ 10% of the expected value for the two samples.This international effort was a major advance indetermining accuracy but it is necessary to achievean agreement of þ 1^2% to allow rigorous compar-ison and interpretation of different environmentaldata sets [ 16 ]. An inter-laboratory study wasrecently co-ordinated by Dennis Hansell (BermudaBiological Station for Research) to produce CRMsfor the international community. A LCW and deepocean sample have been certi¢ed for DOC concen-trations by nine laboratories and are currently avail-able. With the wider distribution of reference mate-rials, it is hoped that the analyses of DOC and theenvironmental interpretation of results can be car-ried out with greater certainty.
6. Conclusions and future trends
The development of HTCO methods has resultedin the precise (C.V. 1^2%) and ef¢cient determina-tion of DOC in seawater ( i.e. DOC range from 40 tos 200 WM C). Sources of error in the measurementof DOC using HTCO techniques can occur duringsampling, handling and storage of the seawatersample and from the analytical system. It is essentialthat the apparatus used for sample handling shouldbe tested for deleterious effects on DOC concentra-tion of the sample collected and long term storagetrials should be performed to ensure the stability ofthe preserved sample. Any interference resultingfrom mechanical artefacts of the analytical systemshould be identi¢ed and eliminated. The wider dis-tribution of currently available CRMs will enableanalytical chemists to further test and validatetheir analytical method. Reporting improvements /modi¢cations in HTCO techniques and performingintercalibration exercises are crucial in order to pro-duce a commonly accepted protocol. This willimprove the comparison of DOC measurementson an analytical and environmental scale. HTCOtechniques are also used for measuring total dis-solved nitrogen (TDN) in seawater in order toinvestigate the speciation of N and to obtain abudget for the total DOM. Tangential £ow ultra¢l-tration for size distribution of DOM, nuclear mag-netic resonance spectroscopy, and elemental ratioscan be used in combination with HTCO to deter-mine an overview of the major compositionalchanges of DOM in the marine environment.HTCO methods in combination with other techni-ques should enable the accurate determination ofDOM £uxes on a regional and global scale. Owingto the dynamic nature of the development of theprotocols in HTCO techniques, the authors havecreated a website discussion forum (http: / /www.pml.ac.uk /gs /htco.asp) to enable the inter-national community to contribute towards a greaterunderstanding of HTCO methods for the determi-nation of DOM in seawater.
Acknowledgements
Georgina Spyres would like to acknowledge theUniversity of Plymouth and the Centre for Coastaland Marine Sciences - Plymouth Marine Laboratoryfor the studentship. Work undertaken was part of
trends in analytical chemistry, vol. 19, no. 8, 2000 505

TRAC 2645 19-7-00
the OMEX II Phase II (EU MAST III Programme)Contract No. MAS3-CT97-0076.
References
[ 1 ] J.I. Hedges, J. Farrington, Mar. Chem. 41 (1993) 5.[ 2 ] P.J. le B. Williams, Mar. Chem. 41 (1993) 11.[ 3 ] M. McCarthy, J. Hedges, R. Benner, Mar. Chem. 55
(1996) 281.[ 4 ] R. Chester, Marine Geochemistry, Blackwell, Oxford,
1990, p. 311.[ 5 ] G. Cauwet, Mar. Chem. 47 (1994) 55.[ 6 ] C.S. Hopkinson, B. Fry, A.L. Nolin, Cont. Shelf Res. 17
(1997) 473.[ 7 ] D.A. Hansell, Mar. Chem. 41 (1993) 195.[ 8 ] G. Cauwet, Methods of Seawater Analysis, 3rd edn.,
1999, p. 407.[ 9 ] Y. Sugimura, Y. Suzuki, Mar. Chem. 24 (1988) 105.
[ 10 ] Y. Suzuki, Y. Sugimura, T. Itoh, Mar. Chem. 16 (1985)83.
[ 11 ] P.E. Kepkay, M.L. Wells, Mar. Ecol. Prog. Ser. 80 (1992)275.
[ 12 ] J.H. Martin, S.E. Fitzwater, Nature 356 (1992) 699.[ 13 ] H. Ogawa, N. Ogura, Nature 356 (1992) 696.[ 14 ] E. Tanoue, Earth Planet. Sci. Lett. 111 (1992) 201.[ 15 ] J.H. Sharp, Y. Suzuki, W.L. Munday, Mar. Chem. 41
(1993) 252.[ 16 ] J.H. Sharp, Mar. Chem. 56 (1997) 265.[ 17 ] K. Robards, I.D. McKelvie, R.L. Benson, P.J. Worsfold,
N.J. Blundell, H. Casey, Anal. Chim. Acta 287 (1994)147.
[ 18 ] J.H. Sharp, Mar. Chem. 41 (1993) 37.[ 19 ] X.A. Alvarez-Salgado, A.E.J. Miller, Mar. Chem. 62
(1998) 325.[ 20 ] P.J. Wangersky, Mar. Chem. 41 (1993) 61.[ 21 ] A.E.J. Miller, Thesis, University of Liverpool, 1996.[ 22 ] J.I. Hedges, B.A. Bergamaschi, R. Benner, Mar. Chem.
41 (1993) 121.[ 23 ] E. Tanoue, Mar. Chem. 41 (1993) 261.[ 24 ] L.M. Tupas, B.N. Popp, D.M. Karl, Mar. Chem. 45
(1994) 207.
[ 25 ] B. Norman, Mar. Chem. 41 (1993) 239.[ 26 ] S.B. Moran, M.A. Charette, S.M. Pike, C.A. Wicklund,
Mar. Chem. 67 (1999) 33.[ 27 ] D.A. Hansell, N.R. Bates, K. Gundersen, Mar. Chem. 51
(1995) 201.[ 28 ] P.M. Williams, J.E. Bauer, K.J. Robertson, D.M. Wolgast,
M.L. Occelli, Mar. Chem. 41 (1993) 271.[ 29 ] K. Mopper and J. Qian, in: R.A. Meyers (Ed. ), Encyclo-
pedia of Environmental Analysis and Remediation,John Wiley and Sons, Inc., 1998.
[ 30 ] J.E. Bauer, M.L. Occelli, P.M. Williams, Mar. Chem. 41(1993) 75.
[ 31 ] E.T. Peltzer, P.G. Brewer, Mar. Chem. 41 (1993) 243.[ 32 ] C.J. Wiebinga, H.J.W. De Baar, Mar. Chem. 61 (1998)
185.[ 33 ] B. Fry, E.T. Peltzer, C.S. Hopkinson, A. Nolin, L. Red-
mond, Mar. Chem. 54 (1996) 191.[ 34 ] P.E. Kepkay, B.D. Johnson, Nature 338 (1989) 63.[ 35 ] J. Qian, K. Mopper, Anal. Chem. 68 (1996) 3090.[ 36 ] A. Skoog, D. Thomas, R. Lara, K.-U. Richter, Mar. Chem.
56 (1997) 39.[ 37 ] R. Benner, M. Strom, Mar. Chem. 41 (1993) 153.[ 38 ] M.D. Doval, X.A. Alvarez-Salgado, F.F. Perez, Mar. Ecol.
Prog. Ser. 157 (1997) 21.[ 39 ] M. Dai, K.O. Buesseler, P. Ripple, J. Andrews, R.A. Bela-
stock, O. Gustaffson, S.B. Moran, Mar. Chem. 62 (1998)117.
[ 40 ] X.A. Alvarez-Salgado, M.D. Doval, F.F. Perez, J. Mar.Syst. 18 (1999) 383.
[ 41 ] P.A. Wheeler, J.M. Watkins, R.L. Hansing, Deep-SeaRes. II 44 (1997) 1571.
[ 42 ] D.J. Verardo, P.N. Froelich, A. McIntyre, Deep Sea Res.37 (1990) 157.
[ 43 ] C.S. Hopkinson, L. Cifuentes, D. Burdige, S. Fitzwater,D. Hansell, S. Henrichs, P. Kahler, I. Koike, T. Walsh, B.Bergamaschi, Mar. Chem. 41 (1993) 23.
[ 44 ] M.J. Alperin, C.S. Martens, Mar. Chem. 41 (1993) 135.[ 45 ] W. Chen, P.J. Wangersky, Mar. Chem. 42 (1993) 95.[ 46 ] B. Fry, S. Saupe, M. Huller, B.J. Peterson, Mar. Chem. 41
(1993) 187.[ 47 ] E.T. Peltzer, B. Fry, P.H. Doering, J.H. McKenna, B.
Norrman, U.L. Zweifel, Mar. Chem. 54 (1996) 85.
506 trends in analytical chemistry, vol. 19, no. 8, 2000