
Determination of copper via ammine complex formation...
33
1 First week Experiment No.1 …/…/2013 Spectrophotometry 1. Determination of copper via ammine complex formation using standard series method Principal In the standard series method the teat and standard solution are placed in two similar test tubes. The colour intensity of the unknown solution is compared with the colours of a series of standard solution. Since the concentration of the standard solution is known, that the test solution can be compared. The pale blue colour of copper sulphate solution is of intensity insufficient for colorimetric determination. On adding ammonia, The intensely azure coloured complex is formed + + → [( ) ] + Procedure 1- Into five clean test tube, transfer 0.5, 1, 2, 3 and 5 ml of standard copper solution. 2- To each tube, add 5 ml of 2 N ammonia solution. 3- Complete to 10 ml with distilled water (using a graduated pipette) 4- Repeat the above procedure using 1 ml of your unknown copper solution 5- Select the standard solution which is matched in colour with your unknown solution and determine the unknown concentration of cu using the formula under calculation
-
Upload
nguyenhanh -
Category
Documents
-
view
227 -
download
2
Transcript of Determination of copper via ammine complex formation...

1
First week Experiment No.1 …/…/2013
Spectrophotometry
1. Determination of copper via ammine complex formation
using standard series method
Principal
In the standard series method the teat and standard solution are placed in two
similar test tubes. The colour intensity of the unknown solution is compared
with the colours of a series of standard solution. Since the concentration of
the standard solution is known, that the test solution can be compared.
The pale blue colour of copper sulphate solution is of intensity insufficient for
colorimetric determination. On adding ammonia, The intensely azure
coloured complex is formed
𝑪𝒖𝟐+ + 𝟒 𝑵𝑯𝟑 → 𝑪𝒖 [(𝑵𝑯𝟑)𝟒]𝟐+
Procedure
1- Into five clean test tube, transfer 0.5, 1, 2, 3 and 5 ml of standard
copper solution.
2- To each tube, add 5 ml of 2 N ammonia solution.
3- Complete to 10 ml with distilled water (using a graduated pipette)
4- Repeat the above procedure using 1 ml of your unknown copper
solution
5- Select the standard solution which is matched in colour with your
unknown solution and determine the unknown concentration of cu
using the formula under calculation

2
Calculation:
Concentration of Cu2+ in unknown solution can be calculated from the
formula:
𝑪𝒖 𝒖𝒏𝒌𝒏 = 𝑪𝒖 𝑺𝒕𝒂𝒏𝒅
𝑽𝒔𝒕𝒂𝒏𝒅
𝑽𝒖𝒏𝒌𝒏
Cunkn , Cstand are the concentration of the test and standard solutions.
Vunkn Vstand and are the volumes of the test and standard solutions.
Results
………………………………………………………………………………
………………………………………………………………………………
………………………………………………………………………………
………………………………………………………………………………
………………………………………………………………………

3
Quiz No 1
1- Define the following:
Frequency, v
……………………………………………………………………………….
velocity, c
……………………………………………………………………………….
wave-length, l
……………………………………………………………………………….
wave number, v
……………………………………………………………………………….
Absorption
……………………………………………………………………………….
Emission :
……………………………………………………………………………….
Beer’s Law
……………………………………………………………………………….
2- Write on the type of electronic transitions:
……………………………………………………………………………….
……………………………………………………………………………….
……………………………………………………………………………….
……………………………………………………………………………….
…………………………………………………………………………

4
Second week Experiment No.2 …/…/2013
2. Absorption spectrum and calibration curve of potassium
permanganate
Principle:
Transition elements of the lanthanide group contain partially filled “d"
orbitals. Manganese is one of the transition elements. Electronic transition
between the "d" orbitals are possible leading to highly coloured solutions and
high intensity of absorption. Potassium permanganate has two absorption
maxima at wavelength range 500-600 nm.
Solutions:
a- Stock 1 0.005 M potassium permanganate solution.
b- Unknown; potassium permanganate solution (s).
A- Determination of absorption spectrum of potassium permanganate
solution in water at the wavelength range of 500-600 nm:
Procedure:
1. Pipet 50.0 ml of the provided stock solution into 250- ml standard
flask then dilute with distilled water to the mark. This stock solution
contains (0.005x 50)/250 = 0.00l M solution.
2. Pipet 20.0 ml of stock l in 100- ml standard flask, dilute to l00 ml
with distilled water and mix well.
3. Fill the sample cell with the solution prepared in 2, then scan the
spectrum in the indicated wavelength range and notice the two Xmax.
4. Calculate εmax for the two λmax using Beer’s- lambert’s law formula:
A = εbC
Where,
C = concentration in moles/L.
ε = molar absorptivity
b = path length (1 cm)
A = absorbance.
5
B- Verification of Beer’s-lambert’s law (Standard curve):
Procedure:
1. Pipet 5.0, 10.0, 15.0, 20.0 mls in five (100-ml) flasks, dilute to the mark
with distilled water and mix well.
2. Select one of the two λmax, and then use it for obtaining the absorbance
(A) of the solutions against water as a blank.
3. Plot the standard curve (concentration vs Absorbance) on a sheet of
graph paper label the axes (X and Y).
C- Determination of the concentration of the provided unknown
potassium permanganate solution.
Procedure:
1. Dilute the unknown solution provided to the mark with distilled
water.
2. Measure the absorbance of the diluted unknown at the same Xmax
used for the standard curve.

6
3. Find out the concentration of the unknown in moles/L. from the
standard curve.
Calculation
The molecular weight of potassium permanganate = 158
λmax 1 λmax 2 εmax 1 εmax 2 amax 1 amax 2
Where a is the absorptivity
𝐸1 𝑐𝑚1% (𝜆max 1 ) =
𝐸1 𝑐𝑚1% (𝜆max 2 ) =
Unknown concentration= moles/L
Results
………………………………………………………………………………
………………………………………………………………………………
………………………………………………………………………………
………………………………………………………………………………
………………………………………………………………………
7
Quiz No 2:
Define the following
Chromophore:
………………………………………………………………………
Auxchrome:
………………………………………………………………………
Bathochromic shift (red shift):
………………………………………………………………………
Hypsochromic shift (blue shift):
………………………………………………………………………
Hyperchromic effect:
………………………………………………………………………
Hypochromic effect:
………………………………………………………………………

8
Third week Experiment No.3 …/…/2013
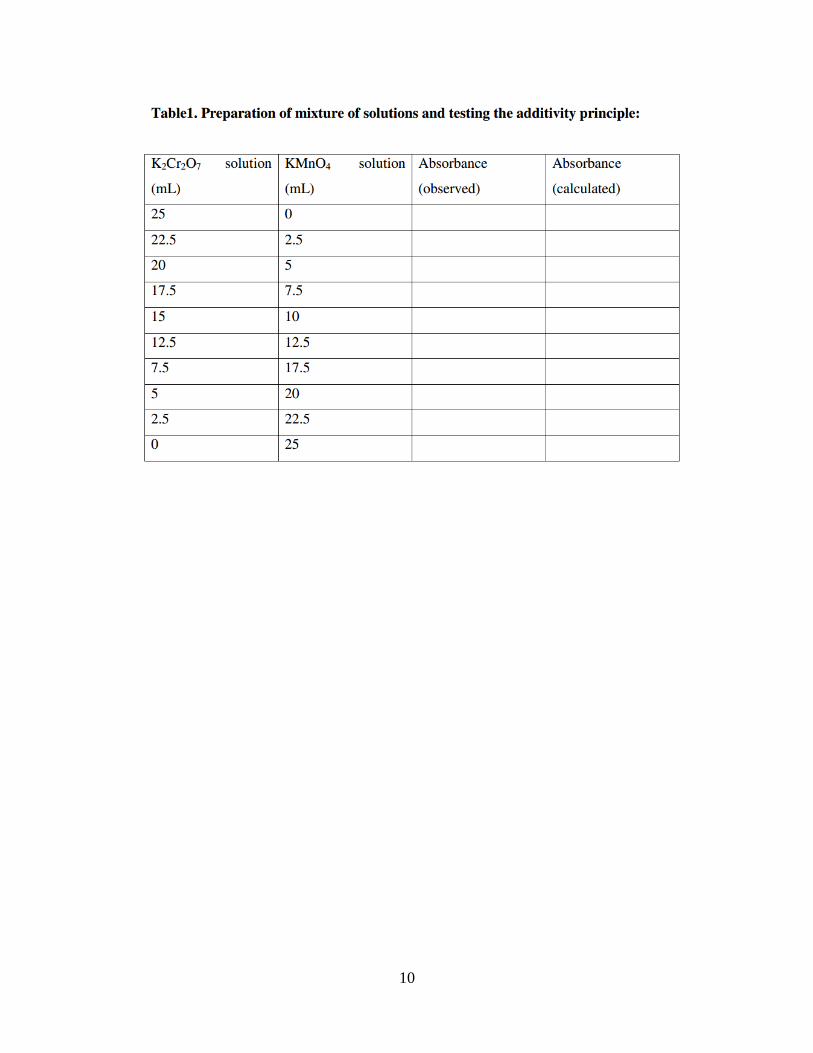
Determination of the composition of a binary mixture (potassium
dichromate and potassium permanganate), spectrophotometrically.
Purpose
The objective of this experiment is to gain hands-on experience with the UV-
VIS instrument.
Theory:
This experiment is concerned with the simultaneous spectrophotometric
determination of two solutes in a solution. The absorbances are additive,
provided there is no reaction between the two solutes. Hence we may write
Αλ1 = λ1A1 + λ1A2 (1) and Αλ2 = λ2A1 + λ2A2 (2)
Where A1 and A2 are the measured absorbance’s at the two wavelengths λ1
and λ2 respectively. The subscripts 1and 2 refer to the two different
substances, and the subscripts λ1 and λ2 refer to the different wavelengths. The
wavelengths are selected to coincide with the absorption maxima of the two
solutes; the absorption spectra of the two solutes should not overlap
appreciably, so that substance 1 absorbs strongly at wavelength λ1 and weakly
at wavelength λ2, and substance 2 absorbs strongly at λ2 and weakly at λ1.
Now, A= ε c l, where ε is the molar absorption coefficient at any particular
wavelength, c is the concentration (mol L-1) and l is the thickness, or length,
of the absorbing solution (cm). If we set l = 1 cm then
Αλ1 = λ1ε1c1 + λ1ε2c2 (3) and Aλ2= λ2ε1c1 + λ2ε2c2 (4)
Solutions of the these simultaneous equations gives
C1 = (λ2 ε2Α λ1 − λ1ε2 Αλ2) / (λ1ε1 λ2ε2 − λ1ε2 λ2ε1) (5)
C2 = (λ1 1Αλ2 − λ2 ε1Α λ1) / ( λ1ε1 λ2 ε2 − λ1ε2 λ2ε1) (6)
The values of molar absorption coefficients ε1 and ε2 can be deduced from
measurements of the absorbances of pure solutions of substances 1and 2. By
measuring absorbance of the mixture at wavelengths λ1 & λ2, the
concentrations of the two components can be calculated.

9
Requirements:
1. 0.001 M, 0.0005 M and 0.00025 M solutions of potassium dichromate
(in 1 M sulphuric acid and 0.7 M phosphoric acid)
2. 0.001 M, 0.0005 M and 0.00025M solutions of potassium
permanganate (in 1 M sulphuric acid and 0.7 M phosphoric acid)
Procedure:
1. Prepare a series of solutions: Potassium dichromate 0.001 M, 0.0005 M
and 0.00025 M in mixed solvent of sulphuric acid (1 M) and phosphoric
acid (0.7 M).
2. Prepare a series of solutions: Potassium permanganate 0.001M, 0.0005
M and 0.00025 M in sulphuric acid (1M) and phosphoric acid (0.7 M).
3. Measure the absorbance A for each of the three solutions of potassium
dichromate and also each of the three solutions of potassium
permanganate at both 440 nm and 545 nm by taking 1ml solution each.
Calculate ε in each case by A= ε.C.l and record the mean values for
dichromate (2) and permanganate (1) at the two wavelengths.
4. Mix potassium dichromate (0.001 M) and potassium permanganate
(0.0005 M) in the following amounts shown in Table1 in 100 ml
beakers. In each case, total volume of solution should be 25 ml. To each
of these solutions add 0.5 ml of concentrated sulphuric 3acid, (a set of
typical results included in Table I for guidance). Measure the
absorbance of each of the mixtures at 440 nm. Calculate the absorbance
of the mixtures from
A440 = 440 εCr c Cr+ 440 εΜn c Mn
A545 = 545 ε Crc Cr+ 545 εΜn c Mn
5. Record the absorbance of the unknown solution (supplied) at 545nm
and 440 nm. Calculate the concentrations of permanganate and
dichromate in this solution.
10
11
Quiz No 3
Write on the following
1. Monochronators:
………………………………………………………………………………
………………………………………………………………………………
………………………………………………………………………………
………………………………………………………………………………
………………………………………………………………………
………………………………………………………………………………
………………………………………………………………………………
………………………………………………………………………………
………………………………………………………………………………
………………………………………………………………………
2. Draw the main components of the Single beam spectrophotometer
………………………………………………………………………………
………………………………………………………………………………
………………………………………………………………………………
………………………………………………………………………………
………………………………………………………………………

12
Fourth week Experiment No.4 …/…/2013.
Effect of pH on absorption curve of sulphanilamide
Principle:
In alkaline solution the primary amino group is retained as auxochrome. In
acid solution quaternisation occur to a co-ordinatively auxochrome.
(Hypsochromic shift and hypochromic effect resulting from the removal of
the non-bonded electrons of the –NH2 auxochrome from the conjugated
system)
Solutions:
0.0l g % w/v aqueous solution of sulphanilamide.
1 N hydrochloric acid.
1 N sodium hydroxide.
Procedure:
1. Pipet l0.0 ml of sulphanilamide solution into l00- ml standard flask,
dilute to the mark with lN hydrochloric acid solution and mix.
Determine the absorbance of this solution in l cm cells at l0 nm
interval from 210-300 nm, using 1 N hydrochloric acid as the blank
(use 5 nm interval around λmax)·
2. Repeat step (1) but using 1N sodium hydroxide instead of 1N
hydrochloric acid,
3. Plot the absorption curves of the acid and alkaline solutions on the
same graph paper.
4. Determine λmax and calculate 𝐸1 𝑐𝑚1% for each solution.

13

14
Quiz No 4
1. Write on the following
Effect of pH on absorption spectrum of phenol and aniline
Phenol:
………………………………………………………………………………
………………………………………………………………………………
………………………………………………………………………………
………………………………………………………………………………
………………………………………………………………………
………………………………………………………………………………
………………………………………………………………………………
………………………………………………………………………………
………………………………………………………………………………
………………………………………………………………………
Aniline
………………………………………………………………………………
………………………………………………………………………………
………………………………………………………………………………
………………………………………………………………………………
………………………………………………………………………
………………………………………………………………………………
………………………………………………………………………………
………………………………………………………………………………
………………………………………………………………………………
………………………………………………………………………

15
Fifth week Experiment No.5 …/…/2013.
5. Effect of pH on absorption curve of thymol blue
Principle:
Thymol blue is an acid—base indicator, it has phenolic hydroxyl group in its
structure. In alkaline solution it changes into phenolate anion and the
interaction of the negative charge on the oxygen atom with the ring leads to
different resonating structures. As a result, a bathochromic shift and a
hyperchromic effect occur and the colour changes from red (acid medium)
into blue (alkaline medium).
Solutions:
0.02 g % w/v thymol aqueous solution. .
1 N hydrochloric acid.
1 N sodium hydroxide.
Procedure:
1. Pipet 10.0 ml of thymol blue solution into 25- ml standard flask.
Dilute to the mark with 1 N hydrochloric acid solution and mix.
Determine the absorbance of this solution in l cm cell at l0 nm interval
from 450-650 nm using 1 N hydrochloric acid as a blank (use 5 nm
interval around the λmax)
2. Repeat step l using 1N sodium hydroxide instead of l N hydrochloric
acid.
3. Plot the absorption curves of the acid and alkaline solutions on the
same graph paper.
4. Determine λmax and calculate 𝐸1 𝑐𝑚1% for each solution.

16

17
Quiz 5
Write on the following
General requirements of the coloured product
1. ……………………………………………………………………………
…
2. ……………………………………………………………………………
…
3. ……………………………………………………………………………
…
4. ……………………………………………………………………………
…
5. ………………………………………………………………………
Photocell
………………………………………………………………………………
………………………………………………………………………………
………………………………………………………………………………
………………………………………………………………………………
………………………………………………………………………
………………………………………………………………………………
………………………………………………………………………………
………………………………………………………………………………
………………………………………………………………………………
………………………………………………………………………

18
Sixth week Experiment No.6 …/…/2013
6. Determination of the Molar Ratio of Iron-Thiocyanate Complex.
Principle:
At 500 nm, neither ferric ions in nitric acid solution nor the thiocyanate ions
absorb strongly. When the two solutions are combined together, they react to
form a blood red complex that has a high absorptivity value at 500 nm.
m Fe3+ + n SCN- → [Fem (SCN)n](3m-n)
Solutions:
Equimolar solutions of ferric ammonium sulphate solution (A) and
ammonium thiocyanate solution (B), 3xl0-3 M, are prepared.
Procedure:
1. Prepare a series of solutions by mixing the following indicated
amounts of solution A and B: l ml solution A + 9 ml solution B ..........
to 9 ml solution A + l ml solution B
2. Measure the absorbances at 500 nm against blanks prepared similarly.
3. Plot the absorbances versus the corresponding mole fractions of Fe3+.
4. The resultant plot is round shaped curve. When the straight line portions
of the curve are extrapolated, the point on the abscissa corresponding
to their intersection represents the molar ratio of the complex.

19

20
Quiz 6
General requirement of an ideal chromogen:
………………………………………………………………………………
………………………………………………………………………………
………………………………………………………………………………
………………………………………………………………………………
………………………………………………………………………
………………………………………………………………………………
………………………………………………………………………………
………………………………………………………………………………
………………………………………………………………………………
………………………………………………………………………
Photomultiplier
………………………………………………………………………………
………………………………………………………………………………
………………………………………………………………………………
………………………………………………………………………………
………………………………………………………………………
………………………………………………………………………………
………………………………………………………………………………
………………………………………………………………………………
………………………………………………………………………………
………………………………………………………………………

21
Seventh Week Experiment No.7 …/…/2013.
7. Determination of pKa of Methyl Orange.
Principle:
Many acid-base indicators are Tweak acids and can be represented simply as
HIn ↔ Hi+ + ln-
Acidic form (red) basic form (yellow)
In case of methyl orange both forms have strong absorption peaks in the
visible region. The pKa value of an indicator is given from the equation:
𝒑𝑯 = 𝑷𝑲𝒂 + 𝒍𝒐𝒈[𝑰𝒏−]
[𝑯𝑰𝒏]
The absorption spectrum of an indicator dye shows some variation with pH
changes. A number of curves showing absorption spectra could be plotted as
we vary the pH. The point of intersection of all these curves is known as the
isosbestic point.
At high pH values [ln-] > [HIn] and basic form predominates. While at low
pH values [HIn] > [In-] and acid form predominates. So, in order to determine
pKa value of an indicator we select a wavelength at which either the acidic or
basic form absorbs most strongly. In the case of methyl orange, at 510 nm
thentrizlic formHln predominates. Then we vary the pH and observe the value
of absorbance of each solution as a function of pH.
At the midpoint of` the curve, we register the pH and that is equal to the pKa
value of the indicator. At this point [HIn] = [ln-] and pH = pKa.
Solutions:
Methyl orange aqueous solution : 0.001 g/L
Buffer solutions: pH 2-8
1 N Hydrochloric acid solution.
1 N Sodium hydroxide solution.
22
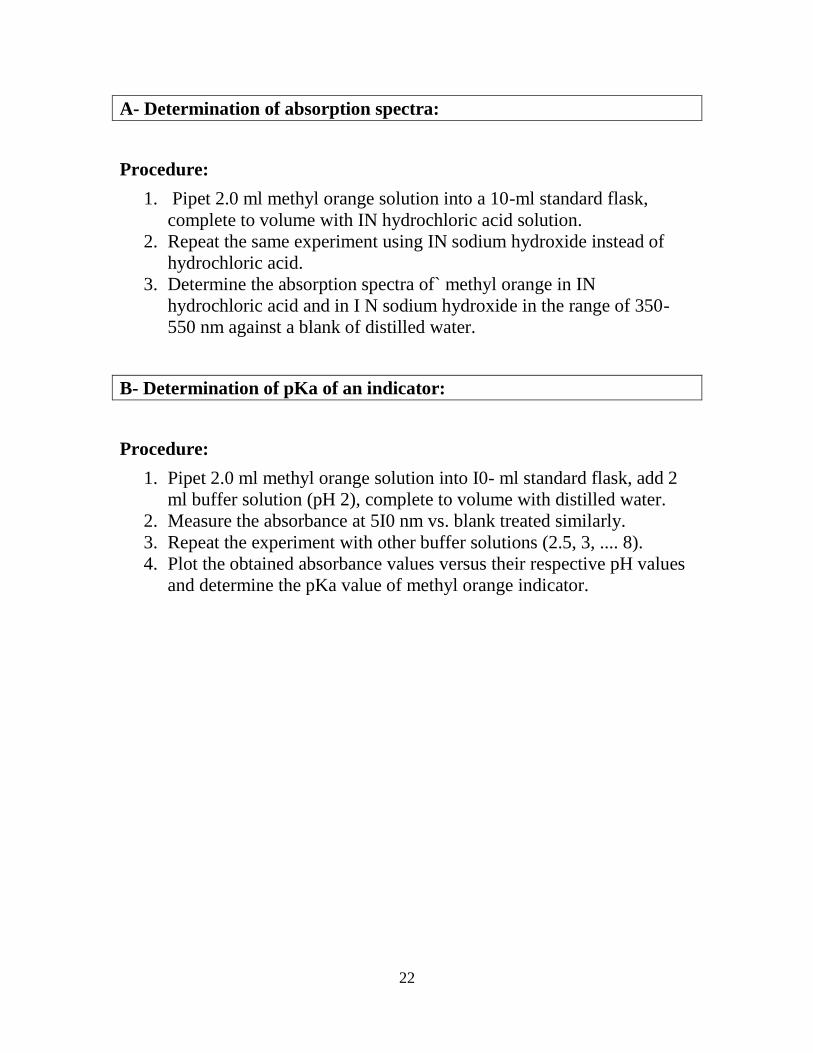
A- Determination of absorption spectra:
Procedure:
1. Pipet 2.0 ml methyl orange solution into a 10-ml standard flask,
complete to volume with IN hydrochloric acid solution.
2. Repeat the same experiment using IN sodium hydroxide instead of
hydrochloric acid.
3. Determine the absorption spectra of` methyl orange in IN
hydrochloric acid and in I N sodium hydroxide in the range of 350-
550 nm against a blank of distilled water.
B- Determination of pKa of an indicator:
Procedure:
1. Pipet 2.0 ml methyl orange solution into I0- ml standard flask, add 2
ml buffer solution (pH 2), complete to volume with distilled water.
2. Measure the absorbance at 5I0 nm vs. blank treated similarly.
3. Repeat the experiment with other buffer solutions (2.5, 3, .... 8).
4. Plot the obtained absorbance values versus their respective pH values
and determine the pKa value of methyl orange indicator.

23

24
Quiz 7
Write on the following
The measurement of complexation (ligand/metal ratio in a complex):
………………………………………………………………………………
………………………………………………………………………………
………………………………………………………………………………
………………………………………………………………………………
………………………………………………………………………
………………………………………………………………………………
………………………………………………………………………………
………………………………………………………………………………
………………………………………………………………………………
………………………………………………………………………
Deviation from Beer’s law
………………………………………………………………………………
………………………………………………………………………………
………………………………………………………………………………
………………………………………………………………………………
………………………………………………………………………
………………………………………………………………………………
………………………………………………………………………………
………………………………………………………………………………
………………………………………………………………………………
………………………………………………………………………

25
Eighth week Experiment No. 8 …/…/2013.
Conductometry
8. Couductomctric Titration of Strong Acid with Strong Base
Principle:
H+ + Cl- + Na+ + OH- H2O + Na+ + Cl-
When sodium hydroxide is added to hydrochloric acid, the highly conducting
hydrogen ions initially present in the solution are replaced by sodium ions
having a much lower conductance. The addition of the alkali to the solution
will thus be accomplished by a decrease in conductance. When neutralization
is complete the further addition of alkali results in an increase of conductance.
At the neutral point the conductance of the solution will have a minimum
value, from which the equivalence point of the reaction can be estimated.
Procedure:
1. Pipet 10.0 ml of hydrochloric acid into 250 – ml beaker and dilute
with distilled water to l00 ml (a dip cell is supported in the solution
and connected to a conductometer).
2. Add from a burette 0.1 ml of 0.01 M sodium hydroxide into the
solution, mix, and after 2 or 3 minutes determine its conductance.
3. Add another 0.1 ml portion of 0.01 M sodium hydroxide and
determine the conductance again
4. Continue the addition of sodium hydroxide solution until the
conductance increases considerably with each addition ..
5. Plot the titration curve (The conductance is plotted as ordinate and the
volume of sodium hydroxide as abscissa) .
6. Determine the equivalence point graphically.(The two straight
portions of the curve are extrapolated until they intersect. The point of
intersection is taken as the equivalence point)
26
7. Calculate the concentration of hydrochloric acid.

27
Quiz 8
Write on the following
The conductance of the solution depends on:
………………………………………………………………………………
………………………………………………………………………………
………………………………………………………………………………
………………………………………………………………………………
………………………………………………………………………
………………………………………………………………………………
………………………………………………………………………………
Conductivity Bridge:
………………………………………………………………………………
………………………………………………………………………………
………………………………………………………………………………
………………………………………………………………………………
………………………………………………………………………
………………………………………………………………………………
………………………………………………………………………………
28
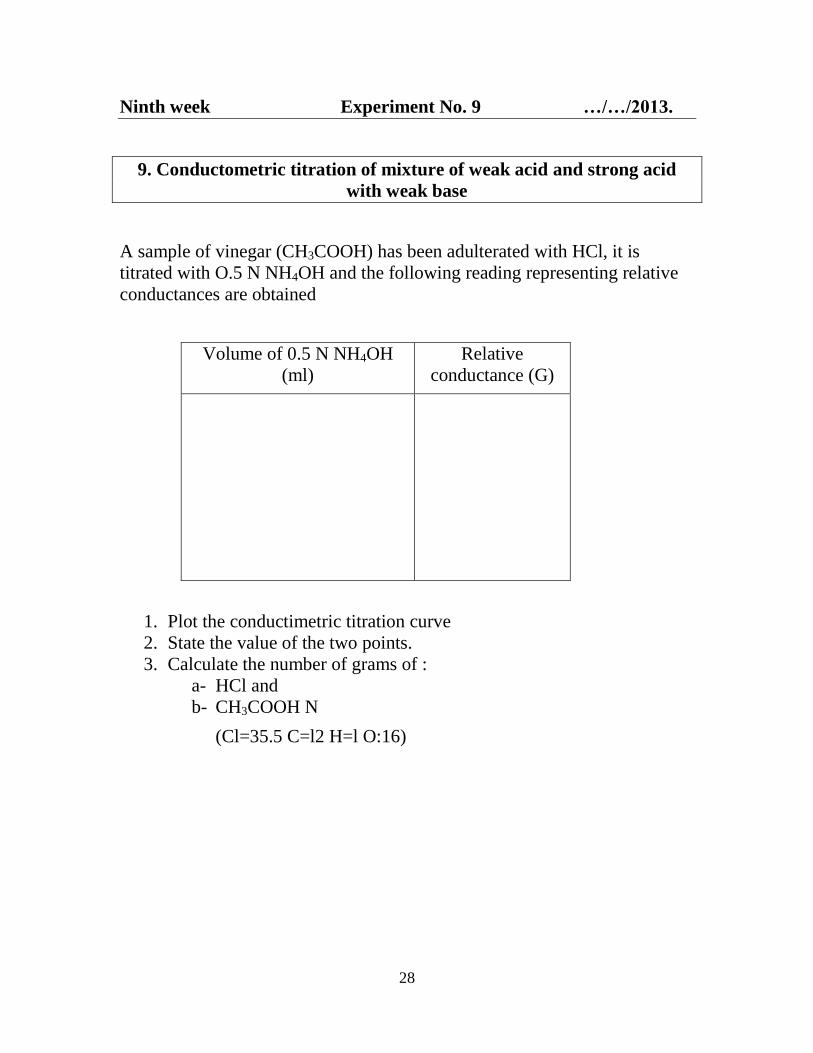
Ninth week Experiment No. 9 …/…/2013.
9. Conductometric titration of mixture of weak acid and strong acid
with weak base
A sample of vinegar (CH3COOH) has been adulterated with HCl, it is
titrated with O.5 N NH4OH and the following reading representing relative
conductances are obtained
Volume of 0.5 N NH4OH
(ml)
Relative
conductance (G)
1. Plot the conductimetric titration curve
2. State the value of the two points.
3. Calculate the number of grams of :
a- HCl and
b- CH3COOH N
(Cl=35.5 C=l2 H=l O:16)

29
30
Quiz 9
• Write on the following
Determination of mixture of hydrochloric acid (strong acid) and
acetic acid (weak acid) with sodium hydroxide (strong base)
………………………………………………………………………………
………………………………………………………………………………
………………………………………………………………………………
………………………………………………………………………………
………………………………………………………………………
………………………………………………………………………………
………………………………………………………………………………
………………………………………………………………………………
………………………………………………………………………………
………………………………………………………………………………
………………………………………………………………………………
………………………………………………………………………
………………………………………………………………………………
………………………………………………………………………………

31
Tenth week Experiment No. 10 …/…/2013.
Potentiometery
10. Potentiometric Titration of Weak Acid with Strong Base
Principle:
In this experiment the titration of acetic acid is followed by (measuring the
mv of the solution after each addition of NaOH (titrant).
From the data the end point is determined.
Apparatus:
• Potentiometer (commercial pH/m.v meter).
• pH electrode (glass and reference electrode, SCE or Ag/AgCl ) or
Combination pH electrode.
• Magnetic stirrer or glass rod.
• Beaker 300 ml (tall form )
• Burette.
• Pipet
Procedure.
1. Fit the apparatus with the electrode assembly (or Combination
electrode) supplied with pH meter supported inside the beaker. The
beaker contains 50 ml of 0.l acetic acid.
2. Fill the burette with 0.2 N NaOH.
3. Add 2-3 ml of 0.2N NaOH from the burette, stir for about 30 seconds
and after waiting for 30 seconds measure the e.m.f of the cell (mv).
Record also reading of alkali in the burette.
4. Repeat the addition of the same portion of the NaOH solution, stirring
and measuring the mv after each addition until a point is reached within
about l ml of the expected end point. Henceforth add the alkali solution
in portion of 0.2 ml; and record the potentiometric reading (mv) after

32
each addition. Continue the addition until the equivalent point has been
passed by 0.5-1.0.
5. Plot potential against volumes of reagent added (0.2N NaOH). Draw a
curve through the points. The equivalence point is the volume
corresponding to the steep portion of the curve.
V2 (ml) E (mV) ∆E ∆V1 ∆E/∆V V2 for 1st
derive. plot
33
Quiz 10
Write on the following
Glass membrane electrode
………………………………………………………………………………
………………………………………………………………………………
………………………………………………………………………………
………………………………………………………………………………
………………………………………………………………………
………………………………………………………………………………
………………………………………………………………………………
Calomel electrode
………………………………………………………………………………
………………………………………………………………………………
………………………………………………………………………………
………………………………………………………………………………
………………………………………………………………………
………………………………………………………………………………
………………………………………………………………………………


![Rapid determination of copper in copper ores - [email protected]](https://static.fdocuments.net/doc/165x107/620632ce8c2f7b1730055639/rapid-determination-of-copper-in-copper-ores-emailprotected.jpg)


