Determination of Blood pH and Blood Gases - Clinical Chemistry
8
CLINICALCHEMISTRY, Vol. 20, No. 12, 1974 1499 CLIN. cHEM. 20/12, 1499-1506 (1974) Calculations and Correction Factors Used in Determination of Blood pH and Blood Gases Robert W. Burnett and Daniel C. Noonan1 Measurement of blood pH, P02 and Pco2 also involves calculation of two or more derived quantities and cor- rection of the measured values in cases where the body temperature of the patient differs from the temperature of measurement. References to the pertinent calcula- tions and the temperature corrections are scattered through the literature of several medical specialties, and much new information has been gathered in recent years that directly affects these calculations. This re- view explains each of the derived quantities and correc- tion factors most used in this field and also provides the best available data for the calculations, in a form that can readily be adapted to electronic data processing. Addftlonal Keyphrases: Po2 #{149} Pco2 #{149} CO2 content #{149} plasma bicarbonate concentration #{149} base excess #{149} oxy- hemoglobin dissociation curve #{149} 02 saturation #{149} 02 content #{149} temperature corrections Blood pH and gas analysis usually involve the di- rect measurement of blood pH, pco2, and po2. In diagnosing, managing, and monitoring the patient, the physician frequently finds it useful to have other data that can be derived from these values-such as oxygen saturation, base excess, and carbon dioxide content. Moreover, if the patient’s temperature is ab- normal, the observed values should be mathematical- ly adjusted to take this factor into account. Much of the early work in making these basic mea- surements and deriving clinically useful results from them has come from specialty laboratories associated with such disciplines as cardiology, anesthesiology, and respiratory disease. As these measurements have proven to be of immense value in patient care, the central clinical laboratory has been increasingly called upon to provide these measured and derived results. Clinical Chemistry Laboratory, Hartford Hospital, Hartford, Conn. 06115. I Present address: Port Huron Hospital, Port Huron, Mich. 48060. Received Aug. 6, 1974; accepted Sept. 17, 1974. Descriptions of the basis for the calculations in- volved in blood-gas analysis and the values for the correction factors are scattered through the medical literature. The primary references are found in the literature of physiology, clinical pathology, surgery, anesthesiology, and respiratory disease. In this review, we gather together all the relevant mathematical relations the clinical chemist is likely to need in providing comprehensive blood-gas ser- vice. Each of the calculations or corrections used in this area of clinical chemistry will be discussed, and the best available data for constants and correctiOn factors will be presented. This is not intended to be a complete review of the literature in this field, but rather a summary of current usage. Having all the pertinent equations in one place simplifies the task of providing more meaningful results; it also facilitates adaptation to computer processing, if desired. Corn- puter processing will undoubtedly become more pop- ular in the future, either in the form of dedicated minicomputers in the blood-gas laboratory or by hay- ing blood-gas analyzers on-line to a larger laboratory information system. Calculations in Which the Henderson- Hasselbaich Equation Is Used Bicarbonate concentration and CO2 content can be calculated from a measured pH and p co2 by use of the Henderson-Hasselbalch equation. This equation may be written in several different forms, however, and one must be certain of the definition of the con- stant or constants involved as well as have accurate values for these constants before attempting to use the equation. The equilibrium between CO2 in a gas phase and HC03 in solution may be written C02(gas) + H20 H + HC03 and we may write an expression for the heterogene- ous equilibrium constant, K,
Transcript of Determination of Blood pH and Blood Gases - Clinical Chemistry
CLINICALCHEMISTRY, Vol. 20, No. 12, 1974 1499
CLIN. cHEM. 20/12, 1499-1506 (1974)
Calculations and Correction Factors Used inDetermination of Blood pH and Blood Gases
Robert W. Burnett and Daniel C. Noonan1
Measurement of blood pH, P02 and Pco2 also involvescalculation of two or more derived quantities and cor-rection of the measured values in cases where the bodytemperature of the patient differs from the temperatureof measurement. References to the pertinent calcula-tions and the temperature corrections are scatteredthrough the literature of several medical specialties, andmuch new information has been gathered in recentyears that directly affects these calculations. This re-view explains each of the derived quantities and correc-tion factors most used in this field and also provides thebest available data for the calculations, in a form thatcan readily be adapted to electronic data processing.
Addftlonal Keyphrases: Po2 #{149}Pco2 #{149}CO2 content #{149}
plasma bicarbonate concentration #{149}base excess #{149}oxy-hemoglobin dissociation curve #{149}02 saturation #{149}02content #{149}temperature corrections
Blood pH and gas analysis usually involve the di-
rect measurement of blood pH, pco2, and po2. Indiagnosing, managing, and monitoring the patient,the physician frequently finds it useful to have otherdata that can be derived from these values-such asoxygen saturation, base excess, and carbon dioxidecontent. Moreover, if the patient’s temperature is ab-normal, the observed values should be mathematical-ly adjusted to take this factor into account.
Much of the early work in making these basic mea-surements and deriving clinically useful results fromthem has come from specialty laboratories associatedwith such disciplines as cardiology, anesthesiology,and respiratory disease. As these measurements haveproven to be of immense value in patient care, thecentral clinical laboratory has been increasingly
called upon to provide these measured and derivedresults.
Clinical Chemistry Laboratory, Hartford Hospital, Hartford,Conn. 06115.
I Present address: Port Huron Hospital, Port Huron, Mich.
48060.Received Aug. 6, 1974; accepted Sept. 17, 1974.
Descriptions of the basis for the calculations in-volved in blood-gas analysis and the values for thecorrection factors are scattered through the medicalliterature. The primary references are found in theliterature of physiology, clinical pathology, surgery,anesthesiology, and respiratory disease.
In this review, we gather together all the relevant
mathematical relations the clinical chemist is likelyto need in providing comprehensive blood-gas ser-vice. Each of the calculations or corrections used inthis area of clinical chemistry will be discussed, andthe best available data for constants and correctiOnfactors will be presented. This is not intended to be acomplete review of the literature in this field, butrather a summary of current usage. Having all thepertinent equations in one place simplifies the task ofproviding more meaningful results; it also facilitates
adaptation to computer processing, if desired. Corn-puter processing will undoubtedly become more pop-ular in the future, either in the form of dedicatedminicomputers in the blood-gas laboratory or by hay-ing blood-gas analyzers on-line to a larger laboratoryinformation system.
Calculations in Which the Henderson-Hasselbaich Equation Is Used
Bicarbonate concentration and CO2 content can becalculated from a measured pH and p co2 by use ofthe Henderson-Hasselbalch equation. This equationmay be written in several different forms, however,
and one must be certain of the definition of the con-stant or constants involved as well as have accuratevalues for these constants before attempting to usethe equation.
The equilibrium between CO2 in a gas phase andHC03 in solution may be written
C02(gas) + H20 H + HC03
and we may write an expression for the heterogene-ous equilibrium constant, K,
1500 CLINICALCHEMISTRY,Vol. 20, No. 12, 1974
a+a - 1’ -2? if HCO3 HCO tir,,- -Is = 3 . aH+ #{163}1#{188}J3
aaoaco2 au2oyco2 Pco2
Kig, a thermodynamic constant, is independent of so-lution composition; a symbolizes activity and ‘y syrn-bolizes activity coefficient. We may also define apractical equilibrium constant K’lg that includes theactivity coefficients, and is thus dependent on solu-tion composition.
Kjg’ = K1g22 aH+[HCOpVHCO3- Pco2
This equation may be rewritten as
pK1g’ = pH - log[HC03J + log P2
pK’ig in whole blood at pH 7.40 and at 37 #{176}Ccan be
derived from the recent experimental data of Maas(1 ) and is equal to 7.604 when bicarbonate concen-tration is expressed in mmollliter and p co2 in mmHg(1 mmHg 133 Pa). The corresponding value inplasma is 0.01 lower because of a systematic differ-ence in measured pH between plasma and whole
blood (2). Maas also determined the dependency ofPK’lg Ofl temperature, pH, and ionic strength. The re-spective coefficients are
pK1g’/T = . 007
APK15’/PH = -0. 04
pK15’/I = -0.39
In practice, these effects are small and may be ig-nored unless very high accuracy is required, for ex-
ample, if tonometered bicarbonate solutions were tobe used as standards.
One must be careful to avoid confusing pK’ig as de-fined above, with pK’11, which is also commonly used.The latter constant is defined in terms of the concen-
tration of CO2 dissolved in solution, rather than p co2in the gas phase,
pK1’ = pH - log[HC03] + lO[CO2IdiSld (2)
Quite commonly “[H2CO3J” is written instead of“[CO2]dissolved,” although this is not actually correct.
Equation 2 may be rewritten
pK11 = pH - log[HCO3j + log Pco, + log S
where S is the solubility coefficient of C02, in milli-moles/liter per mmHg, and is equal to 0.0307 forserum at 37 #{176}C(3 ). The relationship between the twoconstants is
pK11’ = P’Z1g’ + log S (3)
and the value for pK’11 at 37 #{176}Cand pH 7.40 is 6.09.Although pK’ reportedly varies among individuals,
particularly in the presence of various diseases (4),more recent work not only does not confirm this (5,
6) but has shown that pK’ is essentially constantover a wide range of serum protein and electrolyteconcentrations and in several different disease states.
In practice, calculations involving the Henderson-Hasselbaich equation are usually done with the aid ofa nomogram or of a slide-rule type of calculator.These may give answers that differ slightly fromthose calculated by using the above values, because adifferent estimate of pK’ may have been used or be-cause the 0.01 difference between blood and plasma
(1 ) may not have been included.Equation 1 allows the convenient calculation of
plasma bicarbonate from a measured pH and p co2. Arelated value that is also commonly used is CO2 con-tent, or total C02, which is defined as the sum
[CO2Ijj,o1ved + [H2co3] + [Hco3] + [co3] +
(1) (.004) (20) (.03)
[protein carbamates]
(.17)
This is a useful quantity only because it is amenable
to a simple direct measurement that is performed innearly every clinical chemistry laboratory. The num-
bers in parentheses are the relative amounts of eachspecies in plasma at pH 7.4 (7, 8). It is seen that CO2
content is numerically quite close to [HCO3] andthat the only other species that needs to be consid-ered at all is [CO2]d9801j. The working equation forcalculating CO2 content is thus
CO2 content = [HC03] + [c02]dissolved
Base Excess
[Hco3-] + .0307p02 (4)
Base excess is at present an ambiguous term, be-cause it has been defined in at least two differentways during the past 20 years. The differences aredue to the fact that base excess may be defined inrelation to various fluid compartments in the body,including plasma, whole blood, interstitial fluid, orsome combination of these.
The primary justification for introducing a quanti-ty such as base excess is to obtain an index of meta-bolic acid-base imbalance. Theoretically, in cases ofprimary, uncompensated respiratory imbalances the
base excess will be zero. Conversely, a metabolic aci-dosis or alkalosis, whether primary or secondary to arespiratory imbalance, should produce either a posi-tive (metabolic alkalosis) or negative (metabolic aci-
dosis) base excess.
L40
30-i
-i
0
20
10
70 7.1 7.2 7.3 7,Ll 7,5 7.6 7,7 7,8
CLINICAL CHEMISTRY. Vol. 20, No. 12, 1974 1501
The concept of base excess is based on the fact
that, for a given fluid, a change in p co2 will produce achange in pH (and bicarbonate concentration), whichis determined by the buffer capacity, fi, of the fluid.The buffer capacity is expressed in mEq/liter per pH
unit, and may be thought of as the change in bicar-bonate concentration that would result from a change
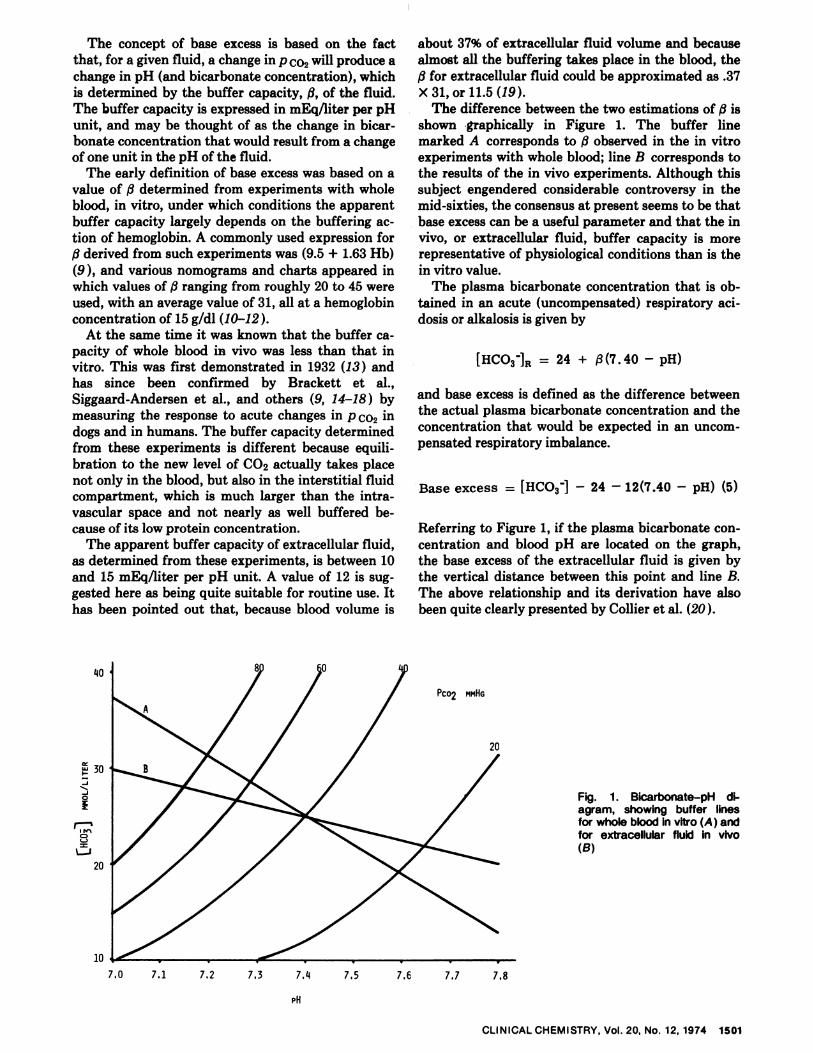
of one unit in the pH of the fluid.The early definition of base excess was based on a
value of determined from experiments with wholeblood, in vitro, under which conditions the apparentbuffer capacity largely depends on the buffering ac-tion of hemoglobin. A commonly used expression forf3 derived from such experiments was (9.5 + 1.63 Hb)
(9 ), and various nomograms and charts appeared inwhich values of f3 ranging from roughly 20 to 45 were
used, with an average value of 31, all at a hemoglobinconcentration of 15 g/dl (10-12).
At the same time it was known that the buffer ca-pacity of whole blood in vivo was less than that invitro. This was first demonstrated in 1932 (13 ) andhas since been confirmed by Brackett et al.,Siggaard-Andersen et al., and others (9, 14-18) bymeasuring the response to acute changes in p co2 in
dogs and in humans. The buffer capacity determinedfrom these experiments is different because equili-bration to the new level of CO2 actually takes placenot only in the blood, but also in the interstitial fluidcompartment, which is much larger than the intra-vascular space and not nearly as well buffered be-cause of its low protein concentration.
The apparent buffer capacity of extracellular fluid,as determined from these experiments, is between 10and 15 mEq/liter per pH unit. A value of 12 is sug-gested here as being quite suitable for routine use. Ithas been pointed out that, because blood volume is
about 37% of extracellular fluid volume and becausealmost all the buffering takes place in the blood, the
fi for extracellular fluid could be approximated as .37x 31, or 11.5 (19).
The difference between the two estimations of /3 isshown graphically in Figure 1. The buffer linemarked A corresponds to observed in the in vitroexperiments with whole blood; line B corresponds tothe results of the in vivo experiments. Although thissubject engendered considerable controversy in themid-sixties, the consensus at present seems to be thatbase excess can be a useful parameter and that the invivo, or extracellular fluid, buffer capacity is morerepresentative of physiological conditions than is thein vitro value.
The plasma bicarbonate concentration that is ob-
tamed in an acute (uncompensated) respiratory aci-
dosis or alkalosis is given by
[HCO3jR 24 + j3(7.40 - pH)
and base excess is defined as the difference between
the actual plasma bicarbonate concentration and theconcentration that would be expected in an uncom-pensated respiratory imbalance.
Base excess = [HCO3j - 24 - 12(7.40 - pH) (5)
Referring to Figure 1, if the plasma bicarbonate con-centration and blood pH are located on the graph,the base excess of the extracellular fluid is given bythe vertical distance between this point and line B.The above relationship and its derivation have alsobeen quite clearly presented by Collier et al. (20).
Fig. 1. Bicarbonate-pH di-agram, showing buffer linesfor whole blood in vitro (A ) andfor extracellular fluid in vivo(B)

1502 CLINICALCHEMISTRY, Vol. 20, No. 12, 1974
The following approximations are implicit in the
above definition of base excess:1. A constant value of fi ignores the fact that it de-
pends somewhat on the hemoglobin concentration,which is assumed to be normal. If the actual hemo-globin concentration is severely subnormal, f3 will
also be slightly lower, although this is said to be oflittle clinical significance (21).
2. The quoted value for fi assumes a normal ratiobetween blood volume and interstitial fluid volume.In situations where interstitial fluid volume is rela-
tively high-e.g., neonatal or edematous patients-9
will be decreased because more fluid is available todilute the bicarbonate generated by hypercapnia(18).
It is also important to recognize that nomograms orinstruments for calculating base excess by use of theearlier definition, including the widely used align-ment nomogram of Siggaard-Andersen, may also beused to calculate extracellular fluid base excess. Sev-
eral authors have pointed out that use of an “effec-tive” hemoglobin concentration in extracellular fluidof about 5 g/dl in conjunction with these nomogramsgives a measure of extracellular fluid base excess (15,
19, 22 ). These values agree quite well with those cal-culated from equation 5 and the most recent acid-base chart published by Siggaard-Andersen (21 ) alsogives base excess values that agree closely with thosecalculated from equation 5.
Oxygen Saturation
The percent saturation of hemoglobin with oxygenis a function of p 02 and follows the familiar sigmoidal
curve. In addition, it is well-known that the percentsaturation at a given p 02 is a function of pH (Bohr-Haldane effect). The Bohr-Haldane coefficient corn-monly used (23 ) is
(A.logpo2\ - -0 48‘S nH Jconstant
5- I saturation
Several nomograms are available for calculating oxy-gen saturation from a measured p 02 and pH. Thesehave been constructed from a standardized oxyhemo-globin dissociation curve together with equation 6.Alternatively, a calculator program could be devisedin which values for the standard oxyhemoglobin dis-sociation curve are used, such as those given by Sev-eringhaus (23 ), or with use of an equation that hasbeen empirically fitted to the observed curve. Onesuch equation that works quite well is2
02 saturation =
100(((p - 67.0’7)p + 2121)p - 8532)p (7)
(((p - 67.07)p + 2396)p - 3350)p + 936000
2 Collier, C. R., personal communication.
where p is the corrected p 02, obtained by rearrang-
ing equation 6
p = 10t1ogp02+O.48(pH-7.4)]
Equation 7 is similar in form to the version of theAdair equation given recently by Roughton and Sev-eringhaus (24). Although the latter equation givesbetter agreement with experimental data below 30%saturation, equation 7 gives better agreement from30% to 100% saturation.
The oxyhemoglobin dissociation curve is usuallyrepresented as a plot of percent saturation [(oxyhem-
oglobin/total hemoglobin) X 100] vs. oxygen tension,as shown in Figure 2. If curve A represents the disso-ciation curve under a standardized set of conditions(pH = 7.40, T = 37 #{176}C,etc.), then curve B is said tobe “shifted to the right” and represents a decreasedaffinity of hemoglobin for oxygen. In such a situation,assuming normal physiologic oxygen tensions, moreoxygen can be delivered from capillaries to tissuecells for metabolic utilization. A shift to the right oc-curs as a result of a decrease in pH, as expressed by
equations 6 and 8.The situation is complicated considerably by the
fact that several other factors also influence oxyhem-oglobin dissociation (25 ). It is known that the curveis shifted to the right by an increase in temperature,an increase in Pco2 at constant pH, and by an in-crease in erythrocyte 2,3-diphosphoglycerate concen-tration, and is shifted to the left by increased concen-trations of carbon monoxide in the blood. There isalso evidence that there are compensatory mecha-nisms involving one or more of these factors formaintenance of a normal dissociation curve; for ex-ample, it has been shown that in chronic acidosis andalkalosis the blood diphosphoglycerate concentration
I \ altered in a direction to compensate for the shift6, produced by the Bohr-Haldane effect and to main-
thin a normal dissociation curve (26 ). Nevertheless, it
is clear that there are several assumptions involved in
using a calculated oxygen saturation as describedabove, because it considers only the effect of pH onthe dissociation curve. One very common disorder forwhich this assumption is invalid is anemia, where thedissociation curve is shifted to the right, primarilybecause of the increased erythrocyte diphosphogly-cerate concentrations (27).
The alternative to calculating oxygen saturation isto directly measure it in whole blood. Manometric(28, 29 ) and spectrophotometric (30-32 ) techniquesare used for this determination. Unfortunately, oxy-gen saturation has been defined in different terms forthese two methods, and this is a potential source ofconfusion. In the Van Slyke manometric method,oxygen saturation is usually expressed as the volume
of oxygen bound to hemoglobin in the original sam-pie, as a percentage of the volume of oxygen bound tohemoglobin after equilibration with room air. This

80
60
40
20
=I-
u-i
u-i0
10 20 30 40 50 60 70 80
Po2
100
CLINICALCHEMISTRY, Vol. 20, No. 12, 1974 1503
Fig. 2. A representation of theoxyhemoglobin dissociationcurve under standardized con-ditions (A) and “shifted to theright” (B)
definition ignores any hemoglobin species that doesnot readily combine with oxygen, such as carboxy-hemoglobin and methemoglobin. Consequently, a pa-tient could have a carboxyhemoglobin concentrationamounting to 25% of the total hemoglobin while stillshowing an oxygen saturation of, say, 95% if this defi-nition is used. On the other hand, oxygen saturationmay be defined as oxyhemoglobin concentration as apercentage of all hemoglobin species present (usuallyoxyhemoglobin, reduced hemoglobin, and carboxy-hemoglobin, although a term for methemoglobin mayalso be added). This quantity can also be measureddirectly by a spectrophotometric technique. Al-though there is disagreement about which definitionof oxygen saturation is the more meaningful, the userclearly must be well aware of which definition is
being used before attempting interpretation of thisquantity. It is often very useful to have direct meth-ods available for the determination of carboxyhemo-globin and methemoglobin in addition to oxygen sat-uration in order to decrease uncertainty in establish-ing the oxygen transport status of the patient.
One additional situation in which the commonlyused oxygen saturation nomogram fails is during theneonatal period. The nomograms are based on thedissociation curve for adult human blood (hemoglo-bin A), and should not be used if an appreciableamount of hemoglobin F is present unless the correc-tion described below is used. The dissociation curveof hemoglobin F lies well to the left of that for hemo-globin A; it is believed that this is attributable to thelower affinity of hemoglobin F for 2,3-diphosphogly-
cerate(33, 34).A careful comparison of published dissociation
curves under various conditions (35 ) shows that thecurve at birth at pH 7.40 very closely approximatesthe curve for adults at pH 7.60. Therefore, when it isnot practical to directly measure oxygen saturation in
a neonate, the nomogram may be used after 0.2 hasbeen added to the measured pH. Obviously, the age
of the infant will determine the magnitude of thiscorrection, since hemoglobin F is rapidly replacedwith hemoglobin A after birth. At about two monthspostpartum hemoglobin F and hemoglobin A arepresent in roughly equal amounts; therefore, 0.1 unitwould be the proper pH correction before the nomo-gram is used.
Oxygen Content
“Oxygen content” means the total amount of oxy-gen contained in a given volume of whole blood, andis usually expressed as milliliters of oxygen per 100ml of blood. Oxygen content may be directly mea-sured by either the Van Slyke manometric techniqueor an electrochemical technique, but it more com-monly is calculated from the oxygen saturation andthe hemoglobin concentration of the sample.
Four moles of oxygen (22 393 ml/mol at standardtemperature and pressure) can combine with 1 mol ofhemoglobin (64 458 g/mol), so oxygen capacity isequal to
:::: = i. 39 ml of 02 per gram of Rb
Oxygen content may thus be expressed as
02 content (ml/dl whole blood) =
saturation \1.39[Hb] (02 ) + cpo2 (9)
where [Hb], the hemoglobin concentration, is ingrams/dl, and 02 saturation is expressed as a per-
centage. The last term gives the amount of oxygenthat is dissolved in blood arid is free, i.e., not corn-bined with hemoglobin. The value of a for whole
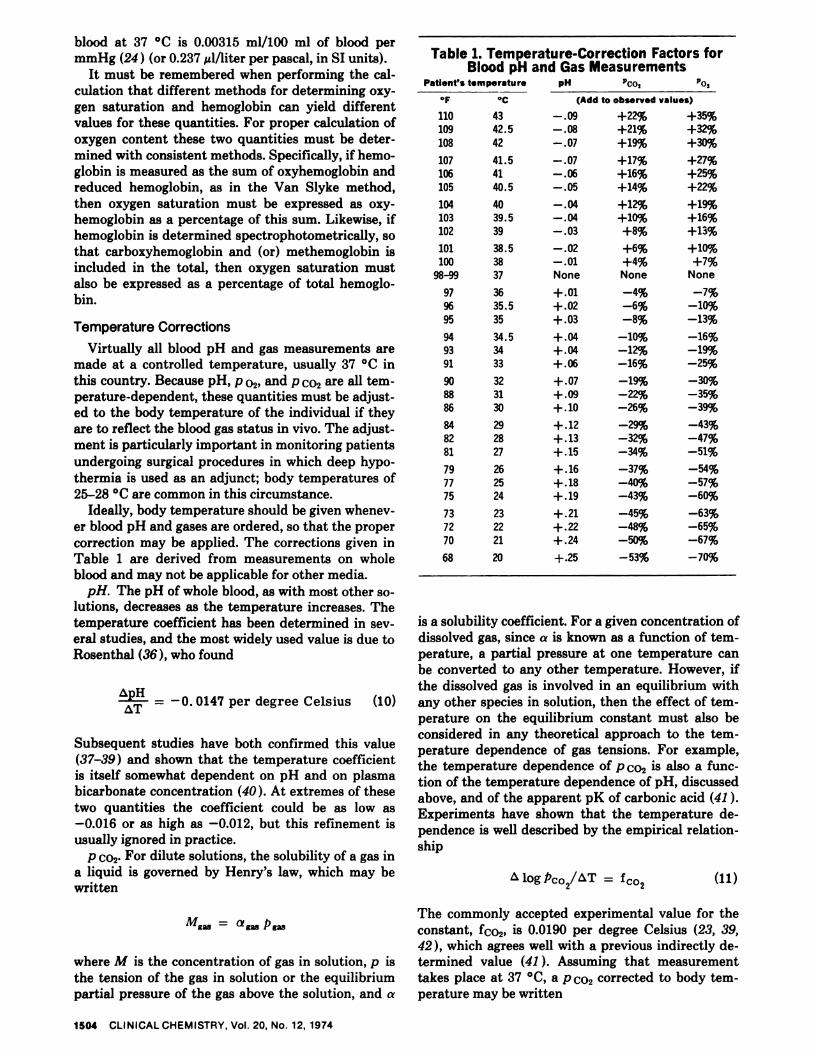
Patient’s temperature
Table 1. Temperature-Correction Factors forBlood pH and Gas Measurements
pH 9co, p01
#{176}F #{176}C (Add to observed values)
110109
108
4342.5
42
- . 09
- .08
- .07
+22%+21%+19%
+35%
+32%+30%
107
106105
41.5
4140.5
- .07- . 06
-.05
+17%
+16%
+14%
+27%+25%
+22%
104103102
4039.539
- .04- .04- .03
+12%+10%+8%
+19%+16%+13%
101100
98-99
38.53837
- .02- .01None
+6%+4%None
+10%+7%
None
979695
3635.5
35
+.01+.02
+.03
-4%-6%
-8%
-7%-10%-13%
94
9391
34.5
3433
+.04
+.04+.06
-10%-12%-16%
-16%-19%-25%
908886
323130
+.07+.09+.10
-19%-22%
-26%
-30%-35%-39%
848281
292827
+.12+.13
+.15
-29%
-32%-34%
-43%-47%-51%
797775
262524
+.16+.18+ . 19
-37%-40%-43%
-54%-57%-60%
737270
232221
+.21+.22+.24
-45%-48%-50%
-63%-65%-67%
68 20 +.25 -53% -70%
blood at 37 #{176}Cis 0.00315 ml/100 ml of blood permmHg (24 ) (or 0.237 dIliter per pascal, in SI units).
It must be remembered when performing the cal-
culation that different methods for determining oxy-gen saturation and hemoglobin can yield differentvalues for these quantities. For proper calculation ofoxygen content these two quantities must be deter-mined with consistent methods. Specifically, if hemo-globin is measured as the sum of oxyhemoglobin andreduced hemoglobin, as in the Van Slyke method,then oxygen saturation must be expressed as oxy-hemoglobin as a percentage of this sum. Likewise, ifhemoglobin is determined spectrophotometrically, sothat carboxyhemoglobin and (or) methemoglobin isincluded in the total, then oxygen saturation mustalso be expressed as a percentage of total hemoglo-
bin.
Temperature Corrections
Virtually all blood pH and gas measurements aremade at a controlled temperature, usually 37 #{176}Cinthis country. Because pH, p 02, and p co2 are all tern-perature-dependent, these quantities must be adjust-ed to the body temperature of the individual if theyare to reflect the blood gas status in vivo. The adjust-ment is particularly important in monitoring patientsundergoing surgical procedures in which deep hypo-thermia is used as an adjunct; body temperatures of25-28 #{176}Care common in this circumstance.
Ideally, body temperature should be given whenev-er blood pH and gases are ordered, so that the propercorrection may be applied. The corrections given inTable 1 are derived from measurements on wholeblood and may not be applicable for other media.
pH. The pH of whole blood, as with most other so-lutions, decreases as the temperature increases. The
temperature coefficient has been determined in sev-eral studies, and the most widely used value is due toRosenthal (36 ), who found
ApH _#{149} 0147 per degree Celsius (10)
Subsequent studies have both confirmed this value(37-39 ) and shown that the temperature coefficient
is itself somewhat dependent on pH and on plasmabicarbonate concentration (40 ) . At extremes of thesetwo quantities the coefficient could be as low as-0.016 or as high as -0.012, but this refinement is
usually ignored in practice.
p co2. For dilute solutions, the solubility of a gas ina liquid is governed by Henry’s law, which may bewritten
Mg = a53
where M is the concentration of gas in solution, p is
the tension of the gas in solution or the equilibriumpartial pressure of the gas above the solution, and a
is a solubility coefficient. For a given concentration ofdissolved gas, since a is known as a function of tern-perature, a partial pressure at one temperature canbe converted to any other temperature. However, if
the dissolved gas is involved in an equilibrium withany other species in solution, then the effect of tern-perature on the equilibrium constant must also beconsidered in any theoretical approach to the tern-perature dependence of gas tensions. For example,the temperature dependence of p co2 is also a func-tion of the temperature dependence of pH, discussedabove, and of the apparent pK of carbonic acid (41).
Experiments have shown that the temperature de-pendence is well described by the empirical relation-ship
logPco2/iT = Icol (11)
The commonly accepted experimental value for the
constant, fo2, is 0.0190 per degree Celsius (23, 39,42 ), which agrees well with a previous indirectly de-termined value (41 ) . Assuming that measurementtakes place at 37 #{176}C,a p co2 corrected to body tern-perature may be written
1504 CLINICAL CHEMISTRY. Vol. 20, No. 12, 1974

Pco2(at T) = Pco2(37#{176}C)100.019(T-37) (12) above values gives Mog po2/T .031, which is in
good agreement with equation 14. Equation 14 has
where T is body temperature in degrees Celsius.
p 02- The effect of temperature on p 02 is also corn-plex, because temperature affects not only the solu-bility of oxygen in the plasma phase but also theequilibrium between oxyhemoglobin and dissolvedoxygen, as given by the oxyhemoglobin dissociationcurve.
When oxygen saturation is below 95%, temperature
changes in a sample of whole blood stored anaerobi-cally do not cause a significant change in the satura-
tion-i.e., oxygen does not shift between oxyhemo-globin and dissolved oxygen. This is because thechange in p 02 is offset by the change in oxygen affini-ity of hemoglobin, as seen in the shift in the oxyhem-
oglobin dissociation curve. However, at high levels ofoxygen saturation, these factors do not balance and
the value of log p o2/T becomes a function of oxy-gen saturation.
An empirical relationship of the form of equation11 has also been useful for oxygen data.
been used to construct a nomogram (43 ), which facil-
jtates the computation.Derived quantities. Oxygen saturation: If p 02 and
)H are known, oxygen saturation can be estimated ifone assumes a normal oxyhernoglobin dissociationcurve. The curve normally used in the form of a no-mogram or slide-rule calculation assumes a set ofstandard conditions including a temperature of 37
and a pH of 7.40. Provision is made for adjustingthis curve for other values of pH. If it is desired to es-timate oxygen saturation in this manner, the calcula-tion should be carrie1 out with use of the measured‘ 02 at 37 #{176}Cand the measured pH at 37 #{176}C.It is notnecessary to use temperature-corrected values for
‘#{176}02 and pH, because oxygen saturation is not signifi-cantly temperature dependent; moreover, correctedvalues could be used only if the dissociation curvecorresponding to the subject’s body temperaturewere available.
Bicarbonate concentration and CO2 content: Foranalogous reasons, these derived parameters should
logp02/AT = f02 (13)be calculated from the Henderson-Hasselbaich equa-tion by using the pH and Pco2 measured at 37 #{176}C.Itis not necessary to use temperature-corrected values
Experimental data at both high and low saturationshave been fit with the following expression for f02(42, 43 )
in this case, because bicarbonate concentration is in-dependent of temperature (44 ). Moreover, the cor-rected values could not be used unless both the pK ofcarbonic acid and the solubility coefficient of CO2
fo2 . 032 - . 0268 e330 (14)were known at the temperature of interest.
where x is percent oxygen saturation. f02 may betaken as .030 with oxygen saturations as high as 95%without introducing significant error, but at highersaturation fo2 should be calculated from equation
ReferencesM8.S, A. H. J., The determination of the true equilibrium con-
stant and the practical equilibrium coefficient for the first ionize-tion of carbonic acid in solutions of sodium bicarbonate, cerebro-
14. spinal fluid, plasma and serum at 25 0 and 38 . Clin. Chim. Acta
Approximately the same result has also been ob-tamed indirectly (23 ) in the following manner. p 02 is
a function of temperature, pH, and oxygen satura-
‘ 325 (1971).
2. Maas, A. H. J., pH determination of body fluids with a microglass electrode and a saturated KC1 bridge in the cell. Clin. Chim.Acta 28, 373 (1970).
tion; the last two quantities are also functions of tern- 3. Austin, W. H., Lacombe, E., Rand, P. W., and Chatterjee, M.,
perature. Therefore we may write, Solubility of carbon dioxide in serum from 15 #{176}to 38 #{176}C.J. App!.Physiol. 18, 301 (1963).
log po2 = I log po2’
tT t, AT ‘pB,aat
4. Trenchard, D., Noble, M. I. M., and Guz, A., Serum carbonicacid pK abnormalities in patients with acid-base disturbances.Clin. Sci. 32, 189(1967).5. Austin, W. H., Ferrante, V., and Anderson, C., Evaluation ofwhole blood pK in the acutely ill patient. J. Lab. C!in. Med. 72,
+129 (1968).
6. Austin, W. H., Ferrante, V. V., and Ritchie, R. F., Effect of ab-normal plasma constituents on the pK of whole blood. Amer. J.
th log p2 ‘ sat\
(% sat 1T,pH ()pH,po2
C!in. Pathol. 15, 799 (1969).
pK.J.MaineMed.Ass. 60, 10 (1969).7. Austin, W. H., and Stinebaugh, B. J., The “not so apparent”
The first term has been experimentally determinedin several laboratories and the average of several
8. Mass, A. H. J., A titrimetric method for the determination ofactual bicarbonate in cerebrospinal fluid and plasma or serum.Clin. Chim. Acta 29, 567 (1970).
, Siggaard-Andersen, 0., Titratable acid or base of body fluids.values is 0.024 (23). The first factor in the second Ann. N. Y Acad. Sci. 133, 41 (1966).
term is the Bohr-Haldane coefficient, given by equa-tion 6. The second factor is given by equation 10.Again, the variation with oxygen saturation is ig-nored below 95% saturation. Substitution of the
lO. Siggaard-Andersen, 0., and Engel, K., A new acid-base nomo-graIn. An improved method for the calculation of the relevantblood acid-base data. Scand. J. Clin. Lab. Invest. 12, 177 (1960).
1. Siggaard-Andersen, 0., The pH-logPco2 blood acid-base no-mogram revised. Scand. J. Clin. Lab. Invest. 14, 1 (1972).
CLINICALCHEMISTRY, Vol. 20, No. 12, 1974 1505
(‘‘ logp02’ (\\ pH 1T,sat ‘ T 1o2,sat

1506 CLINICAL CHEMISTRY. Vol. 20, No. 12, 1974
12. Siggaard-Andersen, 0., Blood acid-base alignment nomogram.Scand. J. Clin. Lab. Invest. 15, 211 (1963).
13. Shaw, L. A., and Messer, A. C., The transfer of bicarbonate be-tween the blood and tissues caused by alterations of the carbondioxide concentration in the lungs. Amer. J. Physiol. 100, 122(1932).
14. Brackett, N.C., Jr., et al., The carbon dioxide titration curve ofnormal man. New Eng!. J. Med. 272, 6 (1965).
15. Siggaard-Andersen, 0., Acute experimental acid-base distur-bances in dogs. Scand. J. C!in. Lab. Invest. 14, Suppl., 66 (1962).
16. lchiyanagi, K., et al., Acid-base balance of arterial plasma dur-ing exogenous and endogenous hypercapnia in man. Resp. Physiol.7. 310 (1968).
17. Engel, K., Kildeberg, P., and Winters, R. W., Quantitative dis-placement of blood acid-base status in acute hypocapnia. Scand. ,J.C!in. Lab. Invest. 23, 5 (1969).
18. Dell, R. B., In vivo CO2 equilibration curve. Chest 61, 3 S(February 1972, supplement).
19. Armstrong, B. W., Mohler, J. G., and Jung, R. C., The in vivocarbon dioxide titration curve. Lancet i, 759 (1966).
20. Collier, C. R., et a!., Use of extracellular base excess in diagno-sis of acid-base disorders: A conceptual approach. Chest 61, 6 S(February 1972, supplement).
21. Siggaard-Andersen, 0., An acid-base chart for arterial bloodwith normal and pathophysiological reference areas. Scand. J.Clin. Lab. Invest. 27, 239 (1971).
22. Refsum, H. E., and Kum, B. M., Relationship between theacid-base changes of arterial plasma during acute changes of theCO2 tension in vivo and the hemoglobin concentration of theblood. Rasp. Physio!. 2, 283 (1967).
23. Severinghaus, J. W., Blood gas calculator. J. App!. Physiol. 21,1108(1966).
24. Roughton, F. J. W., and Severinghaus, J. W., Accurate deter-mination of 02 dissociation curve of human blood above 98.7% sat-uration, with data on 02 solubility in unmodified human bloodfrom 0 #{176}to 37 #{176}C.J. App!. Physiol. 35, 861 (1973).
25. Siggaard-Andersen, 0., and Garby, L., The Bohr effect and theHaldane effect. Scand. ,J. Clin. Lab. Invest. 31, 1 (1973).26. Bellingham, A. J., et al., Regulatory mechanisms of hemoglo-bin oxygen affinity in acidosis and alkalosis. J. Clin. Invest. 50,700 (1971).
27. Cropp, G. J. A., and Gee, M. H., Role of 2,3-diphosphogly-cerate in oxygen transport in experimental anemia. Chest 61, 16 S(February 1972, supplement).
28. Van Slyke, D. D., and Neil!, J. M., The determination of gasesin blood and other solutions by vacuum extraction and manomet-nc measurement. J. Bio!. Chem. 61, 523 (1924).29. Van Slyke, D. D., and Plazen, J., Micromanometric Ana!ysis.Williams and Wilkins Co., Baltimore, Md. , 1961.
30.Gordy, E., and Drabkin, D. C., Spectrophotometric studies.XVI. Determination of the oxygen saturation of blood by a simpli-fled technique applicable to standard equipment. J. Biol. Chem.227, 285 (1957).
31. Johnson, G. W., Oxygen saturation of blood. Stand. MethodsClin. Chem. 4, 183 (1963).32. de la Huerga, J., and Sherrick, J. C., Measurement of oxygensaturation of the blood. Ann. C!in. Lab. Sci. 1, 261 (1971).
33. de Verdier, C., and Garby, L., Low binding of 2,3-diphospho-glycerate to hemoglobin F. Scand. J. Clin. Lab. Invest. 23, 149(1969).
34. Bunn, H. F., and Briehl, R. W., The interaction of 2,3-diphos-phoglycerate with various human hemoglobin. J. Clin. Invest. 49,1088 (1970).
35. Blood and Other Body Fluids. P. L. Altman and D. S. Dittner,Eds. Federation of American Societies for Experimental Biology,Bethesda, Md., 1961, p 151 ff.
36. Rosenthal, T. B., The effect of temperature on the pH ofblood and plasma in vitro. J. Biol. Chem. 173, 25 (1948).37. Graige, F. A., Lange, K., Oberman, J., and Carson, S., A sim-pie, accurate method of blood pH determinations for clinical use.Arch. Biochem. Biophys. 37, 357 (1952).
38. Austin, W. H., Lacombe, E. H., and Rand, P. W., pH tempera-ture conversion factors and pCO2 factors for hypothermia. J. Appl.Physiol. 19, 893 (1964). .39. Greenburg, A. G., and Moulder, P. V., Temperature coeffi-cients for Pco5 and pH in whole blood. Arch. Surg. 91, 867 (1965).40. Adamsons, K., et a!., Influence of temperature on blood pH ofthe human adult and newborn. J. AppI. Physiol. 19, 897 (1964).41. Bradley, A. F., Stupfel, M., and Severinghaus, J. W., Effect oftemperature on P#{248}2and P02 of blood in vitro. J. Appi. Physiol. 9,201 (1956).42. Nunn, J. F., et al., Temperature coefficients for Pco2 and Poof blood in vitro. J. App!. Physiol. 20, 23 (1965).
43. Kelman, G. R., and Nunn, J. F., Nomograms for correction ofblood P02, P#{248}2,pH and base excess for time and temperature. J.
App!. Physiol. 21, 1484 (1966).44. Severinghaus, J. W., Stupfel, M., and Bradley, A. F., Accuracyof blood pH and Pco2 determination. J. App!. Physio!. 9, 189(1956).