Determination and Evaluation of Habitat – Flow ...
173
Determination and Evaluation of Habitat – Flow Relationships in the Sultan River, Washington - Sultan River Instream Flow Study – RSP 3 - Prepared for: Public Utility District No. 1 of Snohomish County and City of Everett Prepared by: R2 Resource Consultants, Inc. 15250 N.E. 95th Street Redmond, Washington 98052 March 19, 2009
Transcript of Determination and Evaluation of Habitat – Flow ...

Determination and Evaluation of Habitat – Flow Relationships in the Sultan River, Washington - Sultan River Instream Flow Study – RSP 3 -
Prepared for:
Public Utility District No. 1 of Snohomish County
and City of Everett
Prepared by:
R2 Resource Consultants, Inc. 15250 N.E. 95th Street
Redmond, Washington 98052
March 19, 2009

Determination and Evaluation of Habitat – Flow Relationships in the Sultan River, Washington - Sultan River Instream Flow Study – RSP 3 -
Prepared for:
Public Utility District No. 1 of Snohomish County
and City of Everett
Prepared by:
Dudley W. Reiser, Michael R. Gagner, Chi-Ming Huang, Catherine Morello Timothy J. Sullivan, Stuart M. Beck, and Timothy L. Nightengale
R2 Resource Consultants, Inc. 15250 N.E. 95th Street
Redmond, Washington 98052
March 19, 2009

Sultan River Instream Flow Study – RSP 3
R2 Resource Consultants, Inc. iii March 19, 2009 1628.07/Instream Flow Report_031909
CONTENTS
EXECUTIVE SUMMARY ....................................................................................................... XVI
1. INTRODUCTION ................................................................................................................. 1-1
1.1 STUDY OBJECTIVES.......................................................................................................... 1-3
1.2 LINKAGES TO OTHER STUDIES ......................................................................................... 1-4
1.3 REPORT ORGANIZATION AND CONTENT ........................................................................... 1-6
2. BACKGROUND INFORMATION ...................................................................................... 2-1
2.1 DESCRIPTION OF STUDY AREA AND STUDY REACHES...................................................... 2-1
2.1.1 Study Area ........................................................................................................... 2-2
2.1.2 Sultan River Study Reaches ................................................................................ 2-2
2.1.2.1 Operational Reach 3................................................................................ 2-3
2.1.2.2 Operational Reach 2................................................................................ 2-4
2.1.2.3 Operational Reach 1................................................................................ 2-5
2.2 PROJECT FACILITIES AND CURRENT OPERATIONS ............................................................ 2-6
2.2.1 Project Facilities .................................................................................................. 2-6
2.2.1.1 Culmback Dam ....................................................................................... 2-6
2.2.1.2 Diversion Dam........................................................................................ 2-7
2.2.1.3 Powerhouse ............................................................................................. 2-9
2.2.2 Project Operations ............................................................................................... 2-9
2.2.3 Instream Flow Studies and Flow Releases ........................................................ 2-13
2.2.4 Downramping Rates .......................................................................................... 2-15
2.3 FISH OF THE SULTAN RIVER ........................................................................................... 2-17
2.3.1 CHINOOK SALMON (Oncorhynchus tshawytscha) ....................................... 2-17
2.3.2 COHO SALMON (Oncorhynchus kisutch)....................................................... 2-20
2.3.3 PINK SALMON (Oncorhynchus gorbuscha) ................................................... 2-21
2.3.4 CHUM SALMON (Oncorhynchus keta)........................................................... 2-22
2.3.5 STEELHEAD TROUT (Oncorhynchus mykiss) ............................................... 2-23
2.3.6 BULL TROUT (Salvelinus confluentus)........................................................... 2-24
2.3.7 COASTAL CUTTHROAT TROUT (Oncorhynchus clarki clarki) ................. 2-26
3. METHODS ............................................................................................................................ 3-1

Sultan River Instream Flow Study – RSP 3
R2 Resource Consultants, Inc. iv March 19, 2009 1628.07/Instream Flow Report_031909
3.1 PLANNING AND SITE RECONNAISSANCE........................................................................... 3-1
3.2 STUDY REACH DELINEATION AND TRANSECT SELECTION ............................................... 3-3
3.2.1 Mainstem Transect Selection .............................................................................. 3-4
3.2.2 Side Channel Transect Selection ......................................................................... 3-5
3.3 FIELD DATA COLLECTION .............................................................................................. 3-14
3.3.1 Hydraulic and Habitat Measurements ............................................................... 3-14
3.4 HABITAT SUITABILITY CRITERIA.................................................................................... 3-27
3.4.1 Snorkel Surveys................................................................................................. 3-27
3.4.2 Redd Surveys..................................................................................................... 3-27
3.4.3 Data Analysis..................................................................................................... 3-28
3.4.4 Review and Adoption of HSC Criteria.............................................................. 3-28
3.5 MODELING ..................................................................................................................... 3-30
3.5.1 Hydraulic Modeling........................................................................................... 3-30
3.5.2 Habitat Modeling............................................................................................... 3-31
3.5.2.1 Transect Weighting and Habitat Mapping............................................. 3-31
3.5.3 Flow and Habitat Time Series ........................................................................... 3-34
3.5.3.1 Flows in Operational Reach 3............................................................... 3-35
3.5.3.2 Flows in Operational Reach 2............................................................... 3-35
3.5.3.3 Flows in Operational Reach 1............................................................... 3-35
4. HABITAT MODELING........................................................................................................ 4-1
4.1 REACH 3 – CULMBACK DAM TO DIVERSION DAM............................................................ 4-2
4.1.1 PHABSIM Analysis ............................................................................................ 4-2
4.1.1.1 Spawning Habitat.................................................................................... 4-2
4.1.1.2 Juvenile and Adult Habitat...................................................................... 4-2
4.1.1.3 Habitat Time Series................................................................................. 4-9
4.2. REACH 2 – DIVERSION DAM TO POWERHOUSE................................................................ 4-9
4.2.1 PHABSIM Analysis .......................................................................................... 4-20
4.2.1.1 Spawning............................................................................................... 4-20
4.2.1.2 Juvenile and Adult Habitat.................................................................... 4-20
4.2.1.3 Habitat Time Series............................................................................... 4-27
4.3 REACH 1 – POWERHOUSE TO SKYKOMISH RIVER ........................................................... 4-27

Sultan River Instream Flow Study – RSP 3
R2 Resource Consultants, Inc. v March 19, 2009 1628.07/Instream Flow Report_031909
4.3.1 Mainstem PHABSIM Analysis .......................................................................... 4-27
4.3.1.1 Spawning Habitat................................................................................... 4-27
4.3.1.2 Juvenile and Adult Habitat.................................................................... 4-34
4.3.1.3 Habitat Time Series............................................................................... 4-34
4.3.2 Side Channel Habitat:Flow Analysis................................................................. 4-41
5. SUMMARY........................................................................................................................... 5-1
6. REFERENCES ...................................................................................................................... 6-1
Appendix I – Data QA/QC Notes APPENDIX A: Transect Selection Presentation – June 12, 2008 APPENDIX B: Target Flow Memorandum – June 11, 2007 APPENDIX C: Habitat Suitability Criteria (HSC) – includes a) Proposed Habitat Suitability
Criteria (HSC) Curves for Application in Habitat-Flow Modeling for the Sultan River Instream Flow Study – RSP 3, June 5, 2008; b) Technical Memorandum: Sultan River Instream Flow Study – HSC Preference Analysis and Revised Steelhead and Chinook Curves, July 31, 2008; c) HSC curves used in habitat-flow modeling
APPENDIX D: Habitat:Flow Relationships and Time Series Analysis APPENDIX E: Transect Photographs APPENDIX F: Transect Cross Sectional Profiles and Model Calibration Details APPENDIX G: Field Notes

Sultan River Instream Flow Study – RSP 3
R2 Resource Consultants, Inc. vi March 19, 2009 1628.07/Instream Flow Report_031909
FIGURES Figure 1-1. Site map depicting locations of Project facilities, operational reaches, and
major tributaries to the Sultan River, Washington. ............................................ 1-2
Figure 2-1. Study reaches (Operational Reaches) 1, 2, and 3 on the Sultan River, Washington below Culmback Dam. ................................................................... 2-3
Figure 2-2. Percentage composition of habitat types within each of the three operational reaches (OR) of the Sultan River, Washington. Data and analysis from Stillwater Sciences and Meridian Environmental (2008a). (CAS=cascade, RPD=rapid, LGR, low gradient riffle, GLD=glide). ................ 2-4
Figure 2-3. Aerial view of Culmback Dam which forms upper extent of Operational Reach 3 of the Sultan River. Photo from PAD (Public Utility District No. 1 of Snohomish County, and City of Everett). ................................................... 2-7
Figure 2-4. Photographs of Diversion Dam (upper photo and inset photo) and Henry M. Jackson Powerhouse (lower photo) on Sultan River, Washington. .............. 2-8
Figure 2-5. Schematic of Jackson Hydroelectric Project depicting flow directions during high flow or shutdown operations. Figure from PAD (2005). ............. 2-11
Figure 2-6. Sultan River average monthly flows, Stage 1 vs. Stage 2 (data have been standardized by drainage area and adjusted for withdrawals). Figure from the PAD (2005)................................................................................................. 2-12
Figure 2-7. Spada Lake operational rule curves. Figure from the PAD (2005). ................ 2-12
Figure 2-8. Life stage periodicities of salmonid species present within the Sultan River Basin, Washington............................................................................................ 2-18
Figure 3-1. Location of mainstem study sites established for the instream flow study in each of the three operational reaches of the mainstem, Sultan River, WA. ....... 3-4
Figure 3-2. Reach 3 upper study site location, habitat composition (Stillwater Science and Meridian Environmental 2008a) and habitat types represented by each instream transect on the Sultan River, WA. ....................................................... 3-6
Figure 3-3. Reach 3 lower study site location, habitat composition (Stillwater Science and Meridian Environmental 2008a) and habitat types represented by each instream transect on the Sultan River, WA. ....................................................... 3-7
Figure 3-4. Reach 2 upper study site location, habitat composition (Stillwater Science and Meridian Environmental 2008a) and habitat types represented by each instream transect on the Sultan River, WA. ....................................................... 3-8

Sultan River Instream Flow Study – RSP 3
R2 Resource Consultants, Inc. vii March 19, 2009 1628.07/Instream Flow Report_031909
Figure 3-5. Reach 2 lower study site location, habitat composition (Stillwater Science and Meridian Environmental 2008a) and habitat types represented by each instream transect on the Sultan River, WA. ....................................................... 3-9
Figure 3-6. Reach 1B study site location, habitat composition (Stillwater Science and Meridian Environmental 2008a) and habitat types represented by each instream flow transect on Sultan River, WA. ................................................... 3-10
Figure 3-7. Reach 1A study site location, habitat composition (Stillwater Science and Meridian Environmental 2008a) and habitat types represented by each instream flow transect on the Sultan River, WA. ............................................. 3-11
Figure 3-8. Downstream view within Side Channel #1 of the Sultan River, Washington under relatively high flow conditions. Photo taken on April 12; main channel flow approximately 3000 cfs. Tripod sits on exposed gravel and cobble substrates............................................................................................... 3-12
Figure 3-9. Location of mapped side channel areas within Reach 1A (PUD #1 of Snohomish County and City of Everett 2005) of the lower Sultan River, WA. Side channels 1, 6 and 8 were selected for detailed analysis in this study, and correspondingly re-numbered Side Channels 3, 2, and 1, respectively)...................................................................................................... 3-13
Figure 3-10. Distribution of transects within Side Channel 3 (upper most side channel), Reach 1A, Sultan River, WA............................................................................ 3-15
Figure 3-11. Distribution of transects within Side Channel 2, Reach 1A, Sultan River, WA.................................................................................................................... 3-15
Figure 3-12. Distribution of transects within Side Channel 1 (lower most side channel), Reach 1A, Sultan River, WA............................................................................ 3-16
Figure 3-13. Upstream views to Transect 3 within the Upper Site of Reach 3 during high flow (320 cfs; June 29, 2007) (upper photo) and low flow (38 cfs; June 27, 2007) measurements. ........................................................................................ 3-18
Figure 3-14. Side views of Transect 1 within the Lower Site of Reach 3 during high flow (350 cfs; June 29, 2007) (upper photo) and low flow (55 cfs; June 27, 2007) (lower photo) measurements. ................................................................. 3-19
Figure 3-15. Upstream views to Transect 4 within the Upper Site of Reach 2 during high flow (398 cfs; July 13, 2007) (upper photo) and low flow (116 cfs; July 11, 2007) (lower photo) measurements. ................................................................. 3-20
Figure 3-16. Side views of Transect 1 within the Lower Site of Reach 2 during high flow (430 cfs; July 13, 2007) (upper photo) and low flow (123 cfs; July 11, 2007) (lower photo) measurements. ................................................................. 3-21

Sultan River Instream Flow Study – RSP 3
R2 Resource Consultants, Inc. viii March 19, 2009 1628.07/Instream Flow Report_031909
Figure 3-17. Side views of Transect 1 within Reach 1B during high flow (495 cfs; July 18, 2007) (upper photo) and low flow (180 cfs; July 20, 2007) (lower photo) measurements. ....................................................................................... 3-22
Figure 3-18. Upstream view to Transect 7 within Reach 1A during high flow (495 cfs; July 18, 2007) (upper photo) and low flow (180 cfs; July 20, 2007) (lower photo) measurements. ....................................................................................... 3-23
Figure 3-19. Example PHABSIM cross channel transect illustrating typical transect setup and data collection points across each transect. ...................................... 3-24
Figure 3-20. Daily flows in the Sultan River at the upstream end of Operational Reach 3 under Stage 1 (thin line) and Stage 2 (thick line) conditions during representative wet (1991), average (2004), and dry (2001) years. ................... 3-36
Figure 3-21. Daily flows in the Sultan River at the downstream end of Operational Reach 3 under Stage 1 (thin line) and Stage 2 (thick line) conditions during representative wet (1991), average (2004), and dry (2001) years. ................... 3-37
Figure 3-22. Daily flows in the Sultan River at the upstream end of Operational Reach 2 under Stage 1 (thin line) and Stage 2 (thick line) conditions during representative wet (1991), average (2004), and dry (2001) years. ................... 3-38
Figure 3-23. Daily flows in the Sultan River at the downstream end of Operational Reach 2 under Stage 1 (thin line) and Stage 2 (thick line) conditions during representative wet (1991), average (2004), and dry (2001) years. ................... 3-39
Figure 3-24. Daily flows in the Sultan River at the upstream end of Operational Reach 1 under Stage 1 (thin line) and Stage 2 (thick line) conditions during representative wet (1991), average (2004), and dry (2001) years. ................... 3-40
Figure 3-25. Daily flows in the Sultan River at the downstream end of Operational Reach 1 under Stage 1 (thin line) and Stage 2 (thick line) conditions during representative wet (1991), average (2004), and dry (2001) years. ................... 3-41
Figure 4-1. Total spawning habitat area (acres) versus flow (cfs) relationships for Chinook and coho salmon and steelhead trout (upper figure), and rainbow and cutthroat trout (lower figure) in Reach 3 of the Sultan River, Washington. * Note that anadromous salmonids have not been present since 1929 within Reach 3; for comparative purposes, all anadromous species were analyzed and results displayed. ..................................................... 4-3
Figure 4-2. Percentage (%) of maximum spawning habitat area versus flow (cfs) relationships for Chinook and coho salmon and steelhead trout (upper figure), and rainbow and cutthroat trout (lower figure) in Reach 3 of the Sultan River, Washington. .................................................................................. 4-5

Sultan River Instream Flow Study – RSP 3
R2 Resource Consultants, Inc. ix March 19, 2009 1628.07/Instream Flow Report_031909
Figure 4-3. Total juvenile and adult habitat area (acres) versus flow (cfs) relationships for Chinook and coho salmon and steelhead trout (upper figure), and rainbow and cutthroat trout (lower figure) in Reach 3 of the Sultan River, Washington. ........................................................................................................ 4-7
Figure 4-4. Percentage (%) of maximum juvenile and adult habitat area versus flow (cfs) relationships for Chinook and coho salmon and steelhead trout (upper figure), and rainbow and cutthroat trout (lower figure) in Reach 3 of the Sultan River, Washington. .................................................................................. 4-8
Figure 4-5. Time series analysis depicting total rainbow trout spawning habitat (1000 ft2) available over the period of spawning under wet, average and dry year scenarios for Reach 3 of the Sultan River, Washington. .................................. 4-10
Figure 4-6. Habitat duration curves for rainbow trout spawning habitat (1000 ft2) under wet, average, dry year scenarios for Reach 3 of the Sultan River, Washington. ...................................................................................................... 4-11
Figure 4-7. Time series analysis depicting total cutthroat trout spawning habitat (1000 ft2) available over the period of spawning under wet, average and dry year scenarios for Reach 3 of the Sultan River, Washington. .................................. 4-12
Figure 4-8. Habitat duration curves for cutthroat trout spawning habitat (1000 ft2) under wet, average, dry year scenarios for Reach 3 of the Sultan River, Washington. ...................................................................................................... 4-13
Figure 4-9. Time series analysis depicting total Chinook salmon spawning habitat (1000 ft2) available over the period of spawning under wet, average and dry year scenarios for Reach 3 of the Sultan River, Washington. .......................... 4-14
Figure 4-10. Habitat duration curves for Chinook salmon spawning habitat (1000 ft2) under wet, average, dry year scenarios for Reach 3 of the Sultan River, Washington. ...................................................................................................... 4-15
Figure 4-11. Time series analysis depicting total steelhead trout spawning habitat (1000 ft2) available over the period of spawning under wet, average and dry year scenarios for Reach 3 of the Sultan River, Washington. .................................. 4-16
Figure 4-12. Habitat duration curves for steelhead trout spawning habitat (1000 ft2) under wet, average, dry year scenarios for Reach 3 of the Sultan River, Washington. ...................................................................................................... 4-17
Figure 4-13. Total spawning habitat area (acres) versus flow (cfs) relationships for Chinook, coho, chum, and pink salmon and steelhead trout (upper figure), and rainbow and cutthroat trout (lower figure) in Reach 2 of the Sultan River, Washington. ........................................................................................... 4-21

Sultan River Instream Flow Study – RSP 3
R2 Resource Consultants, Inc. x March 19, 2009 1628.07/Instream Flow Report_031909
Figure 4-14. Percentage (%) of maximum spawning habitat area versus flow (cfs) relationships for Chinook, coho, chum, and pink salmon and steelhead trout (upper figure), and rainbow and cutthroat trout (lower figure) in Reach 2 of the Sultan River, Washington. .......................................................................... 4-24
Figure 4-15. Total juvenile and adult habitat area (acres) versus flow (cfs) relationships for Chinook and coho salmon and steelhead trout (upper figure), and rainbow and cutthroat trout (lower figure) in Reach 2 of the Sultan River, Washington. ...................................................................................................... 4-25
Figure 4-16. Percentage (%) of maximum juvenile and adult habitat area versus flow (cfs) relationships for Chinook and coho salmon and steelhead trout (upper figure), and rainbow and cutthroat trout (lower figure) in Reach 2 of the Sultan River, Washington. ................................................................................ 4-26
Figure 4-17. Time series analysis depicting total Chinook salmon spawning habitat (1000 ft2) available over the period of spawning under wet, average and dry year scenarios for Reach 2 of the Sultan River, Washington. .......................... 4-28
Figure 4-18. Habitat duration curves for Chinook salmon spawning habitat (1000 ft2) under wet, average, dry year scenarios for Reach 2 of the Sultan River, Washington. ...................................................................................................... 4-29
Figure 4-19. Time series analysis depicting total steelhead trout spawning habitat (1000 ft2) available over the period of spawning under wet, average and dry year scenarios for Reach 1 of the Sultan River, Washington. .................................. 4-30
Figure 4-20. Habitat duration curves for steelhead trout spawning habitat (1000 ft2) under wet, average, dry year scenarios for Reach 2 of the Sultan River, Washington. ...................................................................................................... 4-31
Figure 4-21. Total spawning habitat area (acres) versus flow (cfs) relationships for Chinook, coho, chum and pink salmon and steelhead trout (upper figure), and rainbow and cutthroat trout (lower figure) in Reach 1 of the Sultan River, Washington. ........................................................................................... 4-35
Figure 4-22. Percentage (%) of maximum spawning habitat area versus flow (cfs) relationships for Chinook, coho, chum and pink salmon and steelhead trout (upper figure), and rainbow and cutthroat trout (lower figure) in Reach 1 of the Sultan River, Washington. .......................................................................... 4-38
Figure 4-23. Total juvenile and adult habitat area (acres) versus flow (cfs) relationships for Chinook and coho salmon and steelhead trout (upper figure), and rainbow and cutthroat trout (lower figure) in Reach 1 of the Sultan River, Washington. ...................................................................................................... 4-39

Sultan River Instream Flow Study – RSP 3
R2 Resource Consultants, Inc. xi March 19, 2009 1628.07/Instream Flow Report_031909
Figure 4-24. Percentage (%) of maximum spawning habitat area versus flow (cfs) relationships for Chinook, and coho salmon and steelhead trout (upper figure), and rainbow and cutthroat trout (lower figure) in Reach 1 of the Sultan River, Washington. ................................................................................ 4-40
Figure 4-25. Time series analysis depicting total Chinook salmon spawning habitat (1000 ft2) available over the period of spawning under wet, average and dry year scenarios for Reach 1 of the Sultan River, Washington. .......................... 4-42
Figure 4-26. Habitat duration curves for Chinook salmon spawning habitat (1000 ft2) under wet, average, dry year scenarios for Reach 1 of the Sultan River, Washington. ...................................................................................................... 4-43
Figure 4-27. Time series analysis depicting total steelhead trout spawning habitat (1000 ft2) available over the period of spawning under wet, average and dry year scenarios for Reach 1 of the Sultan River, Washington. .................................. 4-44
Figure 4-28. Habitat duration curves for steelhead trout spawning habitat (1000 ft2) under wet, average, dry year scenarios for Reach 1 of the Sultan River, Washington. ...................................................................................................... 4-45
Figure 4-29. Relationship of flow depth within side channel inlets to flow within the mainstem Sultan River, Washington for Side Channels 1, 2, and 3. Side Channel 3 is the uppermost and 1 the lowermost of the channels.................... 4-50
Figure 4-30. Relationship of wetted surface area (ft2) within Side Channels 1, 2, and 3 in Reach 1 and flow within the mainstem Sultan, River, Washington. ................ 4-50
Figure 4-31. Flows occurring at the upstream end of Side Channels 1, 2, and 3 in Operational Reach 1 of the Sultan River, and corresponding flows in the Sultan River just upstream from the entrance to each side channel. ................ 4-51
Figure 4-32. Weighted Useable Area (WUA) (ft2/1000 ft) versus flow (cfs) relationships for Chinook, coho, pink, and chum salmon and steelhead trout spawning habitat as defined in Side Channels 1, 2, and 3 in Operational Reach 1 of the Sultan River, Washington. .......................................................................... 4-52
Figure 4-33. Percentage of maximum Weighted Useable Area (WUA) versus flow (cfs) relationships for Chinook, coho, pink and chum salmon and steelhead trout spawning habitat a as defined in Side Channels 1, 2, and 3 in Operational Reach 1 of the Sultan River, Washington......................................................... 4-53
Figure 4-34. Weighted Useable Area (WUA) (ft2/1000 ft) versus flow (cfs) relationships for Chinook and coho salmon and steelhead, rainbow and cutthroat trout juvenile rearing habitat as defined in Side Channels 1, 2, and 3 in Operational Reach 1 of the Sultan River, Washington..................................... 4-55

Sultan River Instream Flow Study – RSP 3
R2 Resource Consultants, Inc. xii March 19, 2009 1628.07/Instream Flow Report_031909
Figure 4-35. Percentage of maximum Weighted Useable Area (WUA) versus flow (cfs) relationships for Chinook and coho salmon and steelhead, rainbow, and cutthroat trout spawning habitat a as defined in Side Channels 1, 2, and 3 in Operational Reach 1 of the Sultan River, Washington..................................... 4-56

Sultan River Instream Flow Study – RSP 3
R2 Resource Consultants, Inc. xiii March 19, 2009 1628.07/Instream Flow Report_031909
TABLES Table 2-1. Existing Sultan River instream flow requirements. .......................................... 2-15
Table 2-2. Jackson Hydroelectric Project Powerhouse downramping rate schedulea
(inches/hour). .................................................................................................... 2-16
Table 2-3. Diversion Dam downramping rate schedulea. .................................................. 2-16
Table 3-1. Target flows selected for field measurement for each study reach of the Sultan River, Washington. Actual flows measured varied by location and were influenced by tributary inflow and prevailing weather conditions. ........... 3-3
Table 3-2. Dates and flows (cubic feet/sec, cfs) measured in the mainstem Sultan River, 2007, during the instream flow study. ................................................... 3-17
Table 3-3. Channel substrate grain size classifications, used for the Sultan River instream flow study........................................................................................... 3-25
Table 3-4. Species and life stages for which State Fallback Curves were applied for the Sultan River instream flow study, and rationale for use............................. 3-29
Table 3-5. Description of sub-reaches used for weighting of transects for the Sultan River instream flow study................................................................................. 3-32
Table 3-6. Transect-weighting factors used to derive reach specific habitat results from the PHABSIM analysis for the Sultan River instream flow study. GLD = glide; LGR = low gradient riffle; RPD = rapid; POOL = pool. ........... 3-33
Table 4-1. Percentages of maximum habitat area at specified flows (cfs) for Chinook, steelhead, and coho salmon life stages within Reach 3 of the Sultan River, Washington. * Note that anadromous salmonids have not been present since 1929 within Reach 3; for comparative purposes, all anadromous species were analyzed and results displayed. ..................................................... 4-4
Table 4-2. Percentages of maximum habitat area at specified flows (cfs) for rainbow and cutthroat trout life stages within Reach 3 of the Sultan River, Washington. ........................................................................................................ 4-6
Table 4-3. Comparison of median, maximum, minimum, average and percentage difference in anadromous salmonid* habitat areas provided during Wet, Average, and Dry water year types for Stage 1 and Stage 2 conditions as determined from habitat duration analysis for operational Reach 3 of the Sultan River, Washington. * Note that anadromous salmonids have not been present since 1929 within Reach 3; for comparative purposes, all anadromous species were analyzed and results displayed................................ 4-18

Sultan River Instream Flow Study – RSP 3
R2 Resource Consultants, Inc. xiv March 19, 2009 1628.07/Instream Flow Report_031909
Table 4-4. Comparison of median, maximum, minimum, average and percentage difference in resident trout habitat areas provided during Wet, Average, and Dry water year types for Stage 1 and Stage 2 conditions as determined from habitat duration analysis for operational Reach 3 of the Sultan River, Washington. ...................................................................................................... 4-19
Table 4-5. Percentages of maximum habitat area at specified flows (cfs) for Chinook and steelhead life stages within Reach 2 on the Sultan River, Washington. .... 4-22
Table 4-6. Percentages of maximum habitat area at specified flows (cfs) for chum and pink salmon life stages, as well as for rainbow and cutthroat trout life stages, within Reach 2 on the Sultan River, Washington. ................................ 4-23
Table 4-7. Comparison of median, maximum, minimum, average and percentage difference in anadromous salmonid habitat areas provided during Wet, Average, and Dry water year types for Stage 1 and Stage 2 conditions as determined from habitat duration analysis for operational Reach 2 of the Sultan River, Washington. ................................................................................ 4-32
Table 4-8. Comparison of median, maximum, minimum, average and percentage difference in resident trout habitat areas provided during Wet, Average, and Dry water year types for Stage 1 and Stage 2 conditions as determined from habitat duration analysis for operational Reach 2 of the Sultan River, Washington. ...................................................................................................... 4-33
Table 4-9. Percentages of maximum habitat area at specified flows (cfs) for Chinook, steelhead, and coho salmon life stages within Reach 1 on the Sultan River, Washington. ...................................................................................................... 4-36
Table 4-10. Percentages of maximum habitat area at specified flows (cfs) for chum and pink salmon life stages, as well as for rainbow and cutthroat trout life stages, within Reach 1 on the Sultan River, Washington. ................................ 4-37
Table 4-11. Comparison of median, maximum, minimum, average and percentage difference in anadromous salmonid habitat areas provided during Wet, Average, and Dry water year types for Stage 1 and Stage 2 conditions as determined from habitat duration analysis for operational Reach 1 of the Sultan River, Washington. ................................................................................ 4-46
Table 4-12. Comparison of median, maximum, minimum, average and percentage difference in resident trout habitat areas provided during Wet, Average, and Dry water year types for Stage 1 and Stage 2 conditions as determined from habitat duration analysis for operational Reach 1 of the Sultan River, Washington. ...................................................................................................... 4-47

Sultan River Instream Flow Study – RSP 3
R2 Resource Consultants, Inc. xv March 19, 2009 1628.07/Instream Flow Report_031909
Table 4-13. Comparison of average anadromous salmonid habitat areas provided during Wet, Average, and Dry water year types for Stage 1 and Stage 2 conditions as determined from habitat duration analysis for operational Reaches 1, 2, and 3, as well as the total of all three reaches of the Sultan River, Washington. ........................................................................................... 4-48

Sultan River Instream Flow Study – RSP 3
R2 Resource Consultants, Inc. xvi March 19, 2009 1628.07/Instream Flow Report_031909
EXECUTIVE SUMMARY
This report presents the results of the Sultan River Instream Flow Study completed by R2 Resource Consultants (R2) in accordance with Revised Study Plan 3 (RSP3). The need for the study was identified during stakeholder consultations as part of the Federal Energy Regulatory Commission (FERC) Integrated Relicensing Process (ILP) for the Henry M. Jackson Hydroelectric Project (Project) (FERC # 2157). The study focused on the following three operational reaches of the Sultan River, that are regulated to varying degrees and amounts by Project related operations:
• Operational Reach 3 – Culmback Dam to Diversion Dam: flows within this 6.8 mile reach of the Sultan River are controlled by releases from Culmback Dam, which under current operations requires a release flow of 20 cubic feet per second (cfs) directly below the dam. These minimum flow releases are supplemented via downstream flow accretion as well as tributary inflow. Because there are no upstream fish passage facilities at the Diversion Dam, anadromous salmonids are not currently present within this reach.
• Operational Reach 2 – Diversion Dam to Powerhouse: flows within this 5.4 mile reach of river under most conditions are strictly regulated to meet seasonal minimum instream flow requirements that range from 95 cfs to 175 cfs depending on season. These flows are provided via the diversion of water that first passes through two Francis turbines at the Powerhouse and then is transported through the Lake Chaplain pipeline to Lake Chaplain. Some of the water is then used for municipal supply, the remainder transported east via the original water diversion tunnel back to the Sultan River by the Diversion Dam to meet instream flow requirements.
• Operational Reach 1 – Powerhouse to Confluence: flows within the lower 4.3 mile reach of the Sultan River are controlled by releases from the Powerhouse in combination with Reach 2 flows entering the reach. Although minimum flows are specified (range from 165 to 200 cfs), in general, flows are typically higher than these due to flow releases associated with power generation. In addition to mainstem habitat, Reach 1 contains a series of side channels whose connectivity with the main river channel is influenced by flow releases.
The overall objective of the Sultan River Instream Flow Study and its component study elements was to provide a series of quantitative indices for evaluating the effects of flow related existing and alternative Project operational scenarios on resident and anadromous fish habitats within the three study reaches. As specified in RSP3, the primary analytical method used for making this evaluation was the Physical Habitat Simulation (PHABSIM) approach as described by Bovee

Sultan River Instream Flow Study – RSP 3
R2 Resource Consultants, Inc. xvii March 19, 2009 1628.07/Instream Flow Report_031909
and Milhous (1978); Bovee (1982); Bovee et al. (1998); and Stalnaker et al. (1995). Chronologically, the study involved completion of the following six steps:
1. Step 1 – Planning and Site Reconnaissance, to familiarize technical personnel with site characteristics and project operations, to select target flows, and to make a preliminary selection of transect locations;
2. Step 2 – Study Reach Delineation and Transect Selection, that included mainstem areas in Reach 3, Reach 2, and Reach 1, and side channel areas in Reach 1;
3. Step 3 – Field Data Collection, that included three trips to collect detailed depth and water velocity data from all transects under a low, mid- and high target flow condition, and two additional trips to collect supplemental water surface elevation (WSE) measurements at two higher flows;
4. Step 4 – Habitat Suitability Criteria Curve Development, that involved development and submittal of an HSC plan for review by stakeholders and agencies, collection of microhabitat data, data analysis, and derivation of modified curves for selected species;
5. Step 5 – Data Analysis and Modeling, that included hydraulic model calibrations for all transects, and subsequent derivation of species and life stage specific habitat indices (expressed as Weighted Useable Area – WUA) versus flow relationships for each site, and, based on channel widths, an estimation of the total habitat area of each species and life stage for each reach under different flow conditions; and
6. Step 6 – Time Series Analysis that linked habitat-flow relationships with hydrologic conditions involving three different flow scenarios (wet, average, and dry years), under Stage 1 (water supply project) and Stage 2 (hydroelectric Project in place) operations. The time series analysis and resulting habitat duration curves provided a means to compare effects of different project operations on the frequency and availability of habitats within the three reaches of the river.
Six mainstem study sites were established on the Sultan River from Culmback Dam to the confluence with the Skykomish River: two sites in Reach 3, two sites in Reach 2, and two in Reach 1. A total of 38 transects were identified as being broadly representative of channel characteristics and the overall composition of habitat within the mainstem Sultan River. Transects were arranged and numbered within each study site from downstream to upstream. Based on the results of detailed habitat surveys (conducted as part of RSP-18) and channel type classifications (defined as part of RSP-22), each transect was considered to be representative of a certain length of the river. River segment lengths were assigned to the nearest transect with similar channel morphology type. Three side channels located within Reach 1 were also evaluated during the study. The assessment of side channel habitats in this study focused on

Sultan River Instream Flow Study – RSP 3
R2 Resource Consultants, Inc. xviii March 19, 2009 1628.07/Instream Flow Report_031909
determining a) the relationship of habitat quantity within the side-channel to flow in the side-channel; and b) relationship of flow in mainstem river to flow in the side-channel; i.e., connectivity. A PHABSIM type analysis involving transect placement and measurement conducted in concert with the mainstem study was completed to address the flow-habitat quantity component; surveying of water surface and bed elevations at the inlets of each side channel was used to determine mainstem connectivity. Field data were collected at each transect under a series of five test flow releases. Habitat simulations were subsequently completed using the HABTAV habitat simulation modeling program. Output from the hydraulic simulation modeling was used in conjunction with modified and Fallback HSC criteria to simulate habitat conditions for selected target fish species including Chinook (Oncorhynchus tshawytscha), coho (O. kisutch), pink (O. gorbuscha), and chum (O. keta) salmon, and steelhead (O. mykiss), sea-run cutthroat (O. clarki), resident rainbow (O. mykiss) and cutthroat (O. clarki) trout. The study resulted in the development of a series of habitat-flow relationships for each operational reach of the mainstem Sultan River, as well as for the three side channels in the lower reach (Reach 1). Such relationships can serve as indices of how changes in flow may influence the quantity of habitats of various target fish species and life stages. Relative to flow connectivity in the side channels, the study also defined the relationship of mainstem flow to side channel flow and determined the amount of surface areas available in each. In addition, time series and habitat duration analysis were completed that estimated the amounts of habitat for a given species and life stage that would occur under both Stage 1 and Stage 2 conditions for three different water year types. The information provided from this study should be useful for evaluating tradeoffs relative to gains in habitat versus changes in flow both on a reach scale basis as well as for the overall system, In combination with information provided in a number of other studies, the results can also be used for identifying and evaluating potential protection, mitigation and enhancement measures.

Sultan River Instream Flow Study – RSP 3
R2 Resource Consultants, Inc. 1-1 March 19, 2009 1628.07/Instream Flow Report_031909
1. INTRODUCTION
This report presents the results of the Sultan River Instream Flow Study completed by R2 Resource Consultants (R2) in accordance with Revised Study Plan 3 (RSP3). The need for the study was identified during stakeholder consultations as part of the Federal Energy Regulatory Commission (FERC) Integrated Licensing Process (ILP) for the Henry M. Jackson Hydroelectric Project (Project) (FERC # 2157). The study is one of 21 others that were proposed by the Public Utility District No. 1 of Snohomish County (District) and the City of Everett, Washington (City), and that were approved by the FERC on October 12, 2006.1 The Sultan River Instream Flow Study was requested in 2006 by several resource agencies including the Washington Department of Fish and Wildlife (WDFW), Washington Department of Ecology (Ecology), U.S. Forest Service (USFS), National Marine Fisheries Service (NMFS), and the U.S. Fish and Wildlife Service (USFWS), as well as the Tulalip Tribes to identify the types and amounts of habitat potentially available under different flow conditions to fish species in three reaches of the Sultan River influenced by the Project operations. Depending on location, such species may include Chinook (Oncorhynchus tshawytscha), coho (O. kisutch), pink (O. gorbuscha), and chum (O. keta) salmon, steelhead (O. mykiss), sea-run cutthroat (O. clarki), resident rainbow (O. mykiss) and cutthroat (O. clarki) trout, and bull char (Salvelinus confluentus). The three reaches, which for purposes of this report have been termed Operational Reaches since the flows within each are all influenced by the Project, include Reach 3 which extends from Culmback Dam at River Mile (RM) 16.5 to the Diversion Dam at RM 9.7, Reach 2 extending from the Diversion Dam to the Powerhouse (RM 4.3), and Reach 1 from the Powerhouse to the confluence with the Skykomish River (Figure 1-1). Flows within these reaches are regulated to varying degrees and amounts by operations of the Project, which are generally described below and more specifically so in Section 2.2:
• Operational Reach 3 – Culmback Dam to Diversion Dam: flows within this 6.8 mile reach of the Sultan River are controlled by releases from Culmback Dam, which under current operations requires a release flow of 20 cubic feet per second (cfs) directly below the dam. These minimum flow releases are supplemented via downstream flow accretion
1 See Public Utility District No. 1 of Snohomish County and City of Everett. 2006. Revised Study Plans and Studies Not Proposed. Henry M. Jackson Hydroelectric Project, FERC 2157. In accordance with 18 CFR §5.13

Sultan River Instream Flow Study – RSP 3
R2 Resource Consultants, Inc. 1-2 March 19, 2009 1628.07/Instream Flow Report_031909
Figure 1-1. Site map depicting locations of Project facilities, operational reaches, and major tributaries to the Sultan River, Washington.

Sultan River Instream Flow Study – RSP 3
R2 Resource Consultants, Inc. 1-3 March 19, 2009 1628.07/Instream Flow Report_031909
as well as tributary inflow. Because there are no upstream fish passage facilities at the Diversion Dam, anadromous salmonids are not currently present within this reach.2
• Operational Reach 2 – Diversion Dam to Powerhouse: flows within this 5.4 mile reach of river under most conditions are strictly regulated to meet seasonal minimum instream flow requirements that range from 95 cfs to 175 cfs depending on season. These flows are provided via the diversion of water that first passes through two Francis turbines at the Powerhouse and then is transported through the Lake Chaplain pipeline towards Lake Chaplain. Some of the water is then used for municipal supply and released into Lake Chaplain, the remainder is transported east via the original water diversion tunnel back to the Sultan River by the Diversion Dam to meet instream flow requirements. Downstream accretion and tributary flows contribute to the total flows in this reach.
• Operational Reach 1 – Powerhouse to Confluence: flows within the lower 4.3 mile reach of the Sultan River are controlled by releases from the Powerhouse in combination with Reach 2 flows entering the reach. Although minimum flows are specified (range from 165 to 200 cfs), in general, flows are typically higher than these due to flow releases associated with power generation. Downstream accretion and tributary flows likewise contribute to the total flows in this reach. In addition to mainstem habitat, Reach 1 contains a series of side channels whose connectivity with the main river channel is influenced by flow releases.
A more detailed description of the physical and hydrologic characteristics of each reach is presented in Section 2.1; details on the fish species composition within each reach is found in Section 2.3.
1.1 STUDY OBJECTIVES
The overall objective of the Sultan River Instream Flow Study and its component study elements is to provide a series of quantitative indices for evaluating the effects of flow related existing and alternative project operational scenarios on resident and anadromous fish habitats within the three study reaches. As specified in RSP3, the primary analytical method used for making this evaluation was the Physical Habitat Simulation (PHABSIM) approach as described by Bovee and Milhous (1978); Bovee (1982); Bovee et al. (1998); and Stalnaker et al. (1995). This method provides a means to incrementally evaluate changes in the amount of habitat of different fish species and life stages resulting from changes in flow, and has been widely used in assessing flow regulation effects associated with hydroelectric projects (Annear et al. 2004). 2 The feasibility of providing upstream passage at the Diversion Dam is the subject of RSP20 the results of which are presented in CH2M HILL 2008a. Fish passage feasibility at the Sultan River Diversion Dam, Phase 2, Fish Passage Assessment, Draft Report. Prepared for Public Utility District No. 1 of Snohomish County.

Sultan River Instream Flow Study – RSP 3
R2 Resource Consultants, Inc. 1-4 March 19, 2009 1628.07/Instream Flow Report_031909
The study was designed to assist in answering the following technical questions related to evaluating operational and flow regulatory effects of the Project on fish populations in the Sultan River:
• What are the species and lifestage specific habitat – flow relationships in each of the three mainstem reaches?
• How much habitat of a given fish species and life stage is available in each of the three mainstem reaches under existing operations and instream flow requirements of the Project?
• How much habitat of a given fish species and life stage would be available in each reach of the three mainstem reaches if the Project was not in place?
• What are the incremental gains or losses of habitat for a given fish species and life stage corresponding to incremental flow increases in each reach above those provided under existing operations?
• How much anadromous salmonid habitat would be available in Reach 3 under varying flow conditions if fish passage facilities were provided?
• What mainstem flows in Reach 1 provide connectivity to adjoining side channel areas?
• What are the species and life stage specific habitat – flow relationships in side channel areas associated with Reach 1?
1.2 LINKAGES TO OTHER STUDIES
The Sultan River Instream Flow Study is closely linked to and has relied on results from a number of other RSPs, including and in particular the following:
• Stillwater Sciences and Meridian Environmental. 2008a. Study Plan 18: Riverine, Riparian and Wetland Habitat Assessment of the Sultan River below Culmback Dam, technical report. Prepared for Snohomish County Public Utility District No. 1 and City of Everett.
- RSP3 utilized habitat mapping results generated from RSP18.
• R2 Resource Consultants. 2008a. Study Plan 23. Indicators of Hydrologic Alteration/Range of Variability Analysis (IHA/RVA) in the Sultan River Downstream of Culmback Dam. Prepared for Public Utility District No. 1 of Snohomish County and City of Everett.

Sultan River Instream Flow Study – RSP 3
R2 Resource Consultants, Inc. 1-5 March 19, 2009 1628.07/Instream Flow Report_031909
- RSP3 relied on hydrologic data and analysis generated from RSP23.
• R2 Resource Consultants. 2008b. Study Plan 5. Juvenile Fish Occurrence Life History and Distribution, Progress Report. Prepared for Public Utility District No. 1 of Snohomish County.
- RSP3 relied on selected fish distribution data being collected as part of RSP5 for confirming habitat utilization within Reaches 2 and 1 and adjoining side channels.
• Stillwater Sciences and Meridian Environmental. 2008b. Study Plan 22: Sultan River Physical Process Studies, draft technical report. Prepared for Snohomish County Public Utility District No. 1.
- RSP22 provides a physical process – flow relationship context that will need to be considered in addition to the habitat – flow relationship context provided in RSP3.
Results from RSP3 have or will provide input to several other studies associated with evaluating habitat – flow considerations within the different reaches of the Project. These include:
• CH2M HILL. 2008a. Fish Passage Feasibility at the Sultan River Diversion Dam, Phase 2, Fish Passage Assessment, Relicensing Study Plan No. 20. Draft report. Prepared for Public Utility District No. 1 of Snohomish County.
- Results of habitat-flow modeling within Reach 3 from RSP3 provided input to RSP20 for estimating potential anadromous salmonid production within the reach if upstream fish passage facilities were provided.
• CH2M HILL. 2008b. Water Quality Parameter Study. Relicensing Study Plan No. 1. Draft report. Prepared for Public Utility District No. 1 of Snohomish County.
- Results of hydraulic modeling within Reach 3 from RSP3 provided input to RSP1 for developing an SNTEMP temperature model for evaluating flow – temperature relationships and potential effects on anadromous salmonid production within the reach if upstream fish passage facilities were provided.
• Confluence Research and Consulting. 2008. Flow Recreation Study. Study Plan No. 14. Draft report. Prepared for Public Utility District No. 1 of Snohomish County.
- Results of RSP3 can be used in evaluating potential effects of whitewater boating flows on fish habitats within each of the study reaches.

Sultan River Instream Flow Study – RSP 3
R2 Resource Consultants, Inc. 1-6 March 19, 2009 1628.07/Instream Flow Report_031909
Although linkages exist between this study and those noted above, this report does not attempt to synthesize the results of these into an overall assessment of flow related effects of the Project on each of the individual study elements. The synthesis of that information will be completed and presented in the Preliminary License Proposal.
1.3 REPORT ORGANIZATION AND CONTENT
Organizationally, the report contains five main sections:
• Section 1 – INTRODUCTION (this section): provides the context for the study, lists study questions and objectives, and describes linkages to other studies.
• Section 2 – BACKGROUND: provides important background information relevant to the Project including: a Description of the study area and study reaches; a review of important fishery resources within the basin that includes distribution and life history information; a review of the Project’s facilities and operations and how these influence flow conditions within each reach; a discussion of the Sultan River hydrology both with and without the Project in place; and a discussion of the current instream flow requirements mandated under the existing license, and a brief summary of studies that resulted in the specified flows.
• Section 3 – METHODS: describes the six (6) steps involved in completing the study including Step 1 – Site Reconnaissance; Step 2 – Study Reach Delineation and Transect Selection; Step 3 – Field Data Collection; Step 4 – Habitat Suitability Criteria Curve Development; Step 5 – Modeling; and Step 6 – Time Series Analysis.
• Section 4 – HABITAT MODELING: presents the overall results of the habitat modeling and times series analysis. The section is organized first by presenting the PHABSIM results for the three mainstem reaches on a site, species, and life stage basis followed by a wet, normal, and dry time series analysis with and without the Project in place; and then results for the side channels that includes surface area, lineal, and PHABSIM estimates.
• Section 5 – SUMMARY AND DISCUSSION.
• Section 6 – REFERENCES.
The report also contains the following appendices:
– Appendix A – Transect Selection Presentation – June 12, 2008
– Appendix B – Target Flow Memorandum – June 11, 2007

Sultan River Instream Flow Study – RSP 3
R2 Resource Consultants, Inc. 1-7 March 19, 2009 1628.07/Instream Flow Report_031909
– Appendix C – Habitat Suitability Criteria (HSC) – includes a) Proposed Habitat Suitability Criteria (HSC) Curves for Application in Habitat-Flow Modeling for the Sultan River Instream Flow Study – RSP 3, June 5, 2008; b) Technical Memorandum: Sultan River Instream Flow Study – HSC Preference Analysis and Revised Steelhead and Chinook Curves, July 31, 2008; c) HSC curves used in habitat-flow modeling
– Appendix D – Habitat:Flow Relationships and Time Series Analysis
– Appendix E – Transect Photographs
– Appendix F – Transect Cross Sectional Profiles and Model Calibration Details
– Appendix G – Field Notes

Sultan River Instream Flow Study – RSP 3
R2 Resource Consultants, Inc. 2-1 March 19, 2009 1628.07/Instream Flow Report_031909
2. BACKGROUND INFORMATION
This section presents important background information that describes the physical, biological, hydrologic, and operational setting of the instream flow study. Such information is needed in order to understand the rationale behind the methods and analysis used in completing the study, and as well, to facilitate the interpretation of study results.
2.1 DESCRIPTION OF STUDY AREA AND STUDY REACHES
The Henry M. Jackson Project is located on the Sultan River, approximately 24 miles east of Everett, Washington, in south central Snohomish County. From its headwaters near Vesper Peak on the western slope of the Cascade Mountains, the Sultan River flows west for approximately 19 miles, then south-southwest for 11 miles to its confluence with the Skykomish River at the City of Sultan (RM 34.4). The Skykomish River drains the northern 835 square miles of the Snohomish River Basin, the second largest river basin draining into Puget Sound (Haring 2002). The basin is bounded on the east by the Cascade Mountains, on the north and south by lateral ridges extending westward from the Cascade crest, and on the west by the Puget Sound lowlands. Elevations in the basin range from the 6,617-foot summit of Del Campo Peak to 130 feet at the confluence of the Sultan and Skykomish rivers. Major tributaries to the Sultan River above Culmback Dam include the South Fork Sultan River, North Fork Sultan River, Elk Creek, and Williamson Creek. Downstream of Culmback Dam, major tributaries include Big Four Creek, Marsh Creek, Chaplain Creek, Woods Creek (drains Woods Lake), Ames Creek, and Winters Creek (Figure 1-1). In the headwaters upstream from Elk Creek (RM 22.8), the Sultan River flows through a narrow steep-sloped, densely forested valley. The river channel is relatively steep and narrow, containing numerous small falls, cascades, and rapids, and a few short pool-riffle stretches. From Elk Creek downstream to Spada Lake (formed by Culmback Dam), the channel gradient is moderate with only a few steep areas. Downstream of Culmback Dam (RM 16.5), the Sultan River flows through a deep gorge for nearly 14 miles. The steep side slopes above the channel are densely forested with conifer and mixed deciduous growth. The river channel in this reach is relatively high gradient and confined, containing numerous cascades and rapids separated by short pool-riffle, stretches. Much of the streambank is sheer rock face or large rock cuts (Williams et al. 1975). The City’s Diversion Dam at RM 9.7 historically directed a portion of the river’s flow to the City’s water supply reservoir, Lake Chaplain. While that method of diversion remains in place and is used

Sultan River Instream Flow Study – RSP 3
R2 Resource Consultants, Inc. 2-2 March 19, 2009 1628.07/Instream Flow Report_031909
when maintenance of the Project or other reasons require, water now is normally supplied to Lake Chaplain through the Lake Chaplain pipeline after passing through the Project Powerhouse (RM 4.6). Near RM 3, the Sultan River emerges from the canyon reach onto a broad, relatively flat valley floor containing intermittent stands or strips of deciduous trees, underbrush, and some mixed conifers. The river channel in this reach has a moderate gradient with a number of split channel sections.
2.1.1 Study Area
For relicensing purposes, the Study Area as defined by the District includes approximately 16.5 miles of the Sultan River from Culmback Dam to its confluence with the Skykomish River. In general, the Sultan River from Culmback Dam to its confluence travels through three distinct process reaches (PR) based on physical characteristics and topographic features (see Figure 2-1, page 7 in Stillwater Sciences and Meridian Environmental 2008b). These include the lowermost process reach (PR 1) comprised of a low gradient alluvial valley that includes a broad floodplain (RM 0 to 3), a terrace bounded valley process reach (PR 2) extending from RM 3 to RM 11, and a relatively high gradient V-shaped valley reach (PR 3) from RM 11 to RM 16.5. Side channels are prevalent in the alluvial valley reach area as a result of vegetation encroachment into areas that were once part of the active channel (RSP 22). Land ownership within the Study Area consists of a mixture of federal, state, and local government, and private holdings. Land use activities in the Project Area are predominately timber production and forest recreation with a limited amount of agricultural and rural residential development. As noted above, there are two dams in the Sultan River Basin – Culmback Dam and the City of Everett’s Diversion Dam (Figure 1-1). Culmback Dam is located at RM 16.5 and forms Spada Lake which has a storage capacity of 153,260 acre-feet. The water stored in Spada Lake is used for hydroelectric generation, municipal water supply, and to meet instream flow requirements downstream of Culmback Dam. The Diversion Dam is located at RM 9.7 and creates a small headpond measuring only a few acres in size. Both of these dams preclude upstream fish passage. Additional information on operation of these facilities and the effect on flows in the Sultan River can be found in RSP 23 (R2 2008a).
2.1.2 Sultan River Study Reaches
Operationally, and for purposes of this study, the Sultan River has been divided into three reaches (Operational Reaches), demarcated by physical structures that serve to regulate flows within the system. For consistency between relicensing studies, descriptions of operational

Sultan River Instream Flow Study – RSP 3
R2 Resource Consultants, Inc. 2-3 March 19, 2009 1628.07/Instream Flow Report_031909
reaches and channel characteristics of each reach have borrowed heavily from RSP 18 (Stillwater Sciences and Meridian Environmental 2008a), RSP 22 (Stillwater Sciences and Meridian Environmental 2008b), and the Pre-Application Document (PAD) (PUD #1 of Snohomish County and City of Everett 2005). Figures 1-1 and 2-1 illustrate the geographic location of each of the operational reaches.
SpadaLake
LakeChaplain
CulmbackDam
Powerhouse
DiversionDam
Sultan RiverReach 3
Sultan RiverReach 2
Sultan RiverReach 1
SkykomishRiver
Figure 2-1. Study reaches (Operational Reaches) 1, 2, and 3 on the Sultan River, Washington
below Culmback Dam.
2.1.2.1 Operational Reach 3
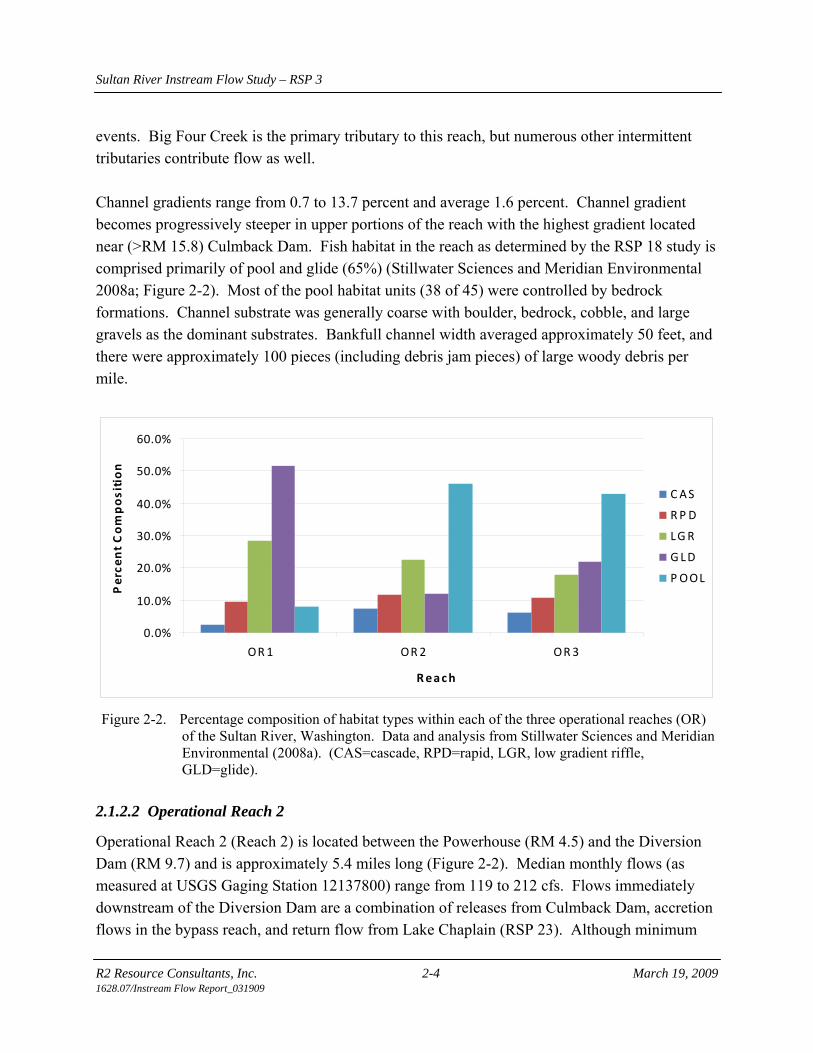
The upstream most Operational Reach (Reach 3) extends for approximately 6.8 miles from Culmback Dam (RM 16.5) to the Diversion Dam (RM 9.7). Reach 3 is referred to as the bypass reach and is best described as a high gradient, highly confined bedrock gorge characterized by higher rates of sediment transport compared to subsequent downstream reaches. Flows in Reach 3 are generally controlled by releases from Culmback Dam with a year-round minimum instream flow release of 20 cfs. Lateral inflows (side flows) can be significant during short duration storm
Sultan River Instream Flow Study – RSP 3
R2 Resource Consultants, Inc. 2-4 March 19, 2009 1628.07/Instream Flow Report_031909
events. Big Four Creek is the primary tributary to this reach, but numerous other intermittent tributaries contribute flow as well. Channel gradients range from 0.7 to 13.7 percent and average 1.6 percent. Channel gradient becomes progressively steeper in upper portions of the reach with the highest gradient located near (>RM 15.8) Culmback Dam. Fish habitat in the reach as determined by the RSP 18 study is comprised primarily of pool and glide (65%) (Stillwater Sciences and Meridian Environmental 2008a; Figure 2-2). Most of the pool habitat units (38 of 45) were controlled by bedrock formations. Channel substrate was generally coarse with boulder, bedrock, cobble, and large gravels as the dominant substrates. Bankfull channel width averaged approximately 50 feet, and there were approximately 100 pieces (including debris jam pieces) of large woody debris per mile.
0.0%
10.0%
20.0%
30.0%
40.0%
50.0%
60.0%
OR1 OR2 OR3
Reach
Perce
nt Composition
CAS
RP D
LGR
GLD
POOL
Figure 2-2. Percentage composition of habitat types within each of the three operational reaches (OR)
of the Sultan River, Washington. Data and analysis from Stillwater Sciences and Meridian Environmental (2008a). (CAS=cascade, RPD=rapid, LGR, low gradient riffle, GLD=glide).
2.1.2.2 Operational Reach 2
Operational Reach 2 (Reach 2) is located between the Powerhouse (RM 4.5) and the Diversion Dam (RM 9.7) and is approximately 5.4 miles long (Figure 2-2). Median monthly flows (as measured at USGS Gaging Station 12137800) range from 119 to 212 cfs. Flows immediately downstream of the Diversion Dam are a combination of releases from Culmback Dam, accretion flows in the bypass reach, and return flow from Lake Chaplain (RSP 23). Although minimum

Sultan River Instream Flow Study – RSP 3
R2 Resource Consultants, Inc. 2-5 March 19, 2009 1628.07/Instream Flow Report_031909
flows in this reach range between 95 and 175 cfs (Section 2.2) lateral inflows can be significant during short duration storm events. Reach 2 is largely confined within a narrow, deep canyon with channel gradients ranging from 0.7 to 3.4 percent. Marsh Creek enters from the east and is the major tributary to this section of the river. Of note is that on December 11, 2004, a landslide occurred within a narrow canyon segment of the river just downstream from Marsh Creek at RM 7.6. The landslide, often referred to as the Marsh Creek landslide, presumably, at least temporarily blocked or reduced the upstream passage success of adult anadromous salmonids. Since then, the characteristics and geometry of the landslide have changed to where the results of a recent study (Ruggerone 2008) now suggest that steelhead, Chinook and coho salmon could potentially swim through the existing cascade when minimum flows are about 107 cfs. However, analysis indicated that pink and chum salmon would still not likely be able to pass through this area. Results of the habitat mapping surveys conducted in 2007 indicated a habitat composition comprised of pools (45.9%), low gradient riffles (22.7%), rapids and glides (11.9% each), and cascades (7.5%) (Stillwater Sciences and Meridian Environmental 2008a) (Figure 2-2). More than two-thirds (43 of 60) of the pool habitat units were controlled by bedrock and boulder substrates. Channel substrates were comprised primarily of boulder, bedrock, cobble, and large gravels. Bankfull channel width averaged nearly 70 feet, and there were just slightly over 160 pieces (including debris jams) of large woody debris per mile (Stillwater Sciences and Meridian Environmental 2008a).
2.1.2.3 Operational Reach 1
Operational Reach 1 (Reach 1) extends approximately 4.3 miles from the confluence with the Skykomish River upstream to the Powerhouse (Figure 2-1). Median monthly flows under existing conditions (as measured at USGS Gaging Station 12138160) range from 219 to 1,442 cfs. Flows immediately downstream of the Powerhouse are a combination of releases from the Diversion Dam, releases from the Powerhouse, and accretion flows in Reach 2. Low flows generally occur in August and September and peak flows occur in November. The upstream most 1.6 miles (referred to as Reach 1B in the PAD) of the reach are deeply incised and largely confined within a bedrock canyon. Widths in this section range from 40 to 160 feet and channel gradients range from 0.7 to 2.9 percent. The downstream most 2.7 miles of the reach (referred to as Reach 1A in the PAD) are largely unconfined with a broad floodplain and a number of split channel sections. Channel gradients

Sultan River Instream Flow Study – RSP 3
R2 Resource Consultants, Inc. 2-6 March 19, 2009 1628.07/Instream Flow Report_031909
range from 0.2 to 0.7 percent. There are three major (>1,000 feet-long) and several minor side channels located within the reach. Channel widths range from 60 to over 200 feet. Fish habitat within Reach 1 was comprised of glide (51.7%) followed by low gradient riffles (28.4%), rapid (9.6%), pool (8%), and cascades (2.3%) (Stillwater Sciences and Meridian Environmental 2008a) (Figure 2-2). Channel substrate in the lower portion of Reach 1 was predominately large and small cobble, coarse gravel, and boulder. The number of large woody debris pieces was much lower than the two upstream reaches with fewer than 60 pieces (including debris jams) per mile.
2.2 PROJECT FACILITIES AND CURRENT OPERATIONS
Major facilities of the Project and their influence on the flow conditions within the different operational reaches of the river are presented in this section. Much of the information has been taken directly from various portions of Section 4 of the PAD (Public Utility District No. 1 of Snohomish County and City of Everett 2005).
2.2.1 Project Facilities
2.2.1.1 Culmback Dam Culmback Dam, located at RM 16.5 on the Sultan River, has a crest elevation of 1,470 feet msl (Figure 2-3). The crest of the dam is 25 feet wide, 640 feet long, and is 262 feet above the original streambed. A concrete morning glory spillway, with an inside diameter of 38 feet, is located within the reservoir approximately 250 feet from the right bank. This spillway has a 94-foot diameter ogee crest, vertical shaft, and a horizontal tunnel section. The morning glory spillway crest elevation is at 1,450 feet msl and is designed to pass the probable maximum flood of 57,790 cfs at elevation 1,464.6 feet, or 5.4 feet below the crest of the dam. Reservoir outlet works consist of two 48-inch-diameter conduits embedded in the concrete plug of the diversion tunnel that join the horizontal tunnel section of the spillway. The downstream ends of the conduits are equipped with three slide gate valves (two 42-inch and one 48-inch) and one 48-inch Howell Bunger valve. A 16-inch diameter pipeline runs through the right side of the dam at elevation 1,408 feet, then along its downstream face. This pipeline provides 20 cfs minimum flow releases when the spillway tunnel is dewatered for maintenance or safety inspections. Normal flow releases are accomplished through a 10-inch cone valve piped upstream of the 48-inch Howell Bunger valve. A 60 kilowatt (kW) turbine generator in the dam outlet works provides onsite electrical power and contributes about 5 cfs to the reach below Culmback Dam. The total flow released by the 10-inch cone valve and the 60 kW turbine generator is 20 cfs. The Powerhouse intake structure is located near the left abutment, approximately 250 feet upstream of the dam. The 110-foot-tall concrete structure has three 20-foot moveable panels. Positioning

Sultan River Instream Flow Study – RSP 3
R2 Resource Consultants, Inc. 2-7 March 19, 2009 1628.07/Instream Flow Report_031909
of these panels allows the selective withdrawal of stored water from various depths to facilitate the control of water temperature in the Sultan River below the Powerhouse and the Diversion Dam.
Figure 2-3. Aerial view of Culmback Dam
which forms upper extent of Operational Reach 3 of the Sultan River. Photo from PAD (Public Utility District No. 1 of Snohomish County, and City of Everett).
2.2.1.2 Diversion Dam The Sultan River Diversion Dam has been in place since 1930, and was originally used to divert water from the Sultan River into Lake Chaplain for the City of Everett’s water supply. It is a concrete ogee crest gravity structure that is 25 feet high and 120 feet wide (Figure 2-4). The Diversion Dam creates only a small headpond measuring a few acres in size. Water from Portal 2, which is located at Lake Chaplain, flows into the forebay and is measured through a weir in the main sluice gate. All flow below 280 cfs is routed through this weir. Higher flows are passed over the 120-foot-wide concrete spillway. There are no upstream or downstream fish passage facilities at the Diversion Dam.

Sultan River Instream Flow Study – RSP 3
R2 Resource Consultants, Inc. 2-8 March 19, 2009 1628.07/Instream Flow Report_031909
Figure 2-4. Photographs of Diversion Dam (upper photo and inset photo) and Henry
M. Jackson Powerhouse (lower photo) on Sultan River, Washington.
Sultan River Instream Flow Study – RSP 3
R2 Resource Consultants, Inc. 2-9 March 19, 2009 1628.07/Instream Flow Report_031909
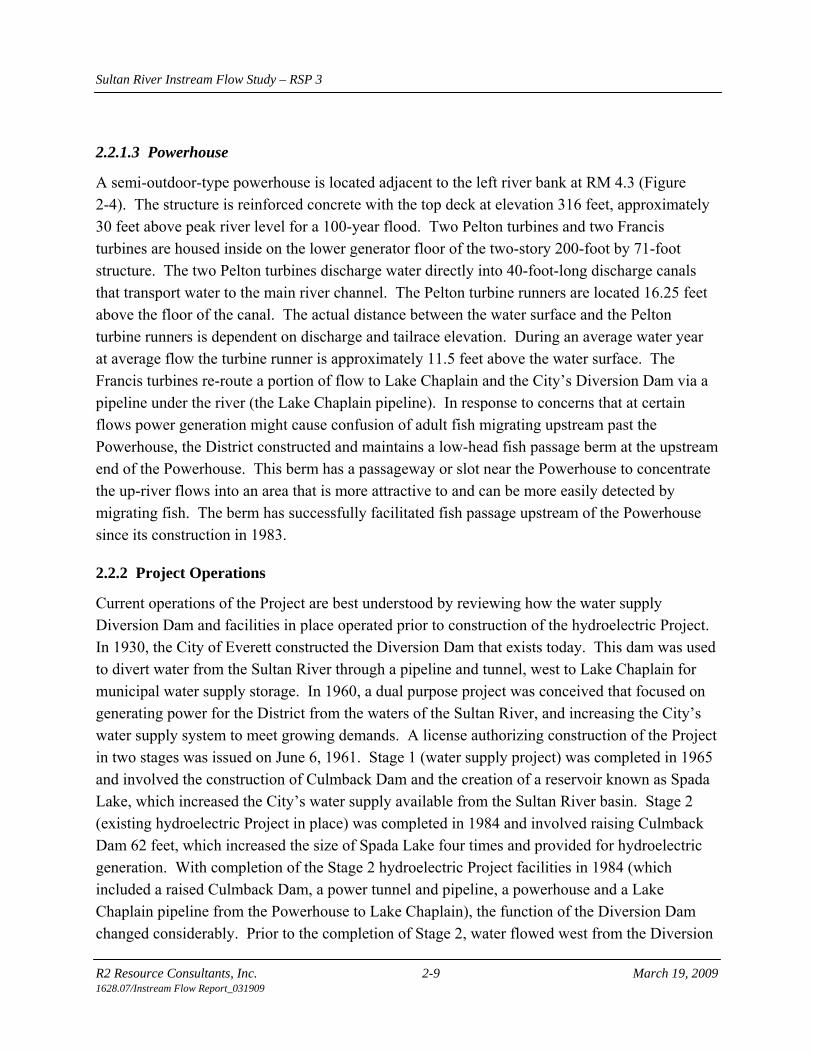
2.2.1.3 Powerhouse
A semi-outdoor-type powerhouse is located adjacent to the left river bank at RM 4.3 (Figure 2-4). The structure is reinforced concrete with the top deck at elevation 316 feet, approximately 30 feet above peak river level for a 100-year flood. Two Pelton turbines and two Francis turbines are housed inside on the lower generator floor of the two-story 200-foot by 71-foot structure. The two Pelton turbines discharge water directly into 40-foot-long discharge canals that transport water to the main river channel. The Pelton turbine runners are located 16.25 feet above the floor of the canal. The actual distance between the water surface and the Pelton turbine runners is dependent on discharge and tailrace elevation. During an average water year at average flow the turbine runner is approximately 11.5 feet above the water surface. The Francis turbines re-route a portion of flow to Lake Chaplain and the City’s Diversion Dam via a pipeline under the river (the Lake Chaplain pipeline). In response to concerns that at certain flows power generation might cause confusion of adult fish migrating upstream past the Powerhouse, the District constructed and maintains a low-head fish passage berm at the upstream end of the Powerhouse. This berm has a passageway or slot near the Powerhouse to concentrate the up-river flows into an area that is more attractive to and can be more easily detected by migrating fish. The berm has successfully facilitated fish passage upstream of the Powerhouse since its construction in 1983.
2.2.2 Project Operations
Current operations of the Project are best understood by reviewing how the water supply Diversion Dam and facilities in place operated prior to construction of the hydroelectric Project. In 1930, the City of Everett constructed the Diversion Dam that exists today. This dam was used to divert water from the Sultan River through a pipeline and tunnel, west to Lake Chaplain for municipal water supply storage. In 1960, a dual purpose project was conceived that focused on generating power for the District from the waters of the Sultan River, and increasing the City’s water supply system to meet growing demands. A license authorizing construction of the Project in two stages was issued on June 6, 1961. Stage 1 (water supply project) was completed in 1965 and involved the construction of Culmback Dam and the creation of a reservoir known as Spada Lake, which increased the City’s water supply available from the Sultan River basin. Stage 2 (existing hydroelectric Project in place) was completed in 1984 and involved raising Culmback Dam 62 feet, which increased the size of Spada Lake four times and provided for hydroelectric generation. With completion of the Stage 2 hydroelectric Project facilities in 1984 (which included a raised Culmback Dam, a power tunnel and pipeline, a powerhouse and a Lake Chaplain pipeline from the Powerhouse to Lake Chaplain), the function of the Diversion Dam changed considerably. Prior to the completion of Stage 2, water flowed west from the Diversion

Sultan River Instream Flow Study – RSP 3
R2 Resource Consultants, Inc. 2-10 March 19, 2009 1628.07/Instream Flow Report_031909
Dam through the tunnel to Lake Chaplain; post-Stage 2, water now flows east through the tunnel between Lake Chaplain and the Diversion Dam. Some of the water diverted from Spada Lake at Culmback Dam is now returned to the Sultan River at the Diversion Dam to provide minimum instream flows below that point for fishery protection and enhancement. Under current operations, 20 cfs of water is released from Culmback Dam into Reach 3 at all times. The rest of the water diverted from Spada Lake travels through the power tunnel and power pipeline to the Powerhouse. Most of the water delivered to the Powerhouse passes through the Pelton turbines and is returned to the river. However, an amount of water necessary for municipal supply and maintenance of minimum instream flows in the reach below the Diversion Dam is routed through two Francis turbines in the Powerhouse and then through the Lake Chaplain pipeline to the “Portal 2” facilities on the shores of Lake Chaplain. At Lake Chaplain, a portion of the water in the Lake Chaplain pipeline is diverted by means of the “Portal 2” facilities to the lake for municipal water supply. The remainder is transported east via the original water diversion tunnel back to the Sultan River at the Diversion Dam to provide minimum instream flows in the reach between the Diversion Dam and the Powerhouse (Reach 2). As noted above, prior to the Stage 2 raising of Culmback Dam and construction of the hydroelectric facilities completed in 1984, Sultan River flows were diverted by the City’s Diversion Dam in a westerly direction through the tunnel into Lake Chaplain to meet the City of Everett’s municipal water supply needs. Under existing normal project operations, flows through the diversion tunnel are now reversed. Water from Spada Lake can generate power and be transported by pipeline back up to Lake Chaplain and the Diversion Dam because Spada Lake is approximately 700 feet higher in elevation than Lake Chaplain and the Diversion Dam. Occasionally, when storm events cause natural inflows within the reach between Culmback Dam and the City’s Diversion Dam to exceed the combined total flows needed to meet both the City’s water supply requirements and established minimum instream flows below the Diversion Dam, the Diversion Dam will be made to operate in its original manner. At these times, water for municipal supply will be diverted from the Sultan River by the Diversion Dam and routed westerly through the tunnel to Lake Chaplain. Remaining flows in the river are allowed to pass over the Diversion Dam to provide required instream flows into Reach 2. The Powerhouse then routes water diverted from Spada Lake through only the larger Pelton units for more efficient power generation, and then immediately returns the water to the river (Figure 2-5).

Sultan River Instream Flow Study – RSP 3
R2 Resource Consultants, Inc. 2-11 March 19, 2009 1628.07/Instream Flow Report_031909
Figure 2-5. Schematic of Jackson Hydroelectric Project depicting flow directions during high flow or
shutdown operations. Figure from PAD (2005). Should the Project power pipeline, power tunnel, or Powerhouse be shut down for any reason, the Diversion Dam and tunnel can be operated in their traditional (Stage 1) manner to divert and carry flows from the Sultan River to Lake Chaplain. During this shutdown operation, sufficient flows are released from Culmback Dam to supply the required instream flows at the Powerhouse and water flows to Lake Chaplain. Project operations have altered the seasonal flow pattern in the Sultan River as depicted in Figure 2-6). The reservoir rule curves (Figure 2-7) are shaped to minimize spill (uncontrolled release of water via the spillway) and provide storage of spring runoff for municipal water supply and instream flow augmentation later in the year during the driest months. With the same total volume of runoff from basin rainfall and snow melt, the historically higher peak flows in the lower Sultan River that occurred previously in late fall, early winter, and spring have been reduced in both amplitude and frequency. Total volume of flow below the Diversion Dam is

Sultan River Instream Flow Study – RSP 3
R2 Resource Consultants, Inc. 2-12 March 19, 2009 1628.07/Instream Flow Report_031909
Figure 2-6. Sultan River average monthly flows, Stage 1 vs. Stage 2 (data have been
standardized by drainage area and adjusted for withdrawals). Figure from the PAD (2005).
Figure 2-7. Spada Lake operational rule curves. Figure from the PAD (2005).

Sultan River Instream Flow Study – RSP 3
R2 Resource Consultants, Inc. 2-13 March 19, 2009 1628.07/Instream Flow Report_031909
reduced by withdrawals for municipal water supply, which averaged 129 cfs in water year 2004. This pre-existing right for municipal water withdrawals is not an impact of the existing Project operations. The rule curves divide Spada Lake into four states that shift throughout the water year (July through June). This operational water year is used to minimize reservoir storage changes from one year to the next. The rule curves allow the Project to provide incidental winter flood storage, municipal water supply, instream flows, and higher summer lake levels for recreation. In States 1 and 2, the Project is required to discharge 1,300 cfs into the Sultan River. In State 4, the Project is operated to maintain Lake Chaplain within a specified range of elevations and to provide required minimum fishery flows below the Diversion Dam and Powerhouse. State 3 is a “discretionary” zone where the Project may be operated between the extremes of States 2 and 4, depending on the needs for power generation and subject to limitations on ramping rates and frequency. In the context of relicensing the hydroelectric Project and for purposes of this study, the two project stages noted above represent Stage 1 or baseline conditions, and Stage 2 conditions. Specifically, Stage 1 conditions represent flow conditions absent the hydroelectric Project but with operation of the water supply; project conditions (also termed “Stage 2 Conditions”) represent those existing with the hydroelectric Project.
2.2.3 Instream Flow Studies and Flow Releases
There have been three previous instream flow studies conducted in the Sultan River commencing with the earliest in 1967 completed in Reach 1, followed by a 1978-1979 study in Reach 2, and a 1980 study completed in Reach 3. The 1967 study in Reach 1 was conducted by the Washington Department of Fisheries (WDF, now WDFW) mainly to determine fishery needs in the lower three miles of the river below the canyon section (Magee 1967). The method used was developed by WDF in the 1950s, and consisted of making discharge measurements at typical spawning sections in the river selected by biologists, and relating these discharge measurements to the depth and mean column velocities with optimum depth range and optimum velocity range criteria as determined for various species. The results of that study indicated that a minimum of 200 cfs and 165 cfs were needed for salmon spawning and rearing, respectively. Because of this, minimum flows below the Powerhouse during Chinook salmon spawning (September 15 to November 1) are maintained at or above 200 cfs. During the remainder of the year, instream flows are maintained at or above 165 cfs.

Sultan River Instream Flow Study – RSP 3
R2 Resource Consultants, Inc. 2-14 March 19, 2009 1628.07/Instream Flow Report_031909
The Reach 2 instream flow study that was completed in 1978 and 1979 was conducted by WDF, Washington Department of Game, and Eicher Associates, Inc. The study employed a “useable width” methodology in the reach of river between RM 4.3 and 9.7 (Easterbrooks and Gerke 1978). The primary objective of this study was to determine the spawning and rearing flows needed to protect Chinook and coho salmon and winter-run steelhead trout downstream of the Diversion Dam. Stream depth, velocity, and substrate data were collected along six transects at known Chinook, coho, and steelhead spawning locations (at four different target flows – 200, 150, 100, and 50 cfs). Based on the results of this analysis, WDF determined the optimum Chinook salmon spawning flow to be 175 cfs, and the optimum coho salmon spawning flow to be 108 cfs (as measured at the Chaplain Creek USGS gage) (Easterbrooks and Gerke 1978). Rearing flows were determined to be adequate at 100 cfs. Steelhead spawning flows were determined to be adequate at 175 cfs and steelhead rearing flows were determined adequate at 100 cfs. During the summer of 1980, the District completed a cooperative instream flow study within Reach 3 of the Sultan River (R.W. Beck 1980). The objective of the study was to evaluate habitat availability for resident trout and steelhead life stages in response to incremental changes in river discharge, and to compare historic river discharges to those expected under proposed operations of the Project. The study was completed using the USFWS’s Instream Flow Incremental Methodology (IFIM) (Bovee and Milhous 1978). Based in part on the results of these three studies, as well as a fish production simulation model, a river water temperature study conducted below Culmback Dam by the District, and a power generation model developed by the District, a Settlement Agreement was made in 1982 with the WDFW, NMFS, and Tulalip Tribes (the “Joint Agencies”). This agreement established three controlled flow discharge points for fish flow releases on the Sultan River, which coincidentally correspond to the upstream most points of each of the three operational reaches of this study: Culmback Dam (RM 16.5), the Diversion Dam (RM 9.7) and at the Powerhouse (RM 4.3). Under current operations, a constant minimum flow of 20 cfs is released from Culmback Dam into the reach of the Sultan River extending to the Diversion Dam (Reach 3) (Table 2-1). Accretion flows within this reach can be quite variable ranging from about 10 to 1,200 cfs, depending on precipitation. Big Four Creek is the principal tributary in this reach. Between the Diversion Dam and the Project Powerhouse (Reach 2), a minimum flow of from 95 to 175 cfs is required to support fishery resources as determined by the Joint Agencies. This level varies seasonally (see Section 2.3), with flows supplied primarily by return flow using the Lake Chaplain pipeline. The principal tributaries in this reach are Marsh Creek and Chaplain Creek. From the Powerhouse to the Sultan’s confluence with the Skykomish River (Reach 1), minimum

Sultan River Instream Flow Study – RSP 3
R2 Resource Consultants, Inc. 2-15 March 19, 2009 1628.07/Instream Flow Report_031909
flow requirements range from 165 to 200 cfs. Three principal tributaries, Woods Creek, Ames Creek, and Winters Creek, contribute flow to this reach.
2.2.4 Downramping Rates
The District has evaluated the effects of the Project’s related downramping rates on juvenile salmonids in Reach 2 (below the Diversion Dam) and Reach 1 (below the Powerhouse) and has implemented specific downramping rates below all facilities to minimize potential fish stranding within the respective reaches. These rates are displayed in Tables 2-2 and 2-3 for Reaches 1 and 2 respectively. Although no studies were specifically conducted for Reach 3, the District regulates any Project associated flow releases in a manner consistent with these downramping rates. The District does not plan to modify operations of the Project that would result in changes to these downramping rates, and therefore no ramping rates studies were completed as part of this study. Table 2-1. Existing Sultan River instream flow requirements.
Dates Point of Discharge Minimum Flow (cfs)
All Year Culmback Dama 20
11/1 – 1/15 Diversion Damb 95
1/16 – 2/28 Diversion Damb 150
3/1 – 6/15 Diversion Damb 175
6/16 – 9/14 Diversion Damb 95
9/15 – 9/21 Diversion Damb 145
9/22 – 10/31 Diversion Damb 155
6/16 – 9/14 Powerhouseb 165
9/15 – 6/15 Powerhouseb 200c a Cone valve discharge verified by the U.S. Geological Survey on August 28, 1990. b Telemetry gages are installed immediately below the Diversion Dam and Powerhouse to monitor these flows. c If flows exceed 400 cfs during the Chinook spawning period (September 15 to October 15), the District increases
minimum flows during the subsequent incubation period to protect spawning redds.

Sultan River Instream Flow Study – RSP 3
R2 Resource Consultants, Inc. 2-16 March 19, 2009 1628.07/Instream Flow Report_031909
Table 2-2. Jackson Hydroelectric Project Powerhouse downramping rate schedulea (inches/hour).
Flow Range (cfs/day) Day Night Day Night
March 1b to May 31 June 1b to September 15
1,500 to 750 4 4 2 1
750 to 600 2c 2c 2c 1c
600 to 300 2 4 2 1d
300 to minimum 2 2 2 1d
September 16 to October 31 November 1 to February 28
1,500 to 750 2 1 4 4
750 to 600 2c 1c 2c 2c
600 to 300 2 2 4 4
300 to minimum 2 2 4 4 a For normal operation; not for power generation equipment failures or forced outages. Values are in inches-per-
hour at the Powerhouse. Rates are tracked on a 15 minute basis by USGS for compliance. No one 15 minute downramping value will exceed half the hourly rate shown in the table. No four consecutive downramping rates shall exceed the hourly rates shown in the table.
b This date may be adjusted annually by determining time of fry emergence with cumulative water temperature information. Upon notification to the District from WDFW that either salmon or steelhead trout fry are expected to emerge from the river gravel, based on water temperature unit calculations, the District will shift to the designated slower downramping rates.
c If river flow prior to downramping has exceeded 1,000 cfs for more than 72 hours, downramping through this flow range (750 to 600 cfs) occurs only after holding flow constant between 750 and 850 cfs for at least 6 hours of daylight and one overnight period.
d Avoid any scheduled flow reduction. Table 2-3. Diversion Dam downramping rate schedulea.
Day Night Day Night
January 1b to May 31 June 1 to September 15
Ramp Rate (in/hr) d 3 3 3 1.5c
September 16 to October 31 November 1 to December 31
Ramp Rate (in/hr) 3 3 6 6 a For normal operations in the flow range between 95 cfs (minimum flow) and 300 cfs, not during power-
generating equipment failures, forced outages, or gravel flushing/enhancement actions requiring manual operation of the sluice gate at the Diversion Dam.
b Chinook salmon fry emergence schedule will be determined yearly in consultation with WDFW. c Avoid any scheduled flow reduction. d Units are in inches per hour as measured at the USGS gage downstream from the Diversion Dam. Rates are
tracked on a 15-minute basis. No single 15-minute downramping value will exceed one half the hourly value shown in the table. The average of four consecutive 15-minute downramping rates shall not exceed the hourly rate shown in the table.

Sultan River Instream Flow Study – RSP 3
R2 Resource Consultants, Inc. 2-17 March 19, 2009 1628.07/Instream Flow Report_031909
2.3 FISH OF THE SULTAN RIVER
The Sultan River currently supports over 15 species of fish, including eight anadromous Pacific salmonid species. These species include Chinook, coho, chum and pink salmon, steelhead and sea-run cutthroat trout, and native char (bull trout and/or Dolly Varden). Native resident salmonid species include rainbow and cutthroat trout and mountain whitefish (Prosopium williamsoni). Many other native resident fish species are also present in the Sultan River including lamprey (Lampetra sp.), stickleback (Gasterosteus sp.), sculpin (Cottus sp.), and suckers (Catostomus sp.). The general life history of Pacific salmon species involves constructing nests (redds) in gravel beds for spawning, followed by migration to the ocean for feeding and maturation, and returning to natal sites for spawning and completion of their life cycle. There are many variations on the timing and duration of these lifecycles both among species, and from year to year for the same species (Figure 2-8). However, all salmonids share a need for the following habitat conditions: sufficient food supply; cool, high quality flowing water; high dissolved oxygen concentrations; and unimpeded migratory access to and from spawning and rearing areas (Spence et al. 1996). Additional specific information on the life-history requirements and stock statuses for select Sultan River fish species are discussed in the following sections.
2.3.1 CHINOOK SALMON (Oncorhynchus tshawytscha)
Chinook salmon are the largest species of Pacific salmon and can weigh over 100 pounds; however, a typical weight is around 20 pounds. Chinook salmon were historically found from the Ventura River, California to Point Hope, Alaska (Myers et al. 1998). The current, contracted distribution of Chinook salmon extends from the San Joaquin River to the Kotzebue Sound, Alaska (Healey 1991). Chinook are the least abundant of the Pacific salmon species, but over one thousand individual populations of Chinook are estimated to exist on the North American coast (Atkinson, et al. 1967; Aro and Shepard 1967). Chinook salmon populations are distinguished by their distinct migration and spawn timing (spring, summer, fall). Spring, summer and fall Chinook runs exist throughout the geographic range, but the majority of Chinook migrate and spawn as summer and/or fall runs. Chinook salmon in the Sultan River are considered by the Washington Department of Fish and Wildlife (WDFW) as part of the Snohomish fall Chinook stock (WDFW and WWTIT 1994). The timing of Chinook migration and spawning tends to occur progressively later further south in their geographic range, but varies somewhat between river systems. Northern populations typically

R2 Resource Consultants, Inc. 2-18 March 19, 2009 1628.07/Instream Flow Report_031909
Figure 2-8. Life stage periodicities of salmonid species present within the Sultan River Basin, Washington.
Species Freshwater Jan Feb Mar Apr May Jun Jul Aug Sep Oct Nov DecLife Phase 1-15 16-31 1-15 16-28 1-15 16-31 1-15 16-30 1-15 16-31 1-15 16-30 1-15 16-31 1-15 16-31 1-15 16-30 1-15 16-31 1-15 16-30 1-15 16-31
Steelhead Upstream Migration
Spawning
Incubation
Juvenile Rearing
Juvenile Outmigration
Pink Upstream Migration
Spawning
Incubation
Juvenile Rearing
Juvenile Outmigration
Coho Upstream Migration
Spawning
Incubation
Juvenile Rearing
Juvenile Outmigration
Chinook Upstream Migration- fall
Spawning- fall
Incubation
Juvenile Rearing
Juvenile Outmigration
Chum Upstream Migration
Spawning
Incubation
Juvenile Rearing
Juvenile Outmigration
Cutthroat Spawning
Incubation
Juvenile Rearing
Rainbow Spawning
Incubation
Juvenile Rearing

Sultan River Instream Flow Study – RSP 3
R2 Resource Consultants, Inc. 2-19 March 19, 2009 1628.07/Instream Flow Report_031909
spawn July to September while southern Chinook populations tend to spawn November to January. Sultan River Chinook spawn from mid-September through November. Chinook typically spawn in the mainstem habitats, in areas defined by flow and substrate conditions. As the largest of the Pacific salmon species, Chinook tend to spawn in higher water velocities (1 to 3 feet per second) and in larger gravel (> 6 inches) than other salmon (Burner 1951). Chinook spawning areas can typically be found at the head of a riffle, prior to the crest of the rapid. Sultan River Chinook spawn from the mouth of the river upstream to the City of Everett Diversion Dam at RM 9.7, which is the upstream limit of anadromous salmon migration (CH2M HILL 2005). Chinook eggs require 882 to 991 temperature units on average before hatching (1 temperature unit = 1 degree C above freezing for 24 h) (Beauchamp et al. 1983). The length of incubation in the Sultan River varies depending on redd location, but is generally completed by the end of March. The young remain in the gravel for 2 to 3 weeks after hatching (Wydoski and Whitney 2003). Many variations in juvenile Chinook life history are possible within this distinct fall run. The distinctions result from variability in the pattern of juvenile freshwater rearing (Reimers 1973). Some examples of juvenile Chinook salmon life histories suggested by Reimers (1973) are as follows:
– emergent fry move directly downstream and into the ocean within a few weeks;
– juveniles rear in the main river or remain in tributaries until early summer, then emigrate into the estuary for a short period of rearing, and enter the ocean in late summer; and
– juveniles rear in the main river or tributaries until early summer, then emigrate into the estuary for extended rearing during the period of improved growth in late summer, and enter the ocean in autumn.
Proportions of individuals present in the Sultan River corresponding to these listed variations are dictated by genetic and environmental factors. Environmental cues such as streamflow reductions, food supply, changes in photo-period, and temperature increases are all factors that lead to the evolution and expression of particular juvenile outmigration timing (Myers et al. 1998). Evidence in the Sultan River suggests that the majority of fry rear in the stream margins for several months, and migrate downstream predominantly by June (CH2M HILL 2005). Further information on the spatial and temporal distribution of Chinook salmon in the Sultan River is being collected as part of RSP5 and will be presented in a forthcoming report.

Sultan River Instream Flow Study – RSP 3
R2 Resource Consultants, Inc. 2-20 March 19, 2009 1628.07/Instream Flow Report_031909
Population Status and Status under the ESA Chinook salmon are included by NOAA Fisheries in the Puget Sound Evolutionarily Significant Unit (ESU). Overall, abundance of Chinook salmon in this ESU has declined substantially; both long- and short-term abundance trends are predominantly downward. These factors have led to this ESU as being listed as threatened (50 CFR 223 and 224). Puget Sound Chinook salmon are a WDFW State Candidate species under review for listing as a State Endangered, Threatened, or Sensitive species. In 2002, WDFW listed the Skykomish Chinook stock as “depressed,” primarily due to low stock escapement (CH2M HILL 2005).
2.3.2 COHO SALMON (Oncorhynchus kisutch)
Coho salmon are of moderate size for a Pacific salmon, typically weighing 8 to 10 pounds. The geographic distribution of coho is similar to that of Chinook extending from the San Lorenzo River in Monterey Bay, California in the south to Point Hope, Alaska in the north (Wahle and Pearson 1987). Coho are generally less abundant in the northern and southern extremes of their range, and typically less abundant than some other Pacific salmon species. Adult coho salmon generally return to their natal streams to spawn at age 3, after spending 18 to 24 months (up to 3 years) in the marine environment. Coho migrate and spawn in the fall and winter, with timing generally earlier in higher latitudes, becoming progressively later moving south through its range. Coho in the Sultan River begin upstream migration in September and continue through December with spawning generally taking place from November through mid-January (Figure 2-8) (WDFW and WWTIT 1994). Spawning habitat suitable for coho is limited in the Sultan River with steep gradients and incised channel in most of the preferred spawning habitat (CH2M HILL 2005). Incubation periods for coho salmon are reported to last from 35 to 101 days (Laufle et al. 1986). After hatching, larvae typically spend 2 to 3 weeks (depending on food stored in the yolk sac) absorbing the yolk sac in the gravels of the redd before they emerge in April and May. Juvenile coho salmon rear in freshwater for approximately 15 months prior to migrating downstream to the ocean, but may extend their rearing time for up to 2 years (Sandercock 1991). Newly-emerged fry usually congregate in schools in pools of their natal stream. As juveniles grow, they move into more riffle habitat and aggressively defend their territory, resulting in displacing excess juveniles downstream to less favorable habitat (Wydoski and Whitney 2003). This aggressive behavior may be an important factor maintaining the numbers of juveniles within the carrying capacity of the stream, and distributing juveniles more widely downstream. Once territories are established, individuals may rear in selected areas of the stream feeding on drifting benthic organisms and terrestrial insects until the following spring (Hart 1973).

Sultan River Instream Flow Study – RSP 3
R2 Resource Consultants, Inc. 2-21 March 19, 2009 1628.07/Instream Flow Report_031909
Complex woody debris structures and side channels are important habitat elements for coho salmon. Suitable overwintering habitat exists in the lower 3 miles of the Sultan River, primarily in side and off-channel complexes. Studies suggest that the abundance of juvenile coho is often determined by the combination of limited space, food and temperature interaction. The outmigration of coho smolts in the Sultan River occurs between April and early June (CH2M HILL 2005). Population Status and Status under the ESA Snohomish coho stocks belong to the Puget Sound/Strait of Georgia ESU. Continued loss of habitat, extremely high harvest rates, and a severe recent decline in average spawner size are substantial threats to remaining native coho populations in this ESU. Currently, this ESU is not listed as threatened or endangered; however, if present trends continue, this ESU is likely to become listed in the future (Weitkamp et al. 1995). In 1993, WDFW ranked the Sultan River coho, part of the Snohomish – Skykomish stock, as “Healthy” based on trends in spawning escapement (WDFW and WWTIT 1994). Escapement in the Sultan River has continued to increase since then with an estimated annual escapement of 300 to 500 adults (CH2M HILL 2005).
2.3.3 PINK SALMON (Oncorhynchus gorbuscha)
Pink salmon are the smallest of the five salmon species, and typically weigh from 2 to 6 pounds. The geographic range of pink salmon extends from the Sacramento River of central California in the south, to Point Barrow, Alaska in the North (Hallock and Fry 1967; Craig 1984). Pink are the most abundant of the Pacific salmon species. Pink salmon are distinguished from other Pacific salmon by having a fixed two-year life span, such that fish returning to their natal stream in only odd or even years are reproductively isolated from one another. The Snohomish River and its major tributaries (including the Sultan River) support both even-year and odd-year runs. Mature adult pink salmon may grow to a length of 30 inches, and weigh on average, between 3 and 5 pounds. After 18 months at sea, adult pink salmon will return to spawn. Inshore migration starts in July and continues through October. Spawning of the odd-year stock generally takes place from mid-September through October (Figure 2-8), while spawning of the even year stock occurs primarily in September (WDFW and WWTIT 1994). The odd-year run is much larger, generally measuring more than 100,000 fish compared to only about 5,000 for the even year run in the Snohomish river system (CH2M HILL 2005). In the Sultan River, only the odd-year run has been observed spawning, primarily in the lower 3 miles of the river (CH2M HILL 2005).

Sultan River Instream Flow Study – RSP 3
R2 Resource Consultants, Inc. 2-22 March 19, 2009 1628.07/Instream Flow Report_031909
Incubation of fertilized eggs lasts between 5 and 8 months in the gravel interstices (Heard 1991). Water quality, desiccation, predators and scour are some of the major environmental factors influencing egg survival to emergence. Pink salmon eggs hatch in late February, and the young emerge from the gravel in April and May, depending on water temperatures. Pink salmon fry spend less time on average in freshwater than most other salmon species. Upon reaching the mouth of the stream, increased schooling takes place. After leaving freshwater, the young salmon tend to remain close to nearshore nursery areas until approximately September (Emmett et al. 1991). Juvenile pink salmon residency in the Sultan River is minimal, utilizing the river primarily for transportation. Population Status and Status under the ESA Pink salmon counts in the Sultan River have increased since the start of operation of the Project in 1983. Stage 1 (1971 through 1983) escapement averaged 3,000 fish in odd years. Stage 2 escapement has averaged 51,563 fish per year (CH2M HILL 2005). A record run of pink salmon was observed in 2001 totaling 151,800 fish (CH2M HILL 2005). The status of the Snohomish River odd-year pink stock is considered “Healthy” by WDFW and overall abundance was estimated by NOAA Fisheries to be “close to historic levels.” Therefore there are no plans in the near future for listing of this species under the ESA (Hard et al. 1996; WDFW 1994). Even-year pink in the Snohomish River were determined by NOAA Fisheries to not be at risk of imminent extinction or endangerment, but merited close monitoring to determine if this population may be at risk in the future (Hard et al. 1996).
2.3.4 CHUM SALMON (Oncorhynchus keta)
Among the Pacific salmon species, chum are second only to Chinook in size. Chum salmon can weigh up to 45 pounds, but typically are around 10 to 15 pounds. Chum has the broadest geographic distribution of the Pacific salmon, ranging from the San Lorenzo River in Monterey Bay, California in the south to the Mackenzie River on the north coast of Canada. The largest runs of Chum salmon range from Tillamook Bay, Oregon in the south to Kotzebue Sound, Alaska in the north (Henry 1953). Chum salmon migration up the Snohomish River begins in early September and continues through December. Upstream migration can be fast, with rates of 30 miles per day recorded (Groot and Margolis 1991). Spawning in the Sultan River takes place in November and December (Figure 2-8). Preferred spawning areas are in groundwater-fed streams or at the head of riffles (Grette and Salo 1986). However, chum salmon will utilize many different spawning
Sultan River Instream Flow Study – RSP 3
R2 Resource Consultants, Inc. 2-23 March 19, 2009 1628.07/Instream Flow Report_031909
areas including mainstem rivers, side channels and sloughs. Spawning in the Sultan River occurs primarily in the mainstem and side channels of the lower 2.7 river miles (CH2M HILL 2005). The length of incubation of the eggs is influenced primarily by water temperature. For example, eggs at 15ºC hatch approximately 100 days before eggs incubated at 4ºC. Health of the emergent fry is also dependent on dissolved oxygen, gravel composition, spawner density, stream discharge, and genetic characteristics (Groot and Margolis 1991). Fry emergence in the Sultan River is generally completed by May. Juvenile chum salmon have an ocean-type early life history similar to pink salmon: rearing in freshwater for only a few days to weeks before migrating downstream to saltwater (Grette and Salo 1986). Juvenile outmigration occurs in early spring, March through May. Chum salmon mature in the ocean for 1 to 5 years before returning to spawn (Groot and Margolis 1991). Population Status and Status under the ESA Information from early spawning surveys indicates that very few chum salmon historically spawned in the Sultan River prior to operation of the Project. However, from 1992 to 2004 chum salmon escapement in the Sultan River has averaged 2,500 fish (CH2M HILL 2005). Currently, WDFW considers the Sultan River chum stock to be part of the Skykomish fall chum stock, and is separated geographically from other chum stocks (WDFW and WWTIT 1994). This stock is considered “Healthy” based on escapement trends. Sultan River chum salmon are considered by NOAA Fisheries to be part of the Puget Sound / Strait of Georgia ESU. NOAA Fisheries concluded that this ESU is not presently at risk of extinction, nor is likely to become endangered in the near future (63 Fed. Reg. 11778).
2.3.5 STEELHEAD TROUT (Oncorhynchus mykiss)
Steelhead trout occupy a geographic range similar to Pacific salmon stocks. Steelhead trout historically inhabited regions as far south as Baja California. The current contracted range of steelhead extends from the Malibu River, California in the south to southeastern Alaska (50 CFR Part 222 and 227). Many populations of steelhead in streams throughout their range are believed to be in decline. Steelhead trout are iteroparous, and are capable of spawning more than once, unlike Pacific salmon species. Steelhead is generally classified into two races, summer and winter, based on timing of spawning migration. Winter run steelhead enter streams between early November and late April, while summer steelhead are typified by a run timing of early May to late October. Regardless of the timing of river entry, most steelhead generally spawn between December and June. Summer steelhead usually spawn between December and March in upstream reaches of

Sultan River Instream Flow Study – RSP 3
R2 Resource Consultants, Inc. 2-24 March 19, 2009 1628.07/Instream Flow Report_031909
their natal streams. Winter runs, like those in the Sultan River, typically spawn later than summer steelhead, from March through June in lower reaches of streams (Figure 2-8). In general, steelhead differ from spawning Chinook and coho salmon by their use of faster, shallower, and higher gradient locations in mainstem or tributary streams (Everest and Chapman 1972). Steelhead have been observed to spawn above and below the Powerhouse upstream to the Diversion Dam (RM 9.7) (CH2M HILL 2005). Incubation rates vary with water temperature, with fry emergence occurring 40 to 80 days after spawning. Dissolved oxygen levels at or near saturation with no temporary reductions in concentration below 5 parts per million are most suitable for incubation (Stolz and Schnell 1991). Depending on the time of spawning and the water temperature during incubation, fry emerge from the gravel in spring or early summer, 3 or more weeks after hatching (Barnhardt 1986). Juvenile steelhead will utilize stream margins and submerged rootwads, debris and logs to provide shelter and cover while rearing (Bustard and Narver 1975). Both winter and summer juvenile steelhead rear in freshwater for 1 or more years before migrating to the ocean. Migrating smolts are typically age 2 in the Snohomish River (Busby et al. 1996). A positive relationship between migration speed of active migrants and fish size has been seen in studies (Busby et al. 1996). Juvenile surveys in the Sultan River (WDG 1986), showed rapid steelhead fry growth. Mean length doubled from June to November and weights (estimated from published length/weight relationships) increased nearly tenfold. Juvenile downstream migration for steelhead smolts in the Sultan River occurs from April through May (CH2M HILL 2005). Snohomish County PUD provides funding for an annual plant of 30,000 hatchery steelhead smolts (winter and summer run combined) in the Sultan River (CH2M HILL 2005). Population Status and Status under the ESA Sultan River steelhead have been classified by NOAA Fisheries as part of the Puget Sound ESU (1 of 15 west coast steelhead ESUs). After initial review, this ESU was determined to not warrant listing under the Endangered Species Act on 9 August 1996. In response to a petition, NOAA announced on 29 March 2006 it was proposing to list this ESU as “threatened.” On 7 May 2007 NOAA announced that Puget Sound steelhead warrant protection under the ESA, and that all naturally spawned winter-run and summer-run populations are now listed as “threatened,” meaning likely to become an endangered species in the future.
2.3.6 BULL TROUT (Salvelinus confluentus)
The taxonomic status of the bull trout has been confused with that of Dolly Varden. Both species are native salmonids and members of the char family. The species are similar in coloration, morphology and life history, making distinction between the two species difficult

Sultan River Instream Flow Study – RSP 3
R2 Resource Consultants, Inc. 2-25 March 19, 2009 1628.07/Instream Flow Report_031909
without the use of electrophoretic samples or exact measurements of specific external characteristics (Beak 1996). Furthermore, morphological and genetic samples taken from populations in Washington show a degree of overlap and genetic introgression. The State of Washington has indicated that protective measures and management for the two species are identical. Therefore, the following description of status and life history for the two species has been combined; they will be referenced as native char in the remainder of this life history description. Native char life history expressions include anadromous and freshwater migratory and resident forms (Goetz et al. 2004). Adfluvial stocks rear in lakes or reservoirs before returning to tributary streams to spawn, whereas riverine forms spend their entire life cycle in streams. Bull trout populations that exhibit different life history forms may be present within a river system. In some river systems that are known through genetic testing to contain both species of char (Dolly Varden and bull trout) and their hybrids, it appears that Dolly Varden mature at a smaller size and exhibit a riverine life history, whereas bull trout are generally adfluvial and larger-bodied (McPhail and Taylor 1995; Baxter et al. 1997; Hagen and Taylor 2001; Taylor et al. 2001). All lifestages of native char can be found throughout the Snohomish River basin. However, they have only been observed sporadically in the Sultan River, and always below RM 9.7 (CH2M HILL 2005). These fish are presumed to be sub-adult or adult foraging fish as it is doubtful that the Sultan River contains any habitat suitable for native char spawning, based on temperature and elevation data (CH2M HILL 2005). Foraging native char would most likely be present in association with salmon fry emergence during late winter and spring. They may also feed on eggs during salmon spawning time in September through December. Population Status and Status under the ESA The Sultan River native char population is considered by the USFWS to be part of the Puget Sound bull trout Distinct Population Segment (DPS). This DPS is a geographically isolated segment, encompassing all Pacific coast drainages within the contiguous United States north of the Columbia River in Washington (63 Fed. Reg. 31695). Due to several detrimental factors (including disease, predation, increased stream temperatures and loss of habitat) this DPS has been listed as threatened by the USFWS under the ESA (50 CFR Part 17). Bull trout are a WDFW State Candidate Species under review for listing as a State Endangered, Threatened, or

Sultan River Instream Flow Study – RSP 3
R2 Resource Consultants, Inc. 2-26 March 19, 2009 1628.07/Instream Flow Report_031909
Sensitive species. However, WDFW considers the Snohomish / Skykomish bull trout population to be “Healthy” (WDFW 1998).
2.3.7 COASTAL CUTTHROAT TROUT (Oncorhynchus clarki clarki)
Coastal cutthroat trout are similar in appearance to steelhead. Coastal cutthroat trout inhabit coastal streams from Humboldt Bay, California in the south to Gore Point on the Kenai Peninsula, Alaska in the north (Stolz and Schnell 1991). Considerable information exists for Puget Sound cutthroat trout, though little of that has been collected in a standardized manner and over a long enough time period to establish trends in populations (Leider 1997). However, the relative abundance of cutthroat trout is assumed to have generally declined throughout its range. Cutthroat trout life history is complex, as multiple forms exist, often within the same river system. Anadromous, freshwater migratory, and freshwater non-migratory are three cutthroat life history forms that are known to occur in the same river system, and presumably could occur in the Sultan River, although documentation of such is lacking. Indeed, recent fish surveys completed in Reach 3 in which the non-migratory form would likely have existed failed to detect or capture any cutthroat trout. Non-migratory cutthroat trout will typically inhabit a small stream section throughout their lifecycle, whereas freshwater migratory cutthroat will migrate within the river system, typically moving to smaller tributaries to spawn. Like steelhead, adult sea-run cutthroat trout are repeat spawners, but unlike steelhead, sea-run cutthroat trout recover quickly to pre-spawn condition (Trotter 1997). They may live to an age of 7 or 8 years, spawning three, four, or even as many as five times during their life (Trotter 1997). Although anadromy exists, there is evidence that this trait is not strongly developed; fish generally remain close inshore or in areas of reduced salinity while in salt water (Trotter 1997). They will rarely, if ever, overwinter in saltwater, indicating that some of the returning fish may not spawn during their first or second migrations back into freshwater. Sea-run cutthroat trout are usually smaller than other anadromous salmonids, and rarely exceed 50 cm in length. This size appears to be adaptive for entering small tributaries where interspecific competition for habitat with other, larger, salmonids is reduced (Pearcy 1997). Cutthroat trout spawning in the Sultan River occurs from May through July (Figure 2-8). Sea-run cutthroat trout spawn in low gradient reaches of small tributaries, or in the lower regions of streams (Trotter 1997). This appears to be an adaptation to isolate their nursery/rearing ground from other, more competitive, species such as steelhead (Stolz and Schnell 1991). The preferred spawning substrate is pea to walnut sized gravel, in 15-45 cm of water, with pools nearby for escape cover. Actual spawning may extend over a period of 2 to 3 days (Trotter 1997).

Sultan River Instream Flow Study – RSP 3
R2 Resource Consultants, Inc. 2-27 March 19, 2009 1628.07/Instream Flow Report_031909
Juvenile coastal cutthroat trout exhibit early life history characteristics similar to coho and steelhead, whereby juveniles spend time rearing in freshwater before outmigrating as smolts (Leider 1997). Juvenile sea-run cutthroat will generally rear in streams for two or more years, seeking pools and other slow water habitats with root wads and large wood for cover (Trotter 1997). Often coho fry are present in the same habitat, and the larger coho will drive the cutthroat into riffles, where they will remain until fall and winter (Stolz and Schnell 1991). Puget Sound cutthroat trout will feed and migrate along beaches, often in waters less than 10 feet deep (Johnston 1982). Many stocks are thought to stay within estuarine habitats for their entire marine life (Leider 1997). Most cutthroat return to freshwater the same year they migrate to sea. Population Status and Status under the ESA Sultan River coastal cutthroat trout have been classified as part of the Puget Sound ESU by NOAA Fisheries (64 Fed. Reg. 16397). This ESU includes populations of coastal cutthroat trout from streams in Puget Sound and the Strait of San Juan de Fuca west to, and including, the Elwha River. The southern boundaries of the Puget Sound ESU extend to Nisqually River, while the northern boundaries include coastal cutthroat trout populations in Canada (64 Fed. Reg. 16397). NOAA Fisheries has concluded that Puget Sound coastal cutthroat trout do not warrant listing under ESA at this time as populations have been relatively stable over the past 10-15 years (64 Fed. Reg. 16397). WDFW has included the Sultan River coastal cutthroat as part of the Snohomish stock complex. The status of this stock is “Unknown,” but may be healthy (WDFW 2000). There is little information available concerning the abundance or survival of any life history form of coastal cutthroat in the Snohomish River basin.

Sultan River Instream Flow Study – RSP 3
R2 Resource Consultants, Inc. 3-1 March 19, 2009 1628.07/Instream Flow Report_031909
3. METHODS
The Sultan River Instream Flow Study was completed in accordance with Revised Study Plan 3 and following procedures outlined by the WDFW and WDOE (2004) in the Instream Flow Guidelines. Chronologically, the study involved completion of the following six steps:
• Step 1 – Planning and Site Reconnaissance, to familiarize technical personnel with site characteristics and operations of the Project, to select target flows, and to make a preliminary selection of transect locations;
• Step 2 – Study Reach Delineation and Transect Selection, that included mainstem areas in Reach 3, Reach 2, and Reach 1, and side channel areas in Reach 1;
• Step 3 – Field Data Collection, that included three trips to collect detailed depth and water velocity data from all transects under a low, mid- and high target flow condition, and two additional trips to collect supplemental water surface elevation (WSE) measurements at two higher flows;
• Step 4 – Habitat Suitability Criteria Curve Development, that involved development and submittal of an HSC plan for review by stakeholders and agencies, collection of microhabitat data, data analysis, and derivation of modified curves for selected species;
• Step 5 – Data Analysis and Modeling, that included hydraulic model calibrations for all transects, and subsequent derivation of species and life stage specific habitat indices (expressed as Weighted Useable Area – WUA) versus flow relationships for each site, and, based on channel widths, an estimation of the total habitat area of each species and life stage for each reach under different flow conditions; and
• Step 6 – Time Series Analysis that linked habitat-flow relationships with hydrologic conditions involving three different flow scenarios (wet, average, and dry years), under Stage 1 and Stage 2 operations. The time series analysis and resulting habitat duration curves provide a means to compare effects of different Project operations on the frequency and availability of habitats within the three reaches of the river.
3.1 PLANNING AND SITE RECONNAISSANCE
Planning for the instream flow study involved an initial review of background information related to Project operations, hydrology, and fishery resources that was provided in the PAD and other documents cited therein, as well as a review of previous instream flow studies, including those by R.W. Beck (1980), Easterbrooks and Gerke (1978), and Magee (1967). R2 also

Sultan River Instream Flow Study – RSP 3
R2 Resource Consultants, Inc. 3-2 March 19, 2009 1628.07/Instream Flow Report_031909
carefully reviewed the aerial digital videotape that was taken during a June 17, 20043 helicopter flyover of the entire reach of the Sultan River, from its confluence with the Skykomish River to Culmback Dam. This video was used to assess habitat types and features in each of the reaches and to select candidate study sites and transect locations within. R2 also completed two preliminary field reconnaissance surveys within the Sultan River watershed designed to familiarize personnel with Project facilities and operations, channel characteristics and access points to channel reaches. The first, completed on April 11, 2007 represented a joint survey to assess access and sampling locations for both the Sultan River Instream Flow study (RSP3) and the Juvenile Fish Occurrence, Life History and Distribution study (RSP5) within the lower two reaches (Reach 2 and Reach 1). The second survey was a two-day effort (April 18 and 19, 2007) that entailed first a helicopter flyover of the entire length of river from the confluence with the Skykomish River to Culmback Dam, followed by an on-the-ground survey of several segments of Reach 3. Two subsequent more detailed surveys were completed to identify candidate sites and potential transect locations within each reach. The first survey involved a two-day effort (May 4 and 5, 2007) and focused on Reaches 3 and 2; the second on May 9, 2007 included a combined foot and float survey of Reach 1. During these surveys, candidate transects were flagged and GPS coordinates taken. These candidate transect locations were subsequently marked on copies of still images captured from the digital video and provided to the stakeholders and agencies prior to a formal transect selection meeting that was held on May 22, 2007 (see Section 3.2). Target flows for field measurement were selected based on review of the flows measured and modeled during the previous instream flow studies (R.W. Beck 1980; Easterbrooks and Gerke 1978; and Magee 1967), an evaluation of channel characteristics and habitat types and their sensitivity to flows, and the periodicities of the target fish species and lifestages with consideration for the range of flows needed to adequately define their habitat – flow relationships (Table 3-1). A total of five flows were selected for each reach, the first three of which were used to obtain complete depth-velocity data sets and water surface elevations (WSE) at all transects, and the last two flows (the two highest) used to obtain supplemental WSE measurements.
3 Videotaping completed by Devine Tarbell and Associates. 2004. Sultan River aerial video, 17 June, 2004. Skykomish River confluence to Culmback Dam.

Sultan River Instream Flow Study – RSP 3
R2 Resource Consultants, Inc. 3-3 March 19, 2009 1628.07/Instream Flow Report_031909
Table 3-1. Target flows selected for field measurement for each study reach of the Sultan River, Washington. Actual flows measured varied by location and were influenced by tributary inflow and prevailing weather conditions.
Reach Existing Instream Flow Requirements
Modeled Flow Range - Suggested in RSP3
Proposed Target Flows (Q) (first three flows will include depth-velocity sets)
Extrapolation Range1 (based on Qs with D-Vel sets)
3 Year-round: 20 cfs 20 to 1,000 cfs Q1 – 20cfs Q2 – 150 cfs Q3 – 300 cfs Q4* – 500 cfs Q5* – > 750 cfs
Conservatively – 8 cfs to 750 cfs; probably higher given additional WSEs at higher Qs
2 11/1 to 1/15: 95 cfs 1/16 to 2/28: 150 cfs 3/1 to 6/15: 175 cfs 6/16 to 9/14: 95 cfs 9/15 to 9/21: 145 cfs 9/22 to 10/31: 155 cfs
50 to 1,500 cfs Q1 – 95 cfs Q2 – 200 cfs Q3 – 400 cfs Q4* – 600 cfs Q5* – > 800 cfs
Conservatively – 38 cfs to 1000 cfs; probably higher given additional WSEs at higher Qs
1 6/16 to 9/14: 165 cfs 9/15 to 6/15: 200 cfs
100 to 1,500 cfs Q1 – 165 cfs Q2 – 300 cfs Q3 – 500 cfs Q4* - 700 cfs Q5* – > 800 cfs
Conservatively – 66 cfs to 1250 cfs; probably higher given additional WSEs at higher Qs
1 The range of flow extrapolation will adhere to Washington State Guidelines (WDFW and WDOE 2004) that specify limiting the range of extrapolation to flows at which all Velocity Adjustment Factors (VAFs) are between 0.80 and 1.20, and for which no simulated velocities exceed 10 fps. * Estimated target flows - only Water Surface Elevations measured at these flows.
Safety was also considered in the selection of the highest flow for which a complete velocity set would be measured. A more detailed discussion regarding the selection of target flows is provided in Appendix B, which contains a memorandum circulated to agencies and stakeholders describing the rationale and basis for the proposed flows.
3.2 STUDY REACH DELINEATION AND TRANSECT SELECTION
A total of six mainstem study sites were established on the Sultan River from Culmback Dam to the confluence with the Skykomish River: two sites in Reach 3, two sites in Reach 2, and two in Reach 1 (one each in Sub-Reaches 1A and 1B) (Figure 3-1). Study site locations were selected based on known fish use, and to emphasize stream channel/habitat areas most sensitive to Project operations. River access and safety were also considered in the selection of sites, especially in Reaches 3 and 2. As noted above, the location of potential study sites was first determined from

Sultan River Instream Flow Study – RSP 3
R2 Resource Consultants, Inc. 3-4 March 19, 2009 1628.07/Instream Flow Report_031909
a review of aerial photography, topographic maps, and low elevation video. An initial review of potential site locations was made (R2 biologists and District staff) during a reconnaissance survey of the Project reaches completed on May 4 and 9, 2007. During this survey, potential transect locations were flagged and marked on aerial photographs. The number and initial location of proposed transects was based on a review of existing habitat composition information (PUD #1 of Snohomish County and City of Everett 2005), field scoping, and consultation with District staff.
REACH 1A
REACH 1B
REACH 3Lower
REACH 2Upper
Culmback DamDiversion DamPowerhouse
REACH 2Lower
REACH 3Upper
Figure 3-1. Location of mainstem study sites established for the instream flow study in each of
the three operational reaches of the mainstem, Sultan River, WA.
3.2.1 Mainstem Transect Selection
Final study site and transect locations were determined collaboratively in consultation with the resource agencies/Project stakeholders (WDFW, NMFW, USFWS, USFS, and Tulalip Tribal consultant) during a field reconnaissance conducted on May 22, 2007 (Appendix A). After reviewing comments expressed by the agencies/stakeholders during the field reconnaissance, several minor adjustments to the number and location of specific transects were made (Appendix A). The most significant of the changes was the redistribution of transects within Reach 1. A total of 38 transects were identified as being broadly representative of channel characteristics and the overall composition of habitat within the mainstem Sultan River. Transects were arranged and numbered within each study site from downstream to upstream. Based on the

Sultan River Instream Flow Study – RSP 3
R2 Resource Consultants, Inc. 3-5 March 19, 2009 1628.07/Instream Flow Report_031909
results of detailed habitat surveys (RSP-18) and channel type classification (RSP-22), each transect was considered to be representative of a certain length of the river. River segment lengths were assigned to the nearest transect with similar channel morphology type4. Some revisions to habitat type designations were required after review of RSP 18 habitat surveys Habitat representations and locations of transects are depicted in (Figures 3-2 to 3-7 progressing from the upper reach (Reach 3) to the lower reach (Reach 1).
3.2.2 Side Channel Transect Selection
Side channels can provide important rearing and spawning habitats for salmonids and other aquatic species. For this study, side channels were defined as channels that are physically connected at both the upper and lower ends to the mainstem, that transmit flowing water from the mainstem at a relatively frequent mainstem flow level (i.e., annually or more often), and that have a well-defined and sorted channel substrate (i.e., exposed sand or gravel) (Figure 3-8). In the Sultan River, side channels are predominately found in Reach 1, where the river channel is less confined, and hence has been able to meander, form and use side channel areas for flow conveyance (Figure 3-9). The assessment of side channel habitats in this study focused on determining; a) the relationship of habitat quantity within the side-channel to flow in the side-channel; and b) relationship of flow in mainstem river to flow in the side-channel; i.e., connectivity. A PHABSIM type analysis involving transect placement and measurement conducted in concert with the mainstem study was completed to address the flow-habitat quantity component; surveying of water surface and bed elevations at the inlets of each side channel was used to determine mainstem connectivity. Potential side channel habitat sites within Reach 1 were initially identified using color orthophotographs and USGS topographic maps. A total of 10 potential side channels were identified (Figure 3-9). Side channels were then verified and selected for sampling during a field visit conducted on May 9, 2007. Three of the identified 10 side channels were found to meet the criteria used in this study to define side channels, while also supporting fish use and unrestricted physical access.
4 Some revisions to habitat type designations used in RSP 18 (Stillwater Sciences and Meridian Environmental (S008a) were made to ensure compatibility with habitat type designations used in this study.

Sultan River Instream Flow Study – RSP 3
R2 Resource Consultants, Inc. 3-6 March 19, 2009 1628.07/Instream Flow Report_031909
REACH 1B
REACH 3
REACH 2
Culmback DamDiversion DamPowerhouse
Reach 3 Upper(6 Transects)REACH 1A
Revised Transect Number
Habitat Type
Revised Habitat Type
Location (U/S to D/S)
TR-6 Pool/Riffle Low Gradient Riffle Transition u/s of TR-5
TR-5 Pool Pool Body of pool
TR-4 Riffle/Pool Tailout Glide Large pool u/s of LWD jam
TR-3 Riffle Low Gradient Riffle ~20m u/s of LWD jam
TR-2 Riffle Low Gradient Riffle d/s of LWD jam
TR-1 Cascade Rapid ~50m u/s of bridge
Figure 3-2. Reach 3 upper study site location, habitat composition (Stillwater Science and Meridian Environmental 2008a) and habitat types
represented by each instream transect on the Sultan River, WA.

Sultan River Instream Flow Study – RSP 3
R2 Resource Consultants, Inc. 3-7 March 19, 2009 1628.07/Instream Flow Report_031909
REACH 1B
REACH 3
REACH 2
Culmback DamDiversion DamPowerhouse
Reach 3 Lower(7 Transects)REACH 1A
Transect Number
Habitat Type
Revised Habitat Type
Location (U/S to D/S)
TR-7 Pool/Riffle Glide u/s of Diversion Dam
TR-6 Riffle Low
Gradient Riffle
u/s of Diversion Dam
TR-5 Pool Pool u/s of Diversion Dam
TR-4 Glide Glide u/s of Diversion Dam
TR-3 Riffle Rapid u/s of Diversion Dam
TR-2 Riffle Low
Gradient Riffle
u/s of Diversion Dam
TR-1 Riffle Glide u/s of Diversion Dam
Figure 3-3. Reach 3 lower study site location, habitat composition (Stillwater Science and Meridian Environmental 2008a) and habitat types
represented by each instream transect on the Sultan River, WA.

Sultan River Instream Flow Study – RSP 3
R2 Resource Consultants, Inc. 3-8 March 19, 2009 1628.07/Instream Flow Report_031909
REACH 1B
REACH 3
REACH 2
Culmback DamDiversion DamPowerhouse
Reach 2 Upper(7 Transects)
REACH 1A
Transect Number
Habitat Type
Revised Habitat Type
Location (U/S to D/S)
TR-7 Riffle Low Gradient Riffle
u/s of USGS trolley line
TR-6 Riffle Low Gradient Riffle
d/s of USGS trolley line
TR-5 Cascade Rapid
TR-4 Riffle Low Gradient Riffle
TR-3 Riffle Low Gradient Riffle Gauging station stairs
TR-2 Pool Glide
TR-1 Pool/Cascade Pool Transition
Figure 3-4. Reach 2 upper study site location, habitat composition (Stillwater Science and Meridian Environmental 2008a) and habitat types
represented by each instream transect on the Sultan River, WA.

Sultan River Instream Flow Study – RSP 3
R2 Resource Consultants, Inc. 3-9 March 19, 2009 1628.07/Instream Flow Report_031909
REACH 1B
REACH 3
REACH 2
Culmback DamDiversion DamPowerhouse
Reach 2 Lower(6 Transects)
REACH 1A
Transect Number
Habitat Type
Revised Habitat Type
Location (U/S to D/S)
TR-6 Pool Tailout Pool u/s of Powerhouse
TR-5 Cascade/Riffle Low Gradient Riffle u/s of Powerhouse
TR-4 Pool Pool u/s of Powerhouse
TR-3 Pool Tailout Glide u/s of Powerhouse
TR-2 Riffle Rapid u/s of Powerhouse
TR-1 Riffle Glide u/s of Powerhouse
Figure 3-5. Reach 2 lower study site location, habitat composition (Stillwater Science and Meridian Environmental 2008a) and habitat types represented by each instream transect on the Sultan River, WA.

Sultan River Instream Flow Study – RSP 3
R2 Resource Consultants, Inc. 3-10 March 19, 2009 1628.07/Instream Flow Report_031909
REACH 1B
REACH 3
REACH 2
Culmback DamDiversion DamPowerhouse
Reach 1B(2 Transects)REACH 1A
Transect Number
Habitat Type
Revised Habitat Type
Location (U/S to D/S)
TR-2 Run Glide d/s of Powerhouse
TR-1 Riffle Low Gradient Riffle
d/s of Powerhouse
Figure 3-6. Reach 1B study site location, habitat composition (Stillwater Science and Meridian Environmental 2008a) and habitat types
represented by each instream flow transect on Sultan River, WA.

Sultan River Instream Flow Study – RSP 3
R2 Resource Consultants, Inc. 3-11 March 19, 2009 1628.07/Instream Flow Report_031909
Revised Transect Number
Habitat Type
Revised Habitat Type
Location (U/S to D/S)
TR-10 Riffle Rapid Head of Mike’s Island
TR-9 Pool Pool
TR-8 Pool Tailout/Riffle Glide
TR-7 Riffle Low Gradient Riffle
TR-6 Run/Pool Glide u/s of Keenes Island
TR-5 Riffle Low Gradient Riffle Top of Rose Bar
TR-4 Riffle Low Gradient Riffle Bisects Rose Bar
TR-3 Run/Pool Glide
TR-2 Riffle Low Gradient Riffle Right side of Osprey Island
TR-1 Glide/Run Glide
Figure 3-7. Reach 1A study site location, habitat composition (Stillwater Science and Meridian Environmental 2008a) and habitat types
represented by each instream flow transect on the Sultan River, WA.
REACH 1A
REACH 1B
REACH 3
REACH 2
Culmback DamDiversion DamPowerhouse
Reach 1A(10 Transects)

Sultan River Instream Flow Study – RSP 3
R2 Resource Consultants, Inc. 3-12 March 19, 2009 1628.07/Instream Flow Report_031909
Figure 3-8. Downstream view within Side Channel #1 of the Sultan River, Washington
under relatively high flow conditions. Photo taken on April 12; main channel flow approximately 3000 cfs. Tripod sits on exposed gravel and cobble substrates.

Sultan River Instream Flow Study – RSP 3
R2 Resource Consultants, Inc. 3-13 March 19, 2009 1628.07/Instream Flow Report_031909
Figure 3-9. Location of mapped side channel areas within Reach 1A (PUD #1 of Snohomish
County and City of Everett 2005) of the lower Sultan River, WA. Side channels 1, 6 and 8 were selected for detailed analysis in this study, and correspondingly re-numbered Side Channels 3, 2, and 1, respectively).

Sultan River Instream Flow Study – RSP 3
R2 Resource Consultants, Inc. 3-14 March 19, 2009 1628.07/Instream Flow Report_031909
A total of 18 transects, were established within the three side channels. Because detailed habitat mapping information was not available during transect selection, transects were equally distributed between the three side channels, with six transects placed within each. Individual transects were located to capture riffle, pool, and run/glide habitat types within each channel (Figures 3-10, 3-11, 3-12). Special emphasis was placed on locating the upstream most transect within each side channel near the inlet so that a stage-discharge relationship could be developed between flow in the mainstem Sultan River and within each side channel.
3.3 FIELD DATA COLLECTION
Field data were collected at mainstem and side channel transects between June 2007 and December 2007. Mainstem cross-sectional profiles and water surface elevations, and flow depths and velocities across the wetted channel width, were measured at three to five flow conditions ranging from a low of approximately 38.1 cfs in Reach 3 to a high of 1,400 cfs5 in Reach 1 (Table 3-2). Figures 3-13 through 3-18 depict views of representative transects within each of the two sites for each reach as measured during two flow conditions. Side channel habitat width, depth, and velocities were measured over several flow conditions ranging from a low of <1 cfs to a high of >90 cfs. Field data collection methods were the same for mainstem and side channel transects.
3.3.1 Hydraulic and Habitat Measurements
R2 collected hydraulic and habitat measurements consistent with methods described for the Physical Habitat Simulation System (PHABSIM) as noted in Bovee (1982), Milhous et al. (1984). PHABSIM relies on cross sections to define the channel shape and characterize the hydraulic properties over a range of flow conditions. At each of the Sultan River sampling sites, cross sections (transects) were established within representative habitat types (except cascade habitat as defined by RSP-18) to characterize the channel bathymetry, water surface elevations, and velocity profiles at several different discharges. Figure 3-19 illustrates the general set-up and locations of hydraulic and habitat measurements for a given transect. The percentages of the dominant and subdominant substrate surface layers were visually estimated at each transect station using the nine substrate classifications listed in Table 3-3. The collection of physical and hydraulic measurements at each transect was completed following the general procedures outlined by Bovee and Milhous (1978), Bovee (1982), and Trihey and Wegner (1983). Depending on flow conditions, field data were collected by a field crew (2-4 individuals) having expertise in PHABSIM field methods as well as hydraulic and habitat simulation modeling procedures. Copies of the raw field notes are presented in Appendix F.
5 High flow discharge obtained from USGS gage 12138160 15 minute flow data

Sultan River Instream Flow Study – RSP 3
R2 Resource Consultants, Inc. 3-15 March 19, 2009 1628.07/Instream Flow Report_031909
SC3-TR6
SC3-TR5
SC3-TR4SC3-TR3
SC3-TR2
SC3-
TR1
200 0 200 Feet
N
EW
S
Figure 3-10. Distribution of transects within Side Channel 3 (upper most side
channel), Reach 1A, Sultan River, WA.
SC2-TR6
SC2-TR5
SC2-TR4
SC2-TR3
SC2-TR2
SC2-TR1SC1-TR6
SC1-TR5
200 0 200 Feet
N
EW
S
Figure 3-11. Distribution of transects within Side Channel 2, Reach 1A,
Sultan River, WA.

Sultan River Instream Flow Study – RSP 3
R2 Resource Consultants, Inc. 3-16 March 19, 2009 1628.07/Instream Flow Report_031909
SC2-TR2
SC2-TR1SC1-TR6
SC1-TR5
SC1-TR4
SC1-TR3SC
1-TR2SC1-TR1
200 0 200 Feet
N
EW
S
Figure 3-12. Distribution of transects within Side Channel 1 (lower most side
channel), Reach 1A, Sultan River, WA.

Sultan River Instream Flow Study – RSP 3
R2 Resource Consultants, Inc. 3-17 March 19, 2009 1628.07/Instream Flow Report_031909
Table 3-2. Dates and flows (cubic feet/sec, cfs) measured in the mainstem Sultan River, 2007, during the instream flow study.
Sample Date and Flow
Reach Date Flow (cfs) Date
Flow (cfs) Date
Flow (cfs) Date
Flow (cfs) Date
Flow (cfs)
1A 07/18/07 495 07/19/07 296 07/20/07 180 10/21/07 1400 12/20/07 900
1B 07/18/07 495 07/19/07 296 07/20/07 180 10/21/07 1400 12/20/07 900
2 Lower 07/11/07 123 07/12/07 240 07/13/07 430 10/19/07 724 10/20/07 1282
2 Upper 07/11/07 116 07/12/07 236 07/13/07 398 10/19/07 523 10/20/07 928
3 Lower 06/27/07 55 06/28/07 176 06/29/07 350 10/19/07 510 NS NS
3 Upper 06/27/07 38 06/28/07 168 06/29/07 320 10/19/07 370 NS NS
NS=not sampled

Sultan River Instream Flow Study – RSP 3
R2 Resource Consultants, Inc. 3-18 March 19, 2009 1628.07/Instream Flow Report_031909
Figure 3-13. Upstream views to Transect 3 within the Upper Site of Reach 3
during high flow (320 cfs; June 29, 2007) (upper photo) and low flow (38 cfs; June 27, 2007) measurements.

Sultan River Instream Flow Study – RSP 3
R2 Resource Consultants, Inc. 3-19 March 19, 2009 1628.07/Instream Flow Report_031909
Figure 3-14. Side views of Transect 1 within the Lower Site of Reach 3
during high flow (350 cfs; June 29, 2007) (upper photo) and low flow (55 cfs; June 27, 2007) (lower photo) measurements.

Sultan River Instream Flow Study – RSP 3
R2 Resource Consultants, Inc. 3-20 March 19, 2009 1628.07/Instream Flow Report_031909
Figure 3-15. Upstream views to Transect 4 within the Upper Site of Reach 2
during high flow (398 cfs; July 13, 2007) (upper photo) and low flow (116 cfs; July 11, 2007) (lower photo) measurements.

Sultan River Instream Flow Study – RSP 3
R2 Resource Consultants, Inc. 3-21 March 19, 2009 1628.07/Instream Flow Report_031909
Figure 3-16. Side views of Transect 1 within the Lower Site of Reach 2 during
high flow (430 cfs; July 13, 2007) (upper photo) and low flow (123 cfs; July 11, 2007) (lower photo) measurements.

Sultan River Instream Flow Study – RSP 3
R2 Resource Consultants, Inc. 3-22 March 19, 2009 1628.07/Instream Flow Report_031909
Figure 3-17. Side views of Transect 1 within Reach 1B during high flow (495
cfs; July 18, 2007) (upper photo) and low flow (180 cfs; July 20, 2007) (lower photo) measurements.

Sultan River Instream Flow Study – RSP 3
R2 Resource Consultants, Inc. 3-23 March 19, 2009 1628.07/Instream Flow Report_031909
Figure 3-18. Upstream view to Transect 7 within Reach 1A during high flow
(495 cfs; July 18, 2007) (upper photo) and low flow (180 cfs; July 20, 2007) (lower photo) measurements.

Sultan River Instream Flow Study – RSP 3
R2 Resource Consultants, Inc. 3-24 March 19, 2009 1628.07/Instream Flow Report_031909
Figure 3-19. Example PHABSIM cross channel transect illustrating typical transect setup and data collection points across each transect.
VerticalsMeasurements include:
Bed Elevation (dry verticals)Water DepthWater VelocitySubstrate type (all verticals)
Right Working Pin(wooden stake)
Stationing Tape
Level
Channel Profile
Stadia Rod Sta 125.0'Sta 0.0'
} (20 wetted verticals)
Water Surface Elevation
Water's EdgeWater's Edge
Head Pin (rebar)
Left Working Pin (& pony clamp)
Pony Clamp
LOOKING DOWNSTREAM

Sultan River Instream Flow Study – RSP 3
R2 Resource Consultants, Inc. 3-25 March 19, 2009 1628.07/Instream Flow Report_031909
Table 3-3. Channel substrate grain size classifications, used for the Sultan River instream flow study. Code Type of Substrate Code Type of Substrate Code Type of Substrate
1 Silt, clay, or organic 4 Medium gravel (0.5–1.5") 7 Large cobble (6–12") 2 Sand 5 Large gravel (1.5–3") 8 Boulder (> 12") 3 Small gravel (0.1–0.5") 6 Small cobble (3–6") 9 Bedrock
The establishment of transects occurred during initial field measurements conducted during June and July 2007. The set-up of transects at each location was completed as follows:
• Locations of Transects – Transect locations were determined as latitude and longitude using a satellite based Global Positioning system (GPS). Transect positions were recorded into a field book and then marked on a topographic map.
• Establishment of Site Benchmark – Permanent benchmarks (BMs) were established at each transect; this benchmark was given an arbitrary elevation datum of 100.00 ft. All survey measurements, including headpin and water surface elevations, were referenced to this arbitrary benchmark elevation.
• Installation of Head Pins – Head pins (rebar) were installed on one side of the river near the start or end point of each transect. The head pins and BMs served as vertical reference for water surface and bed elevation measurements. The head pins were left in place for future reference.
• Establishment of Working Pins – Working pins (wooden stake, tree, fencepost) were established on both sides of a transect. The working pins were established in such a way that the line connecting these points would be perpendicular to the main flow of the river (or side channel) channel. A surveying tape was then tied to the working pins and stretched across the river channel and connected to these points.
• Survey of Headpin Elevations and Completion of Level Loop – Subsequent to the installation of the head pins, a level loop survey was conducted to establish head pin elevations. The elevation data were obtained using a Nikon 32x Automatic Level and 25-ft stadia rod with increments in 0.01 ft intervals. The level loop was considered “closed” if the head pin and BM elevations were within 0.02 ft.
Transect measurements were obtained under three to five different flow conditions. The following data were recorded at each transect:
• Reach Location, Study Site Location, and Transect Number – corresponding to the Operational reach, site location, transect;

Sultan River Instream Flow Study – RSP 3
R2 Resource Consultants, Inc. 3-26 March 19, 2009 1628.07/Instream Flow Report_031909
• Habitat Type – classified as run/glide, low gradient riffle, steep riffle/rapid, or pool (as previously noted – no cascade habitat units were sampled);
• Sampling Date/Time/Field Crew/Flow – information regarding when data were collected, who collected the data, and what flow condition/target estimated;
• Water Surface Elevations (WSEs) – measured to the nearest 0.01 ft. at three locations in the channel: near left water edge, center of channel, and near right water edge (note: in some high flow conditions, only one side of the channel was surveyed due to high velocities and safety concerns);
• Photographs – representative photographs were taken of each transect under each of the sampled flow conditions (Appendix E).
Velocity and depth measurements were collected during separate flow events for all transects except those representing pool habitat. Only one set of velocity and depth measurements were made in pool habitat units due to the small amount of variability or change in pool velocity and depth in response to changes in flow level. Velocity and depth data were collected at specified intervals (verticals) across each transect, with the number and spacing of the vertical measurements dependent on transect width and flow. The verticals were spaced in such a way that no more than 10% of the channel flow was located between any two verticals. If the channel was flowing (only applicable to side channel habitats), depth and velocity profiles were measured at each transect. The following data were collected at measurement points across each transect:
• Bed Elevations (to nearest 0.01 ft) – determined indirectly from water depth measurements (bed elevation = WSE - water depth);
• Water Depth (to nearest 0.01 ft) – measured using either a 4-ft or 6-ft top setting rod or depth sounder;
• Mean Column Water Velocity (to nearest 0.01 ft/sec) – measured using a Swoffer Model 2100 velocity meter; velocities were measured at 6/10ths depth in the water column for depths less than 2.5 ft, and 2/10ths and 8/10ths depths in the water column for depths greater than 2.5 ft;
• Substrate (dominant and subdominant) – see classifications in Table 3-3; and
• Cover – the presence of bank cover, object cover (e.g., boulder, large woody debris), and overhead vegetation.
Sultan River Instream Flow Study – RSP 3
R2 Resource Consultants, Inc. 3-27 March 19, 2009 1628.07/Instream Flow Report_031909
3.4 HABITAT SUITABILITY CRITERIA
Biological input into PHABSIM modeling is provided in the form of Habitat Suitability Criteria (HSC) curves that represent the use/preference of a given species and life stage for certain water depths, velocities, and substrate characteristics. When the HSC are linked with the hydraulic models developed for each transect and site, PHABSIM can then estimate the amount of habitat, termed Weighted Useable Area (WUA), over a range of flows. For this study, R2 followed the Washington State Instream Flow Study Guidelines (WDFW and WDOE 2008) that suggested either the development of site-specific HSC curves or the use of agency fallback criteria (State Fallback Curves) when conducting PHABSIM studies. Because the shape of HSC curves can dramatically influence the shape of the resulting WUA-flow curves, the District requested R2 to collect site specific HSC data for selected target species. Given their importance in the basin and their listing status, R2 focused data collection on Chinook salmon (spawning and juvenile), steelhead trout (spawning and juvenile), and coho salmon (juvenile). For other salmonid species and life stages in the basin, R2 relied on the State Fallback Curves. This section summarizes the methods used in collecting microhabitat data and developing site specific HSC criteria for the Sultan River. A detailed description and discussion of the HSC development process is provided in Appendix C.
3.4.1 Snorkel Surveys
Snorkel observations were selected as the primary survey technique to determine microhabitat use (depth, velocity, and substrate) of juvenile and adult salmonids in the lower Sultan River. Fish observations specific to the habitat being utilized provide information needed to construct site specific HSC curves. Observational surveys of juvenile and adult salmonids were completed during the summer (July/August) of 2007. Snorkel surveys were conducted by a team of two or three fish biologists with extensive experience in salmonid species identification. In general, the steps used in completing these surveys included: assessment of water visibility using a secchi disk; identification of fish species, size class, location in the water column, and proximity to habitat structure; and microhabitat measurements of water depth, mean column velocity and substrate classification (see Appendix C).
3.4.2 Redd Surveys
Redd surveys were conducted as part of a larger monitoring program conducted by District fish biologists to monitor spawning activities in the Sultan River basin. Active spawning locations

Sultan River Instream Flow Study – RSP 3
R2 Resource Consultants, Inc. 3-28 March 19, 2009 1628.07/Instream Flow Report_031909
were identified by District staff during pedestrian and helicopter surveys of the river completed as part of their annual spawner surveys. Redd surveys were conducted on-foot during three time periods: Fall (September – November) 2006 and 2007; Summer (June and July) 2007; and Spring 2008 (April and May). All surveys were conducted by walking the stream channel in an upstream direction and identifying the location of newly constructed redds. For each identified redd, the following measurements were made: 1) redd dimensions (length and width in ft); 2) water depth (nearest 0.1 ft); 3) mean water column velocity (fps); and 4) substrate size (dominant, sub-dominant, and percent dominant) characterized in accordance with the size classifications described in WDFW (2008).
3.4.3 Data Analysis
Site specific microhabitat utilization measurements were collected for four distinct species and life stages of fish in the Sultan River: steelhead/rainbow trout fry (n observations = 431), juvenile coho salmon (n observations = 459), spawning steelhead trout (n observations = 68), and spawning Chinook salmon (n observations = 133). Prior to computation of HSC curves, the habitat data were entered into commercially available spreadsheets and subsequently checked for data entry accuracy. Data were sorted according to species type and life-history stage. Frequency distributions were then generated for mean velocity, depth, and substrate type for each species. Frequency bin widths of 0.1 were initially used to evaluate the mean velocity and depth utilization distributions. Histogram plots of depth and mean column velocity utilization were produced using slightly larger bin widths to ensure a sufficient number of observations per bin. Draft HSC curves (depth and velocity) were subsequently developed using the site specific observations normalized to a suitability of 1.0. The resulting curves for juvenile coho salmon as well as steelhead/rainbow trout fry were similar to the State Fallback curves and no modifications were suggested (R2 2008a). However, the spawning curves for Chinook and steelhead differed from the Fallback curves suggesting these site specific curves may be more applicable for determining the habitat-flow relationships for the Sultan River.
3.4.4 Review and Adoption of HSC Criteria
R2 subsequently prepared a report that described the overall process used in collecting and analyzing the HSC data, and presented the proposed modified HSC curves (based on utilization data) for Chinook and steelhead spawning (R2 2008a). The report was distributed to the Aquatic Resources Working Group (ARWG) for review, and was discussed during a technical meeting

Sultan River Instream Flow Study – RSP 3
R2 Resource Consultants, Inc. 3-29 March 19, 2009 1628.07/Instream Flow Report_031909
on July 22, 2008. Based on written comments on the report and comments received during the meeting, R2 completed additional analysis of the utilization data to account for availability. This analysis resulted in the development of preference curves for both Chinook and steelhead spawning. R2 prepared a Technical Memorandum (TM) (R2 2008b) describing the methods and results of the analysis, along with the two proposed HSC curves for Chinook and steelhead spawning. The District submitted the TM to the ARWG for review and comment on August 4, 2008, and subsequently received concurrence from the WDFW on the curves on August 7, contingent on a minor change to the depth curve for steelhead (see Appendix C). Because either no site specific data were collected, or the data collected did not suggest modification, R2 relied on and used Fallback Curves for the species and life stages noted in Table 3-4; HSC curves for these species and life stages are presented in Appendix C. The Sultan River site specific HSC curves and Fallback curves noted below were adopted and used in deriving all of the habitat-flow relationships presented and discussed in the remainder of this report. Table 3-4. Species and life stages for which State Fallback Curves were applied for the Sultan River
instream flow study, and rationale for use.
Species Life Stage Rationale for Using State Fallback Curves
Chinook salmon Juvenile Insufficient observations to develop site specific criteria
Steelhead trout Juvenile No data collected; observations only made of fry life stage
Coho salmon Juvenile Site specific data collected but Utilization Curve did not indicate modification warranted
Chum salmon Spawning No data collected
Chum salmon Juvenile No data collected
Pink salmon Spawning No data collected
Rainbow trout Spawning No data collected
Rainbow trout Adult No data collected
Rainbow trout Juvenile No data collected
Cutthroat trout Spawning No data collected
Cutthroat trout Adult No data collected
Cutthroat trout Juvenile No data collected

Sultan River Instream Flow Study – RSP 3
R2 Resource Consultants, Inc. 3-30 March 19, 2009 1628.07/Instream Flow Report_031909
3.5 MODELING
3.5.1 Hydraulic Modeling
The cross sectional field data collected from each transect were analyzed using hydraulic models within PHABSIM (i.e., IFG4, MANSQ, WSP). Based on transect/channel morphologies, a hydraulic model was selected to develop stage-discharge relationships for each of the mainstem and side channel transects. Details of all calibration steps were documented and are presented in Appendix E. Hydraulic simulation modeling included the following steps:
• Raw field data were entered into Excel spreadsheets, reviewed, and reduced into a form ready for creation of hydraulic data decks (Appendix E).
• Data entry errors were identified, noted in a copy of the field notebook, and corrected. These computer spreadsheets were then used to generate hydraulic data input files for the PHABSIM hydraulic simulation program, IFG4 (Appendix E).
• The IFG4 data files were checked for any errors and erroneous field measurements using the REVI4 and CKI4 computer programs.
• Stage:discharge relationships were developed using one or more hydraulic simulation procedures, depending upon the hydraulic characteristics of individual transects. An initial stage:discharge calibration was conducted using the PHABSIM program IFG4. Depending upon the hydraulic characteristics of a given transect, a final stage:discharge relationship was developed using one or more of three methods: a log-log regression method (rating curve developed using the program STGQS4), a channel geometry and roughness method (rating curve developed using the Manning’s Equation based program MANSQ), or a step-backwater method (rating curve developed using the program WSP) (Appendix E).
• Velocities across each transect were calibrated to provide a realistic distribution of mean column velocities across the river channel for the entire range of flows employed in habitat simulations. As recommended under the Washington State Instream Flow Study Guidelines (2008), a standard “three velocity set” regression model was used on all transects except for special circumstances, such as a pool habitat in which only one velocity set was measured.
The range of extrapolation of hydraulic modeling results to unmeasured flows depends greatly on the spread between the calibration/measured flows and the Velocity Adjustment Factors

Sultan River Instream Flow Study – RSP 3
R2 Resource Consultants, Inc. 3-31 March 19, 2009 1628.07/Instream Flow Report_031909
(VAF). VAF is a measure of how well a three-flow regression model simulates or predicts velocities at measured flows. Washington State Instream Flow Study Guidelines (2008) recommend that extrapolation of measured flows/velocities be limited to flows at which all VAFs are between 0.80 and 1.20. A summary of VAFs and calibration details are presented in Appendix E.
3.5.2 Habitat Modeling
Habitat simulations were completed using the HABTAV habitat simulation modeling program. HABTAV uses velocities obtained directly from the hydraulic model (IFG4) output files for habitat area calculations (Milhous et al. 1989). Output from the hydraulic simulation modeling was used in conjunction with the appropriate modified and Fallback HSC criteria to simulate habitat conditions for each target species and life stage over a wide range of flows. Habitat quantification is expressed as an index called Weighted Useable Area (WUA) and is given in square feet of habitat per 1,000 feet of stream. The determination of habitat-flow relationships progressed initially from the individual transect level, to the site/sub-reach level in which a composited habitat –flow curve was developed based on transect weightings within the site/sub-reach (i.e., 2 sites per reach), and finally to the reach level, in which a single habitat-flow relationship was derived for each reach based on reach specific habitat mapping and corresponding transect weightings. The steps in this analysis are described below.
3.5.2.1 Transect Weighting and Habitat Mapping
The results of the mainstem transect WUA calculations for each transect were weighted based on the amount of habitat each transect represented within their respective operational reaches. During the site selection process, transect groupings (as represented by a site) were generally positioned in both the upper and lower portion (i.e., sub-reach) of each Operational Reach in part to help capture geomorphological differences within a reach. As such, each grouping of transects at a site can be viewed as representing a sub-reach within each Operational Reach. Sub-reaches were defined based primarily on break points between the Process Reaches as determined in Stillwater Sciences and Meridian Environmental (2008b). However, because Operational Reach 2 falls entirely within a single process reach, the delineation between Reach 2 Lower and Reach 2 Upper was defined as the longitudinal midpoint of Operational Reach 2. A complete description of sub-reach definitions is provided in Table 3-5. Once the sub-reaches were defined, the habitat composition (by length) of each sub-reach was calculated using the results of the habitat mapping study completed by Stillwater Sciences and Meridian Environmental (2008a). To ensure that each habitat unit was assigned to the appropriate sub-reach, this step required making a slight adjustment to the length of each unit

Sultan River Instream Flow Study – RSP 3
R2 Resource Consultants, Inc. 3-32 March 19, 2009 1628.07/Instream Flow Report_031909
measured during the RSP18 study, such that the measured river-miles were consistent with the Operational Reach breaks (i.e., Powerhouse = RM 4.3; Diversion Dam = RM 9.7). In addition, because the habitat surrounding islands was typically divided into separate units, the habitat composition of each sub-reach was calculated using only mainstem units to avoid overestimating the contribution of split channel sections of river (i.e., parallel units). Table 3-5. Description of sub-reaches used for weighting of transects for the Sultan River instream
flow study.
Transect Group Sub-Reach
Operational Reach (OR)
Process Reach (PR) River-Miles Represented
Reach 1A OR 1 PR 1 Skykomish R. confluence (RM 0.0) upstream to upper bound of Process Reach 1 (RM 3.0)
Reach 1B OR 1 PR 2 Lower bound of Process Reach 2 (RM 3.0) upstream to Powerhouse (RM 4.3)
Reach 2 Lower OR 2 PR 2 Powerhouse (RM 4.3) upstream to midpoint of Operational Reach 2 (RM 7.0)
Reach 2 Upper OR 2 PR 2 Midpoint of Operational Reach 2 (RM 7.0) upstream to Diversion Dam (RM 9.7)
Reach 3 Lower OR 3 PR 2 Diversion Dam (RM 9.7) upstream to upper bound of Process Reach 2 (RM 11.0)
Reach 3 Upper OR 3 PR 3 Lower bound of Process Reach 3 (RM 11.0) upstream to terminus of 2007 habitat survey (RM 16.2)
The next step in weighting the instream flow transects required reclassifying the habitat type initially assigned to each transect to be consistent with the habitat classifications used in RSP18. This was followed by assigning a number of river miles to each transect based on the transect habitat type and the amount of that habitat type within the corresponding sub-reach. Where multiple transects with the same habitat type were located within the same sub-reach, the amount of that habitat was divided equally among each transect. For example, Reach 1A contained 1.97 river-miles of glide habitat and four transects classified as glides. Thus, each of these glide transects were assigned to represent 0.46 miles of river (Table 3-6). At the reach level, transect weighting was calculated as a percentage by dividing the number of miles represented by each transect by the total number of miles within each Operational Reach (rather than sub-reach). This approach was slightly modified for sub-reaches where surveyed habitat types were not represented by any transects. Specifically, there were no transects in any sub-reach that qualified as cascades, as defined in RSP 18. In addition, because only two

Sultan River Instream Flow Study – RSP 3
R2 Resource Consultants, Inc. 3-33 March 19, 2009 1628.07/Instream Flow Report_031909
Table 3-6. Transect-weighting factors used to derive reach specific habitat results from the PHABSIM analysis for the Sultan River instream flow study. GLD = glide; LGR = low gradient riffle; RPD = rapid; POOL = pool.
Reach Sub Reach Transect Habitat Type River Miles
Assigned
Transect Weighting
Factor* 1 1A 1 GLD 0.46 13.1% 1 1A 2 LGR 0.26 7.5% 1 1A 3 GLD 0.46 13.1% 1 1A 4 LGR 0.26 7.5% 1 1A 5 LGR 0.26 7.5% 1 1A 6 GLD 0.46 13.1% 1 1A 7 LGR 0.26 7.5% 1 1A 8 GLD 0.46 13.1% 1 1A 9 POOL 0.00 0.0% 1 1A 10 RPD 0.09 2.5% 1 1B 1 LGR 0.16 4.6% 1 1B 2 GLD 0.37 10.3% 2 2 Lower 1 GLD 0.07 1.3% 2 2 Lower 2 RPD 0.29 5.9% 2 2 Lower 3 GLD 0.07 1.3% 2 2 Lower 4 POOL 0.76 15.3% 2 2 Lower 5 LGR 0.74 14.8% 2 2 Lower 6 POOL 0.76 15.3% 2 2 Upper 1 POOL 0.96 19.2% 2 2 Upper 2 GLD 0.51 10.3% 2 2 Upper 3 LGR 0.12 2.4% 2 2 Upper 4 LGR 0.12 2.4% 2 2 Upper 5 RPD 0.35 7.0% 2 2 Upper 6 LGR 0.12 2.4% 2 2 Upper 7 LGR 0.12 2.4% 3 3 Lower 1 GLD 0.09 1.4% 3 3 Lower 2 LGR 0.14 2.3% 3 3 Lower 3 RPD 0.18 2.9% 3 3 Lower 4 GLD 0.09 1.4% 3 3 Lower 5 POOL 0.61 10.0% 3 3 Lower 6 LGR 0.14 2.3% 3 3 Lower 7 GLD 0.09 1.4% 3 3 Upper 1 RPD 0.53 8.7% 3 3 Upper 2 LGR 0.30 4.9% 3 3 Upper 3 LGR 0.30 4.9% 3 3 Upper 4 GLD 1.16 19.1% 3 3 Upper 5 POOL 2.18 35.8% 3 3 Upper 6 LGR 0.30 4.9%
* The total percentages by reach may not equal 100% due to rounding.

Sultan River Instream Flow Study – RSP 3
R2 Resource Consultants, Inc. 3-34 March 19, 2009 1628.07/Instream Flow Report_031909
transects were placed in Reach 1B (one glide and one riffle), none of the rapid or pool habitats in this sub-reach were represented by transects. To address this issue, the total length of each operational reach (i.e., the denominator) excluded all cascade habitat. In addition, the total length of Operational Reach 1 excluded all of the rapid and pool habitat in sub-reach 1B. The WUA values for each transect were subsequently weighted according to the values noted in Table 3-6 and the total length of habitat represented by the habitat type which the transect(s) represents computed. The WUA versus habitat curves were then used to estimate the relationship of total habitat area (HAs) for each operational reach, expressed in acres, to streamflow. The computation process followed the procedures noted by Bovee (1982). HA combines the amount of WUA provided among the different instream flow transects and sites weighted according to habitat types to provide an overall habitat – flow relationship for each operational reach.
3.5.3 Flow and Habitat Time Series
In a previously completed study (R2 2008a), impacts of the Project on basin hydrology were assessed by comparing flow differences between Stage 1 and Stage 2 conditions. Based on that assessment, the habitat-flow relationships for each reach were linked with the hydrographs defined for wet, average and dry water years to develop reach-specific flow and habitat time series for both Stage 1 and Stage 2 conditions. A common period was selected to perform the hydrologic analysis, from July 1 1984 to June 30 2004. This 20-year period is considered representative of current Project operations. From this 20-year period, representative wet, average, and dry years were selected to assess impacts of Project operations on fish habitat, based on a time-series analysis in this study. Flow records from the nearby gage on the Skykomish River near Gold Bar (USGS Gage 12134500) were used as a guide to select appropriate wet, average, and dry years from the 20-year period used to assess the Sultan River. From the 20-year period extending from 1985 through 2004, the years 1991, 2004, and 2001 were selected as the wet, average, and dry years, respectively. The average annual flows from these three years are associated with exceedance frequencies of 6%, 52%, and 95%, respectively, based on the longer period of record. These same years were then used in deriving the time-series assessments of fish habitat. Stage 1 hydrology was synthesized using hydrologic records obtained from the US Geological Survey (USGS), the District, and the City. The selection of a common study period for comparing Stage 1 and Stage 2 conditions enabled a direct assessment of Project-related effects without the confounding factors that would be associated with different study periods with differing hydrology. The hydrologic analysis was performed at the upstream and downstream ends of each of the three study reaches.

Sultan River Instream Flow Study – RSP 3
R2 Resource Consultants, Inc. 3-35 March 19, 2009 1628.07/Instream Flow Report_031909
3.5.3.1 Flows in Operational Reach 3
Daily flows at the downstream and upstream ends of Operational Reach 3 for wet (1991), average (2004), and dry (2001) years under Stage 1 and Stage 2 conditions are shown in Figures 3-20 and 3-21, respectively. Flows at the downstream end of Operational Reach 3 are higher than flows at upstream end of Operational Reach 3 because the Sultan River gains additional accretion from a drainage area of 8.8 mi2 between Culmback Dam and the Diversion Dam. For the time series analyses performed in this study, daily flows at instream flow study sites in Operational Reach 3 were determined by applying a drainage area ratio to the accretion flows between Culmback Dam and the Diversion Dam. Flows in Operational Reach 3 have generally been reduced by the Project during all months of the year.
3.5.3.2 Flows in Operational Reach 2
Daily flows at the downstream and upstream ends of Operational Reach 2 for wet (1991), average (2004), and dry (2001) years under Stage 1 and Stage 2 conditions are shown in Figures 3-22 and 3-23, respectively. Flows at the downstream end of Operational Reach 2 are higher than flows at upstream end of Operational Reach 2 because the Sultan River gains additional accretion between the Diversion Dam and the Powerhouse. The total additional drainage area to the Sultan River between the Diversion Dam and the Powerhouse is 17.1 mi2. Of this total, runoff from 13.7 mi2 is unregulated, and runoff from 3.4 mi2 is regulated by water diversion operations at Lake Chaplain. For the time series analyses performed in this study, daily flows at instream flow study sites in Operational Reach 2 were determined by applying a drainage area ratio (based on the unregulated portion of the drainage) to the accretion flows between the Diversion Dam and the Powerhouse. Low flows in Operational Reach 2 have been increased by the Project, especially during the summer months (August and September). Flows in Operational Reach 2 have generally been reduced during the remainder of the year (October through July), except for July 2004.
3.5.3.3 Flows in Operational Reach 1
Daily flows at the downstream and upstream ends of Operational Reach 1 for wet (1991), average (2004), and dry (2001) years under Stage 1 and Stage 2 conditions are shown in Figures 3-24 and 3-25, respectively. Flows at the downstream end of Operational Reach 1 are higher than flows at upstream end of Operational Reach 1 because the Sultan River gains additional accretion from a drainage area of 10.7 mi2 between the Powerhouse and the confluence with the Skykomish River. For the time series analyses performed in this study, daily flows at instream flow study sites in Operational Reach 1 were determined by applying a drainage area ratio to the accretion flows between the Powerhouse and the confluence with the Skykomish River. Low

Sultan River Instream Flow Study – RSP 3
R2 Resource Consultants, Inc. 3-36 March 19, 2009 1628.07/Instream Flow Report_031909
7/1/1990 10/1/1990 1/1/1991 4/1/1991 7/1/1991
Flow
(cfs
)
1
10
100
1000
10000
7/1/2003 10/1/2003 1/1/2004 4/1/2004 7/1/2004
Flow
(cfs
)
1
10
100
1000
10000
7/1/2000 10/1/2000 1/1/2001 4/1/2001 7/1/2001
Flow
(cfs
)
1
10
100
1000
10000
Wet Year
Average Year
Dry Year
Figure 3-20. Daily flows in the Sultan River at the upstream end of
Operational Reach 3 under Stage 1 (thin line) and Stage 2 (thick line) conditions during representative wet (1991), average (2004), and dry (2001) years.

Sultan River Instream Flow Study – RSP 3
R2 Resource Consultants, Inc. 3-37 March 19, 2009 1628.07/Instream Flow Report_031909
7/1/1990 10/1/1990 1/1/1991 4/1/1991 7/1/1991
Flow
(cfs
)
1
10
100
1000
10000
7/1/2003 10/1/2003 1/1/2004 4/1/2004 7/1/2004
Flow
(cfs
)
1
10
100
1000
10000
7/1/2000 10/1/2000 1/1/2001 4/1/2001 7/1/2001
Flow
(cfs
)
1
10
100
1000
10000
Wet Year
Average Year
Dry Year
Figure 3-21. Daily flows in the Sultan River at the downstream end of
Operational Reach 3 under Stage 1 (thin line) and Stage 2 (thick line) conditions during representative wet (1991), average (2004), and dry (2001) years.

Sultan River Instream Flow Study – RSP 3
R2 Resource Consultants, Inc. 3-38 March 19, 2009 1628.07/Instream Flow Report_031909
7/1/1990 10/1/1990 1/1/1991 4/1/1991 7/1/1991
Flow
(cfs
)
1
10
100
1000
10000
7/1/2003 10/1/2003 1/1/2004 4/1/2004 7/1/2004
Flow
(cfs
)
1
10
100
1000
10000
7/1/2000 10/1/2000 1/1/2001 4/1/2001 7/1/2001
Flow
(cfs
)
1
10
100
1000
10000
Wet Year
Average Year
Dry Year
Figure 3-22. Daily flows in the Sultan River at the upstream end of
Operational Reach 2 under Stage 1 (thin line) and Stage 2 (thick line) conditions during representative wet (1991), average (2004), and dry (2001) years.

Sultan River Instream Flow Study – RSP 3
R2 Resource Consultants, Inc. 3-39 March 19, 2009 1628.07/Instream Flow Report_031909
7/1/1990 10/1/1990 1/1/1991 4/1/1991 7/1/1991
Flow
(cfs
)
1
10
100
1000
10000
7/1/2003 10/1/2003 1/1/2004 4/1/2004 7/1/2004
Flow
(cfs
)
1
10
100
1000
10000
7/1/2000 10/1/2000 1/1/2001 4/1/2001 7/1/2001
Flow
(cfs
)
1
10
100
1000
10000
Wet Year
Average Year
Dry Year
Figure 3-23. Daily flows in the Sultan River at the downstream end of
Operational Reach 2 under Stage 1 (thin line) and Stage 2 (thick line) conditions during representative wet (1991), average (2004), and dry (2001) years.

Sultan River Instream Flow Study – RSP 3
R2 Resource Consultants, Inc. 3-40 March 19, 2009 1628.07/Instream Flow Report_031909
7/1/1990 10/1/1990 1/1/1991 4/1/1991 7/1/1991
Flow
(cfs
)
1
10
100
1000
10000
7/1/2003 10/1/2003 1/1/2004 4/1/2004 7/1/2004
Flow
(cfs
)
1
10
100
1000
10000
7/1/2000 10/1/2000 1/1/2001 4/1/2001 7/1/2001
Flow
(cfs
)
1
10
100
1000
10000
Wet Year
Average Year
Dry Year
Figure 3-24. Daily flows in the Sultan River at the upstream end of
Operational Reach 1 under Stage 1 (thin line) and Stage 2 (thick line) conditions during representative wet (1991), average (2004), and dry (2001) years.

Sultan River Instream Flow Study – RSP 3
R2 Resource Consultants, Inc. 3-41 March 19, 2009 1628.07/Instream Flow Report_031909
7/1/1990 10/1/1990 1/1/1991 4/1/1991 7/1/1991
Flow
(cfs
)
1
10
100
1000
10000
7/1/2003 10/1/2003 1/1/2004 4/1/2004 7/1/2004
Flow
(cfs
)
1
10
100
1000
10000
7/1/2000 10/1/2000 1/1/2001 4/1/2001 7/1/2001
Flow
(cfs
)
1
10
100
1000
10000
Wet Year
Average Year
Dry Year
Figure 3-25. Daily flows in the Sultan River at the downstream end of
Operational Reach 1 under Stage 1 (thin line) and Stage 2 (thick line) conditions during representative wet (1991), average (2004), and dry (2001) years.

Sultan River Instream Flow Study – RSP 3
R2 Resource Consultants, Inc. 3-42 March 19, 2009 1628.07/Instream Flow Report_031909
flows in Operational Reach 1 have been increased by the Project, especially during the summer months (July, August, and September). The magnitudes of high flows have been reduced by the Project. The overall time series were developed in accordance with guidelines provided in Milhous et al. (1990) for each species and spanned the period of time specific to a given life stage. R2 developed a Fortran program to link the species and life stage specific habitat-flow relationships to the appropriate hydrology as depicted in Figures 3-14 through 3-19, which then computed first, the corresponding time series (based on a daily time step) and then a habitat-duration curve. These time series and curves were compared on a Stage 1 versus Stage 2 basis to determine reach – specific Project effects. Importantly and as previously noted, operational impacts of the Project were not assessed with respect to natural flows, but rather with respect to the flow regime associated with municipal water withdrawals (referred to in this study as Stage 1 conditions).

Sultan River Instream Flow Study – RSP 3
R2 Resource Consultants, Inc. 4-1 March 19, 2009 1628.07/Instream Flow Report_031909
4. HABITAT MODELING
This section presents the results of the habitat modeling and times series analysis completed for the Sultan River, and organizationally progresses from the upper (Reach 3) to lower (Reach 1) operational reaches. The results focus on the total habitat area (HA) versus flow relationships since these provide reach–scale estimates of the total amount of habitat for a given species and life stage available under different flow conditions. For convenience, the results are presented graphically both as numerical estimates of habitat, expressed in acres, as well as normalized estimates expressed as percentages of maximum habitat area. The former are useful for comparing the relative amounts of habitat provided for a given species and life stage under different flow conditions, while the latter are useful for comparing overall habitat-flow response dynamics. The percentages of maximum habitat corresponding to specific flows are also presented in tabular format. Results of PHABSIM analysis presented for each reach on a study site basis (i.e., Reach 3 Upper Site and Reach 3 Lower Site) for all species and life stages are presented in Figures D1-1 through D1-24 contained in Appendix D1. The time series analysis provides a comparison of the amounts of habitat that would occur on a daily basis under a Wet, Normal, and Dry year scenario for Stage 1 versus Stage 2 operations6. The specific time series that are presented are unique to the individual species and life stage periodicities identified in Figure 2-4. Habitat duration curves depict overall differences in the availability (presented as a percentage exceedance value) of habitat for a given species, life stage and periodicity, under Stage 1 and Stage 2 conditions. Results of the HA versus flow relationships are presented for each of the following target fish species identified in the respective reaches: Reach 3 – Chinook and coho salmon, and steelhead, rainbow and cutthroat trout; Reach 2 and Reach 3 – Chinook, coho, pink, and chum salmon, and steelhead, rainbow and cutthroat trout. Because of their listing status and importance from a resource management perspective, the time series and habitat duration analysis presented in this section are focused primarily on Chinook salmon and steelhead trout. However, time series and habitat duration analysis are also presented for rainbow and cutthroat trout for Reach 3, since these two species are the only salmonids presently found within this reach; anadromous salmonids have not been found in Reach 3 since 1929. Appendix D contains the results of time series and habitat duration analysis for other species.
6 The wet, average, and dry years corresponded to years 1991, 2004, and 2001 as determined from an evaluation of the 20-year period extending from 1985 through 2004. Stage 1 conditions correspond to conditions prior to operation of the hydroelectric project (i.e., prior to 1984), but with the diversion of water for municipal purposes.

Sultan River Instream Flow Study – RSP 3
R2 Resource Consultants, Inc. 4-2 March 19, 2009 1628.07/Instream Flow Report_031909
Results of the side channel surveys are also provided. These include a graphical display of the relationship of side channel connectivity to mainstem flow, a depiction of cumulative side channel area versus flow, and plots of habitat (WUA) versus flow for each species and life stage.
4.1 REACH 3 – CULMBACK DAM TO DIVERSION DAM
Modeling results for this reach are presented for Chinook and coho salmon, and steelhead trout, three anadromous salmonid species that could presumably inhabit the reach if fish passage facilities were provided at the Diversion Dam. Results are also presented for rainbow trout which is currently present in the reach, and cutthroat trout which could occur within the reach.
4.1.1 PHABSIM Analysis
4.1.1.1 Spawning Habitat
Spawning habitat versus flow relationships generated for this reach indicate that the amount of habitat provided at the habitat maximizing flow would be highest for Chinook (230 cfs provides ≈ 10 acres), followed by steelhead (230-200 cfs provides ≈ 8 acres) and then coho (160 to 140 cfs provides ≈ 6.5 acres) (Figure 4-1; Table 4-1). When habitats are expressed as percentages of maximum, the relationships for Chinook and steelhead are of similar form. Habitat amounts remain relatively high (≥ 85% of maximum) for all three species even at flows as low as 140 cfs for Chinook, 160 cfs for steelhead, and 120 cfs for coho (Table 4-1; Figure 4-2). The habitat-flow relationships for rainbow and cutthroat peak at flows of 160 cfs and 80 cfs, respectively (Figures 4-1 and 4-2; Table 4-2). For these two species, flows as low as 120 cfs for rainbow, and ≈ 50-52 cfs for cutthroat would still provide ≥ 85% of maximum habitat.
4.1.1.2 Juvenile and Adult Habitat
Habitat-flow relationships derived for juvenile and adult life stages reflected a relatively wide range of response curves for the target species. Overall, habitat maximizing flows range from the lowest to highest for coho juvenile (≈ 5.5 acres at 30 cfs), steelhead adults (≈ 8.5 acres at 55 cfs), Chinook juvenile (≈ 6.5 acres at 200 cfs), rainbow juvenile (≈ 5 acres at 230 cfs), cutthroat juvenile (≈ 4.5 acres at 290 cfs), and Chinook adults (≈ 4 acres at 680 cfs) (Figures 4-3 and 4-4; Tables 4-1 and 4-2). The shapes of the steelhead, rainbow and cutthroat trout juvenile curves were generally similar, with each characterized by a broad, gradually decreasing descending limb. Juvenile habitat would remain at levels ≥ 85% of maximum at flows of 20 cfs for coho, 230 cfs for steelhead, and 120 cfs for Chinook, rainbow and cutthroat (Table 4-2; Figure 4-4).

Sultan River Instream Flow Study – RSP 3
R2 Resource Consultants, Inc. 4-3 March 19, 2009 1628.07/Instream Flow Report_031909
Reach 3: Spawning
0 200 400 600 800 10000
2
4
6
8
10
12Chinook SteelheadCoho
Flow (cfs)0 200 400 600 800 1000
Tota
l Hab
itat A
rea
(acr
es)
0
1
2
3
4
5
6Rainbow TroutCutthroat Trout
Figure 4-1. Total spawning habitat area (acres) versus flow (cfs) relationships for Chinook and
coho salmon and steelhead trout (upper figure), and rainbow and cutthroat trout (lower figure) in Reach 3 of the Sultan River, Washington. * Note that anadromous salmonids have not been present since 1929 within Reach 3; for comparative purposes, all anadromous species were analyzed and results displayed.

Sultan River Instream Flow Study – RSP 3
R2 Resource Consultants, Inc. 4-4 March 19, 2009 1628.07/Instream Flow Report_031909
Table 4-1. Percentages of maximum habitat area at specified flows (cfs) for Chinook, steelhead, and coho salmon life stages within Reach 3 of the Sultan River, Washington. * Note that anadromous salmonids have not been present since 1929 within Reach 3; for comparative purposes, all anadromous species were analyzed and results displayed.
Chinook Steelhead Coho Flow (cfs) Spawning Juvenile Adult Spawning Juvenile Adult Spawning Juvenile
20 9.0 15.7 45.7 7.9 17.9 83.2 19.1 90.9 30 14.1 21.5 48.0 13.7 21.9 96.1 27.7 100.0 42 19.2 29.0 50.4 18.7 27.4 99.2 36.2 99.1 54.6 23.9 42.0 52.7 21.6 32.9 100.0 44.8 89.1 65.0 28.6 54.3 54.5 24.2 37.3 99.0 52.9 82.5 80 36.0 68.7 57.0 28.1 43.7 93.6 64.5 74.5
100 52.7 80.5 60.3 41.8 51.8 82.3 78.6 70.1 120 70.5 88.0 63.4 60.5 59.6 72.3 92.6 66.6 140 87.2 92.5 66.4 79.7 66.8 62.8 100.0 63.9 160 95.7 95.4 69.2 92.8 72.8 59.3 100.0 60.0 176 98.1 98.0 71.2 97.4 76.9 56.1 98.9 57.5 200 99.7 100.0 74.2 100.0 81.7 53.6 95.4 55.8 230 100.0 96.6 77.6 100.0 87.4 47.6 87.5 53.2 260 98.0 90.9 80.9 91.6 91.5 41.7 75.0 50.0 290 93.9 86.7 83.8 81.7 94.5 39.4 64.7 49.3 320 84.0 82.6 86.5 70.2 96.9 36.1 54.7 47.0 349.5 73.0 78.9 88.8 63.4 97.1 34.2 47.4 46.2 380 62.1 76.2 91.1 58.3 98.3 33.3 41.5 45.9 410 52.1 73.7 93.1 53.8 99.4 33.1 36.4 45.1 440 43.7 71.4 94.8 49.5 99.8 32.7 31.8 44.4 470 36.6 69.3 96.0 45.1 100.0 32.4 28.0 44.0 500 31.8 66.9 97.0 40.7 99.7 32.2 25.6 44.1 509.6 30.3 66.0 97.3 39.3 99.5 32.1 24.9 44.1 550 27.9 62.9 98.0 34.6 98.1 31.5 24.1 43.6 610 26.7 59.1 99.0 28.6 96.9 30.1 23.5 42.5 680 25.9 54.3 100.0 23.4 95.7 27.3 20.7 40.9 750 25.8 51.0 98.8 21.9 92.2 27.3 20.2 42.2 830 25.6 49.3 96.4 22.0 90.0 28.4 19.2 40.5 910 25.2 48.3 93.3 21.2 88.1 28.6 18.5 40.7
1000 24.8 46.9 90.8 20.4 84.3 27.9 18.0 40.7
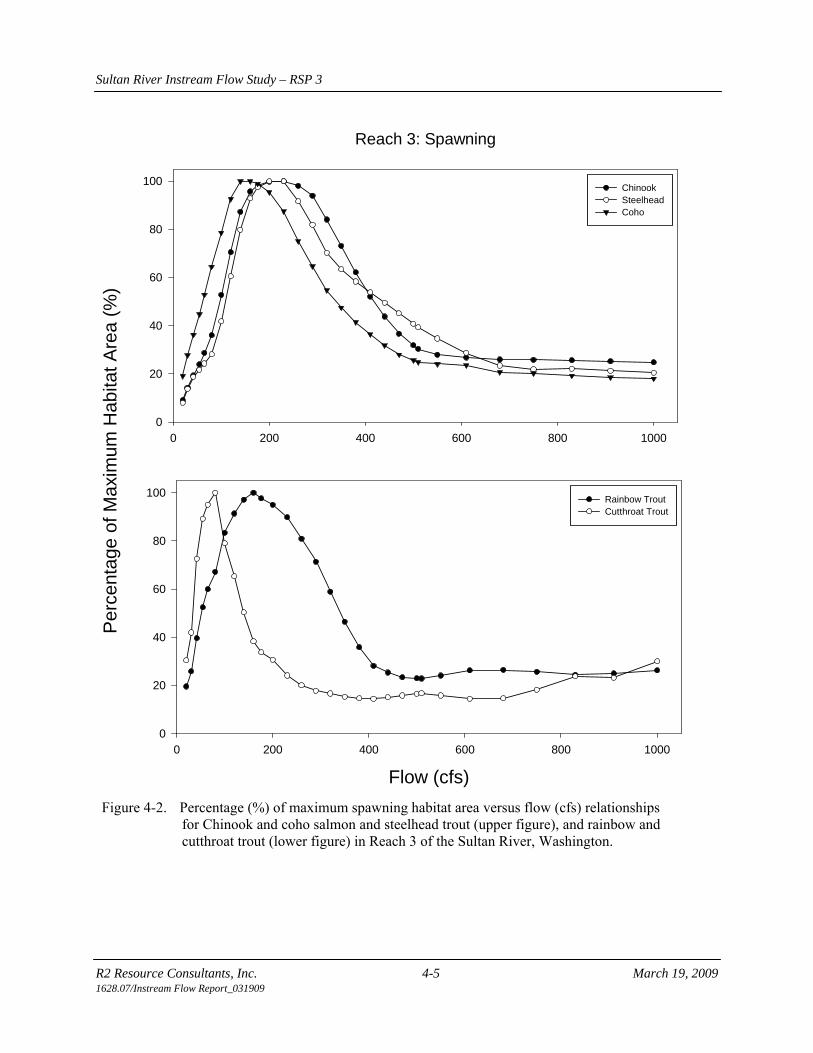
Sultan River Instream Flow Study – RSP 3
R2 Resource Consultants, Inc. 4-5 March 19, 2009 1628.07/Instream Flow Report_031909
Reach 3: Spawning
0 200 400 600 800 10000
20
40
60
80
100 ChinookSteelheadCoho
Flow (cfs)0 200 400 600 800 1000
Perc
enta
ge o
f Max
imum
Hab
itat A
rea
(%)
0
20
40
60
80
100 Rainbow TroutCutthroat Trout
Figure 4-2. Percentage (%) of maximum spawning habitat area versus flow (cfs) relationships
for Chinook and coho salmon and steelhead trout (upper figure), and rainbow and cutthroat trout (lower figure) in Reach 3 of the Sultan River, Washington.

Sultan River Instream Flow Study – RSP 3
R2 Resource Consultants, Inc. 4-6 March 19, 2009 1628.07/Instream Flow Report_031909
Table 4-2. Percentages of maximum habitat area at specified flows (cfs) for rainbow and
cutthroat trout life stages within Reach 3 of the Sultan River, Washington. Rainbow Cutthroat
Flow (cfs) Spawning Juvenile Spawning Juvenile 20 19.5 26.8 30.5 16.1 30 25.8 33.3 42.0 25.4 42 39.6 41.0 72.5 38.8 54.6 52.4 48.4 89.2 53.0 65.0 60.0 54.6 95.0 62.0 80 67.1 63.4 100.0 72.3
100 83.3 75.2 79.0 83.7 120 91.3 85.4 65.3 91.4 140 97.1 92.6 50.3 93.5 160 100.0 95.3 38.3 95.0 176 97.6 96.3 33.8 96.2 200 95.0 99.6 30.6 99.8 230 89.8 100.0 24.1 99.6 260 80.9 98.9 20.0 99.7 290 71.3 98.1 17.8 100.0 320 58.9 97.5 16.6 97.5 349.5 46.4 96.6 15.2 96.5 380 35.8 95.0 14.7 95.1 410 28.1 93.3 14.4 93.2 440 25.3 91.6 15.1 90.8 470 23.4 89.9 15.8 88.4 500 22.9 89.2 16.5 85.7 509.6 22.8 88.9 16.8 84.9 550 24.0 86.8 15.7 82.9 610 26.2 83.7 14.4 81.6 680 26.4 81.1 14.6 76.8 750 25.6 78.8 18.1 73.4 830 24.3 78.3 23.7 70.6 910 24.9 77.2 23.2 66.1
1000 26.2 75.2 30.0 61.0

Sultan River Instream Flow Study – RSP 3
R2 Resource Consultants, Inc. 4-7 March 19, 2009 1628.07/Instream Flow Report_031909
Reach 3: Juvenile and Adult
0 200 400 600 800 1000
Tota
l Hab
itat A
rea
(acr
es)
0
2
4
6
8
10Chinook - JuvenileChinook - AdultSteelhead - JuvenileSteelhead - AdultCoho - Juvenile
Flow (cfs)0 200 400 600 800 1000
0
1
2
3
4
5
6Rainbow Trout - Juvenile & AdultCutthroat Trout - Juvenile & Adult
Figure 4-3. Total juvenile and adult habitat area (acres) versus flow (cfs) relationships for
Chinook and coho salmon and steelhead trout (upper figure), and rainbow and cutthroat trout (lower figure) in Reach 3 of the Sultan River, Washington.

Sultan River Instream Flow Study – RSP 3
R2 Resource Consultants, Inc. 4-8 March 19, 2009 1628.07/Instream Flow Report_031909
Reach 3: Juvenile and Adult
0 200 400 600 800 1000
Per
cent
age
of M
axim
um H
abita
t Are
a (%
)
0
20
40
60
80
100
Flow (cfs)0 200 400 600 800 1000
0
20
40
60
80
100 Rainbow Trout - Juvenile & AdultCutthroat Trout - Juvenile & Adult
Chinook - JuvenileChinook - Adult
Steelhead - JuvenileSteelhead - Adult
Coho - Juvenile
Figure 4-4. Percentage (%) of maximum juvenile and adult habitat area versus flow (cfs)
relationships for Chinook and coho salmon and steelhead trout (upper figure), and rainbow and cutthroat trout (lower figure) in Reach 3 of the Sultan River, Washington.

Sultan River Instream Flow Study – RSP 3
R2 Resource Consultants, Inc. 4-9 March 19, 2009 1628.07/Instream Flow Report_031909
4.1.1.3 Habitat Time Series
Habitat time series and corresponding habitat duration curves for rainbow and cutthroat trout spawning are presented in Figures 4-5 through 4-8. For Reach 3, the Stage 1 conditions represent flow conditions regulated by Culmback Dam prior to hydroelectric operations. Thus, flows would essentially reflect natural flow conditions as passed-through Culmback Dam downstream to the Diversion Dam. Under Stage 2 conditions, flows are regulated by Culmback Dam for hydroelectric generation with flow releases into this reach consisting of a 20 cfs release year-round. Based on results of the time series analysis, Stage 2 conditions provide higher rainbow and cutthroat trout spawning habitat levels than Stage 1 conditions, a likely result of having lower velocities provided during the spawning periods than would otherwise occur. A similar trend was noted for coho spawning under the wet and average year conditions, as well as for coho juvenile rearing under all year types (Figures D2-1 to D2-4; Appendix D2). This trend is reversed for rainbow and cutthroat trout juvenile rearing; i.e., Stage 1 conditions provide higher habitat levels than Stage 2 (Figures D2-5 to D2-8; Appendix D2). A similar pattern is noted in the time series analysis for Chinook and steelhead spawning as depicted in Figures 4-9 through 4-12 and juvenile rearing (Figures D2-9 to D2-12; Appendix D2). For Chinook spawning, the difference is most pronounced under the dry year scenario (Figures 4-9 and 4-10), while for steelhead, the greatest difference occurs under the wet year scenario (Figures 4-11 and 4-12). Comparisons of the median (50%), maximum, minimum and average habitat areas and percentage differences under Stage 1 and Stage 2 operations for all target species in Reach 3 based on the time series analysis are presented in Tables 4-3 and 4-4 (exceedance values for Reach 3).
4.2. REACH 2 – DIVERSION DAM TO POWERHOUSE
Modeling results for Reach 2 are presented for Chinook, coho, chum, and pink salmon, and steelhead trout spawning. With the exception of chum salmon, all of these species are known to spawn in Reach 2. Chum salmon spawning has also been included as a primary target species/lifestage because of their potential use of this reach. Because of the short residence time of juvenile chum and pink salmon in the Sultan River following emergence, modeling results for juvenile rearing in Reach 2 are limited to Chinook and coho salmon, and steelhead trout.

Sultan River Instream Flow Study – RSP 3
R2 Resource Consultants, Inc. 4-10 March 19, 2009 1628.07/Instream Flow Report_031909
Sultan River, Reach 3Rainbow Trout Spawning
Apr 01 Apr 15 Apr 29 May 13 May 27 Jun 10 Jun 24 0
40
80
120
160
200
240
DateApr 01 Apr 15 Apr 29 May 13 May 27 Jun 10 Jun 24 0
40
80
120
160
200
240
Apr 01 Apr 15 Apr 29 May 13 May 27 Jun 10 Jun 24 Tota
l Hab
itat A
rea
(100
0 ft2 )
0
40
80
120
160
200
240
Wet Year
Average Year
Dry Year
Stage 1 Stage 2
Figure 4-5. Time series analysis depicting total rainbow trout spawning habitat (1000 ft2) available over the period of spawning under wet, average and dry year scenarios for Reach 3 of the Sultan River, Washington.

Sultan River Instream Flow Study – RSP 3
R2 Resource Consultants, Inc. 4-11 March 19, 2009 1628.07/Instream Flow Report_031909
Sultan River, Reach 3Rainbow Trout Spawning
0 10 20 30 40 50 60 70 80 90 1000
40
80
120
160
200
Percent Exceedance (%)0 10 20 30 40 50 60 70 80 90 100
0
40
80
120
160
200
0 10 20 30 40 50 60 70 80 90 100Tota
l Hab
itat A
rea
(100
0 ft2 )
0
40
80
120
160
200
Wet Year
Average Year
Dry Year
Stage 1 Stage 2
Figure 4-6. Habitat duration curves for rainbow trout spawning habitat (1000 ft2) under wet, average, dry year scenarios for Reach 3 of the Sultan River, Washington.

Sultan River Instream Flow Study – RSP 3
R2 Resource Consultants, Inc. 4-12 March 19, 2009 1628.07/Instream Flow Report_031909
DateJul-01 Jul-15 Jul-29 Apr-28 May-12 May-26 Jun-09 Jun-230
30
60
90
120
150
180
Jul-01 Jul-15 Jul-29 Apr-28 May-12 May-26 Jun-09 Jun-23Tota
l Hab
itat A
rea
(100
0 ft2 )
0
30
60
90
120
150
180
Sultan River, Reach 3Cutthroat Trout Spawning
Jul-01 Jul-15 Jul-29 Apr-28 May-12 May-26 Jun-09 Jun-230
30
60
90
120
150
180Wet Year
Average Year
Dry Year
Stage 1 Stage 2
Figure 4-7. Time series analysis depicting total cutthroat trout spawning habitat (1000 ft2) available over the period of spawning under wet, average and dry year scenarios for Reach 3 of the Sultan River, Washington.

Sultan River Instream Flow Study – RSP 3
R2 Resource Consultants, Inc. 4-13 March 19, 2009 1628.07/Instream Flow Report_031909
Sultan River, Reach 3Cutthroat Trout Spawning
0 10 20 30 40 50 60 70 80 90 1000
40
80
120
160
Percent Exceedance (%)0 10 20 30 40 50 60 70 80 90 100
0
40
80
120
160
0 10 20 30 40 50 60 70 80 90 100Tota
l Hab
itat A
rea
(100
0 ft2 )
0
40
80
120
160
Wet Year
Average Year
Dry Year
Stage 1 Stage 2
Figure 4-8. Habitat duration curves for cutthroat trout spawning habitat (1000 ft2) under wet, average, dry year scenarios for Reach 3 of the Sultan River, Washington.

Sultan River Instream Flow Study – RSP 3
R2 Resource Consultants, Inc. 4-14 March 19, 2009 1628.07/Instream Flow Report_031909
Sultan River, Reach 3Chinook Spawning
Sep 15 Sep 22 Sep 29 Oct 06 Oct 13 Oct 20 Oct 27 Nov 03 Nov 10 Nov 17 0
100
200
300
400
500
DateSep 15 Sep 22 Sep 29 Oct 06 Oct 13 Oct 20 Oct 27 Nov 03 Nov 10 Nov 17 0
100
200
300
400
500
Sep 15 Sep 22 Sep 29 Oct 06 Oct 13 Oct 20 Oct 27 Nov 03 Nov 10 Nov 17 Tota
l Hab
itat A
rea
(100
0 ft2 )
0
100
200
300
400
500
Wet Year
Average Year
Dry Year
Stage 1 Stage 2
Figure 4-9. Time series analysis depicting total Chinook salmon spawning habitat (1000 ft2) available over the period of spawning under wet, average and dry year scenarios for Reach 3 of the Sultan River, Washington.

Sultan River Instream Flow Study – RSP 3
R2 Resource Consultants, Inc. 4-15 March 19, 2009 1628.07/Instream Flow Report_031909
Sultan River, Reach 3Chinook Spawning
0 10 20 30 40 50 60 70 80 90 1000
100
200
300
400
500
Percent Exceedance (%)0 10 20 30 40 50 60 70 80 90 100
0
100
200
300
400
500
0 10 20 30 40 50 60 70 80 90 100Tota
l Hab
itat A
rea
(100
0 ft2 )
0
100
200
300
400
500
Wet Year
Average Year
Dry Year
Stage 1 Stage 2
Figure 4-10. Habitat duration curves for Chinook salmon spawning habitat (1000 ft2) under wet, average, dry year scenarios for Reach 3 of the Sultan River, Washington.

Sultan River Instream Flow Study – RSP 3
R2 Resource Consultants, Inc. 4-16 March 19, 2009 1628.07/Instream Flow Report_031909
Sultan River, Reach 3Steelhead Spawning
Mar 15 Mar 29 Apr 12 Apr 26 May 10 May 24 Jun 07 Jun 21 0
100
200
300
400
DateMar 15 Mar 29 Apr 12 Apr 26 May 10 May 24 Jun 07 Jun 21 0
100
200
300
400
Mar 15 Mar 29 Apr 12 Apr 26 May 10 May 24 Jun 07 Jun 21 Tota
l Hab
itat A
rea
(100
0 ft2 )
0
100
200
300
400
Wet Year
Average Year
Dry Year
Stage 1 Stage 2
Figure 4-11. Time series analysis depicting total steelhead trout spawning habitat (1000 ft2) available over the period of spawning under wet, average and dry year scenarios for Reach 3 of the Sultan River, Washington.

Sultan River Instream Flow Study – RSP 3
R2 Resource Consultants, Inc. 4-17 March 19, 2009 1628.07/Instream Flow Report_031909
Sultan River, Reach 3Steelhead Spawning
0 10 20 30 40 50 60 70 80 90 1000
100
200
300
400
Percent Exceedance (%)0 10 20 30 40 50 60 70 80 90 100
0
100
200
300
400
0 10 20 30 40 50 60 70 80 90 100Tota
l Hab
itat A
rea
(100
0 ft2 )
0
100
200
300
400
Wet Year
Average Year
Dry Year
Stage 1 Stage 2
Figure 4-12. Habitat duration curves for steelhead trout spawning habitat (1000 ft2) under wet, average, dry year scenarios for Reach 3 of the Sultan River, Washington.

Sultan River Instream Flow Study – RSP 3
R2 Resource Consultants, Inc. 4-18 March 19, 2009 1628.07/Instream Flow Report_031909
Table 4-3. Comparison of median, maximum, minimum, average and percentage difference in anadromous salmonid* habitat areas provided during Wet, Average, and Dry water year types for Stage 1 and Stage 2 conditions as determined from habitat duration analysis for operational Reach 3 of the Sultan River, Washington. * Note that anadromous salmonids have not been present since 1929 within Reach 3; for comparative purposes, all anadromous species were analyzed and results displayed.
Median (50% exceedance) Habitat Area (ft2)
Maximum Habitat Area (ft2)
Minimum Habitat Area (ft2)
Average Habitat Area (ft2)
Life Stage Species Stage 1 Stage 2 Stage 1 Stage 2 Stage 1 Stage 2 Stage 1 Stage 2 % Difference WATER YEAR - WET
Spawning Chinook 111,556 81,147 451,016 287,104 111,368 42,336 132,426 79,748 -39.8 Steelhead 92,525 51,863 364,304 174,842 74,133 38,251 132,896 54,311 -59.1 Coho 53,958 100,398 288,957 289,015 51,625 51,051 106,831 123,045 +15.2 Chum 136,071 192,742 429,922 426,151 133,964 133,025 184,499 216,336 +17.3 Pink 133,384 214,468 347,421 320,478 59,851 187,114 201,087 231,324 +15.0
Juvenile Chinook 175,376 94,029 300,527 297,195 135,654 51,143 191,797 114,208 -40.5 Steelhead 256,754 78,175 292,386 293,698 92,698 53,652 242,540 99,220 -59.1 Coho 98,904 220,117 213,804 229,572 93,062 94,953 113,828 206,452 +81.4
WATER YEAR - AVERAGE Spawning Chinook 148,575 64,552 444,958 457,179 111,186 43,039 182,840 82,748 -54.7
Steelhead 102,724 54,794 163,638 89,639 74,143 44,918 106,464 56,890 -46.6 Coho 59,744 99,528 291,466 273,053 51,987 65,843 82,158 113,311 +37.9 Chum 139,536 174,911 392,349 407,856 133,979 144,069 156,850 197,077 +25.6 Pink 176,432 191,813 347,308 332,779 60,002 103,254 201,645 213,261 +5.8
Juvenile Chinook 182,264 97,844 299,783 295,676 50,652 48,203 183,808 109,782 -40.3 Steelhead 259,814 77,625 292,486 285,830 53,752 52,579 237,407 87,705 -63.1 Coho 101,797 219,766 236,153 229,329 92,950 114,525 119,967 212,478 +77.1
WATER YEAR - DRY Spawning Chinook 390,792 51,771 451,501 190,677 111,556 43,983 324,994 57,104 -82.4
Steelhead 78,875 57,690 245,605 95,441 74,142 37,749 101,134 60,076 -40.6 Coho 124,676 81,697 288,388 218,192 52,118 62,830 138,092 87,050 -37.0 Chum 218,118 152,759 429,613 317,814 136,071 120,966 263,367 159,906 -39.3 Pink 109,935 207,592 337,826 315,438 59,215 192,235 146,922 217,372 +48.0
Juvenile Chinook 204,993 80,740 302,268 208,118 140,093 53,247 209,337 90,781 -56.6 Steelhead 269,443 68,231 292,487 152,065 161,797 55,308 259,480 74,072 -71.5 Coho 103,254 224,129 158,845 229,742 93,047 169,873 111,454 222,037 -82.4

Sultan River Instream Flow Study – RSP 3
R2 Resource Consultants, Inc. 4-19 March 19, 2009 1628.07/Instream Flow Report_031909
Table 4-4. Comparison of median, maximum, minimum, average and percentage difference in resident trout habitat areas provided during Wet, Average, and Dry water year types for Stage 1 and Stage 2 conditions as determined from habitat duration analysis for operational Reach 3 of the Sultan River, Washington.
Median (50% exceedance) Habitat Area (ft2)
Maximum Habitat Area (ft2)
Minimum Habitat Area (ft2) Average Habitat Area (ft2)
Life Stage Species Stage 1 Stage 2 Stage 1 Stage 2 Stage 1 Stage 2 Stage 1 Stage 2 % Difference WATER YEAR - WET
Spawning Rainbow 56,773 61,967 85,921 188,235 50,143 51,167 56,142 67,592 +20.4 Cutthroat 29,785 74,033 109,694 155,481 23,495 56,211 34,278 76,339 +122.7
Juvenile Rainbow 172,836 89,487 221,775 230,650 103,792 61,350 178,474 104,217 -41.6 Cutthroat 143,076 77,199 196,045 210,046 98,931 34,259 148,688 88,087 -40.8
WATER YEAR - AVERAGE Spawning Rainbow 53,747 61,086 183,225 113,025 49,522 47,990 57,589 64,141 +11.4
Cutthroat 40,848 72,744 152,487 140,141 23,608 54,413 52,168 80,087 +53.5
Juvenile Rainbow 179,395 88,955 220,899 226,835 61,399 59,970 176,181 96,689 -45.1 Cutthroat 157,928 76,467 195,507 204,120 34,343 32,528 147,641 81,184 -45.0
WATER YEAR - DRY Spawning Rainbow 56,060 63,202 118,187 119,736 49,763 50,517 56,993 65,651 +15.2
Cutthroat 27,191 69,697 50,599 140,937 23,557 60,271 32,192 76,423 +137.4
Juvenile Rainbow 198,500 78,766 221,712 164,451 165,900 63,476 196,144 84,529 -56.9 Cutthroat 175,303 58,375 196,144 155,078 118,724 36,924 167,748 67,200 -59.9

Sultan River Instream Flow Study – RSP 3
R2 Resource Consultants, Inc. 4-20 March 19, 2009 1628.07/Instream Flow Report_031909
4.2.1 PHABSIM Analysis
4.2.1.1 Spawning
Spawning habitat versus flow relationships generated for Reach 2 indicate that the amount of habitat provided at the habitat maximizing flow would be highest for Chinook (320 cfs provides ≈ 13 acres), followed by chum (240 cfs provides ≈ 10.5 acres), coho (150 cfs provides ≈ 10 acres), steelhead (240 cfs provides ≈ 10 acres) and then pink (75-123 cfs provides ≈ 7 acres) (Figure 4-13; Tables 4-5 and 4-6). When expressed as percentages of maximum habitat, the ascending limbs of the relationships for Chinook and steelhead are similar; descending limbs track similarly with Chinook being slightly higher than steelhead (Figure 4-14). Likewise, the ascending limbs of coho and chum spawning are similar, with the descending limb of chum remaining slightly higher than coho. The shapes of the curves indicate that habitat amounts would remain relatively high (≥ 85% of maximum) even at flows as low as 200 cfs for Chinook and steelhead, 100 cfs for coho and chum, and 50 cfs for pink (Tables 4-5 and 4-6; Figure 4-14). The habitat-flow relationships for rainbow and cutthroat spawning peak at flows of 320 cfs and 100 cfs, respectively (Figures 4-13 and 4-14; Table 4-6). For these two species, flows as low as 200 cfs for rainbow, and 50cfs for cutthroat would still provide ≥ 85% of maximum habitat.
4.2.1.2 Juvenile and Adult Habitat
The Reach 2 habitat-flow relationships for target species juvenile and adult life stages reflected three general trends. The first trend represented by coho juvenile and steelhead adult, depicts decreasing amounts of habitat with increases in flow, the second reflecting an increase in habitat with flow up to a maximum and then decreasing habitats with flow increases (represented by Chinook and steelhead juvenile, and rainbow and cutthroat trout juvenile and adult), and the third trend, represented by Chinook adult, that reflects a continuously increasing amount of habitat with flow (Figure 4-15). Habitat maximizing flows for the target species range from the lowest to highest for coho juvenile (≈ 11 acres at 50 cfs) and steelhead adults (≈ 14.5 acres at 50 cfs), Chinook juvenile (≈ 13 acres at 240 cfs) and cutthroat juvenile and adult (≈ 9.5 acres at 240 cfs), rainbow juvenile and adult (≈ 11.5 acres at 320 cfs), steelhead juvenile (≈ 15 acres at 550 cfs), and Chinook adults (≈ 10 acres at 1500 cfs) (Figures 4-15 and 4-16; Tables 4-5 and 4-6). Juvenile habitats remain at levels ≥ 85% of maximum at flows of 240 cfs for steelhead, 200 cfs for rainbow, 123 cfs for Chinook, and 100 cfs for cutthroat (Tables 4-5 and 4-6).

Sultan River Instream Flow Study – RSP 3
R2 Resource Consultants, Inc. 4-21 March 19, 2009 1628.07/Instream Flow Report_031909
Reach 2: Spawning
0 200 400 600 800 1000 1200 1400 16000
2
4
6
8
10
12
14Chinook SteelheadCohoChumPink
Flow (cfs)0 200 400 600 800 1000 1200 1400 1600
Tota
l Hab
itat A
rea
(acr
es)
0
1
2
3
4
5Rainbow TroutCutthroat Trout
Figure 4-13. Total spawning habitat area (acres) versus flow (cfs) relationships for Chinook,
coho, chum, and pink salmon and steelhead trout (upper figure), and rainbow and cutthroat trout (lower figure) in Reach 2 of the Sultan River, Washington.

Sultan River Instream Flow Study – RSP 3
R2 Resource Consultants, Inc. 4-22 March 19, 2009 1628.07/Instream Flow Report_031909
Table 4-5. Percentages of maximum habitat area at specified flows (cfs) for Chinook and steelhead life
stages within Reach 2 on the Sultan River, Washington. Chinook Steelhead Coho Flow (cfs) Spawning Juvenile Adult Spawning Juvenile Adult Spawning Juvenile
50 14.6 44.0 19.0 12.5 27.7 100.0 63.5 100.0 75 26.9 69.5 23.2 24.1 38.8 95.8 79.2 85.0
100 40.5 80.4 26.9 38.1 48.5 93.1 88.6 79.7 123 56.7 85.9 30.1 55.0 57.5 85.3 94.6 74.6 150 70.2 90.3 33.9 69.8 66.4 79.5 98.6 68.3 175 81.1 93.8 37.3 81.2 73.2 75.9 100.0 62.7 200 90.0 96.4 40.6 90.8 78.7 72.7 98.7 58.9 240 97.1 100.0 45.6 100.0 86.8 70.2 96.0 58.4 280 99.6 98.8 50.3 100.0 91.5 63.1 88.1 51.3 320 100.0 97.5 54.8 96.8 94.5 58.5 83.4 50.1 360 97.6 95.9 58.4 91.3 96.1 52.1 75.5 47.4 400 97.6 96.0 61.9 89.6 96.9 48.2 71.9 46.0 432 97.1 94.9 64.4 88.4 97.4 46.1 68.7 45.2 460 95.1 93.0 66.5 85.6 97.9 44.8 65.2 44.8 500 93.0 90.7 69.4 82.3 99.1 43.1 62.1 43.5 550 90.2 87.9 72.6 78.1 100.0 41.9 58.9 42.2 605 86.5 85.5 75.7 73.9 100.0 40.7 56.2 41.3 640 83.5 84.3 77.1 71.5 99.8 39.3 54.5 40.2 650 82.7 84.1 77.6 70.9 99.7 39.0 54.0 40.0 700 78.8 83.0 79.5 67.4 99.0 37.0 51.2 37.9 750 75.0 81.8 81.3 64.4 97.9 34.9 48.6 36.9 800 70.1 81.6 83.5 60.5 97.3 33.8 44.7 36.7 850 65.9 79.5 85.2 57.1 96.2 30.9 41.9 35.2 900 62.8 77.9 87.1 54.8 95.0 30.0 39.4 35.5
1000 56.4 74.7 90.5 49.9 93.0 31.4 34.7 35.5 1100 50.2 72.3 93.1 44.7 90.7 33.6 30.7 37.0 1161.7 47.4 70.5 94.4 42.2 89.6 32.6 28.8 37.1 1250 44.5 68.4 96.1 38.9 88.0 31.0 25.8 37.0 1350 42.0 66.3 97.8 35.1 86.8 30.6 22.4 37.8 1500 40.0 64.0 100.0 30.7 84.3 29.8 18.3 39.4

Sultan River Instream Flow Study – RSP 3
R2 Resource Consultants, Inc. 4-23 March 19, 2009 1628.07/Instream Flow Report_031909
Table 4-6. Percentages of maximum habitat area at specified flows (cfs) for chum and pink salmon life
stages, as well as for rainbow and cutthroat trout life stages, within Reach 2 on the Sultan River, Washington.
Chum Pink Rainbow Cutthroat Flow (cfs) Spawning Spawning Spawning Juvenile Spawning Juvenile
50 75.1 97.8 33.3 41.7 89.4 57.6 75 83.2 100.0 39.6 56.2 93.4 74.8
100 88.4 99.4 49.5 65.7 100.0 87.2 123 92.5 100.0 62.8 73.2 94.3 93.5 150 95.9 94.8 73.6 79.7 89.3 96.5 175 97.9 88.5 82.1 84.3 83.4 98.2 200 98.7 81.7 89.6 87.9 81.6 98.6 240 100.0 73.1 97.3 94.2 72.3 100.0 280 96.6 61.9 97.1 97.9 54.5 97.8 320 92.8 55.0 100.0 100.0 42.6 97.0 360 86.1 44.8 98.5 99.7 32.1 95.8 400 82.7 41.0 96.8 99.9 24.9 96.1 432 79.6 37.8 94.6 98.8 21.0 96.2 460 76.5 34.6 91.9 97.7 19.0 96.1 500 73.1 30.1 87.7 96.3 17.7 96.0 550 69.6 25.7 83.6 94.6 17.0 96.0 605 66.0 21.9 77.9 92.7 13.0 96.0 640 63.9 19.8 72.4 91.6 13.1 95.4 650 63.2 19.2 70.8 91.3 13.2 95.3 700 59.6 16.2 63.8 90.4 11.8 94.1 750 55.5 13.8 57.9 89.4 10.0 92.7 800 51.5 11.8 52.7 89.5 8.2 92.4 850 49.7 10.7 47.4 88.0 7.0 91.0 900 47.0 9.2 43.2 86.9 5.9 89.2
1000 41.6 6.9 39.1 84.8 4.6 84.9 1100 36.3 5.4 34.3 83.5 3.8 81.0 1161.7 33.7 4.7 33.2 83.4 3.5 78.7 1250 30.7 4.0 31.5 83.1 3.1 75.6 1350 28.0 3.5 30.1 82.0 2.9 72.9 1500 24.9 3.0 30.0 80.8 2.5 70.8

Sultan River Instream Flow Study – RSP 3
R2 Resource Consultants, Inc. 4-24 March 19, 2009 1628.07/Instream Flow Report_031909
Reach 2: Spawning
0 200 400 600 800 1000 1200 1400 16000
20
40
60
80
100 ChinookSteelheadCohoChumPink
Flow (cfs)0 200 400 600 800 1000 1200 1400 1600
Perc
enta
ge o
f Max
imum
Hab
itat A
rea
(%)
0
20
40
60
80
100 Rainbow TroutCutthroat Trout
Figure 4-14. Percentage (%) of maximum spawning habitat area versus flow (cfs) relationships
for Chinook, coho, chum, and pink salmon and steelhead trout (upper figure), and rainbow and cutthroat trout (lower figure) in Reach 2 of the Sultan River, Washington.

Sultan River Instream Flow Study – RSP 3
R2 Resource Consultants, Inc. 4-25 March 19, 2009 1628.07/Instream Flow Report_031909
Reach 2: Juvenile and Adult
0 200 400 600 800 1000 1200 1400 1600
Tota
l Hab
itat A
rea
(acr
es)
0
2
4
6
8
10
12
14
16
Flow (cfs)0 200 400 600 800 1000 1200 1400 1600
4
5
6
7
8
9
10
11
12Rainbow Trout - Juvenile & AdultCutthroat Trout - Juvenile & Adult
Chinook - JuvenileChinook - Adult
Steelhead - JuvenileSteelhead - Adult
Coho - Juvenile
Figure 4-15. Total juvenile and adult habitat area (acres) versus flow (cfs) relationships for
Chinook and coho salmon and steelhead trout (upper figure), and rainbow and cutthroat trout (lower figure) in Reach 2 of the Sultan River, Washington.

Sultan River Instream Flow Study – RSP 3
R2 Resource Consultants, Inc. 4-26 March 19, 2009 1628.07/Instream Flow Report_031909
Reach 2: Juvenile and Adult
0 200 400 600 800 1000 1200 1400 1600
Per
cent
age
of M
axim
um H
abita
t Are
a (%
)
0
20
40
60
80
100
Flow (cfs)0 200 400 600 800 1000 1200 1400 1600
40
50
60
70
80
90
100 Rainbow Trout - Juvenile & AdultCutthroat Trout - Juvenile & Adult
Chinook - JuvenileChinook - Adult
Steelhead - JuvenileSteelhead - Adult
Coho - Juvenile
Figure 4-16. Percentage (%) of maximum juvenile and adult habitat area versus flow (cfs)
relationships for Chinook and coho salmon and steelhead trout (upper figure), and rainbow and cutthroat trout (lower figure) in Reach 2 of the Sultan River, Washington.

Sultan River Instream Flow Study – RSP 3
R2 Resource Consultants, Inc. 4-27 March 19, 2009 1628.07/Instream Flow Report_031909
4.2.1.3 Habitat Time Series
For Reach 2, Stage 1 conditions represent flow conditions resulting from the diversion of flows to Lake Chaplain for water supply purposes, without consideration for minimum flow releases as were afforded under Stage 2 conditions. The habitat time series and duration analysis reflect this, and demonstrate that Stage 2 operations provide greater and more stable Chinook and steelhead spawning habitats than under Stage 1 conditions (Figures 4-17 through 4-20). This is likewise true for coho, pink and chum salmon, and both rainbow and cutthroat trout spawning (Figures D3-1 to D3-10; Appendix D3). Stage 2 flow conditions also provide greater and more stable juvenile rearing habitats for Chinook and coho salmon, and rainbow and cutthroat trout (Figures D3-11 to D3-18; Appendix D3). Stage 2 operations tend to provide higher and more stable juvenile rearing habitats for steelhead during the late summer early fall low flow periods (July to October), while Stage 1 conditions provided greater habitats during other times of the year (Figure D3-19 and Figure D3-20; Appendix D3). Comparisons of the median (50%), maximum, minimum and average habitat areas and percentage differences under Stage 1 and Stage 2 operations for all target species in Reach 2 based on the time series analysis are presented in Tables 4-7 and 4-8.
4.3 REACH 1 – POWERHOUSE TO SKYKOMISH RIVER
Habitat-flow relationships for Reach 1 were derived for seven target fish species, including the spawning lifestages of Chinook, coho, chum, and pink salmon, and steelhead trout, all of which are known to spawn in Reach 1; rainbow and cutthroat trout were also included since they are found and presumably spawn within the reach. Because of the short residence time of juvenile chum and pink salmon in the Sultan River following emergence, modeling results for juvenile rearing in Reach 1 were limited to Chinook and coho salmon, and steelhead, rainbow and cutthroat trout. This section includes habitat-flow analysis for both the mainstem reach of the Sultan River as well as the three side channel complexes that enter within the reach.
4.3.1 Mainstem PHABSIM Analysis
4.3.1.1 Spawning Habitat
Over the range of flows modeled in Reach 1, the greatest amounts of spawning habitat would be provided for Chinook at a flow of 800 cfs (provides ≈ 21 acres), followed by chum (495 cfs

Sultan River Instream Flow Study – RSP 3
R2 Resource Consultants, Inc. 4-28 March 19, 2009 1628.07/Instream Flow Report_031909
Sultan River, Reach 2Chinook Spawning
Sep 15 Sep 22 Sep 29 Oct 06 Oct 13 Oct 20 Oct 27 Nov 03 Nov 10 Nov 17 0
100
200
300
400
500
600
DateSep 15 Sep 22 Sep 29 Oct 06 Oct 13 Oct 20 Oct 27 Nov 03 Nov 10 Nov 17 0
100
200
300
400
500
600
Sep 15 Sep 22 Sep 29 Oct 06 Oct 13 Oct 20 Oct 27 Nov 03 Nov 10 Nov 17 Tota
l Hab
itat A
rea
(100
0 ft2 )
0
100
200
300
400
500
600
Wet Year
Average Year
Dry Year
Stage 1 Stage 2
Figure 4-17. Time series analysis depicting total Chinook salmon spawning habitat (1000 ft2) available over the period of spawning under wet, average and dry year scenarios for Reach 2 of the Sultan River, Washington.

Sultan River Instream Flow Study – RSP 3
R2 Resource Consultants, Inc. 4-29 March 19, 2009 1628.07/Instream Flow Report_031909
Sultan River, Reach 2Chinook Spawning
0 10 20 30 40 50 60 70 80 90 1000
100
200
300
400
500
600
Percent Exceedance (%)0 10 20 30 40 50 60 70 80 90 100
0
100
200
300
400
500
600
0 10 20 30 40 50 60 70 80 90 100Tota
l Hab
itat A
rea
(100
0 ft2 )
0
100
200
300
400
500
600
Wet Year
Average Year
Dry Year
Stage 1 Stage 2
Figure 4-18. Habitat duration curves for Chinook salmon spawning habitat (1000 ft2) under wet, average, dry year scenarios for Reach 2 of the Sultan River, Washington.

Sultan River Instream Flow Study – RSP 3
R2 Resource Consultants, Inc. 4-30 March 19, 2009 1628.07/Instream Flow Report_031909
Sultan River, Reach 2Steelhead Spawning
Mar 15 Mar 29 Apr 12 Apr 26 May 10 May 24 Jun 07 Jun 21 0
100
200
300
400
500
DateMar 15 Mar 29 Apr 12 Apr 26 May 10 May 24 Jun 07 Jun 21 0
100
200
300
400
500
Mar 15 Mar 29 Apr 12 Apr 26 May 10 May 24 Jun 07 Jun 21 Tota
l Hab
itat A
rea
(100
0 ft2 )
0
100
200
300
400
500
Wet Year
Average Year
Dry Year
Stage 1 Stage 2
Figure 4-19. Time series analysis depicting total steelhead trout spawning habitat (1000 ft2) available over the period of spawning under wet, average and dry year scenarios for Reach 1 of the Sultan River, Washington.

Sultan River Instream Flow Study – RSP 3
R2 Resource Consultants, Inc. 4-31 March 19, 2009 1628.07/Instream Flow Report_031909
Sultan River, Reach 2Steelhead Spawning
0 10 20 30 40 50 60 70 80 90 1000
100
200
300
400
500
Percent Exceedance (%)0 10 20 30 40 50 60 70 80 90 100
0
100
200
300
400
500
0 10 20 30 40 50 60 70 80 90 100Tota
l Hab
itat A
rea
(100
0 ft2 )
0
100
200
300
400
500
Wet Year
Average Year
Dry Year
Stage 1 Stage 2
Figure 4-20. Habitat duration curves for steelhead trout spawning habitat (1000 ft2) under wet, average, dry year scenarios for Reach 2 of the Sultan River, Washington.

Sultan River Instream Flow Study – RSP 3
R2 Resource Consultants, Inc. 4-32 March 19, 2009 1628.07/Instream Flow Report_031909
Table 4-7. Comparison of median, maximum, minimum, average and percentage difference in anadromous salmonid habitat areas provided during Wet, Average, and Dry water year types for Stage 1 and Stage 2 conditions as determined from habitat duration analysis for operational Reach 2 of the Sultan River, Washington.
Median (50% exceedance) Habitat Area (ft2)
Maximum Habitat Area (ft2)
Minimum Habitat Area (ft2) Average Habitat Area (ft2)
Life Stage Species Stage 1 Stage 2 Stage 1 Stage 2 Stage 1 Stage 2 Stage 1 Stage 2 % Difference WATER YEAR - WET
Spawning Chinook 223,054 502,061 561,974 579,447 7,211 223,054 230,599 484,656 +110.2 Steelhead 312,865 436,760 440,987 447,759 132,459 264,596 308,092 429,940 +39.5 Coho 173,925 427,333 446,783 452,045 78,656 80,886 221,932 350,632 +58.0 Chum 191,295 453,081 463,375 474,969 99,098 116,350 225,054 362,809 +61.2 Pink 40,067 271,611 305,006 308,574 9,071 102,883 53,240 251,812 +373.0 Juvenile Chinook 494,325 578,545 593,649 597,489 29,795 450,094 442,199 563,421 +27.4 Steelhead 583,381 534,030 647,925 645,246 20,404 345,554 482,868 507,806 +5.2 Coho 185,663 279,691 391,402 359,888 63,098 165,615 191,805 274,761 +43.3
WATER YEAR - AVERAGE Spawning Chinook 269,212 426,349 558,437 575,403 8,103 320,588 267,084 454,269 +70.1 Steelhead 321,578 440,532 390,897 447,471 132,459 424,612 296,384 440,374 +48.6 Coho 249,646 438,331 441,662 451,859 80,886 108,076 227,882 414,805 +82.0 Chum 325,687 456,524 467,789 471,656 116,350 186,407 302,074 445,811 +47.6 Pink 47,869 281,431 310,749 312,465 9,071 25,022 78,331 251,056 +220.5 Juvenile Chinook 477,761 587,597 583,887 599,152 21,050 469,932 385,872 560,392 +45.2 Steelhead 607,739 506,923 647,849 638,217 14,860 305,812 454,255 474,767 +4.5 Coho 185,663 282,870 397,343 377,519 43,187 167,573 177,988 292,621 +64.4
WATER YEAR - DRY Spawning Chinook 406,103 470,710 563,096 577,783 9,383 296,557 360,923 456,213 +26.4 Steelhead 248,126 440,762 423,544 447,395 132,459 395,693 272,834 436,833 +60.1 Coho 323,244 436,499 447,397 452,536 81,073 338,277 320,016 433,348 +35.4 Chum 354,101 444,903 469,827 474,522 117,581 408,653 361,047 447,331 +23.9 Pink 107,058 265,648 311,502 309,285 9,071 97,178 152,862 263,668 +72.5 Juvenile Chinook 510,619 572,664 591,642 596,974 43,528 502,634 462,904 562,727 +21.6 Steelhead 598,590 477,240 647,881 638,201 30,864 342,028 489,163 465,665 -4.8 Coho 208,000 288,390 430,414 357,703 100,666 208,977 226,253 297,117 +31.3

Sultan River Instream Flow Study – RSP 3
R2 Resource Consultants, Inc. 4-33 March 19, 2009 1628.07/Instream Flow Report_031909
Table 4-8. Comparison of median, maximum, minimum, average and percentage difference in resident trout habitat areas provided during Wet, Average, and Dry water year types for Stage 1 and Stage 2 conditions as determined from habitat duration analysis for operational Reach 2 of the Sultan River, Washington.
Median (50% exceedance) Habitat
Area (ft2)
Maximum Habitat Area (ft2)
Minimum Habitat Area (ft2) Average Habitat Area (ft2)
Life Stage Species Stage 1 Stage 2 Stage 1 Stage 2 Stage 1 Stage 2 Stage 1 Stage 2 % Difference WATER YEAR - WET
Spawning Rainbow 138,151 193,634 200,275 201,326 60,461 106,204 132,669 186,422 +40.5 Cutthroat 17,512 86,427 109,901 107,840 3,849 55,388 28,049 89,687 +219.8
Juvenile Rainbow 422,237 441,554 492,300 483,376 24,155 348,825 366,819 429,399 +17.1 Cutthroat 381,888 411,733 420,551 420,692 28,245 299,319 318,500 404,721 +27.1
WATER YEAR - AVERAGE Spawning Rainbow 175,595 194,259 198,848 203,300 60,570 118,911 145,229 185,120 +27.5
Cutthroat 18,560 83,005 107,557 111,983 2,805 33,846 24,824 85,791 +245.6
Juvenile Rainbow 431,551 436,796 491,229 480,367 17,429 320,860 343,849 417,107 +21.3 Cutthroat 385,015 410,353 385,015 410,353 20,447 362,865 296,675 402,388 +35.6
WATER YEAR - DRY Spawning Rainbow 143,734 194,096 201,936 202,185 60,570 127,420 139,001 184,349 +32.6
Cutthroat 20,182 95,701 111,861 107,606 2,805 34,256 31,447 89,106 +183.4
Juvenile Rainbow 437,451 421,733 492,988 478,311 36,846 351,683 387,145 416,024 +7.5 Cutthroat 403,109 411,047 421,518 419,909 42,961 386,377 347,864 405,787 +16.7

Sultan River Instream Flow Study – RSP 3
R2 Resource Consultants, Inc. 4-34 March 19, 2009 1628.07/Instream Flow Report_031909
provides ≈ 16 acres), steelhead (410 cfs provides ≈ 16 acres), coho (296 cfs provides ≈ 13 acres) and then pink (150 cfs provides ≈ 11 acres) (Figure 4-21; Tables 4-7 and 4-8). When expressed as percentages of maximum habitat, Chinook and steelhead relationships track together on the ascending portion of the curve, but then diverge slightly at their peaks with Chinook maintaining a broader and more gently sloping descending limb. The chum and coho curves share common origins and after diverging slightly and crossing, eventually converge at the tail end of the descending limb (Figure 4-22). With the exception of the pink salmon curve which has a relatively narrow peak range of flows, the curve shapes for the other species are broad and gently sloping indicating that habitat amounts would remain relatively high (≥ 85% of maximum) even at flows as low as 320 cfs for Chinook, 296 cfs for steelhead, 260 cfs for chum, 180 cfs for coho (Tables 4-9 and 4-10; Figure 4-22). The spawning habitat-flow relationships for rainbow and cutthroat peak at flows of 495 cfs and 100 cfs, respectively (Figure 4-21 and 4-22; Table 4-10). For these two species, flows as low as 396 cfs for rainbow, and 80cfs for cutthroat would still provide ≥ 85% of maximum habitat.
4.3.1.2 Juvenile and Adult Habitat
The Reach 1 habitat-flow relationships for target species juvenile and adult life stages reflected the same three general trends as exhibited in Reach 2, a trend of decreasing amounts of habitat with increasing flow (reflected by coho juvenile and steelhead adult), the trend of increasing habitat with flow up to a maximum and then decreasing habitats with flow (represented by Chinook and steelhead juvenile, and rainbow and cutthroat trout juvenile and adult), and the third trend that reflects a continuously increasing amount of habitat with flow (represented by Chinook adult) (Figure 4-23). Habitat maximizing flows for the target species range from the lowest to highest for coho juvenile (≈ 9.5 acres at 80 cfs) and steelhead adults (≈ 15 acres at 80 cfs), cutthroat juvenile and adult (≈ 10 acres at 260 cfs), rainbow juvenile and adult (≈ 11 acres at 320 cfs), steelhead juvenile (≈ 15 acres at 850 cfs), and Chinook juvenile and adult (both ≈ 10 acres at 1500 cfs) (Figure 4-23 and 4-24; Tables 4-9 and 4-10). Juvenile habitats remain at levels ≥ 85% of maximum at flows of 296 cfs for steelhead, 200 cfs for rainbow, 220 cfs for Chinook, and 120 cfs for cutthroat (Tables 4-9 and 4-10).
4.3.1.3 Habitat Time Series
The Reach 1 Stage 1 conditions would be similar to Reach 2 in that they represent flow conditions below the Diversion Dam (resulting from diversion of flows to Lake Chaplain for water supply) plus accretion and tributary inflow. Stage 2 conditions reflect operation of the hydroelectric Project and Powerhouse releases, subject to minimum required instream flow releases of from 165 to 200 cfs. In general, Stage 2 operations have increased and stabilized

Sultan River Instream Flow Study – RSP 3
R2 Resource Consultants, Inc. 4-35 March 19, 2009 1628.07/Instream Flow Report_031909
Reach 1: Spawning
0 200 400 600 800 1000 1200 1400 16000
2
4
6
8
10
12
14
16
18
20
22Chinook SteelheadCohoChumPink
Flow (cfs)0 200 400 600 800 1000 1200 1400 1600
Tota
l Hab
itat A
rea
(acr
es)
0
2
4
6
8
10Rainbow TroutCutthroat Trout
Figure 4-21. Total spawning habitat area (acres) versus flow (cfs) relationships for Chinook,
coho, chum and pink salmon and steelhead trout (upper figure), and rainbow and cutthroat trout (lower figure) in Reach 1 of the Sultan River, Washington.

Sultan River Instream Flow Study – RSP 3
R2 Resource Consultants, Inc. 4-36 March 19, 2009 1628.07/Instream Flow Report_031909
Table 4-9. Percentages of maximum habitat area at specified flows (cfs) for Chinook, steelhead, and
coho salmon life stages within Reach 1 on the Sultan River, Washington. Chinook Steelhead Coho
Flow (cfs) Spawning Juvenile Adult Spawning Juvenile Adult Spawning Juvenile80 12.1 52.1 22.2 9.0 33.5 100.0 53.5 100.0
100 19.2 63.3 26.4 15.3 40.1 93.0 63.4 87.2 120 25.9 71.8 29.7 22.1 46.2 87.1 70.7 81.5 150 38.5 79.6 32.8 35.8 54.6 76.0 81.5 74.8 180 50.9 83.9 35.7 49.8 61.9 66.9 89.7 72.8 220 64.4 88.9 37.8 66.0 70.2 56.0 96.1 68.2 260 75.0 92.1 40.9 78.8 77.3 49.8 99.3 63.8 296 83.1 93.7 45.0 88.1 82.3 46.4 100.0 59.3 320 87.3 95.3 48.5 92.9 85.0 44.1 99.5 55.9 360 91.0 96.3 51.4 97.6 88.5 42.4 97.6 51.8 410 93.7 96.4 54.4 100.0 91.9 40.4 95.1 46.4 450 95.1 96.2 57.3 99.8 93.9 39.5 92.6 42.8 495 96.2 95.5 59.7 98.8 96.1 39.5 89.9 39.9 550 97.7 95.3 61.9 99.2 97.6 38.0 89.2 37.2 600 98.7 95.1 64.7 98.6 98.3 36.7 87.8 35.2 650 99.0 94.5 68.7 97.3 98.4 35.9 85.9 33.8 700 99.5 94.1 71.6 95.3 98.9 35.1 84.7 32.5 750 99.9 93.8 73.8 93.3 99.3 33.5 83.1 31.2 800 100.0 94.0 75.5 91.2 99.9 32.2 81.5 30.3 850 98.9 94.3 77.2 88.7 100.0 30.8 79.0 29.4 900 96.9 94.8 79.0 86.1 99.7 29.4 76.1 28.3 950 94.1 95.3 80.9 83.4 98.4 27.9 73.5 27.6
1000 91.3 95.6 82.5 80.8 97.3 26.6 70.8 27.0 1050 88.5 95.7 83.5 78.7 95.5 25.4 68.3 26.6 1100 85.6 95.7 86.9 76.4 93.8 24.3 65.9 26.3 1150 82.3 95.4 91.2 74.0 91.9 23.5 63.3 26.0 1200 78.8 95.7 93.1 71.4 90.6 22.9 60.6 25.6 1300 71.5 97.3 95.0 66.0 88.8 22.0 55.0 24.9 1400 65.1 99.0 97.1 61.1 88.1 21.0 50.3 24.6 1500 58.4 100.0 100.0 56.1 87.5 19.4 45.7 23.6

Sultan River Instream Flow Study – RSP 3
R2 Resource Consultants, Inc. 4-37 March 19, 2009 1628.07/Instream Flow Report_031909
Table 4-10. Percentages of maximum habitat area at specified flows (cfs) for chum and pink salmon life
stages, as well as for rainbow and cutthroat trout life stages, within Reach 1 on the Sultan River, Washington.
Chum Pink Rainbow Cutthroat Flow (cfs) Spawning Spawning Spawning Juvenile Spawning Juvenile
80 60.0 89.8 16.4 58.0 78.5 66.9 100 66.3 95.5 21.3 66.7 100.0 78.5 120 71.5 97.2 26.4 73.4 99.5 87.0 150 77.1 100.0 36.1 82.0 92.8 94.5 180 80.9 97.2 46.3 88.8 82.5 98.0 220 84.3 90.3 57.6 94.6 72.9 99.6 260 87.0 83.2 67.3 98.0 67.7 100.0 296 89.4 79.2 76.9 99.5 60.9 98.0 320 91.0 77.6 82.3 100.0 56.1 96.5 360 93.6 76.7 89.3 99.1 49.5 92.9 410 96.4 76.6 94.8 97.8 42.3 89.1 450 98.7 76.0 97.6 96.5 39.0 85.8 495 100.0 73.5 100.0 96.7 38.5 83.9 550 99.9 69.1 97.5 95.8 36.0 84.2 600 99.4 64.2 92.1 95.8 33.5 85.0 650 98.4 59.1 88.3 95.7 29.8 84.5 700 96.6 54.7 87.2 95.3 25.1 84.2 750 93.9 50.0 86.3 94.5 22.9 83.2 800 91.3 45.6 85.5 94.0 20.4 82.1 850 88.4 40.8 83.1 93.4 17.2 80.8 900 85.4 35.9 78.3 93.3 13.5 79.1 950 82.6 31.9 73.3 92.9 11.2 78.1
1000 79.8 27.9 68.1 92.6 9.0 77.2 1050 76.2 24.9 62.9 91.2 7.8 76.6 1100 72.6 21.9 57.1 89.8 6.6 75.9 1150 68.8 18.8 50.7 88.2 5.3 75.4 1200 64.7 16.3 45.3 86.8 4.5 75.1 1300 56.7 12.5 37.0 84.0 4.1 74.6 1400 50.2 9.9 31.0 81.6 3.9 74.9 1500 44.5 8.0 27.3 79.5 3.6 73.3

Sultan River Instream Flow Study – RSP 3
R2 Resource Consultants, Inc. 4-38 March 19, 2009 1628.07/Instream Flow Report_031909
Reach 1: Spawning
0 200 400 600 800 1000 1200 1400 16000
20
40
60
80
100 ChinookSteelheadCohoChumPink
Flow (cfs)0 200 400 600 800 1000 1200 1400 1600
Perc
enta
ge o
f Max
imum
Hab
itat A
rea
(%)
0
20
40
60
80
100 Rainbow TroutCutthroat Trout
Figure 4-22. Percentage (%) of maximum spawning habitat area versus flow (cfs) relationships
for Chinook, coho, chum and pink salmon and steelhead trout (upper figure), and rainbow and cutthroat trout (lower figure) in Reach 1 of the Sultan River, Washington.

Sultan River Instream Flow Study – RSP 3
R2 Resource Consultants, Inc. 4-39 March 19, 2009 1628.07/Instream Flow Report_031909
Reach 1: Juvenile and Adult
0 200 400 600 800 1000 1200 1400 1600
Tota
l Hab
itat A
rea
(acr
es)
0
2
4
6
8
10
12
14
16
Chinook - JuvenileChinook - AdultSteelhead - JuvenileSteelhead - AdultCoho - Juvenile
Flow (cfs)0 200 400 600 800 1000 1200 1400 1600
6
7
8
9
10
11
12Rainbow Trout - Juvenile & AdultCutthroat Trout - Juvenile & Adult
Figure 4-23. Total juvenile and adult habitat area (acres) versus flow (cfs) relationships for
Chinook and coho salmon and steelhead trout (upper figure), and rainbow and cutthroat trout (lower figure) in Reach 1 of the Sultan River, Washington.

Sultan River Instream Flow Study – RSP 3
R2 Resource Consultants, Inc. 4-40 March 19, 2009 1628.07/Instream Flow Report_031909
Reach 1: Juvenile and Adult
0 200 400 600 800 1000 1200 1400 1600
Per
cent
age
of M
axim
um H
abita
t Are
a (%
)
0
20
40
60
80
100
Flow (cfs)0 200 400 600 800 1000 1200 1400 1600
50
60
70
80
90
100 Rainbow Trout - Juvenile & AdultCutthroat Trout - Juvenile & Adult
Chinook - JuvenileChinook - Adult
Steelhead - JuvenileSteelhead - Adult
Coho - Juvenile
Figure 4-24. Percentage (%) of maximum spawning habitat area versus flow (cfs) relationships
for Chinook, and coho salmon and steelhead trout (upper figure), and rainbow and cutthroat trout (lower figure) in Reach 1 of the Sultan River, Washington.

Sultan River Instream Flow Study – RSP 3
R2 Resource Consultants, Inc. 4-41 March 19, 2009 1628.07/Instream Flow Report_031909
flows during the summer and early fall periods compared to Stage 1 conditions. This has tended to benefit those species and life stages active during these periods, as indicated in the time series analysis for Chinook spawning (Figure 4-25 and Figure 4-26), as well as pink salmon spawning (Figures D4-1 and D4-2; Appendix D4), and to a lesser degree, cutthroat spawning (Figures D4-3 and D4-4; Appendix D4). Such effects are less pronounced for species whose life stage activities occur earlier in the year when Stage 1 flow conditions are higher. Thus, there is essentially little difference between habitat conditions provided Stage 1 versus Stage 2 for steelhead spawning (Figure 4-27 and Figure 4-28), or rainbow trout spawning (Figures D4-5 and D4-6; Appendix D4). In contrast, species spawning later in the year (coho and chum salmon) would be afforded higher amounts of habitat overall under Stage 1 conditions (Figures D4-7 to D4-10; Appendix D4), but the provision of such would be more variable (i.e., less stable) than habitats occurring under Stage 2 conditions. In general, Stage 2 flow conditions provide slightly greater and more stable juvenile rearing habitats for all of the target species (Chinook and coho salmon, steelhead, rainbow and cutthroat trout) (Figures D4-11 to D4-20; Appendix D4), especially during the summer and early fall low flow periods. Comparisons of the median (50%), maximum, minimum and average habitat areas and percentage differences under Stage 1 and Stage 2 operations for all target species in Reach 1 based on the time series analysis are presented in Tables 4-11 and 4-12. Comparisons of total estimated amounts of anadromous salmonid (all species) habitat provided under Stage 1 and Stage 2 conditions for each reach and for all reaches combined are presented in Table 4-13. In general, the table illustrates that overall habitat amounts of anadromous salmonids are higher for Reaches 2 and 1 under Stage 2 operations, while the reverse of this occurs (if anadromous salmonids were present) for Reach 3. When all reaches are combined, Stage 2 operations would, with the exception of slight differences in amounts of steelhead juvenile habitat) provide more anadromous salmonid habitat overall (even when Reach 3 is included) than under Stage 1 conditions.
4.3.2 Side Channel Habitat:Flow Analysis
Operational Reach 1 includes three side channels depicted in Figures 3-10 to 3-12 that were surveyed as part of the instream flow study. Results of fish surveys have indicated these side channels provide important spawning and rearing habitat for a number of target salmonid species. R2 therefore surveyed the side channels with a focus on 1) determining the flow connectivity relationship between the mainstem and side channels; 2) estimating individual and cumulative wetted surface areas provided by mainstem flows; and 3) defining habitat-flow

Sultan River Instream Flow Study – RSP 3
R2 Resource Consultants, Inc. 4-42 March 19, 2009 1628.07/Instream Flow Report_031909
Sultan River, Reach 1Chinook Spawning
Sep 15 Sep 22 Sep 29 Oct 06 Oct 13 Oct 20 Oct 27 Nov 03 Nov 10 Nov 17 0
200
400
600
800
1000
DateSep 15 Sep 22 Sep 29 Oct 06 Oct 13 Oct 20 Oct 27 Nov 03 Nov 10 Nov 17 0
200
400
600
800
1000
Sep 15 Sep 22 Sep 29 Oct 06 Oct 13 Oct 20 Oct 27 Nov 03 Nov 10 Nov 17 Tota
l Hab
itat A
rea
(100
0 ft2 )
0
200
400
600
800
1000
Wet Year
Average Year
Dry Year
Stage 1 Stage 2
Figure 4-25. Time series analysis depicting total Chinook salmon spawning habitat (1000 ft2) available over the period of spawning under wet, average and dry year scenarios for Reach 1 of the Sultan River, Washington.

Sultan River Instream Flow Study – RSP 3
R2 Resource Consultants, Inc. 4-43 March 19, 2009 1628.07/Instream Flow Report_031909
Sultan River, Reach 1Chinook Spawning
0 10 20 30 40 50 60 70 80 90 1000
200
400
600
800
1000
Percent Exceedance (%)0 10 20 30 40 50 60 70 80 90 100
0
200
400
600
800
1000
0 10 20 30 40 50 60 70 80 90 100Tota
l Hab
itat A
rea
(100
0 ft2 )
0
200
400
600
800
1000
Wet Year
Average Year
Dry Year
Stage 1 Stage 2
Figure 4-26. Habitat duration curves for Chinook salmon spawning habitat (1000 ft2) under wet, average, dry year scenarios for Reach 1 of the Sultan River, Washington.

Sultan River Instream Flow Study – RSP 3
R2 Resource Consultants, Inc. 4-44 March 19, 2009 1628.07/Instream Flow Report_031909
Sultan River, Reach 1Steelhead Spawning
Mar 15 Mar 29 Apr 12 Apr 26 May 10 May 24 Jun 07 Jun 21 0
100
200
300
400
500
600
700
800
DateMar 15 Mar 29 Apr 12 Apr 26 May 10 May 24 Jun 07 Jun 21 0
100
200
300
400
500
600
700
800
Mar 15 Mar 29 Apr 12 Apr 26 May 10 May 24 Jun 07 Jun 21 Tota
l Hab
itat A
rea
(100
0 ft2 )
0
100
200
300
400
500
600
700
800
Wet Year
Average Year
Dry Year
Stage 1 Stage 2
Figure 4-27. Time series analysis depicting total steelhead trout spawning habitat (1000 ft2) available over the period of spawning under wet, average and dry year scenarios for Reach 1 of the Sultan River, Washington.

Sultan River Instream Flow Study – RSP 3
R2 Resource Consultants, Inc. 4-45 March 19, 2009 1628.07/Instream Flow Report_031909
Sultan River, Reach 1Steelhead Spawning
0 10 20 30 40 50 60 70 80 90 1000
100
200
300
400
500
600
700
800
Percent Exceedance (%)0 10 20 30 40 50 60 70 80 90 100
0
100
200
300
400
500
600
700
800
0 10 20 30 40 50 60 70 80 90 100Tota
l Hab
itat A
rea
(100
0 ft2 )
0
100
200
300
400
500
600
700
800
Wet Year
Average Year
Dry Year
Stage 1 Stage 2
Figure 4-28. Habitat duration curves for steelhead trout spawning habitat (1000 ft2) under wet, average, dry year scenarios for Reach 1 of the Sultan River, Washington.

Sultan River Instream Flow Study – RSP 3
R2 Resource Consultants, Inc. 4-46 March 19, 2009 1628.07/Instream Flow Report_031909
Table 4-11. Comparison of median, maximum, minimum, average and percentage difference in anadromous salmonid habitat areas provided during Wet, Average, and Dry water year types for Stage 1 and Stage 2 conditions as determined from habitat duration analysis for operational Reach 1 of the Sultan River, Washington.
Median (50% exceedance) Habitat Area (ft2)
Maximum Habitat Area (ft2)
Minimum Habitat Area (ft2)
Average Habitat Area (ft2)
Life Stage Species Stage 1 Stage 2 Stage 1 Stage 2 Stage 1 Stage 2 Stage 1 Stage 2 % Difference WATER YEAR - WET
Spawning Chinook 590,410 747,331 906,339 854,945 11,582 531,893 530,798 714,643 +34.6 Steelhead 657,696 652,219 679,775 678,084 296,070 419,094 608,021 619,160 +1.8 Coho 446,621 299,762 579,002 539,637 186,210 264,787 412,387 318,511 -22.8 Chum 544,544 339,854 696,611 407,598 206,508 310,055 489,336 346,238 -29.2 Pink 77,348 376,239 460,493 459,088 39,383 41,822 134,737 284,250 +111.0
Juvenile Chinook 491,342 524,170 611,315 612,889 46,387 392,502 448,141 508,229 +13.4 Steelhead 577,776 577,773 643,547 642,762 25,910 433,556 484,810 576,371 +18.9 Coho 130,717 143,378 364,941 299,244 56,400 99,745 157,365 166,721 +5.9
WATER YEAR - AVERAGE Spawning Chinook 531,893 632,405 906,736 876,231 14,538 531,893 498,516 667,826 +34.0
Steelhead 671,599 659,153 679,913 679,713 381,125 401,743 631,866 638,999 +1.1 Coho 485,427 368,206 579,183 575,571 264,787 264,787 451,540 390,778 -13.5 Chum 668,964 400,331 696,944 695,539 310,055 310,055 617,696 455,557 -26.2 Pink 81,977 430,810 488,285 470,242 33,253 39,383 163,724 364,797 +122.8
Juvenile Chinook 446,382 570,276 608,582 612,939 26,224 392,502 387,741 541,098 +39.6 Steelhead 596,188 577,647 643,870 647,054 15,842 420,541 455,799 555,541 +21.9 Coho 131,203 208,904 405,340 303,696 34,388 99,745 147,561 197,885 +34.1
WATER YEAR - DRY Spawning Chinook 533,391 861,225 905,844 907,804 19,116 826,630 503,204 864,682 +71.8
Steelhead 629,514 647,540 679,510 679,369 381,125 395,215 608,028 619,042 +1.8 Coho 518,185 547,229 579,771 566,034 151,569 330,448 499,266 539,702 +8.1 Chum 633,065 677,008 696,935 696,775 194,058 411,664 597,175 669,053 +12.0 Pink 367,239 376,895 487,619 395,516 39,383 196,841 298,497 339,342 +13.7
Juvenile Chinook 515,141 589,876 611,924 610,948 77,901 398,167 470,455 568,892 +20.9 Steelhead 576,873 592,362 643,766 646,436 44,693 515,500 479,149 588,152 +22.7 Coho 177,907 211,841 411,122 264,763 97,481 103,559 203,884 205,247 +0.7

Sultan River Instream Flow Study – RSP 3
R2 Resource Consultants, Inc. 4-47 March 19, 2009 1628.07/Instream Flow Report_031909
Table 4-12. Comparison of median, maximum, minimum, average and percentage difference in resident trout habitat areas provided during Wet, Average, and Dry water year types for Stage 1 and Stage 2 conditions as determined from habitat duration analysis for operational Reach 1 of the Sultan River, Washington.
Median (50% exceedance) Habitat
Area (ft2)
Maximum Habitat Area (ft2)
Minimum Habitat Area (ft2) Average Habitat Area (ft2)
Life Stage Species Stage 1 Stage 2 Stage 1 Stage 2 Stage 1 Stage 2 Stage 1 Stage 2 % Difference WATER YEAR - WET
Spawning Rainbow 323,146 306,306 359,871 358,908 97,908 114,696 313,940 292,244 -6.9 Cutthroat 76,730 105,713 221,881 162,979 16,892 8,718 86,324 99,049 +14.7
Juvenile Rainbow 438,038 448,302 481,375 481,901 33,224 383,067 369,319 434,846 +17.7 Cutthroat 346,083 357,108 426,976 428,187 33,663 314,374 306,558 360,146 +17.5
WATER YEAR - AVERAGE Spawning Rainbow 343,306 311,698 359,568 353,163 93,466 105,927 306,203 299,329 -2.2
Cutthroat 52,595 116,905 216,848 177,584 8,066 8,376 65,587 113,157 +72.5
Juvenile Rainbow 442,100 454,322 481,593 482,276 20,335 383,067 344,166 444,762 +29.2 Cutthroat 346,418 391,188 426,358 428,462 20,688 314,401 280,373 378,052 +34.8
WATER YEAR - DRY Spawning Rainbow 314,402 298,754 358,060 359,790 97,908 103,389 303,152 290,776 -4.1
Cutthroat 86,088 88,127 222,527 141,464 8,066 8,279 91,404 93,252 +2.0
Juvenile Rainbow 449,149 474,955 481,989 482,779 57,272 390,201 391,749 469,860 +19.9 Cutthroat 358,583 391,530 428,742 428,163 57,862 317,376 335,023 389,571 +16.3

Sultan River Instream Flow Study – RSP 3
R2 Resource Consultants, Inc. 4-48 March 19, 2009 1628.07/Instream Flow Report_031909
Table 4-13. Comparison of average anadromous salmonid habitat areas provided during Wet, Average, and Dry water year types for Stage 1 and Stage 2 conditions as determined from habitat duration analysis for operational Reaches 1, 2, and 3, as well as the total of all three reaches of the Sultan River, Washington.
Reach 1 Average Habitat Area (ft2)
Reach 2 Average Habitat Area (ft2)
Reach 3 Average Habitat Area (ft2)
All Reaches Average Habitat Area (ft2)
Life Stage Species Stage 1 Stage 2 Stage 1 Stage 2 Stage 1 Stage 2 Stage 1 Stage 2 % Difference WATER YEAR - WET
Spawning Chinook 530,798 714,643 230,599 484,656 132,426 79,748 893,823 1,279,047 +43.1 Steelhead 608,021 619,160 308,092 429,940 132,896 54,311 1,049,009 1,103,411 +5.2 Coho 412,387 318,511 221,932 350,632 106,831 123,045 741,150 792,188 +6.9 Chum 489,336 346,238 225,054 362,809 184,499 216,336 898,889 925,383 +2.9 Pink 134,737 284,250 53,240 251,812 201,087 231,324 389,064 767,386 +97.2
Juvenile Chinook 448,141 508,229 442,199 563,421 191,797 114,208 1,082,137 1,185,858 +9.6 Steelhead 484,801 576,371 482,868 507,806 242,540 99,220 1,210,209 1,183,397 -2.2 Coho 157,365 166,721 191,805 274,761 113,828 206,452 462,998 647,934 +39.9
WATER YEAR - AVERAGE Spawning Chinook 498,516 667,826 267,084 454,269 182,840 82,748 948,440 1,204,843 +27.0
Steelhead 631,866 638,999 296,384 440,374 106,464 56,890 1,034,714 1,136,263 +9.8 Coho 451,540 390,778 227,882 414,805 82,158 113,311 761,580 918,894 +20.7 Chum 617,696 455,557 302,074 445,811 156,850 197,077 1,076,620 1,098,445 +2.0 Pink 163,724 364,797 78,331 251,056 201,645 213,261 443,700 829,114 +86.9
Juvenile Chinook 387,741 541,098 385,872 560,392 183,808 109,782 957,421 1,211,272 +26.5 Steelhead 455,799 555,541 454,255 474,767 237,407 87,705 1,147,461 1,118,013 -2.6 Coho 147,561 197,885 177,988 292,621 119,967 212,478 445,516 702,984 +57.8
WATER YEAR - DRY Spawning Chinook 503,204 864,682 360,923 456,213 324,994 57,104 1,189,121 1,377,999 +15.9
Steelhead 608,028 619,042 272,834 436,833 101,134 60,076 981,996 1,115,951 +13.6 Coho 499,266 539,702 320,016 433,348 138,092 87,050 957,374 1,060,100 +10.7 Chum 597,175 669,053 361,047 447,331 263,367 159,906 1,221,589 1,276,290 +4.5 Pink 298,497 339,342 152,862 263,668 146,922 217,372 598,281 820,382 +37.1
Juvenile Chinook 470,455 568,892 462,904 562,727 209,337 90,781 1,142,696 1,222,400 +7.0 Steelhead 479,149 588,152 489,163 465,665 259,480 74,072 1,227,792 1,127,889 -8.1 Coho 203,884 205,247 226,253 297,117 111,454 222,037 541,591 724,401 +33.8

R2 Resource Consultants, Inc. 4-49 March 19, 2009 1628.07/Instream Flow Report_031909
relationships (based on PHABSIM analysis) within the channels for selected target fish species and life stages. Survey results indicate that the upstream ends of the three side channels would become disconnected from the Sultan River at flows < 200 cfs for Side Channel 3, <300 cfs for Side Channel 2, and < ≈ 375 cfs for Side Channel 1 (Figure 4-29). Based on water depths measured at each of the side channel inlets and corresponding mainstem flow measurements made during each of the field surveys, the relationships of inlet flow depth as a function of mainstem flow were developed (Figure 4-29). Mainstem flows as low as 200 cfs would still provide water depths of about 0.5 ft at the inlet of Side Channel 3, although no flow would be entering side channels 2 or 1. Flow into Side Channel 2 just begins to occur at a mainstem flow of about 300 cfs which provides an inlet depth of 0.1 ft. For Side Channel 1, flow just begins to occur at a mainstem flow of 400 cfs which provides an inlet depth of 0.1 ft. Mainstem flow increases between 400 and 500 cfs result in gradual increases in inlet water depths. A threshold is apparently reached in Side Channel 1 as mainstem flows reach and exceed 500 cfs resulting in a sharp increase in inlet depths to 0.6 ft. Similar increases in surface area occur within Side Channels 1 and 2 ranging from about 25,000 ft2 at mainstem flows of around 400 cfs to about 40-50,000 ft2 at flows greater than 1000 cfs (Figure 4-30). Surface areas within Side Channel 3 are more than two-fold higher over this range of flows than found in Side Channels 1 and 2. This is likely due to the greater size and location of Side Channel 3 that results in a greater proportion of mainstem flow entering the channel, than would occur in either Side Channel 2 or 1 (Figure 4-31). On a cumulative basis, flows of about 550 cfs would provide over 225,000 ft2 of surface area, which represents about 90% of the overall total (250,000 ft2). Habitat-flow relationships based on PHABSIM modeling indicate that the side channels provide greater amounts of pink and chum spawning habitat than other target species (Figure 4-32 and 4-33). Of the three channels, Side Channel 2 provides the overall greatest amount of pink and chum spawning habitats. In that system, pink spawning habitat would be maximized at flows of about 25 cfs (10,000 ft2/1000 ft), while chum spawning habitat is maximized at the highest flow modeled, 45 cfs (≈ 10,000 ft2/1000 ft). Pink and chum spawning habitats in Side Channel 2 would be maximized at flows of about 90 cfs (≈ 7,500 ft2/1000 ft) and 225 cfs (≈ 9,000 ft2/1000 ft), respectively, and at flows of 7 cfs (≈ 3000 ft2/1000 ft) and 24 cfs (≈ 3,500 ft2/1000 ft) for Side Channel 1. Spawning habitat:flow relationships for Chinook, coho and steelhead for all three side channels generally reflect increasing amounts of spawning habitat over the range of flows modeled. One exception to this relates to coho spawning in Side Channel 1 which is maximized at flows of about 20 cfs and then begins to gradually decline.

R2 Resource Consultants, Inc. 4-50 March 19, 2009 1628.07/Instream Flow Report_031909
Mainstem Flow (cfs)
0 200 400 600 800 1000 1200 1400
Flo
w D
epth
at S
ide
Cha
nnel
Inle
t (ft)
0.0
0.5
1.0
1.5
2.0
Side Channel 1
Side Channel 3
Side Channel 2
Figure 4-29. Relationship of flow depth within side channel inlets to flow within the mainstem
Sultan River, Washington for Side Channels 1, 2, and 3. Side Channel 3 is the uppermost and 1 the lowermost of the channels.
Mainstem Flow (cfs)
0 200 400 600 800 1000 1200 1400
Wet
ted
Sur
face
Are
a (ft
2 )
0
50000
100000
150000
200000
250000
300000
Side Channel 1
Side Channel 3
Side Channel 2
All Side Channels
Note: Dotted lines indicate extrapolated data
Figure 4-30. Relationship of wetted surface area (ft2) within Side Channels 1, 2, and 3 in Reach 1
and flow within the mainstem Sultan, River, Washington.

R2 Resource Consultants, Inc. 4-51 March 19, 2009 1628.07/Instream Flow Report_031909
Flow in Sultan River Just Upstream from Entrance to Side Channel (cfs)0 200 400 600 800 1000 1200 1400
Flow
at U
pstr
eam
End
of S
ide
Cha
nnel
(cfs
)
0
50
100
150
200
250
300
Side Channel 3Side Channel 2Side Channel 1
Figure 4-31. Flows occurring at the upstream end of Side Channels 1, 2,
and 3 in Operational Reach 1 of the Sultan River, and corresponding flows in the Sultan River just upstream from the entrance to each side channel.

R2 Resource Consultants, Inc. 4-52 March 19, 2009 1628.07/Instream Flow Report_031909
0 10 20 30 40 50
WU
A (f
t2 pe
r 100
0 ft)
0
2500
5000
7500
10000
12500
Spawning
0 50 100 150 200 2500
2000
4000
6000
8000
10000
12000
Flow (cfs)0 10 20 30 40
0
1000
2000
3000
4000Side Channel 1
Side Channel 3
Side Channel 2
ChinookSteelhead
Coho ChumPink
Figure 4-32. Weighted Useable Area (WUA) (ft2/1000 ft) versus flow (cfs) relationships
for Chinook, coho, pink, and chum salmon and steelhead trout spawning habitat as defined in Side Channels 1, 2, and 3 in Operational Reach 1 of the Sultan River, Washington.

R2 Resource Consultants, Inc. 4-53 March 19, 2009 1628.07/Instream Flow Report_031909
0 10 20 30 40 50
Per
cent
Max
imum
WU
A (%
)
0
20
40
60
80
100
Spawning
0 50 100 150 200 2500
20
40
60
80
100
Flow (cfs)0 10 20 30 40
0
20
40
60
80
100
Side Channel 1
Side Channel 3
Side Channel 2
ChinookSteelhead
Coho ChumPink
Figure 4-33. Percentage of maximum Weighted Useable Area (WUA) versus flow (cfs)
relationships for Chinook, coho, pink and chum salmon and steelhead trout spawning habitat a as defined in Side Channels 1, 2, and 3 in Operational Reach 1 of the Sultan River, Washington.

R2 Resource Consultants, Inc. 4-54 March 19, 2009 1628.07/Instream Flow Report_031909
Habitat-flow relationships indicate that the greatest amounts of juvenile rearing habitat occur in Side Channel 3 (Figures 4-34 and 4-35); habitat maxima for all species are ≥ 9,000 ft2/1000 ft. For comparison, the greatest amount of juvenile habitat in the other two side channels is for coho in Side Channel 2 (≈ 3200 ft2/1000 ft). In all three channels, coho juvenile habitats peak at relatively low flows compared to other species; ≈10 cfs in Side Channel 3, and about 3-4 cfs for Side Channels 2 and 1. With the exception of coho, juvenile rearing habitat for all other species is maximized at the highest modeled flow (45 cfs). Flows maximizing Chinook, rainbow and cutthroat juvenile habitat in Side Channel 3 occur at about 75 cfs; Chinook juvenile habitats are maximized at a flow of about 20 cfs in Side Channel 1.

R2 Resource Consultants, Inc. 4-55 March 19, 2009 1628.07/Instream Flow Report_031909
Flow (cfs)0 10 20 30 40
0
250
500
750
1000
1250
1500
1750
0 10 20 30 40 50
WU
A (f
t2 per
100
0 ft)
0
500
1000
1500
2000
2500
3000
3500
Juvenile
0 50 100 150 200 2500
3000
6000
9000
12000
15000
18000Side Channel 3
Side Channel 1
Side Channel 2
ChinookSteelhead
Coho Rainbow TroutCutthroat Trout
Figure 4-34. Weighted Useable Area (WUA) (ft2/1000 ft) versus flow (cfs) relationships
for Chinook and coho salmon and steelhead, rainbow and cutthroat trout juvenile rearing habitat as defined in Side Channels 1, 2, and 3 in Operational Reach 1 of the Sultan River, Washington.

R2 Resource Consultants, Inc. 4-56 March 19, 2009 1628.07/Instream Flow Report_031909
Flow (cfs)0 10 20 30 40
0
20
40
60
80
100
0 10 20 30 40 50
Perc
ent M
axim
um W
UA
(%)
0
20
40
60
80
100
Juvenile
0 50 100 150 200 2500
20
40
60
80
100
Side Channel 3
Side Channel 1
Side Channel 2
ChinookSteelhead
Coho Rainbow TroutCutthroat Trout
Figure 4-35. Percentage of maximum Weighted Useable Area (WUA) versus flow (cfs)
relationships for Chinook and coho salmon and steelhead, rainbow, and cutthroat trout spawning habitat a as defined in Side Channels 1, 2, and 3 in Operational Reach 1 of the Sultan River, Washington.

R2 Resource Consultants, Inc. 5-1 March 19, 2009 1628.07/Instream Flow Report_031909
5. SUMMARY
The Sultan River Instream Flow Study (RSP3) was conducted to assist the District and agency/stakeholders in balancing the flow needs of the Henry M. Jackson Hydroelectric Project with the flow needs to support and sustain fish populations within the Sultan River. The study focused on and provided information useful for addressing the following questions as originally posed in Section 1:
• What are the species and life stage specific habitat – flow relationships in each of the three mainstem reaches?
• How much habitat of a given fish species and life stage is available in each of the three mainstem reaches under existing Project operations and existing instream flow requirements?
• How much habitat of a given fish species and life stage would be available in each reach of the three mainstem reaches under Stage 1 conditions?
• What are the incremental gains or losses of habitat for a given fish species and life stage corresponding to incremental flow increases in each reach above those provided under existing operations?
• How much anadromous salmonid habitat would be available in Reach 3 under varying flow conditions if fish passage facilities were provided?
• What mainstem flows in Reach 1 provide connectivity to adjoining side channel areas?
• What are the species and life stage specific habitat – flow relationships in side channel areas associated with Reach 1?
The study resulted in the development of a series of habitat-flow relationships for each operational reach of the mainstem Sultan River, as well as for three side channels in the lower reach (Reach 1). Such relationships can serve as indices of how changes in flow may influence the quantity of habitats of various target fish species and life stages. Relative to flow connectivity in the side channels, the study also defined the relationship of mainstem flow to side channel flow and determined the amount of surface areas available in each. In addition, time series and habitat duration analysis were completed that estimated the amounts of habitat for a given species and life stage that would occur under both Stage 1 and Stage 2 conditions for three different water year types. The information provided from this study should be useful for evaluating tradeoffs relative to gains in habitat versus changes in flow both on a reach scale basis as well as for the overall system. It should be noted however, that given the varying shapes in the habitat: flow

R2 Resource Consultants, Inc. 5-2 March 19, 2009 1628.07/Instream Flow Report_031909
relationships, it is likely that flows beneficial (defined as increasing habitat) to one or more species and life stage may be detrimental (reduce habitat) to other species. Thus, formulation of flow regimes for each of the three operational reaches of the Sultan River can be complex and will likely need to revolve around balancing reach - specific resource objectives (which may involve more than just fish) with operational constraints that include, in addition to hydropower generation and water supply, flood control and lake recreation. In combination with information provided in a number of other studies listed in Section 1, the results can also be used for identifying and evaluating potential protection, mitigation and enhancement measures.

R2 Resource Consultants, Inc. 6-1 March 19, 2009 1628.07/Instream Flow Report_031909
6. REFERENCES
Annear, T., I. Chisholm, H. Beecher, A. Locke and 12 other authors. 2004. Instream flows for riverine resource stewardship (revised edition). In stream Flow Council, Cheyenne, Wyoming.
Aro, K.V., and M.P. Shepard. 1967. Pacific salmon in Canada. Pages 225-327 in Salmon of the North Pacific Ocean. Part IV. Spawning populations of North Pacific salmon. International North Pacific Fisheries Commission Bulletin 23.
Atkinson, C.E., J.H. Rose, and T.O. Duncan. 1967. Pacific salmon in the United States. Pages 43-223 in Salmon of the North Pacific Ocean. Part IV. Spawning populations of North Pacific salmon. International North Pacific Fisheries Commission Bulletin 23.
Barnhart, R.A. 1986. Species profiles: life histories and environmental requirements of coastal fishes and invertebrates (Pacific southwest) – Steelhead. Biological Report 82 (11.60). U.S. Fish and Wildlife Service, U.S. Department of the Interior, Washington, DC, and the Coastal Ecology Group, Waterways Experiment Station, U.S. Army Corps of Engineers, Vicksburg, Mississippi
Baxter, J.S., E.B. Taylor, R.H. Devlin, J. Hagen, and J.D. McPhail. 1997. Evidence for Natural Hybridization between Dolly Varden (Salvelinus malma) and Bull Trout (Salvelinus confluentus) in a north central British Columbia Watershed. Canadian Journal of Fisheries and Aquatic Sciences 54: 421-429.
Beak Consultants Incorporated. 1996. Tacoma Second Supply Project biological assessment. Prepared for Tacoma Public Utilities, Water Division. Kirkland, Washington. April 1996.
Beauchamp, D.A., M.F. Shepard, and G.B. Pauley. 1983. Species profiles: life histories and environmental requirements of coastal fishes and invertebrates (Pacific Northwest) – chinook salmon. U.S. Fish and Wildlife Service, Division of Biological Services, FWS/OBS-82/11.6. U.S. Army Corps of Engineers, TR EL-82-4.
Bovee, K. and R.T. Milhous. 1978. Hydraulic simulation in instream flow studies: theory and technique. Instream Flow Information Paper No. 5. Washington D.C.: U.S. Fish and Wildlife Service, FWS/OBS-78/33.
Bovee, K., B. Lamb, J. Bartholow, C. Stalnaker, J. Taylor, and J. Henriksen. 1998. Stream habitat analysis using the Instream Flow Incremental Methodology. Fort Collin, CO. U.S. Geological Survey, Biological Resources Division. Information and Technical Report USGS/BRD-1998-0004. 131 pp.

R2 Resource Consultants, Inc. 6-2 March 19, 2009 1628.07/Instream Flow Report_031909
Bovee, K.D. 1982. A guide to stream habitat analysis using the Instream Flow Incremental Methodology (IFIM). Instream Flow Information Paper No. 12. USFWS Report FWS/OBS-82-26.
Burner, C.J. 1951. Characteristics of spawning nests of Columbia River salmon. U.S. Fish and Wildlife Service, Fisheries Bulletin 61, Vol. 52. pp. 97-100.
Busby, P.J., T.C. Wainwright, G.J. Bryant, L. Lierheimer, R.S. Waples, F.W. Waknitz, and I.V. Lagomarsino. 1996. Status review of west coast steelhead from Washington, Idaho, Oregon and California. U.S. Dept. Commer., NOAA Tech. Memo. NMFS-NWFSC-27.
Bustard, D.R., and D.W. Narver. 1975. Aspects of the winter ecology of juvenile coho salmon (Oncorhynchus kisutch) and steelhead trout (Salmo gairdneri). J. Fish. Res. Board Canada 32: 556-680.
CH2M HILL. 2005. Project effects on anadromous salmonids and bull trout in the Sultan River. Prepared for Public Utility District No. 1 of Snohomish County. Everett, Washington.
CH2M HILL. 2008a. Fish Passage Feasibility at the Sultan River Diversion Dam, Phase 2, Fish Passage Assessment, Relicensing Study Plan No. 20. Draft report. Prepared for Public Utility District No. 1 of Snohomish County.
CH2M HILL. 2008b. Water Quality Parameter Study. Relicensing Study Plan No. 1. Draft report. Prepared for Public Utility District No. 1 of Snohomish County.
Confluence Research and Consulting. 2008. Flow Recreation Study. Study Plan No. 14. Draft report. Prepared for Public Utility District No. 1 of Snohomish County.
Craig, P.C. 1984. Fish use of coastal waters of the Alaskan Beaufort Sea: a review. Transactions of the American Fisheries Society 113: 265-282.
Easterbrooks, J.A. and R.J. Gerke. 1978. Sultan River Flow Study. Washington Department of Fisheries. Report prepared for Snohomish County Public Utility District.
Emmett, R.L., S.L. Stone, S.A. Hinton, and M.E. Monaco. 1991. Distribution and abundance of fishes and invertebrates in west coast estuaries, Volume II: species life history summaries. ELMR Report Number 8. NOAA/NOS Strategic Environmental Assessments Division, Rockville, Maryland. 329 p.
Everest, F.H., and D.W. Chapman. 1972. Habitat selection and spatial interaction by juvenile chinook salmon and steelhead trout in two Idaho streams. Journal of the Fisheries Research Board of Canada 29:91-100.
Goetz, F.A., E. Jeanes and E. Beamer. 2004. Bull trout in the nearshore. Preliminary draft.

R2 Resource Consultants, Inc. 6-3 March 19, 2009 1628.07/Instream Flow Report_031909
Grette, G.B., and E.O. Salo. 1986. The status of anadromous fishes of the Green/Duwamish river system. Prepared for the U.S. Army Corps of Engineers.
Groot, C., and L. Margolis. 1991. Pacific salmon life histories. Department of Fisheries and Oceans, Canada.
Hagen, J. and E.B. Taylor. 2001. Resource Partitioning as a Factor Limiting Gene Flow in Hybridizing Populations of Dolly Varden Char (Salvelinus malma) and Bull Trout (Salvelinus confluentus). Canadian Journal of Fisheries and Aquatic Sciences 58: 2037-2047.
Hallock, R.J., and D.H. Fry, Jr. 1967. Five species of salmon, Oncorhynchus, in the Sacramento River, California. California Fish and Game 53: 5-22.
Hard, J.J., R.G. Kope, N.S. Grant, F.W. Waknitz, L.T. Parker, and R.S. Waples. 1996. Status review of pink salmon from Washington, Oregon and California. U.S. Department of Commerce, NOAA Technical Memorandum. NMFS-NWFSC-33. 131 p.
Haring, D. 2002. Salmonid habitat limiting factors analysis Snohomish River watershed.
Hart, J.L. 1973. Pacific fishes of Canada. Fish. Res. Board Can. Bull. 180. 665 pp.
Healey, M.C. 1991. Life history of Chinook salmon (Oncorhynchus tshawytscha). Pages 311-393 in C. Groot and L. Margolis, editors. Life history of Pacific Salmon. University of British Columbia Press. Vancouver, British Columbia.
Heard, M.C. 1991. Life History of pink salmon (Oncorhynchus gorbuscha). Pages 397-445 in C. Groot and L. Margolis, editors. Pacific salmon life histories. University of British Columbia Press, Vancouver, Canada.
Henry, K.A. 1953. Analysis of factors affecting the production of chum salmon (Oncorhynchus keta) in Tillamook Bay. Fish Commission of Oregon Contrib. 18: 37 p.
Johnston, J.M. 1982. Life histories of anadromous cutthroat trout with emphasis on migratory behavior. Pages 123-127 in E.L. Brannon and E.O. Salo, editors. Salmon and trout migratory behavior symposium. University of Washington School of Fisheries. Seattle, Washington.
Laufle, J.C., G.B. Pauley, and M.F. Shepard. 1986. Specie profiles: life histories and environmental requirements of coastal fishes and invertebrates (Pacific Northwest) – coho salmon. U.S. Fish and Wildlife Service Biological Report 82(11.48). 18 p.

R2 Resource Consultants, Inc. 6-4 March 19, 2009 1628.07/Instream Flow Report_031909
Leider, S.A. 1997. Status of sea-run cutthroat trout in Washington. Pages 68-76 in J.D. Hall, P.A. Bisson, and R.E. Gresswell, editors. Sea-run cutthroat trout biology, management, and future conservation. Oregon Chapter American Fisheries Society, Corvallis, Oregon.
Magee, J.K. 1967. Direct testimony and related exhibits of John K. Magee before a Federal Power Commission hearing, Project No. 2157. In the matter of PUD No. 1 of Snohomish County and City of Everett, Washington.
McPhail, J.D. and E.B. Taylor. 1995. Final report to Skagit Environmental Endowment Commission. Skagit Char Project (94-1). Dept. of Zoology, University of British Columbia, Vancouver, B.C. 39 p.
Milhous, R.T., D.L. Wegner, and T. Waddle. 1984. Users guide to the physical habitat simulation system (PHABSIM). Instream Flow Information Paper No. 11. Washington, DC: U.S. Fish and Wildlife Service (FWS/OBS-81/43). Revised.
Milhous, R.T., M.A. Updike, D.M. Schneider. 1989. Computer reference manual for the Physical Habitat Simulation System (PHAB SIM) – Version II. In stream Flow Information Paper No. 26. U.S. Fish and Wildlife Serv. Biological Report. 89(16).
Milhous, R.T., J.M. Bartholow, M.A. Updike, and A.R. Moos. 1990. Reference manual for the generation and analysis of habitat time series-version II. Washington D.C.: U.S. Fish and Wildlife Service (Biological Report 90(16)). 249 pp.
Myers, J.M., R.G. Kope, G.J. Bryant, D. Teel, L.J. Lierheimer, T.C. Wainwright, W.S. Grant, F.W. Waknitz, K. Neeley, S.T. Lindley, and R.S. Waples. 1998. Status review of Chinook salmon from Washington, Idaho, Oregon, and California. U.S. Dept. Commer., NOAA Tech. Memo. NMFS-NWFSC-35. 443 p.
Pearcy, W.G. 1997. The sea-run and the sea. Pages 29-34 in J.D. Hall, P.A. Bisson, and R.E. Gresswell, editors. Sea-run cutthroat trout: biology, management, and future conservation. Oregon Chapter, American Fisheries Society, Corvallis, Oregon.
Public Utility District No.1 of Snohomish County and City of Everett. 2005. Pre-Application Document. Henry M. Jackson Hydroelectric Project FERC No. 2157. Volume 1: Public Information, in accordance with 18 CFR 5.6
R2 Resource Consultants (R2). 2008a. Study Plan 23. Indicators of Hydrologic Alteration/Range of Variability Analysis (IHA/RVA) in the Sultan River Downstream of Culmback Dam. Prepared for Public Utility District No. 1 of Snohomish County and City of Everett.

R2 Resource Consultants, Inc. 6-5 March 19, 2009 1628.07/Instream Flow Report_031909
R2 Resource Consultants (R2). 2008b. Study Plan 5. Juvenile Fish Occurrence Life History and Distribution, Progress Report. Prepared for Public Utility District No. 1 of Snohomish County and City of Everett.
R.W. Beck and Associates. 1980. Evaluation of instream flows for the Sultan River from Culmback Dam to the Diversion Dam. Sultan River Project, FERC Project No. 2157. Public Utility District No. 1 of Snohomish County, Washington.
Reimers, P.E. 1973. The length of residence of fall chinook salmon in the Sixes River, Oregon. Oregon Fish Commission 4(2). 43 p.
Ruggerone, G. T. 2008. Phase 1: Fish passage assessment, evaluation of salmon and steelhead migration after a landslide in the Sultan River. Prepared by Natural Resources Consultants, for Snohomish County Public Utility District.
Sandercock, F. K. 1991. Life History of Coho Salmon (Oncorhynchus kisutch). In C. Groot and L. Margolis (editors), Pacific salmon life histories, p. 396-445. Univ. British Columbia Press, Vancouver.
Spence, B.C., G. A. Lomnicky, R.M. Hughes, and R.P. Novitzki. 1996. An ecosystem approach to salmonid conservation. TR-4501-96-6057. Management Technology.
Stalnaker, C., B. Lamb, J. Henriksen, K. Bovee, and J. Bartholow. 1995. A primer for IFIM. Fort Collins: National Biological Service (Biological Report 29). 45 pp.
Stillwater Sciences and Meridian Environmental. 2008a. Study Plan 18: Riverine, Riparian and Wetland Habitat Assessment, technical report. Prepared for Snohomish County Public Utility District No. 1.
Stillwater Sciences and Meridian Environmental. 2008b. Study Plan 22: Sultan River Physical Process Studies, draft technical report. Prepared for Snohomish County Public Utility District No. 1.
Stolz, J. and J. Schnell. 1991. The wildlife series: Trout. Stackpole books, Harrisburg, Pennsylvania.
Taylor, E.B., Z. Redenbach, A.B. Costello, S.M. Pollard, and C.J. Pacas. 2001. Nested Analysis of Genetic Diversity in Northwestern North American Char, Dolly Varden (Salvelinus malma) and Bull Trout (Salvelinus confluentus). Canadian Journal of Fisheries and Aquatic Sciences 58: 406-420.
Trihey, W. and D.L. Wegner. 1983. Field data collection procedures for use with the Physical Habitat Simulation System of the Instream Flow Group. Cooperative Instream Flow Group. Fort Collins, Colorado. Revised edition 1983.

R2 Resource Consultants, Inc. 6-6 March 19, 2009 1628.07/Instream Flow Report_031909
Trotter, P.C. 1997. Sea-run cutthroat trout: life history profile. Pages 7-15 in J.D. Hall, P.A. Bisson, and R. E. Gresswell, editors. Sea-run cutthroat trout biology, management, and future conservation, proceedings of a symposium. American Fisheries Society, Corvallis, Oregon.
Wahle, R.J., and R.E. Pearson. 1987. A listing of Pacific coast spawning streams and hatcheries producing chinook and coho salmon (with estimates on numbers of spawners and data on hatchery releases). U.S. Dept. of Commer., NOAA Tech. Memo., NMFS F/NWC-122. 109 p.
Washington Department of Fish and Wildlife (WDFW). 1998. Salmonid Stock Inventory Appendix Bull Trout and Dolly Varden. Washington Department of Fish and Wildlife Fish Program. July, 1998.
Washington Department of Fish and Wildlife (WDFW). 2000. 2000 salmonid stock inventory coastal cutthroat trout. A. Blakley, B. Leland J. Ames, editors.
Washington Department of Fish and Wildlife and Washington State Department of Ecology (WDFW and WDOE). 2004. Instream flow study guidelines: technical and habitat suitability issues, Updated, April 5, 2004.
Washington Department of Fish and Wildlife and Washington State Department of Ecology (WDFW and WDOE). 2008. Instream Flow Study Guidelines: Technical and Habitat Suitability Issues including fish preference curves. Updated, April 5, 2004. Error Correction Update February 12, 2008.
Washington Department of Fish and Wildlife (WDFW) and Western Washington Treaty Indian Tribes. 1994. 1992 Washington State Salmon and Steelhead Stock Inventory. Appendix 1 Puget Sound Stocks, North Puget Sound Volume. Olympia, Washington.
Washington Department of Game (WDG). 1986. Snohomish winter steelhead resource inventory. Washington Department of Game Region 4. Binder report based on Rbase 5000 database as of July 1985.
Weitkamp L.A., T.C. Wainwright, G.J. Bryant, G.B. Milner, D.J. Teel, R.G. Kope, and R.S. Waples. 1995. Status Review of Coho Salmon from Washington, Oregon, and California. U.S. Dept. of Commer., NOAA Tech. Memo. NMFS-NWFSC-24. 254 p.
Williams, W., R. Laramie, and J. Ames. 1975. A Catalog of Washington Streams and Salmon Utilization, Volume 1, Puget Sound Region. Washington Dept. of Fisheries (now Dept. of Fish and Wildlife), Olympia, WA.
Wydoski, R.S. and R.R. Whitney. 2003. Inland fishes of Washington. University of Washington Press, Seattle, Washington. Second Edition.

R2 Resource Consultants, Inc. March 19, 2009 1628.07/Instream Flow Report_031909
APPENDIX A
Transect Selection Presentation June 12, 2008

R2 Resource Consultants, Inc. March 19, 2009 1628.07/Instream Flow Report_031909
APPENDIX B
Target Flow Memorandum June 11, 2007

R2 Resource Consultants, Inc. March 19, 2009 1628.07/Instream Flow Report_031909
APPENDIX C
Habitat Suitability Criteria (HSC)

R2 Resource Consultants, Inc. March 19, 2009 1628.07/Instream Flow Report_031909
APPENDIX C1
Proposed Habitat Suitability Criteria (HSC) Curves for Application in Habitat-Flow Modeling for the
Sultan River Instream Flow Study – RSP 3, June 5, 2008

R2 Resource Consultants, Inc. March 19, 2009 1628.07/Instream Flow Report_031909
APPENDIX C2
Technical Memorandum: Sultan River Instream Flow Study – HSC Preference Analysis and Revised Steelhead and Chinook Curves,
July 31, 2008

R2 Resource Consultants, Inc. March 19, 2009 1628.07/Instream Flow Report_031909
APPENDIX C3
HSC Curves Used in Habitat-flow Modeling

R2 Resource Consultants, Inc. March 19, 2009 1628.07/Instream Flow Report_031909
APPENDIX D
Habitat:Flow Relationships and Time Series Analysis

R2 Resource Consultants, Inc. March 19, 2009 1628.07/Instream Flow Report_031909
APPENDIX D1
Weighted Useable Area (ft2/1000 ft) Versus Flow (cfs) Relationships for Target Fish Species for Upper and Lower Study Sites within Three
Operational Reaches of the Sultan River, Washington

R2 Resource Consultants, Inc. March 19, 2009 1628.07/Instream Flow Report_031909
APPENDIX D2
Time Series Analysis for Reach 3 – Sultan River

R2 Resource Consultants, Inc. March 19, 2009 1628.07/Instream Flow Report_031909
APPENDIX D3
Time Series Analysis for Reach 2 – Sultan River

R2 Resource Consultants, Inc. March 19, 2009 1628.07/Instream Flow Report_031909
APPENDIX D4
Time Series Analysis for Reach 1 – Sultan River

R2 Resource Consultants, Inc. March 19, 2009 1628.07/Instream Flow Report_031909
APPENDIX D5
Weighted Usable Area (ft2/1000 ft) Versus Flow (cfs) Relationships for the Three Side Channels within Reach 1 of the Sultan River, Washington

R2 Resource Consultants, Inc. March 19, 2009 1628.07/Instream Flow Report_031909
APPENDIX E
Transect Photographs

R2 Resource Consultants, Inc. March 19, 2009 1628.07/Instream Flow Report_031909
APPENDIX F
Transect Cross Sectional Profiles and Model Calibration Details

R2 Resource Consultants, Inc. March 19, 2009 1628.07/Instream Flow Report_031909
APPENDIX G
Field Notes