Determinants of soybean adoption and performance in...
18
African Journal of Agricultural and Resource Economics Volume 14 Number 4 pages 292-309 Determinants of soybean adoption and performance in Northern Ghana Courtney A. Tamimie Department of Agricultural and Consumer Economics, the University of Illinois, Urbana, Illinois, USA. E-mail: [email protected] Peter D. Goldsmith* Department of Agricultural and Consumer Economics, the University of Illinois, Urbana, Illinois, USA. E-mail: [email protected] * Corresponding author Abstract Soybean has been the world’s fastest growing crop over the last 15 years. Yet, as an untraditional and unfamiliar crop, soybean requires small farmers to move beyond their traditional production practices and marketing arrangements in order to produce a successful crop. We employ complexity theory to frame soybean’s production and market differences as significant and non-incremental for smallholder farmers, thus making soybean a ‘long-jump’ agricultural technology problem. We consider three estimation strategies using a primary dataset of smallholder women soybean producers in the Upper West region of Ghana. We first employ probit and ordinary least squares (OLS) regression models to understand adoption and performance. We then employ a combined spatial-autoregressive with spatial-autoregressive disturbances (SARAR) model using generalised spatial two-stage least squares to understand cross-unit interactions in a spatial dimension. We find positive, large and significant spatial autoregressive dependence and knowledge spillover to affect the soybean yields of smallholder female farmers within spatial networks. This finding provides guidance for agricultural development practitioners regarding the importance of social interaction and information provision when promoting long-jump technologies like soybean. Key words: soybean; gender; smallholders; Ghana; technology adoption 1. Introduction For most of the developing world, agriculture represents the largest employment sector and is a leading contributor to national income. Yet in many parts of Sub-Saharan Africa, agricultural productivity is extremely low, with stagnant or even declining yields (Doss 2006; Damania et al. 2017). As a result, there is interest in and a focus on increasing agricultural productivity through the introduction of improved agricultural technologies and management systems that have the potential to sustainably improve labour productivity, incomes, food security and general economic growth (Feder et al. 1985; Doss 2006; Maertens & Barrett 2013). Agricultural technologies have predominantly taken the form of improvements to: traditional and staple crop varieties; land, soil and water management practices; and input and fertiliser utilisation through subsidy packages (Muzari et al. 2012 Ainembabazi & Mugisha 2014). These types of agricultural technologies, especially when introduced incrementally, can be considered as ‘short-
Transcript of Determinants of soybean adoption and performance in...
African Journal of Agricultural and Resource Economics Volume 14 Number 4 pages 292-309
Determinants of soybean adoption and performance in Northern
Ghana
Courtney A. Tamimie
Department of Agricultural and Consumer Economics, the University of Illinois, Urbana, Illinois, USA. E-mail:
Peter D. Goldsmith*
Department of Agricultural and Consumer Economics, the University of Illinois, Urbana, Illinois, USA. E-mail:
* Corresponding author
Abstract
Soybean has been the world’s fastest growing crop over the last 15 years. Yet, as an untraditional
and unfamiliar crop, soybean requires small farmers to move beyond their traditional production
practices and marketing arrangements in order to produce a successful crop. We employ complexity theory to frame soybean’s production and market differences as significant and non-incremental for
smallholder farmers, thus making soybean a ‘long-jump’ agricultural technology problem. We
consider three estimation strategies using a primary dataset of smallholder women soybean
producers in the Upper West region of Ghana. We first employ probit and ordinary least squares
(OLS) regression models to understand adoption and performance. We then employ a combined
spatial-autoregressive with spatial-autoregressive disturbances (SARAR) model using generalised
spatial two-stage least squares to understand cross-unit interactions in a spatial dimension. We find
positive, large and significant spatial autoregressive dependence and knowledge spillover to affect
the soybean yields of smallholder female farmers within spatial networks. This finding provides
guidance for agricultural development practitioners regarding the importance of social interaction
and information provision when promoting long-jump technologies like soybean.
Key words: soybean; gender; smallholders; Ghana; technology adoption
1. Introduction
For most of the developing world, agriculture represents the largest employment sector and is a
leading contributor to national income. Yet in many parts of Sub-Saharan Africa, agricultural
productivity is extremely low, with stagnant or even declining yields (Doss 2006; Damania et al.
2017). As a result, there is interest in and a focus on increasing agricultural productivity through the
introduction of improved agricultural technologies and management systems that have the potential
to sustainably improve labour productivity, incomes, food security and general economic growth
(Feder et al. 1985; Doss 2006; Maertens & Barrett 2013).
Agricultural technologies have predominantly taken the form of improvements to: traditional and staple crop varieties; land, soil and water management practices; and input and fertiliser utilisation
through subsidy packages (Muzari et al. 2012 Ainembabazi & Mugisha 2014). These types of
agricultural technologies, especially when introduced incrementally, can be considered as ‘short-

AfJARE Vol 14 No 4 December 2019 Onzima et al.
293
jump’ technologies that do not require significant changes in the crop production portfolios and
management systems of smallholder farmers.
‘Long-jump’ agricultural technologies, however, require greater adaptive processes by farmers.
These technologies not only may involve a new crop, system of production and marketing practices,
but also may even cause producers to reassess the strategies and goals of their entire farm portfolio
of activities. Unlike in short jumps, long jumping involves organisational adaption without a lot of
tacit knowledge relevant to the new agricultural technology (see Spulber 2012; Chun 2013).
The question of the introduction of soybean technology arises as policymakers, development agencies
and donors see the potential for soybean to generate new sources of income for smallholder farmers
from a new crop with growing global demand as an animal feed and resource for edible oil (Sanginga
et al. 1999; Dogbe et al. 2013). Policymakers look to the transformation of rural economies in South
America as a result of soybean, and thus seek to harness the technology for Africa (see Goldsmith &
Montesdeoca 2018). We have yet to find any research on the soybean adoption process among
smallholders. This research therefore not only fills an important empirical void, but helps
policymakers differentiate between short- and long-jump technologies in general, but also soybean
as a development crop compared with an improved native staple.
The specific context of this research involves women smallholder farmers newly engaged in soybean
production as a result of a new development project in the Upper West region. We empirically
analyse: 1) how different adoption drivers affect sustained soybean adoption versus intermittent
soybean adoption; 2) how different adoption drivers affect the level of performance in soybean
production as measured by yield; and 3) how the spatial interactions and spatial dependence drivers
affect soybean performance in soybean production.
2. Literature review
Complexity theory involves the study of change within dynamic systems (Ruhl 1996). The tension
between stasis and incremental or radical adaption has some appeal in the context of technological
adaptation by smallholders, who face poverty in stasis, but bear acute risks that limit their ability to
make radical changes. Fitness landscapes (Kauffman & Levin 1987; Levinthal 1997; Fontanari 2015)
are an important concept of complexity theory, as the environment presents many ways to adapt –
some incremental, thus short jumps, while others are more radical and are denoted as long jumps.
The Darwinian theory of evolution depicts organisms adapting over time as environments change,
thus stasis is equated with death. Complexity theory builds from Darwinian theory, with application
to social groups, and in which choice, strategy, recognition of risk, consciousness of the past and the
future are present. In a complex world, one may opt to adapt incrementally and minimise risk, but err
due to a lack of understanding of the seriousness of the changing environment, for instance economic
reality. Alternatively, change can be too dramatic and disruptive, thrusting the social organism in
chaos. The search process across the fitness landscape involves appropriate levels of change, along
with active learning so as to not go too slowly or too quickly, but it also requires finding balance
within the changing environment.
When we apply complexity theory to agricultural technology adoption, short-jump or incremental
agricultural technologies leverage the tacit knowledge, experience and core competencies of farmers
to improve their agricultural productivity, instead of encouraging farmers to engage in riskier, but
potentially higher pay-off, endeavours that are often associated with long-jump agricultural
technologies (Goldsmith & Gow 2005). As such, short-jump agricultural technologies have a high
probability of adoption by smallholder farmers, as they allow farmers to continue their traditional
practices and norms and typically require fewer new assets, have a lower risk premium, and are less
expensive than long-jump agricultural technologies (Muzari et al. 2012).

AfJARE Vol 14 No 4 December 2019 Onzima et al.
294
Previous literature (Adesina & Zinnah 1993; Chirwa 2005; Ainembabazi & Mugisha 2014) draws an
important distinction between resource endowments and learning (information access or knowledge
acquisition) as two classes of fixed costs that effect technology adoption in general. Significant ex
ante knowledge investments often characterise long-jump agricultural technologies, which results in
an economy to scale. For parsimony, we present a comprehensive summary of the technology
adoption literature in Table 1.
To our knowledge, relatively little work has been done on the adoption process for long-jump
agricultural technologies that, as discussed earlier in this paper, represent significant changes to
farmer production portfolios, practices, norms and standards. In this manuscript, we build the
empirical evidence for the forces that drive successful long-jump technology adoption. While we
include farmer demographics, as in previous studies, we additionally analyse education level, land
scale, seasonality and spatial characteristics as repressors not only of performance (yield), but also of
sustained adoption.
2.1 Soybean as a long-jump technology
Soybean is a new agricultural technology for much of the developing world, as less than .5 of 1% of
world soybean production originates from Sub-Saharan Africa excluding South Africa (Goldsmith
2014). In Africa, it is not a traditional crop, hence farmer utilisation of soybean is limited in many
settings (Dogbe et al. 2013).
Soybean is principally a commercial crop used by processors, not households or local small retailers.
Goldsmith (2017) describes the commercial nature and high management demands of soybean, which
may challenge smallholders to ‘jump’ from traditional native staples to a new, commercial cash crop.
Women farmers may be unfairly disadvantaged, as they are less able to access markets and may find
male-dominated commercial markets and extension systems difficult to access or inaccessible
altogether (Wendland & Sills 2008; Ragsdale et al. 2018). We therefore hypothesise that, as a new,
non-staple commercial crop, soybean may exhibit the characteristics of a long-jump agricultural
technology. To our knowledge, no research to date analyses the adoption process of commercial
soybean by smallholders in a developing country setting.
2.2 Research setting
Soybean is a relatively new crop in Ghana. Average Ghanaian soybean yields remain well below
global averages. Mbanya (2011) and Dogbe et al. (2013) observe very few smallholder farmers using
rhizobia inoculants to promote nitrogen fixation, and other improved agricultural technologies like
fertilisers, pesticides and good management practices (row planting, appropriate seed and row spacing
and plant population, etc.). Awuni and Reynolds (2018) show that yields in northern Ghana using
commercial soybean varieties double when using improved agricultural management strategies and
inputs (i.e. a high-input/high-output production scenario).
2.3 Hypothesised drivers of soybean adoption
To better understand the soybean adoption process, we tested adoption by relating farmer
performance in soybean production, as measured through yield, and farmer sustained, or persistent,
adoption of soybean, as measured through the number of consecutive years producing soybean, to
various hypothesised drivers. The specific long-jump drivers of particular interest that we studied
include: farmer characteristics (education, household head and experience/extension access);
economies of scale (total farm size, land allocated to soybean cultivation); market access (intention
to sell grain, engagement in dry-season activities); land rights (land tenure, duration of land control);
and spatial interactions among farmers (Table 2).

AfJARE Vol 14 No 4 December 2019 Onzima et al.
295
Table 1: Characterisation of long-jump vs. short-jump agricultural technology adoption literature
Technology
Familiar, staple
or traditional
crop
New market
exposure
required
Farmer
experience in
the technology
New agronomic
practices
required
Increased
scale
required
New inputs
required
Improved mangrove swamp rice adoption (Adesina & Zinnah
1993) Yes No Yes No No No
Commercial crop production by smallholders (Immink &
Alarcon 1993) No Yes No Yes Yes Yes
Adoption of soybean in sub-Saharan Africa: A comparative
analysis of production and utilization in Zaire and Nigeria
(Shannon & Kalala 1994)
No No No No No No
Dairy technology adoption (Staal et al. 2002) No Yes No Yes Yes Yes
Intercropping in rubber production (Herath & Takeya 2003) Yes No Yes No No No
Improved cowpea variety adoption (Alene & Manyong 2006) Yes No Yes No No No
Social learning in pineapple production (Conley & Udry 2010) No Yes No Yes Yes Yes
Bt cotton adoption (Maertens & Barrett 2013) Yes No Yes No No No
Economics of soybean production (Dogbe et al. 2013) No Yes No Yes Yes Yes
Technical efficiency in soybean production (Etwire et al. 2013) No Yes No Yes Yes Yes
Crossbred cow adoption (Edirisinghe & Holloway 2015) Yes Yes No Yes Yes Yes
Social network effects in hybrid rice adoption (Ward & Pede
2014) Yes No Yes No No No
Demand for drought-tolerant rice (Ward et al. 2014) Yes No Yes No No No
Transportation costs in yam, rice, cassava and maize production
(Damania et al. 2017) Yes No Yes No No No
Oil palm adoption (Euler et al. 2017) Yes No Yes No No No
AfJARE Vol 14 No 4 December 2019 Onzima et al.
296
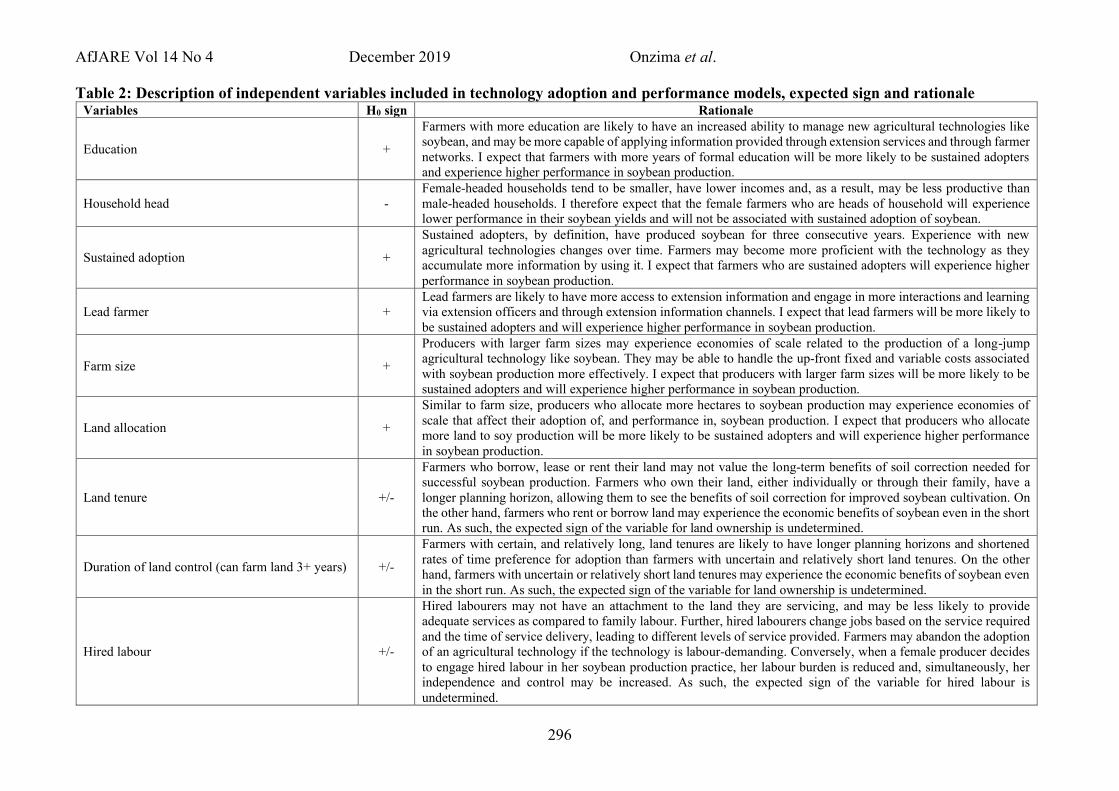
Table 2: Description of independent variables included in technology adoption and performance models, expected sign and rationale Variables H0 sign Rationale
Education +
Farmers with more education are likely to have an increased ability to manage new agricultural technologies like
soybean, and may be more capable of applying information provided through extension services and through farmer
networks. I expect that farmers with more years of formal education will be more likely to be sustained adopters
and experience higher performance in soybean production.
Household head -
Female-headed households tend to be smaller, have lower incomes and, as a result, may be less productive than
male-headed households. I therefore expect that the female farmers who are heads of household will experience
lower performance in their soybean yields and will not be associated with sustained adoption of soybean.
Sustained adoption +
Sustained adopters, by definition, have produced soybean for three consecutive years. Experience with new
agricultural technologies changes over time. Farmers may become more proficient with the technology as they
accumulate more information by using it. I expect that farmers who are sustained adopters will experience higher
performance in soybean production.
Lead farmer +
Lead farmers are likely to have more access to extension information and engage in more interactions and learning
via extension officers and through extension information channels. I expect that lead farmers will be more likely to
be sustained adopters and will experience higher performance in soybean production.
Farm size +
Producers with larger farm sizes may experience economies of scale related to the production of a long-jump
agricultural technology like soybean. They may be able to handle the up-front fixed and variable costs associated
with soybean production more effectively. I expect that producers with larger farm sizes will be more likely to be
sustained adopters and will experience higher performance in soybean production.
Land allocation +
Similar to farm size, producers who allocate more hectares to soybean production may experience economies of
scale that affect their adoption of, and performance in, soybean production. I expect that producers who allocate
more land to soy production will be more likely to be sustained adopters and will experience higher performance
in soybean production.
Land tenure +/-
Farmers who borrow, lease or rent their land may not value the long-term benefits of soil correction needed for
successful soybean production. Farmers who own their land, either individually or through their family, have a
longer planning horizon, allowing them to see the benefits of soil correction for improved soybean cultivation. On
the other hand, farmers who rent or borrow land may experience the economic benefits of soybean even in the short
run. As such, the expected sign of the variable for land ownership is undetermined.
Duration of land control (can farm land 3+ years) +/-
Farmers with certain, and relatively long, land tenures are likely to have longer planning horizons and shortened
rates of time preference for adoption than farmers with uncertain and relatively short land tenures. On the other
hand, farmers with uncertain or relatively short land tenures may experience the economic benefits of soybean even
in the short run. As such, the expected sign of the variable for land ownership is undetermined.
Hired labour +/-
Hired labourers may not have an attachment to the land they are servicing, and may be less likely to provide
adequate services as compared to family labour. Further, hired labourers change jobs based on the service required
and the time of service delivery, leading to different levels of service provided. Farmers may abandon the adoption
of an agricultural technology if the technology is labour-demanding. Conversely, when a female producer decides
to engage hired labour in her soybean production practice, her labour burden is reduced and, simultaneously, her
independence and control may be increased. As such, the expected sign of the variable for hired labour is
undetermined.

AfJARE Vol 14 No 4 December 2019 Onzima et al.
297
Variables H0 sign Rationale
Intention to sell grain +
Farmers who intend to sell their grain after harvest may be better positioned to access input and service markets, as
well as buyers, aggregators and processors. I expect that farmers who intend to sell their grain will be more likely
to be sustained adopters and will experience higher performance in soybean production.
Dry-season activities +/-
Farmers who engage in dry-season activities have been observed to be less risk-averse than farmers without sources
of dry-season income. However, these same farmers may be more diversified and thus less focused on soybean
production. As such, the expected sign of the variable for engagement in dry-season activities is undetermined.

AfJARE Vol 14 No 4 December 2019 Onzima et al.
298
2.4 Spatial interaction and technology adoption
Including measures of spatial interaction among farmers in the analysis of technology adoption
provides insight into the potential roles that social networks and social learning may play in farmer
decision-making and performance (Maertens & Barrett 2013; Wollni & Andersson 2014). Spatial
networks are particularly important in the context of long-jump agricultural technologies like soybean
because of the technical learning curve associated with a new commercial crop. In this context,
neighbouring farmers help reduce the uncertainty of a new agricultural technology, thereby lowering
the fixed costs of learning about the technology (Villano et al. 2016). We hypothesise that spatial
interaction among farmers will have a positive effect on farmer performance and sustained
production.
3. Data and descriptive statistics
The Greater Rural Opportunities for Women (GROW) project is an agricultural development
initiative focused on soybean production among female smallholder farmers in the Upper West region
of Ghana (Muhammed & Baker 2015). The GROW project is a six-year initiative begun in 2012 and
funded by the Mennonite Economic Development Associates (MEDA), an organisation of the
Canadian Department of Foreign Affairs, Trade and Development (DFATD). The GROW project
strategically targets its efforts geographically within the Upper West region of northern Ghana. The
GROW project began enrolling farmers in the programme in 2013. The data we use contain
observations for project clients who enrolled in 2013, 2014 and 2015. Between 2013 and 2015, 59%
of registered GROW project clients provided enrolment data, but did not provide post-harvest data.
As this is a large share of the total sample, there is potential for attrition bias. As such, the
generalisability of the results need to be taken with caution.
We use data from the 2015 growing season that provide historical information on 496 project clients
going back to 2013. Of these 496 total observations, 453 had complete values across the variables
used in the analysis. All farmers produced soybean in 2015.
We draw a distinction between three types of dynamic adoption: farmers who adopted and continued
using a technology (sustained adopters), farmers who adopted a technology, discarded it, then
returned to the technology (intermittent adopters1), and farmers with one year of adoption (late
adopters). By evaluating these different adoption scenarios, our research addresses the inherent
dynamic nature of the adoption process, and particularly the drivers behind sustained versus
intermittent adoption of a long-jump agricultural technology like commercial soybean. Further, the
GROW project has struggled with intermittent adoption among project participants, thus this research
informs agricultural development practitioners such as GROW on factors that promote sustained
adoption of new agricultural technologies.
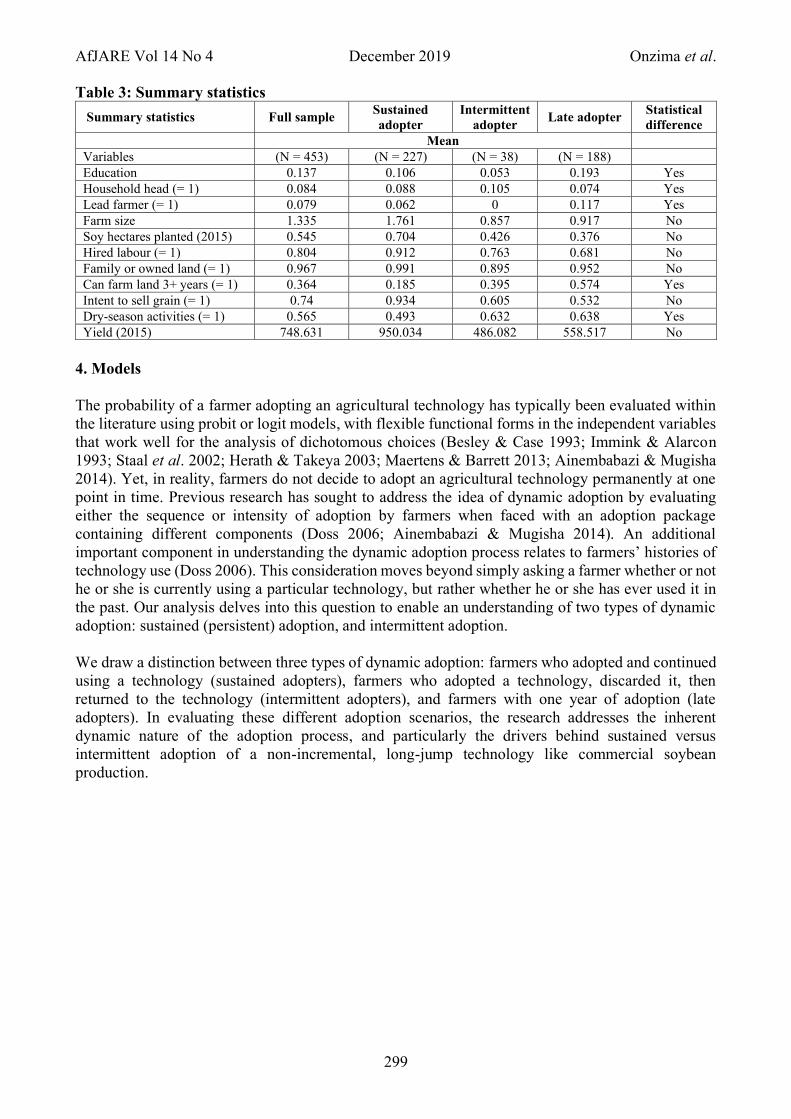
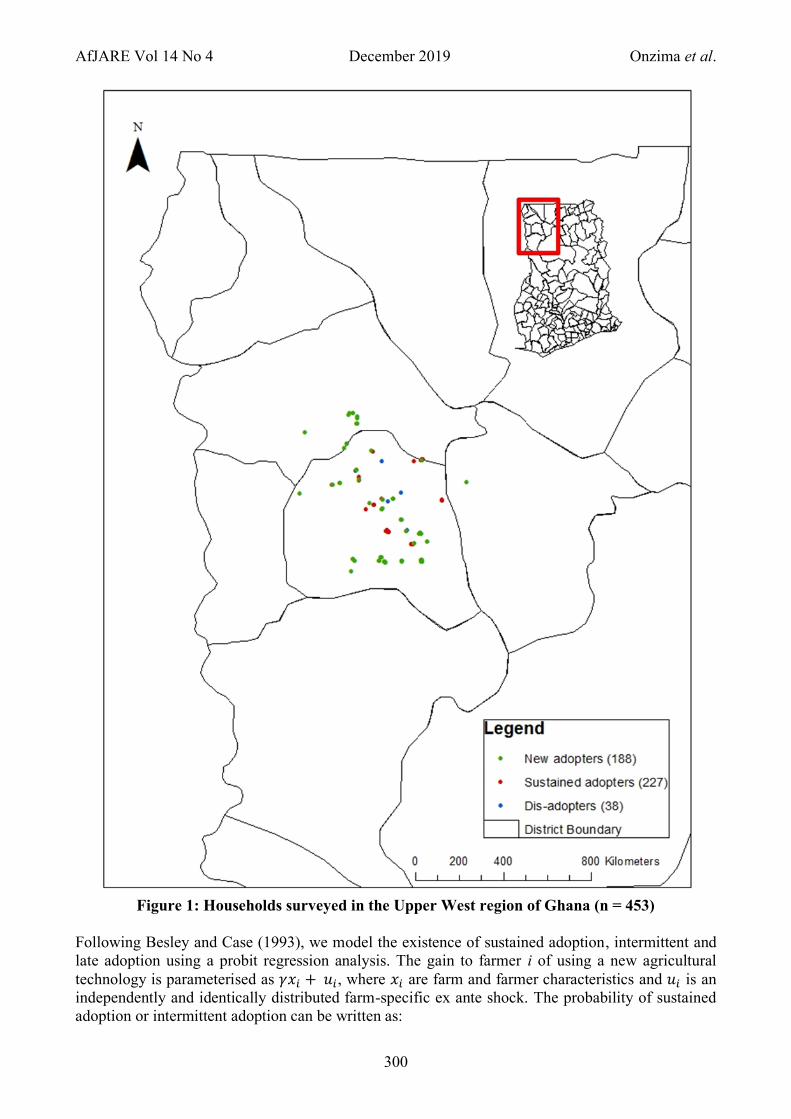
Farmers who reported that they grew soybean consecutively in 2013, 2014 and 2015 were coded as
sustained soybean adopters. Of the 453 total observations, 227 observations were sustained adopters
(Table 3). Intermittent adopters reported that they grew soy in 2013, did not in 2014, and then resumed
soybean cultivation in 2015. Of the 453 total observations, 38 observations were coded as intermittent
adopters. A third classification designates late adopters. These farmers reported that 2015 was their
first year of soybean cultivation and that they had not grown soy in 2013 or 2014. Of the 453 total
observations, 188 observations were coded as late adopters. Figure 1 shows the geographic
distribution of the 453 farmer sample based in the Upper West region of Ghana, classified by adopter
type.
1 We do not report on the results from the intermittent model in order to reduce the length of the manuscript.
AfJARE Vol 14 No 4 December 2019 Onzima et al.
299
Table 3: Summary statistics
Summary statistics Full sample Sustained
adopter
Intermittent
adopter Late adopter
Statistical
difference
Mean Variables (N = 453) (N = 227) (N = 38) (N = 188) Education 0.137 0.106 0.053 0.193 Yes
Household head (= 1) 0.084 0.088 0.105 0.074 Yes
Lead farmer (= 1) 0.079 0.062 0 0.117 Yes
Farm size 1.335 1.761 0.857 0.917 No
Soy hectares planted (2015) 0.545 0.704 0.426 0.376 No
Hired labour (= 1) 0.804 0.912 0.763 0.681 No
Family or owned land (= 1) 0.967 0.991 0.895 0.952 No
Can farm land 3+ years (= 1) 0.364 0.185 0.395 0.574 Yes
Intent to sell grain (= 1) 0.74 0.934 0.605 0.532 No
Dry-season activities (= 1) 0.565 0.493 0.632 0.638 Yes
Yield (2015) 748.631 950.034 486.082 558.517 No
4. Models
The probability of a farmer adopting an agricultural technology has typically been evaluated within
the literature using probit or logit models, with flexible functional forms in the independent variables
that work well for the analysis of dichotomous choices (Besley & Case 1993; Immink & Alarcon
1993; Staal et al. 2002; Herath & Takeya 2003; Maertens & Barrett 2013; Ainembabazi & Mugisha
2014). Yet, in reality, farmers do not decide to adopt an agricultural technology permanently at one
point in time. Previous research has sought to address the idea of dynamic adoption by evaluating
either the sequence or intensity of adoption by farmers when faced with an adoption package
containing different components (Doss 2006; Ainembabazi & Mugisha 2014). An additional
important component in understanding the dynamic adoption process relates to farmers’ histories of
technology use (Doss 2006). This consideration moves beyond simply asking a farmer whether or not
he or she is currently using a particular technology, but rather whether he or she has ever used it in
the past. Our analysis delves into this question to enable an understanding of two types of dynamic
adoption: sustained (persistent) adoption, and intermittent adoption.
We draw a distinction between three types of dynamic adoption: farmers who adopted and continued
using a technology (sustained adopters), farmers who adopted a technology, discarded it, then
returned to the technology (intermittent adopters), and farmers with one year of adoption (late
adopters). In evaluating these different adoption scenarios, the research addresses the inherent
dynamic nature of the adoption process, and particularly the drivers behind sustained versus
intermittent adoption of a non-incremental, long-jump technology like commercial soybean
production.
AfJARE Vol 14 No 4 December 2019 Onzima et al.
300
Figure 1: Households surveyed in the Upper West region of Ghana (n = 453)
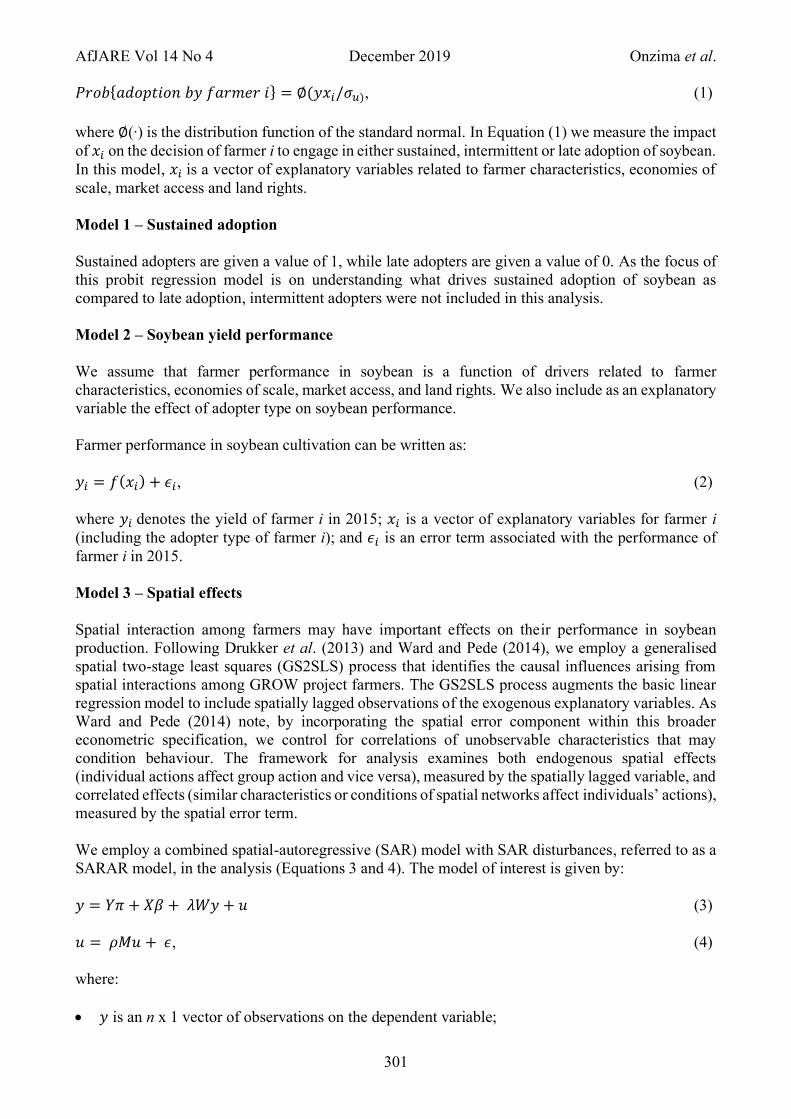
Following Besley and Case (1993), we model the existence of sustained adoption, intermittent and
late adoption using a probit regression analysis. The gain to farmer i of using a new agricultural
technology is parameterised as 𝛾𝑥𝑖 + 𝑢𝑖, where 𝑥𝑖 are farm and farmer characteristics and 𝑢𝑖 is an
independently and identically distributed farm-specific ex ante shock. The probability of sustained
adoption or intermittent adoption can be written as:
AfJARE Vol 14 No 4 December 2019 Onzima et al.
301
𝑃𝑟𝑜𝑏{𝑎𝑑𝑜𝑝𝑡𝑖𝑜𝑛 𝑏𝑦 𝑓𝑎𝑟𝑚𝑒𝑟 𝑖} = ∅(𝑦𝑥𝑖/𝜎𝑢), (1)
where ∅(∙) is the distribution function of the standard normal. In Equation (1) we measure the impact
of 𝑥𝑖 on the decision of farmer i to engage in either sustained, intermittent or late adoption of soybean.
In this model, 𝑥𝑖 is a vector of explanatory variables related to farmer characteristics, economies of
scale, market access and land rights.
Model 1 – Sustained adoption
Sustained adopters are given a value of 1, while late adopters are given a value of 0. As the focus of
this probit regression model is on understanding what drives sustained adoption of soybean as
compared to late adoption, intermittent adopters were not included in this analysis.
Model 2 – Soybean yield performance
We assume that farmer performance in soybean is a function of drivers related to farmer
characteristics, economies of scale, market access, and land rights. We also include as an explanatory
variable the effect of adopter type on soybean performance.
Farmer performance in soybean cultivation can be written as:
𝑦𝑖 = 𝑓(𝑥𝑖) + 𝜖𝑖, (2)
where 𝑦𝑖 denotes the yield of farmer i in 2015; 𝑥𝑖 is a vector of explanatory variables for farmer i
(including the adopter type of farmer i); and 𝜖𝑖 is an error term associated with the performance of
farmer i in 2015.
Model 3 – Spatial effects
Spatial interaction among farmers may have important effects on their performance in soybean
production. Following Drukker et al. (2013) and Ward and Pede (2014), we employ a generalised
spatial two-stage least squares (GS2SLS) process that identifies the causal influences arising from
spatial interactions among GROW project farmers. The GS2SLS process augments the basic linear
regression model to include spatially lagged observations of the exogenous explanatory variables. As
Ward and Pede (2014) note, by incorporating the spatial error component within this broader
econometric specification, we control for correlations of unobservable characteristics that may
condition behaviour. The framework for analysis examines both endogenous spatial effects
(individual actions affect group action and vice versa), measured by the spatially lagged variable, and
correlated effects (similar characteristics or conditions of spatial networks affect individuals’ actions),
measured by the spatial error term.
We employ a combined spatial-autoregressive (SAR) model with SAR disturbances, referred to as a
SARAR model, in the analysis (Equations 3 and 4). The model of interest is given by:
𝑦 = 𝑌𝜋 + 𝑋𝛽 + 𝜆𝑊𝑦 + 𝑢 (3)
𝑢 = 𝜌𝑀𝑢 + 𝜖, (4)
where:
• 𝑦 is an n x 1 vector of observations on the dependent variable;

AfJARE Vol 14 No 4 December 2019 Onzima et al.
302
• 𝑌 is an n x p matrix of observations on p right-hand-side variables, and 𝜋 is the corresponding p
x 1 parameter vector;
• 𝑋 is an n x k matrix of observations on k right-hand-side exogenous variables (where some of the
variables may be spatial lags of exogenous variables), and 𝛽 is the corresponding p x 1 parameter
vector;
• 𝑊 and M are n x n spatial-weighting matrices (with 0 diagonal elements);
• 𝑊𝑦 and 𝑀𝑢 are n x 1 vectors, typically referred to as spatial lags, and 𝜆 and 𝜌 are the
corresponding scalar parameters, typically referred to as spatial-autoregressive parameters;
• 𝜖 is an n x 1 vector of innovations
The resulting model reduces to a linear regression model with endogenous variables if ρ = 0 and λ =
0 (Drukker et al. 2013). Thus the SARAR model is an augmented form of the linear regression model
that includes an additional right-hand-side variable known as a spatial lag. Following Drukker et al.
(2013), if we let �̅� = 𝑊𝑦, let �̅�𝑖 and 𝑦𝑖 denote the 𝑖th element of �̅� and 𝑦 respectively, and let 𝑤𝑖𝑗
denote the (𝑖, 𝑗)th element of W, then
�̅�𝑖 = ∑ 𝑤𝑖𝑗𝑦𝑗𝑛𝑗=1 . (5)
5. Results and discussion
5.1 Model 1 – Sustained adoption
This probit regression model presents the marginal effects showing the percent change in the
probability of sustained soybean adoption. The farmer characteristics variables of household head,
lead farmer and education were all insignificant in the probit model (Table 4). The lack of
significance makes sense, as the level of household heads, lead farmers and the education level have
limited variability in our sample, thus have limited power explaining yield at the margin for the entire
sample.
Table 4: Estimated probit regression results for sustained soybean adoption Variables Estimate Delta-method standard error
Demographic
Education -0.017 0.034
Household head 0.079 0.066
Lead farmer -0.107 0.066
Economy of scale Farm size .129*** 0.019
Soy hectares planted (2015) .303*** 0.095
Labour Hired labour .150*** 0.054
Market access Dry-season activities -.073* 0.039
Intent to sell grain .207*** 0.041
Land tenure Family or owned land 0.157 0.115
Can farm 3+ years -.133*** 0.038
N 415 LR chi2 236.58 Prob > chi2 0.0000 Pseudo R2 0.4139 % Correctly classified 84.82%
Note: * Significant at the 10% level; ** Significant at the 5% level; *** Significant at the 1% level
The results of the sustained adoption model indicate that each additional hectare comprising a GROW
project farmer’s total farm size is associated with a 12.9 percentage point increase in the likelihood
of that producer being a sustained adopter. Similarly, each additional hectare of land allocated to soy
cultivation by a GROW project farmer is associated with a 30.3 percentage point increase in the
likelihood of that producer being a sustained adopter. These results point to the importance of

AfJARE Vol 14 No 4 December 2019 Onzima et al.
303
economies of scale in the sustained adoption of a long-jump agricultural technology like soybean. As
highlighted previously, new commercial crops like soybean require up-front fixed costs related to
learning new production practices and input utilisation methods, capital investments in mechanisation
for planting and threshing, and in making market linkages for input and service procurement and
grain sales.
Furthermore, producers who use hired labour to produce soybean (independent of the proportion used
in comparison to overall labour) are 15 percentage points more likely to be sustained soybean
adopters. This result may point to the fact that, as women begin to adopt soybean, their independence
and control over labour utilisation may increase, causing a reallocation of labour and a change in the
balance between hired labour and individual/household/community labour. Also, female producers
who engage hired labour for their soybean production may exhibit increased interest, dedication and
commitment to soybean. This may result in higher performance in soybean production and/or
sustained adoption.
Both of the market access variables related to dry-season activities and intention to sell grain are
significant predictors of sustained soybean adoption. Farmers who engage in dry-season activities are
seven percentage points less likely to be a sustained soybean adopters. An explanation for this finding
may be that farmers who engage in these types of activities are less focused on soybean production
than those who do not. Soybean, as a new commercial crop with a steep technical learning curve,
requires farmers to exhibit a higher level of focus and specialisation to learn new agronomic practices,
procure the necessary inputs and services, and make market linkages. Thus, if dry-season activities
do indeed compete for farmer attention, then farmers who engage in these activities may be more
diversified in their farm enterprise, and therefore potentially less focused on soybean production.
Conversely, the variable for intention to sell grain has a significant and positive effect on sustained
soybean adoption. Farmers intending to sell their grain are 21 percentage points more likely to be
engaged in sustained soybean adoption. This result may indicate that farmers who intend to sell their
grain after harvest are better positioned to access input and service markets, as well as buyers,
aggregators and processors. This can lead to more competitive prices for their grain, as well as for
inputs and services, and may influence producers to remain engaged in soybean production and be
sustained adopters. Farmers who exhibit an intention to sell their grain furthermore may recognise
the role of soybean as a commercial crop rather than as a household nutrition crop, and the necessary
market integration and connection that commercial soybean requires. Farmers who approach soybean
cultivation as a commercial activity may also be more committed to sourcing the necessary inputs
and training needed for successful production, leading to sustained adoption.
With respect to land rights, the land tenure variable is positive but not statistically significant. Farmers
with individual or family ownership of their land are 16 percentage points more likely to engage in
sustained adoption of soybean.
The duration of land control variable is negative and significant. Farmers who indicate that the
duration of their land control is at least three years are 13 percentage points less likely to be sustained
soybean adopters. This result is contrary to the hypothesis that farmers with longer durations of land
control would be more likely to achieve higher yields in soybean production through longer-term
investments in land improvement and soil health. Instead, the duration of land control may not be an
appropriate predictor of successful performance in a new technology like soybean. Thus, more work
is needed to understand how the duration of land control affects performance in long-jump
technologies like soybean.

AfJARE Vol 14 No 4 December 2019 Onzima et al.
304
5.2 Model 2 – Soybean yield performance
Similar to the sustained adoption probit model, farmer characteristics of household head and
education were not significant in the yield regression model (Table 5). Again, this finding may be a
result of the low variability of these characteristics among the farmer sample. However, Thompson
(2018) reports that education and serving as head of a household were not good predictors of success
in producing soybean among farmers new to soybean in Nigeria. Thompson (2018) finds a number
of misconceptions with respect to soybean production practices among the extension and
development community as being the cause of this finding.
Table 5: Estimated OLS regression results for 2015 yield Variables Estimate Standard error
Education 28.240 41.484
Household head -25.143 76.545
Lead farmer 150.887* 80.598
Sustained adopter 101.153* 58.910
Intermittent adopter -93.077 80.843
Farm size 73.015*** 27.767
Soy hectares planted (2015) 103.528* 62.549
Hired labour -47.353 64.268
Dry-season activities -132.825*** 45.367
Intent to sell grain 327.842*** 55.515
Family or owned land 121.584 120.022
Can farm 3+ years -156.815*** 51.454
N 453 R-squared 0.286 F-stat (12, 440) 14.66 Prob > F 0.0000
Note: * Significant at the 10% level; ** Significant at the 5% level; *** Significant at the 1% level
While lead farmer status was not a significant predictor of sustained soybean adoption, there is a
significant effect of being a lead farmer on soybean yields. Specifically, lead farmers realised an
additional 151 kilograms per hectare in their 2015 soybean yields. This result may point to the fact
that being a lead farmer does not significantly change a producer’s decision on whether or not to
continue adopting soybean. Drivers related to market connectedness and economies of scale may
instead affect commitment to soybean, as shown in the sustained adoption probit analysis. However,
lead farmers received direct access to extension messaging and guidance, which seems to have a
significant effect on their subsequent soybean yields. This finding is consistent with the logic that, in
the context of long-jump agricultural technologies like soybean, where producers may not be able to
rely on their tacit knowledge, norms and practices to engage in successful cultivation, they benefit
from extension messaging and information channels.
The final farmer characteristic variable is experience in soybean production or, more specifically,
adopter status. Sustained adopters, namely those who produced soybean for three consecutive years,
realised an additional 101 kilograms per hectare in their 2015 soybean yields as compared to
intermittent and late adopters. In contrast, intermittent adopters experienced on average 93 fewer
kilograms per hectare in their 2015 yield compared to sustained adopters and late adopters, although
this result is not statistically significant. These results seem to indicate that soybean performance
improves over time as farmers gather more information, accumulate more resources and become more
experienced in production. Furthermore, this result underlines the negative effect associated with
performance due to a lack of experience of or commitment to soybean production.
The same economy of scale variables found to be significant in the probit regression model were also
significant in the OLS regression, with the exception of hired labour. Specifically, farm size and land

AfJARE Vol 14 No 4 December 2019 Onzima et al.
305
allocation for soy production both had a significant and positive effect on farmer soybean yields,
increasing yields by 73 kilograms per hectare and 104 kilograms per hectare respectively. These
relatively large increases in yield point to the positive benefits of economies of scale, which may
enable farmers to better manage the fixed costs associated with soybean production and realise
increased returns to scale. However, hired labour may not play as critical a role in soybean
performance as it does in soybean adoption.
Market access measures of engagement in dry-season activities, and intention to sell grain, are both
significantly associated with farmer yields. Specifically, farmers who engage in dry-season activities
produce, on average, 133 kilograms per hectare less than farmers who are not engaged in dry-season
activities. Thus, this is consistent with the findings of the probit regression mode. The hypothesis may
hold then that long-jump technologies like soybean require focus and specialisation, and dry-season
activities may compete for farmer attention and result in poorer performance. The implication may
be broader in terms of development policy and commercial technologies like soybean. Policies
advocating crop diversification among smallholders to improve resilience may be less appropriate
when introducing long-jump technology adoption. Such policies stands contrary to business theory
on commercial enterprises, in which specialisation, technical focus and scale economies dominate.
Farmer intention to sell grain has a very strong effect on yield. Farmers who intend to sell their grain
produce, on average, 328 kilograms per hectare more than farmers who do not. Farmers who intend
to sell their grain may maintain a deeper focus on or commitment to soybean. For example, soybean
may not be simply an opportunistic crop, but more successful producers may have better
understanding of both input and grain markets ahead of planting. Lower transaction costs can reduce
uncertainty and allow for greater commitment to the crop in terms of seedbed preparation, input
purchases, and seed care. This result highlights the importance of market connectedness and focus in
determining farmer performance in soybean production.
Similar to the probit model, duration of land control is negatively associated with soybean
performance. Specifically, producers who indicate that the duration of their land control is at least
three years experienced lower yields, in the magnitude of 157 kilograms per hectare. The rationale
behind this finding is unclear and may indicate that there is an unobservable relationship between
land quality and duration of land control that drives this result. Conversely, producers who indicated
that their land is owned either individually or through their family generated an additional 122
kilograms per hectare on average more than producers who lease, borrow or share their land, although
this result was not statistically significant.
5.3 Model 3 – Spatial effects
The spatial lag parameter lambda (λ) measures the extent of spatial interaction on 2015 soybean yields
(Table 6). The lambda value, at 0.644, is both positive and significant at the 1% level. In creating a
minmax-normalised spatial weights matrix, the range of λ falls between -1 and 1. Thus the value of
λ at 0.644 shows a strong effect of spatial interaction on farmer yields. This confirms the hypothesis
that there is positive, large and significant spatial autoregressive dependence in soybean yields. In
other words, the soybean yield of a given farmer strongly affects the soybean yield of neighbouring
farmers.
This finding also highlights the potential role that social multiplier effects may play in farmer
performance in soybean production. Knowledge about new agricultural technologies likely spills over
within spatial networks. The positive and significant λ value in the SARAR model indicates that
farmers are expected to have higher yields if, on average, their neighbours have higher yields.

AfJARE Vol 14 No 4 December 2019 Onzima et al.
306
In terms of the individual independent variables included in the SARAR analysis, the results are for
the most part in line with the OLS regression. However, the interpretation of the coefficients in the
SARAR model differs from the OLS regression. The SARAR model assesses the impact of each
independent variable on average farmer yield, while also controlling for spatial dependence in
soybean yields. Thus, the magnitude of the various coefficients in the SARAR model is affected by
the inclusion of the spatially lagged variable in the model.
Table 6: Estimated SARAR model results for 2015 yield Variables Estimate Standard error
Education 16.253 39.883
Household head -23.462 75.832
Lead farmer 167.543** 79.830
Sustained adopter 125.655** 63.829
Intermittent adopter -89.325 83.184
Farm size 53.807** 27.868
Soy hectares planted (2015) 57.380 61.847
Hired labour -25.272 62.861
Dry-season activities -94.345** 44.638
Intent to sell grain 275.516*** 56.976
Family or owned land 50.458 125.298
Can farm 3+ years -114.177** 57.969
Lambda .644*** 0.258
Rho .947*** 0.200
N 437 Note: * Significant at the 10% level; ** Significant at the 5% level; *** Significant at the 1% level
The presence of a lead farmer and sustained adopter has significant and positive effects on farmer
soybean yields, and at larger magnitudes than in the OLS yield regression model. This finding
indicates that producers who are lead farmers and sustained adopters have, on average, higher yields,
which in turn have a positive effect on the average yields within their spatial network. Further, there
is a positive and significant effect of farm size on yield in the SARAR model, yet the effect is smaller
in magnitude than in the OLS regression. This finding indicates that economies of scale continue to
play a role in successful soybean production when assessing their impact from a spatial perspective,
but may be substituted in part by knowledge spillovers and accumulation over time.
Engagement in dry-season activities has a negative and significant effect on soybean yields when
controlling for spatial dependence, which is consistent with the findings in the OLS model. Farmer
intention to sell grain positively and significantly affects soybean yields in the SARAR model, which
is consistent with the earlier regression results. As noted earlier, farmers who intend to sell their grain
may be better integrated into commercial markets to procure yield-improving inputs, including
fertilisers and high-quality seed, as well as to receive formal technical support services. Finally,
farmers with a longer duration of land control have a significant and negative effect on the soybean
yields of farmers within a spatial network, as seen in the OLS regression.
The estimated ρ value, or the spatial error term, is also strong, significant and positive, with a value
of .947, indicating that observations are related in terms of unmeasured, spatially correlated effects
across farmer networks. As an example, land in a given spatial network may have inherently better
soils or more desirable topographies and slope than land in another spatial network. As a result, the
spatial error term may capture these types of spatially correlated characteristics related to soil, climate
and topography. Furthermore, social institutions, organisational structures and policy changes that
span spatial boundaries can affect farmer performance in agricultural technologies (Ward & Pede
2014). The spatial error term may also capture these effects.
AfJARE Vol 14 No 4 December 2019 Onzima et al.
307
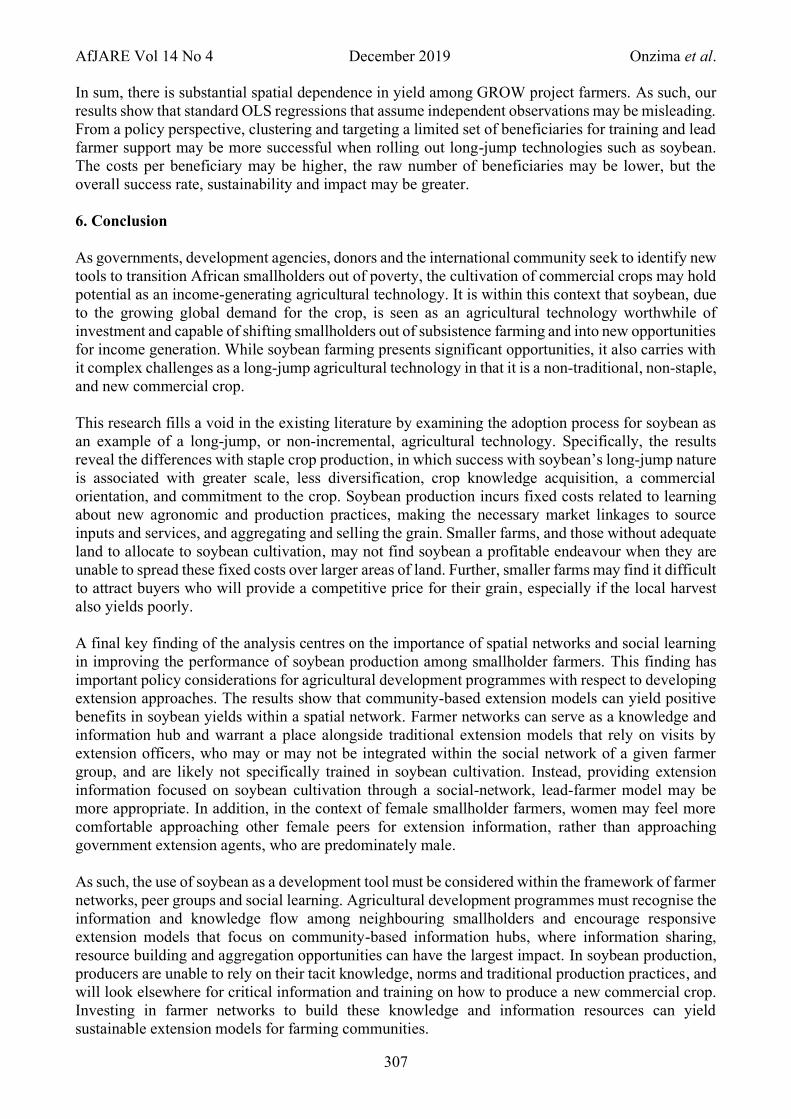
In sum, there is substantial spatial dependence in yield among GROW project farmers. As such, our
results show that standard OLS regressions that assume independent observations may be misleading.
From a policy perspective, clustering and targeting a limited set of beneficiaries for training and lead
farmer support may be more successful when rolling out long-jump technologies such as soybean.
The costs per beneficiary may be higher, the raw number of beneficiaries may be lower, but the
overall success rate, sustainability and impact may be greater.
6. Conclusion
As governments, development agencies, donors and the international community seek to identify new
tools to transition African smallholders out of poverty, the cultivation of commercial crops may hold
potential as an income-generating agricultural technology. It is within this context that soybean, due
to the growing global demand for the crop, is seen as an agricultural technology worthwhile of
investment and capable of shifting smallholders out of subsistence farming and into new opportunities
for income generation. While soybean farming presents significant opportunities, it also carries with
it complex challenges as a long-jump agricultural technology in that it is a non-traditional, non-staple,
and new commercial crop.
This research fills a void in the existing literature by examining the adoption process for soybean as
an example of a long-jump, or non-incremental, agricultural technology. Specifically, the results
reveal the differences with staple crop production, in which success with soybean’s long-jump nature
is associated with greater scale, less diversification, crop knowledge acquisition, a commercial
orientation, and commitment to the crop. Soybean production incurs fixed costs related to learning
about new agronomic and production practices, making the necessary market linkages to source
inputs and services, and aggregating and selling the grain. Smaller farms, and those without adequate
land to allocate to soybean cultivation, may not find soybean a profitable endeavour when they are
unable to spread these fixed costs over larger areas of land. Further, smaller farms may find it difficult
to attract buyers who will provide a competitive price for their grain, especially if the local harvest
also yields poorly.
A final key finding of the analysis centres on the importance of spatial networks and social learning
in improving the performance of soybean production among smallholder farmers. This finding has
important policy considerations for agricultural development programmes with respect to developing
extension approaches. The results show that community-based extension models can yield positive
benefits in soybean yields within a spatial network. Farmer networks can serve as a knowledge and
information hub and warrant a place alongside traditional extension models that rely on visits by
extension officers, who may or may not be integrated within the social network of a given farmer
group, and are likely not specifically trained in soybean cultivation. Instead, providing extension
information focused on soybean cultivation through a social-network, lead-farmer model may be
more appropriate. In addition, in the context of female smallholder farmers, women may feel more
comfortable approaching other female peers for extension information, rather than approaching
government extension agents, who are predominately male.
As such, the use of soybean as a development tool must be considered within the framework of farmer
networks, peer groups and social learning. Agricultural development programmes must recognise the
information and knowledge flow among neighbouring smallholders and encourage responsive
extension models that focus on community-based information hubs, where information sharing,
resource building and aggregation opportunities can have the largest impact. In soybean production,
producers are unable to rely on their tacit knowledge, norms and traditional production practices, and
will look elsewhere for critical information and training on how to produce a new commercial crop.
Investing in farmer networks to build these knowledge and information resources can yield
sustainable extension models for farming communities.

AfJARE Vol 14 No 4 December 2019 Onzima et al.
308
References
Adesina AA & Zinnah MM, 1993. Technology characteristics, farmers’ perceptions and adoption
decisions: A tobit model application in Sierra Leone. Agricultural Economics 9(4): 297–311.
Ainembabazi JH & Mugisha J, 2014. The role of farming experience on the adoption of agricultural
technologies: Evidence from smallholder farmers in Uganda. Journal of Development Studies,
50(5): 666–79.
Alene AD & Manyong VM, 2006. Farmer‐to‐farmer technology diffusion and yield variation among
adopters: The case of improved cowpea in northern Nigeria. Agricultural Economics 35(2): 203–
11.
Awuni G & Reynolds D, 2018. 2017 SMART Farm Report – Ghana. Feed the Future Innovation Lab
for Soybean Value Chain Research (Soybean Innovation Lab, SIL), Urbana IL, USA.
Besley T & Case A, 1993. Modeling technology adoption in developing countries. The American
Economic Review 83(2): 396–402.
Chirwa EW, 2005. Adoption of fertiliser and hybrid seeds by smallholder maize farmers in Southern
Malawi. Development Southern Africa 22(1): 1–12.
Chun MW, 2013. An exploration of gender differences in the use of social networking and knowledge
management tools. Journal of Information Technology Management, 24(2): 20–31.
Conley TG & Udry CR, 2010. Learning about a new technology: Pineapple in Ghana. The American
Economic Review 100(1): 35–69.
Damania R, Berg C, Russ J, Barra AF, Nash J & Ali R, 2017. Agricultural technology choice and
transport. American Journal of Agricultural Economics 99(1): 265–84.
Dogbe W, Etwire PM, Martey E, Etwire, J. C., Baba, I. I., & Siise, A. (2013). Economics of soybean
production: Evidence from Saboba and Chereponi districts of Northern region of Ghana. Journal
of Agricultural Science 5(12): 38–46.
Doss CR, 2006. Analyzing technology adoption using microstudies: Limitations, challenges, and
opportunities for improvement. Agricultural Economics 34(3): 207–19.
Drukker DM, Peng H, Prucha IR & Raciborski R, 2013. Creating and managing spatial-weighting
matrices with the spmat command. Stata Journal 13(2): 242–86.
Edirisinghe JC & Holloway GJ, 2015. Crossbred cow adoption and its correlates: Countable adoption
specification search in Sri Lanka's small holder dairy sector. Agricultural Economics 46(S1): 13–
28.
Etwire PM, Martey E & Dogbe W, 2013. Technical efficiency of soybean farms and its determinants
in Saboba and Chereponi Districts of Northern Ghana: A stochastic frontier approach. Sustainable
Agriculture Research 2(4), 106–16.
Euler M, Krishna V, Schwarze S, Siregar H & Qaim M, 2017. Oil palm adoption, household welfare,
and nutrition among smallholder farmers in Indonesia. World Development 93: 219–35.
Feder G, Just RE & Zilberman D, 1985. Adoption of agricultural innovations in developing countries:
A survey. Economic Development and Cultural Change 33(2): 255–98.
Fontanari JF, 2015. Exploring NK fitness landscapes using imitative learning. The European Physical
Journal B 88(10), 251. https://doi.org/10.1140/epjb/e2015-60608-1
Goldsmith PD & Gow H, 2005. Strategic positioning under agricultural structural change: A critique
of long jump co-operative ventures. International Food and Agribusiness Management Review
8(2): 1–21.
Goldsmith PD, 2014. The economics of tropical soybean. Paper presented at the Feed the Future
Innovation Lab for Soybean Value Chain Research Tropical Soybean in Development Workshop,
Washington DC. Available at
http://soybeaninnovationlab.illinois.edu/sites/soybeaninnovationlab.illinois.edu/files/Peter%20G
oldsmith.pdf (Accessed 17 May 2017).
Goldsmith PD, 2017. The Faustian bargain of commercial crop agriculture in Africa. Tropical
Conservation Science 10: 1–4.

AfJARE Vol 14 No 4 December 2019 Onzima et al.
309
Goldsmith PD & Montesdeoca K, 2018. The productivity of tropical grain production. The
International Journal of Agricultural Management 6(3–4): 90–9.
Herath PHMU & Takeya H, 2003. Factors determining intercropping by rubber smallholders in Sri
Lanka: A logit analysis. Agricultural Economics 29(2): 159–68.
Immink MD & Alarcon JA, 1993. Household income, food availability, and commercial crop
production by smallholder farmers in the western highlands of Guatemala. Economic
Development and Cultural Change 41(2): 319–42.
Kauffman S & Levin S, 1987. Towards a general theory of adaptive walks on rugged landscapes.
Journal of Theoretical Biology 128(1): 11–45.
Levinthal DA, 1997. Adaptation on rugged landscapes. Management Science 43(7): 934–50.
Maertens A & Barrett CB, 2013. Measuring social networks’ effects on agricultural technology
adoption. American Journal of Agricultural Economics 95(2): 353–9.
Mbanya W, 2011. Assessment of the constraints in soybean production: A case of Northern Region,
Ghana. Journal of Developments in Sustainable Agriculture 6(2): 199–214.
Muhammed AR & Baker J, 2015. Greater Rural Opportunities for Women (GROW) Project, Ghana
Annual Survey Report 2015. Mennonite Economic Development Associates (MEDA): Waterloo
ON, Canada.
Muzari W, Gatsi W & Muvhunzi S, 2012. The impacts of technology adoption on smallholder
agricultural productivity in Sub-Saharan Africa: A review. Journal of Sustainable Development
5(8): 69–77.
Ragsdale K, Read-Wahidi MR, Wei T, Martey E & Goldsmith PD, 2018. Using the WEAI+ to explore
gender equity among smallholder farmers: Baseline evidence from Ghana’s Northern Region.
Journal of Rural Studies 64: 123–34. https://doi.org/10.1016/j.jrurstud.2018.09.013
Ruhl JB, 1996. The fitness of law: Using complexity theory to describe the evolution of law and
society and its practical meaning for democracy. Vanderbilt Law Review 49: 1406–90.
Sanginga PA, Adesina AA, Manyong VM, Ottie O & Dashiell KE, 1999. Social impact of soybean
in Nigeria’s southern Guinea savanna. Ibadan, Nigeria: International Institute of Tropical
Agriculture.
Shannon DA & Kalala MM, 1994. Adoption of soybean in sub-Saharan Africa: A comparative
analysis of production and utilization in Zaire and Nigeria. Agricultural Systems 46(4): 369–84.
Spulber DF, 2012. Tacit knowledge with innovative entrepreneurship. International Journal of
Industrial Organization 30(6): 641–53.
Staal SJ, Baltenweck I, Waithaka MM, DeWolff T & Njoroge L, 2002. Location and uptake:
Integrated household and GIS analysis of technology adoption and land use, with application to
smallholder dairy farms in Kenya. Agricultural Economics 27(3): 295–315.
Thompson D, 2018. Nigeria Trip Report, MRA-10 “Seed Systems”. Feed the Future Innovation Lab
for Soybean Value Chain Research (Soybean Innovation Lab, SIL), Urbana IL, USA.
Villano R, Fleming E & Moss J, 2016. Spatial econometric analysis: Potential contribution to the
economic analysis of smallholder development. In Huynh V-N, Kreinovich V & Sriboonchitta S
(eds.), Causal inference in econometrics (pp. 29-55). Cham: Springer International Publishing.
Ward PS & Pede VO, 2014. Capturing social network effects in technology adoption: The spatial
diffusion of hybrid rice in Bangladesh. Australian Journal of Agricultural and Resource Economics
59(2): 225–41.
Ward PS, Ortega DL, Spielman DJ & Singh V, 2014. Heterogeneous demand for drought-tolerant
rice: Evidence from Bihar, India. World Development 64: 125–39.
Wendland KJ & Sills EO, 2008. Dissemination of food crops with nutritional benefits: Adoption and
disadoption of soybeans in Togo and Benin. Natural Resources Forum 32(1): 39–52.
Wollni M & Andersson C, 2014. Spatial patterns of organic agriculture adoption: Evidence from
Honduras. Ecological Economics 97: 120–8.