
Determinants of Purebred Beef Bull Price Differentials of Purebred Beef Bull Price Differentials...
15
Journal of Agricultural and Resource Economics 21(2):396-410 Copyright 1996 Western Agricultural Economics Association Determinants of Purebred Beef Bull Price Differentials Kevin C. Dhuyvetter, Ted C. Schroeder, Danny D. Simms, Ronald P. Bolze Jr., and Jeremy Geske Bulls are an important investment for commercial beef cattle producers since, over time, bulls introduce most of the new genetic attributes into typical beef cow herds. Therefore, heritable bull traits determine bull prices. Bulls possess a large number of traits to consider in pricing. In recent years, new measures of bull qualities have been introduced in the form of expected progeny differences (EPDs). This study estimates market values associated with specific bull attributes, recently introduced EPDs, and bull sale marketing efforts. Important bull price determinants include bull color, polled, conformation, muscling, disposition, age, birth weight, weaning weight, milk EPD, birth and weaning weight EPDs, sale location, order bull was sold, whether the bull had a picture in the sale catalog, and whether a percentage of semen rights were retained by the seller. Key words: bull marketing, bull prices, hedonic models Introduction Bulls have a major impact on economic returns for commercial beef cattle producers. The value of a bull is determined by its expected value in production. Bulls represent 50% of the genetic makeup of any year's calf crop and, for producers who retain their own heifers, 90% of cowherd genetic change (Wagner et al.). Differences in heritable traits of beef bulls determine bull market price differentials. The objective of this research is to identify determinants of beef bull prices and to estimate the marginal contribution of various bull traits to the overall value of a bull. Bull sellers and buyers need this information to make efficient production and marketing decisions. Bull value is related to the length of time a bull is used. A U.S. Department of Agriculture (USDA) study found bull's age and factors related to age (size and number of offspring in herd) were ranked lower than physical factors (infertility, lameness, dis- ease, and temperament) when making bull culling decisions. Offspring performance was ranked lower than bull physical factors but higher than age. This indicates producers consider a bull to be a relatively long-term investment provided the bull remains phys- ically sound. Clary, Jordan, and Thompson concluded that the length of time a producer plans to keep a bull was an important determinant of its value. Therefore, producers should make informed decisions when purchasing bulls since substantial financial and The authors are, respectively, extension agricultural economist and professor, Department of Agricultural Economics; pro- fessor, extension animal scientist and former graduate student Department of Animal Sciences and Industry, Kansas State University. Helpful comments of James Mintert, James Sartwelle III, JARE Editor B. Wade Brorsen, and three anonymous reviewers are gratefully acknowledged. Contribution No. 97-1-J from the Kansas Agricultural Experiment Station.
Transcript of Determinants of Purebred Beef Bull Price Differentials of Purebred Beef Bull Price Differentials...

Journal of Agricultural and Resource Economics 21(2):396-410Copyright 1996 Western Agricultural Economics Association
Determinants of Purebred Beef BullPrice Differentials
Kevin C. Dhuyvetter, Ted C. Schroeder, Danny D. Simms,Ronald P. Bolze Jr., and Jeremy Geske
Bulls are an important investment for commercial beef cattle producers since, overtime, bulls introduce most of the new genetic attributes into typical beef cow herds.Therefore, heritable bull traits determine bull prices. Bulls possess a large number oftraits to consider in pricing. In recent years, new measures of bull qualities have beenintroduced in the form of expected progeny differences (EPDs). This study estimatesmarket values associated with specific bull attributes, recently introduced EPDs, andbull sale marketing efforts. Important bull price determinants include bull color,polled, conformation, muscling, disposition, age, birth weight, weaning weight, milkEPD, birth and weaning weight EPDs, sale location, order bull was sold, whetherthe bull had a picture in the sale catalog, and whether a percentage of semen rightswere retained by the seller.
Key words: bull marketing, bull prices, hedonic models
Introduction
Bulls have a major impact on economic returns for commercial beef cattle producers.The value of a bull is determined by its expected value in production. Bulls represent
50% of the genetic makeup of any year's calf crop and, for producers who retain theirown heifers, 90% of cowherd genetic change (Wagner et al.). Differences in heritabletraits of beef bulls determine bull market price differentials. The objective of this researchis to identify determinants of beef bull prices and to estimate the marginal contributionof various bull traits to the overall value of a bull. Bull sellers and buyers need thisinformation to make efficient production and marketing decisions.
Bull value is related to the length of time a bull is used. A U.S. Department ofAgriculture (USDA) study found bull's age and factors related to age (size and numberof offspring in herd) were ranked lower than physical factors (infertility, lameness, dis-ease, and temperament) when making bull culling decisions. Offspring performance wasranked lower than bull physical factors but higher than age. This indicates producersconsider a bull to be a relatively long-term investment provided the bull remains phys-ically sound. Clary, Jordan, and Thompson concluded that the length of time a producerplans to keep a bull was an important determinant of its value. Therefore, producersshould make informed decisions when purchasing bulls since substantial financial and
The authors are, respectively, extension agricultural economist and professor, Department of Agricultural Economics; pro-fessor, extension animal scientist and former graduate student Department of Animal Sciences and Industry, Kansas StateUniversity.
Helpful comments of James Mintert, James Sartwelle III, JARE Editor B. Wade Brorsen, and three anonymous reviewersare gratefully acknowledged. Contribution No. 97-1-J from the Kansas Agricultural Experiment Station.

Purebred Beef Bull Price Differentials 397
genetic risks are associated with buying poor quality bulls. Producers need to factor thevalue of physical and genetic characteristics of bulls into their pricing decisions.
Purebred breeders, as the principal bull suppliers, need to recognize the value of phys-ical and genetic characteristics affecting bull prices so they can make economical deci-sions regarding the type of bulls they produce and offer for sale. Because genetic changestake time to make, purebred breeders must be cognizant of bull demand or risk losingtheir market. Additionally, purebred bull producer reputation is critical and has a signif-icant impact on bull prices (Commer, Couvillion, and Herndon). Reputation of sellersmay be important for instilling trust in information provided by sellers, customer service,business integrity, and known bull quality. Significance of seller reputation affecting bullprices indicates that physical and genetic characteristics of bulls alone do not provideadequate information to buyers.
Historically, commercial cattle producers have selected bulls predominantly based onvisual appraisal (Corah, Simms, and Zoellner). Visual selection does not necessarilyindicate genetic or performance potential of a bull's progeny. Factors affecting bull pur-chasing decisions include structural soundness, conformation, appearance, breed, tem-perament, price, prireputation of breeder, weaning/yearling weight, birth weight, hip height/frame score, calving ease, and expected progeny differences (USDA; Simms, Geske, andBolze). Surveys have identified factors producers consider when purchasing bulls, butthey provide little information about relative economic importance of individual factors.Quantifying values of specific bull characteristics is integral to determining the economicimportance of these factors.
Numerous studies have examined price determinants and demand for cattle character-istics across various segments of the beef industry. Parcell, Schroeder, and Hiner esti-mated hedonic price models for cow-calf pairs. Mintert et al. analyzed price differentialsof cull cows. Many studies have investigated factors affecting feeder cattle prices (e.g.,Bailey, Peterson, and Brorsen; Bailey and Peterson; Faminow and Gum; Sartwelle et al.;Schroeder et al.; Sullivan and Linton; Turner, Dykes, and McKissick; Turner, McKissick,and Dykes). Jones et al. and Ward examined factors affecting prices of fed cattle.
Few studies have examined factors affecting beef bull prices. Greer and Urick foundover time that bull prices were responsive to calf price and cowherd inventory. Kerrfound calf weaning weight, average daily gain, and calving difficulty significantly af-fected prices for bulls sold in auctions. He concluded that commercial cattle producersincorporated genetic potential of bulls into prices paid. Commer, Couvillion, and Herndonfound performance characteristics, yearling weight ratio, frame score, and sale promotionprograms were significant factors explaining sale prices of performance tested bulls.Clary, Jordan, and Thompson concluded that the genetic quality of a bull, as measuredby gain in average weaning weight, had a large positive impact on the marginal bidprice.
These studies provide insights about factors affecting bull prices; however, none con-sidered expected progeny differences. EPDs predict how future progeny of a bull willperform for various traits. They are generally expressed in terms of pounds above orbelow the breed average. For example, a bull with a birth weight EPD of -3.5 wouldbe expected to sire calves 3.5 pounds lighter at birth than the average bull of that breed.Schalles and Zoellner argued EPDs provide superior production information comparedwith other measures. EPDs for growth (weaning and yearling weights) are positivelyrelated to actual growth (Arnold et al.; Kemp and Sullivan; Mahrt et al.; Mallinckrodt
Dhuyvetter et al.

Journal of Agricultural and Resource Economics
et al.; Nunez-Dominguez, Van Vleck, and Cundiff). A positive relationship also existsbetween milk production EPDs and progeny milk production (Diaz, Notter, and Beal;Mallinckrodt et al.; Marshall and Long; Marston et al.).
Although the performance predictability of EPDs has been well documented, Greenet al. concluded many cow-calf producers have limited knowledge of this concept basedon a 1990 survey of beef producers in southwestern U.S. This is confirmed by surveyswhere producers identified EPDs as factors affecting bull purchasing decisions but listedthem as less important than many other factors (USDA; Simms, Geske, and Bolze).
Pricing Model
The derived demand for bulls is a function of both expected calf prices and productivecapabilities. At a point in time, the expected calf price is constant; therefore, bull priceis a function of the bull's productive characteristics. Assuming bull buyers maximizeprofit and short-run bull supply is inelastic, the value of a bull is determined by demandfor individual traits the bull possesses. Following Ladd and Martin, the price (ri) of abull can be specified as (see Jones et al.; Parcell, Schroeder, and Hiner; Schroeder et al.for further development of this model):
(1) ri = E Tjxji,j
where i refers to a particular bull; j refers to physical, genetic, and performance char-acteristics of the bull; Tj is the marginal implicit price paid for the jth characteristic; xjiis the quantity of characteristic j the bull possesses. Given price and characteristic data,the marginal implicit prices can be estimated using regression.
Bull characteristics are split into two categories: physical and genetic characteristicsand expected performance characteristics. Expected performance characteristics refer toprogeny performance, and physical and genetic characteristics refer to the bull's owntraits. Adding marketing factors to (1), bull price can be specified as:
(2) Bull Price, = f(Physical and Genetic Characteristicsi,
Expected Performance Characteristicsi, Marketing Factors/).
Specific variables included in the model and their expected signs are presented in table 1.Physical and genetic characteristics important to bull price include factors affecting
expected useful life of the bull. Age and bull price are expected to be nonlinearly related.Young bulls, with lower serving capacity, likely have lower values. Older bulls, not soldpreviously suggesting possible problems, are also expected to have lower values. Otherphysical and genetic traits include factors indicating soundness of the bull that may beheritable such as structural correctness, conformation, disposition, and muscling. Theseattributes are expected to be positively associated with price. Whether the bull is blackand whether the bull is polled are included in the physical traits. Black bulls are expectedto bring premiums because of buyer perceptions of higher marbling associated withAngus-type cattle. Polled bulls are preferred to hored bulls because of difficulty han-dling horned cattle and price discounts for feeder calves with horns (Sartwelle et al.;Schroeder et al.). Breed is included in genetic characteristics as buyers differentiate be-tween breeds. No specific premium or discount by breed is expected a priori.
398 December 1996

Purebred Beef Bull Price Differentials 399
Table 1. Definitions of Variables Used to Explain the Logarithm of Bull Sales Price
ExpectedVariable Definition Sign
Physical and genetic characteristicsBREEDj Breed binary variables = 1 if bull is that breed; otherwise = 0 ?
j = SIMMENTAL (default), ANGUS, CHAROLAIS, HEREFORD,RED ANGUS, GELBVIEH, or LIMOUSIN
BLACKj Color binary variable = 1 if bull of breed j is black; otherwise = 0 +j = SIMMENTAL, GELBVIEH, or LIMOUSIN
POLLED Polled binary variable = 1 if bull is polled; otherwise = 0 +CONF Conformation score of 1, 2, ... , 5 (1 = poorest to 5 = best) +MUSCLE Muscling score of 1, 2, ... , 5 (1 = poorest to 5 = best) +CORRECT Structural correctness score of 1, 2, ... , 5 (1 = poorest to 5 = best) +DISP Disposition score of 1, 2 ... , 5 (1 = poorest to 5 = best) +AGE Age of bull in days +AGESQ Age of bull in days squared
Performance characteristicsaBIRTHi Birth weight of bull of breed i, if bull not breed i, = 0ADJWWi Adjusted weaning weight of bull of breed i, if bull not breed i, = 0 +
all weaning weights are adjusted to 205 days of ageBWEPDi Expected progeny difference for birth weight of bull of breed i, if bull -
not breed i, = 0WWEPDi Expected progeny difference for weaning weight of bull of breed i, if +
bull not breed i, = 0MILKEPDi Expected progeny difference for milk of bull of breed i, if bull not +
breed i, = 0
Marketing factorsSALEk Sale binary variables = 1 if bull sold at sale k; otherwise = 0 ?ORDER Order bull was sold in sale times percent order bull was soldORDERSQ Order variable squared +PICTURE Picture binary variable = 1 if bull was pictured in catalog; otherwise +
=0PICTORD Picture variable times percent order bull was soldRETAIN Proportion of semen rights retained +RETPCT Percent of bulls in sale having semen rights retained for bulls that
have semen rights retained; otherwise = 0
aThe i refers to breed, where i = 1 Simmental, 2 Angus, 3 Charolais, 4 Hereford, 5 Red Angus, 6Gelbvieh, 7 Limousin.
Expected performance characteristics indicate production potential of a bull's off-spring. Birth weight is examined as actual weight and as an EPD measure. Both arerelated to birth weight of the bull's offspring, with generally lighter being preferred toheavier birth weights. Weaning weight (adjusted to the same number of days) and itsassociated EPD are measures of growth rate of the bull's offspring and are expected tobe positively associated with price. Milk EPD measures expected milk production ofprogeny with a larger EPD value preferred. To determine the importance of the recentlyadopted EPD measures on bull prices, two models are estimated, one containing weightswithout EPDs (Model 1) and the other including weights and EPDs (Model 2). Com-parison of the estimates from these models show how much additional information EPDsprovide.
Dhuyvetter et al.
Journal of Agricultural and Resource Economics
Bull sellers use various marketing techniques to promote specific bulls. Marketingfactors expected to influence price include the order in which the bull sold. Previousstudies have found that price declined in cattle auctions as sales progressed (Mintert et
al.; Sartwelle et al.; Schroeder et al.; Turner, Dykes and McKissick) or that sale orderhad no statistically significant effect on price (Parcell, Schroeder and Hiner; Turner,
Dykes and McKissick). One study found that prices increased during the sale (Bailey,Brorsen, and Thompson). Sellers typically place their highest quality bulls at the begin-ning of sales.1 If bull characteristics are captured in the model, order sold would not be
expected to influence bull prices unless buyers' bidding behavior is related to time ofsale. Therefore, sale order-price effects reflect either bidder behavior or changing bull
quality attributes not contained in other variables. To allow for a sale order effect, an
order sold variable was included in the model. Order was allowed to be nonlinear by
including squared sale order. Binary variables for each sale were included in the model
to account for differences across sellers.Sellers promote bulls by including pictures of individual bulls in the sale catalog.
Because of the printing expense and expected return from a picture, only a few picturesare usually displayed in the catalog. If the seller incurs the expense of placing a picturein the catalog, presumably the seller is featuring the bull. Therefore, bulls with a picturein the catalog are expected to receive higher prices. To capture this effect, bulls withpictures are assigned a binary variable equal to 1. Some sellers place pictures of bullsrandomly throughout the catalog, suggesting they are not using the picture to feature anearly selling, higher quality bull. To capture this effect, an interaction of the picturedummy variable multiplied by the percentile order sold was included. The expected signof this variable is negative indicating the value of a picture for bulls sold late in the saleis worth less than the value of a picture for bulls sold early in the sale.
Sellers occasionally retain a portion of semen rights on several bulls with the portion
indicated in the catalog.2 This may be a marketing technique to draw buyer attention tothe bull, or it may reflect an expectation by the seller regarding future value of the bull's
semen. Semen retention is expected to be positively associated with price. If a seller
retains semen rights on a large percentage of bulls, this suggests the seller is retaining
without consideration of special quality attributes, and the perceived value of retaining
to the buyer is expected to be smaller. To capture this effect, the percentage of bulls in
a sale for which semen rights were retained was included. The expected sign of this
variable is negative.
Data
Sale price, physical characteristics, genetic information, and marketing factors were col-
lected on individual animals from 26 purebred beef bull sales in Kansas during spring
1993. The data included 1,700 bulls representing seven beef breeds. Because of incom-
plete data only 1,650 observations were used. Breeds and percentages of bull sales on
' Analysis of the bull sales data used here confirmed that bull quality generally was lower at most sales the later in thesale the bull was ordered.
2 Retention of semen rights means the buyer has full use of the bull with the buyer's cattle but must share revenue withthe seller on any commercial semen sales.
400 December 1996
Purebred Beef Bull Price Differentials 401
Table 2. Summary Statistics of Selected Purebred Kansas Bull Sales Data, 1993
Variable Mean SD Minimum Maximum
Bull sale price ($/head) 2,306.1 1,272.9 650 20,000Birth weight (lbs.) 85.3 11.4 40.0 128.0Adjusted wean weight (lbs.) 651.7 77.0 444.0 961.0Conformation 3.27 0.56 1.00 5.00Muscling 3.25 0.68 1.00 5.00Correctness 3.40 0.59 1.00 5.00Disposition 3.26 0.69 1.00 5.00Age (days) 449 118 298 1,136Picture 0.077 0.267 0.00 1.00Retain 0.006 0.049 0.00 0.67
Distribution of Bull Sale Prices ($/head) ----------- (%) -------------Less than or equal to 1,000 4.71,000-2,500 64.12,501-3,500 21.43,501-5,000 8.15,001-10,000 1.6Greater than 10,000 0.2
which data were collected were Angus (46.5%), Charolais (12.4%), Gelbvieh (14.3%),Hereford (7.5%), Limousin (3.6%), Red Angus (4.4%), and Simmental (11.3%).
Individual bulls were evaluated at the time of sale and assigned a rank of 1 (poor) to5 (excellent) with respect to conformation, muscling, correctness, and disposition.3 Otherinformation recorded at the time of sale were order sold, breed, lot, polled, color, age,and price. Sale catalogs containing physical and genetic information for each bull wereobtained from each sale. Physical and genetic characteristics recorded were actual birthweight, birth weight EPD, adjusted weaning weight, weaning weight EPD, and milkEPD. Other information taken from the sale catalogs on individual bulls was retentionof semen and whether the bull was pictured in the catalog.
Summary statistics of selected data are provided in table 2. The average price paidwas $2,306.10 per head. Prices ranged from $650 to $20,000 per head with 93.6% ofthe prices in the $1,001 to $5,000 range. Average birth weight was 85 lbs. and averageadjusted weaning weight was 652 lbs. The bulls averaged 449 days old with a range of298 to 1,136 days. Approximately 8% of the bulls had a picture in a sale catalog. Roughly1% of bulls had at least some proportion of semen rights retained by the seller.
Results and Discussion
Parameter estimates of Models 1 (excluding EPDs) and 2 (including EPDs) are reportedin table 3. The models were initially estimated using ordinary least squares (OLS) re-gression with both actual prices and logarithmic transformed prices. A likelihood ratiotest indicated rejection of the linear model in favor of the log model at the 0.05 level.Therefore, the reported models explain the logarithm of bull prices. Collinearity tests
3 Data collection and bull evaluations were conducted in a systematic manner by Kansas State University animal scientists.
Dhuyvetter et al.

Journal of Agricultural and Resource Economics
Table 3. Parameter Estimates of Kansas Purebred Bull Sale Price Determinants, 1993
Model 1 Model 2
Parameter t-Sta- Parameter t-Sta-Variable Estimate tistic Estimate tistic
Intercept
Physical and genetic characteristicsBREED (default = SIMMENTAL)
ANGUSCHAROLAISHEREFORDRED ANGUSGELBVIEHLIMOUSIN
BLACK SIMMENTALBLACK GELBVIEHBLACK LIMOUSINPOLLEDCONFMUSCLECORRECTDISPAGEAGESQ
Performance characteristicsBIRTH1 - SimmentalADJWW1BIRTH2 - AngusADJWW2BIRTH3 - CharolaisADJWW3BIRTH4 - HerefordADJWW4BIRTHS - Red AngusADJWW5BIRTH6 GelbviehADJWW6BIRTH7 LimousinADJWW7
5.9080**
0.73530*0.61126
-0.731430.447940.531640.194550.49535**0.12343*0.29653**0.10153**7.94E-02**2.76E-02*2.91E-023.27E-02**1.57E-03**
-1.08E-06*
-7.63E-03**1.41E-03**
-9.53E-03**1.57E-03**
-9.25E-03**1.54E-03**
-3.12E-032.74E-03**
-6.09E-031.39E-03*
-6.25E-03**1.50E-03**
-8.86E-045.75E-04
14.16
1.821.23
-1.030.681.130.287.711.862.123.304.271.951.602.362.38
-1.85
-2.903.47
-6.816.54
-3.583.83
-0.513.53
-1.211.66
-2.614.23
-0.180.77
5.9670**
0.391960.76802
-0.830390.335840.344040.336920.53109**0.15299**0.39854**0.10457**6.96E-02**3.26E-02**2.83E-022.47E-02*1.19E-03*
-7.33E-07
-5.40E-039.44E-04**
-3.84E-03**1.18E-03**
-7.65E-03**1.18E-03**
-4.18E-042.21E-03**
-8.03E-031.43E-03
-2.66E-031.41E-03**2.79E-03
-3.63E-04
Expected progeny differencesBWEPD1 1WWEPD1 SimmentalMILKEPD1 -BWEPD2WWEPD2 AngusMILKEPD2-BWEPD3WWEPD3 CharolaisMILKEPD3 -BWEPD4WWEPD4 HerefordMILKEPD4 -
-4.37E-02**1.43E-02**2.77E-02**
-4.43E-02**7.96E-03**7.63E-03**
-1.11E-024.51E-036.13E-03
-2.58E-021.23E-02*
-3.28E-03
13.39
0.891.38
-0.940.440.700.468.552.312.713.433.892.381.621.841.85
-1.29
-1.632.32
-1.994.44
-2.112.82
-0.052.56
-0.941.61
-0.954.090.44
-0.45
-1.983.233.87
-4.202.922.45
-0.631.511.54
-0.701.93
-0.48
402 December 1996

Purebred Beef Bull Price Differentials 403
Table 3. Continued
Model 1 Model 2
Parameter t-Sta- Parameter t-Sta-Variable Estimate tistic Estimate tistic
BWEPD5 1.11E-02 0.27WWEPD5 Red Angus 5.83E-03 1.00MILKEPD5 2.40E-02** 2.19BWEPD6 -4.62E-02** -2.65WWEPD6 Gelbvieh 1.01E-02** 2.53MILKEPD6 9.45E-03 1.35BWEPD7 -2.71E-02 -0.52WWEPD7 Limousin 3.34E-02** 2.28MILKEPD7 - 5.70E-03 -0.36
Marketing factorsSALE1 -0.31587** -4.39 -0.23282** -3.16SALE2 -0.28983** -4.61 -0.22239** -3.41SALE3 -0.32426** -4.95 -0.28611** -4.33SALE4 -0.29457** -4.42 -0.30504** -4.78SALE5 -0.34139** -5.01 -0.38230** -5.65SALE6 0.46318** 7.76 0.44744** 6.80SALE7 -0.15986** -2.20 -0.13612* -1.93SALE8 -0.10061 -1.56 -0.01181 -0.18SALE9 -0.54797** -7.32 -0.38351** -4.82SALE10 -0.13048** -2.18 -0.06475 -1.00SALE11 -0.42547** -6.01 -0.33051** -4.55SALE12 -0.38674** -4.31 -0.41765** -4.65SALE13 0.05069 0.25 -0.01072 -0.05SALE14 -0.66795** -6.20 -0.72566** -6.95SALE15 -0.19956** -2.61 -0.13786* -1.82SALE16 -0.65109** -6.42 -0.56933** -5.53SALE 7 -0.79756** -4.86 -0.81442** -4.85SALE18 -0.60004** -4.81 -0.46641** -3.40SALE19 0.25241** 3.64 0.18955** 2.68SALE20 -0.10312 -1.03 -0.16323* -1.65SALE21 -0.56577** -6.13 -0.53114** -5.94SALE22 -0.44269** -7.99 -0.51371** -8.75ORDER -5.75E-05** -6.74 -5.59E-05** -6.78ORDERSQ 1.68E-09** 2.17 1.78E-09** 2.39PICTURE 2.78E-01** 5.23 2.65E-01** 5.18PICTORD -2.20E-03 -1.53 -2.16E-03 -1.56RETAIN 1.99260** 3.25 1.87450** 3.15RETPCT -4.17910* -1.77 -4.47680* -1.92....................................................................................................................................
R2 0.699 0.726RMSE 0.061 0.057Observations 1,650 1,650
Note: Two asterisks and one asterisk denote coefficients which are significantly different from zero atthe 0.05 and 0.10 levels, respectively.
Dhuyvetter et al.

Journal of Agricultural and Resource Economics
were conducted on the residuals and the only possibly degrading collinearity (Belsley,Kuh, and Welsch) detected was amongst the binary breed variables and the intercept.Since emphasis is on value of characteristics and not differentials associated with breeds,this was not a concern.
Residuals were tested for normality using the Jarque-Bera test (Jarque and Bera).Normality of the residuals of Models 1 and 2 was rejected at standard statistical levels.The normality rejection was primarily because of kurtosis. Several especially high-pricedbulls received prices higher than the models predicted. Examination of these bulls in-dicated they were often sold early in the sales, usually within the first ten bulls. Attemptsto explain these higher than expected prices with sums of several attributes to create acomposite character of the bulls did not improve the models. To account for this non-normality the models were reestimated using the multivariate-t-errors robust estimationmethod in SHAZAM using 3 degrees of freedom and assuming independent residuals(Judge et al.; Zellner). As the degrees of freedom value increases, the multivariate-testimation approaches OLS with standard normality assumptions (a t-distribution withinfinite degrees of freedom is a normal distribution). Smaller degrees of freedom placeless restrictions on the distribution of the errors. If the errors are independent rather thanjust uncorrelated parameter estimates are more precise; however, if errors are assumedto be independent when they are just uncorrelated, the variances of the estimates will beunderestimated (Judge et al.). The multivariate-t regression models explained 69.9% and72.6% of the variability in the logarithms of bull prices. Most variables had the antici-pated signs and were statistically significant.
Effects of Physical Characteristics
When EPDs were not included (Model 1), Angus bulls brought a significant premiumrelative to Simmental bulls, but other breeds did not significantly differ from Simmental.When EPDs were included in the model (Model 2), none of the breed effects weresignificantly different from zero. Black Simmental bulls brought premiums of 50 to 53%
compared with Simmental bulls that were not black. Similarly, black Gelbvieh and Lim-ousin bulls received premiums of 12 to 15% and 30 to 40%, respectively, compared withred bulls. Previous studies found Angus-type, or black, feeder cattle brought premiumsover several other breeds (Sartwelle et al.) and the value of this trait is reflected in thederived demand for bulls. Polled bulls received a 10% premium. The marginal premiumpaid on conformation was two to three times greater than for muscling, correctness, ordisposition with premiums of 8 and 7% for Models 1 and 2, respectively, for eachincremental increase in conformation score.
Historically, bulls have often been sold as two-year olds, but the beef industry nowuses more yearling bulls (Gossey). This is confirmed by the fact that 79% of the bullssold were less than 18 months old. Age had a nonlinear effect on bull prices indicatingbuyers paid a premium for older bulls but at a decreasing rate (fig. 1). Two-year-old andolder bulls brought premiums compared with younger bulls but probably not largeenough premiums to offset the added expense of raising the bulls.
Performance Factors
Birth weight, adjusted weaning weight, and EPD variables were estimated separately bybreed because of differences in standards across breeds. Birth weight had a negative impact
404 December 1996

Purebred Beef Bull Price Differentials 405
1O/_AI., /U
10%
5%So
0:0
.r
I 0%
0
9 -5%
-10%
-15%275 325 375 425 475 525 575 625 675 725 775 825 875 925
Age (days)
Figure 1. Effect of bull age on bull price, base age is 450 days
on bull prices indicating bulls with higher birth weights sold at a discount to bulls withlower birthwin weights. When EPs were not included (Model ), birth weight was significantfor four of seven breeds and the discounts ranged from 0.6 to 1.0% for each additionalpound of birth weight. When EPDs were included (Model 2) actual birth weight was sta-tistically significant for only two of the seven breeds. In general, the birth weight discountdecreased when birth weight EPD was included in the model. Birth weight EPDs hadsignificant impacts on prices for three of the seven breeds and ranged from a discount of4.4 to 4.6% for each incremental increase in EPD. Birth weight EPDs were negative for sixof the seven breeds indicating producers discount bulls s with relatively high birth weightcalves.
Adjusted weaning weight was significant for six of the seven breeds and was positive asexpected in both models. The premium ranged from approximately 0.1 to 0.3% for eachadditional pound of weaned weight when EPDs were not included in the model. Whenweaning weight EPDs were included in the model, premiums associated with actual weaningweight decreased slightly. Weaning weight EPDs had a significant impact on the price ofbulls for five of the seven breeds and ranged from 0.8 to 3.4% for each incremental increasein EPD.
Milk EPDs were significant for three of the seven breeds. The premium on milk EPDsranged from about 0.8 to 2.8% for each incremental increase in milk EPD.
Table 4 reports the statistical significance of groups of performance factors for Models1 and 2. Adjusted weaning weight, birth weight EPD, weaning weight EPD, and milkEPD are all highly statistically significant in Model 2 and birth weight is significant atthe 10% level. This indicates buyers use both physical measures and EPD values indetermining prices to pay for bulls; however, actual birth weights and birth weight EPDsmay be providing buyers similar information. Individually, all three EPD variables were
Dhuyvetter et al.

Journal of Agricultural and Resource Economics
Table 4. Statistical Significance of Performance Characteristics in Explaining BullPrices
Model 1 Model 2
Variable Group F-Statistic Significance F-Statistic Significance
Birth weight 10.78 0.0000 1.86 0.0716Weaning weight 13.96 0.0000 8.19 0.0000
Birth weight EPD 4.26 0.0001Weaning weight EPD 5.32 0.0000Milk EPD 4.31 0.0001
significant for the Simmental and Angus breeds. Two of the three EPD variables weresignificant for Gelbvieh. The number of significant EPD variables for the other fourbreeds was either one or none. This indicates the use of EPDs varies considerably acrossbreeds and for some breeds they are not being used in pricing bulls.
Marketing Factors
Numerous binary variables for sales were significant indicating a sale effect was present.This could reflect seller reputation (Commer, Couvillion, and Herdon; Turner, McKissick,and Dykes), location, or marketing factors not measured here. Because sales were separatedby breed (even if they occurred at the same location on the same day), complete use of allbreed and sale dummy variables in the model was not possible due to perfect collinearity.Therefore, sale dummy variables have a default sale associated with each breed.
The order a bull was sold significantly affected price. Prices declined at a decreasing ratethe later in the sale a bull was sold. Figure 2 shows the price discount received for twodifferent sizes of sales with sale order on a relative basis. The discount decreases at a slowerrate for sales with fewer bulls compared with those offering more bulls. A discount of 20%occurred slightly over halfway through the sale when 120 bulls were sold. That same dis-count was reached after over 80% of bulls were sold at sales with 60 bulls.
Bulls featured in the sale catalog with pictures received premiums of roughly 27 to28% compared with bulls without pictures. However, the value of a picture declined asthe bull was sold later in the sale. Whether the presence of the picture in the cataloginfluenced sale price or the bulls with pictures were considered to be of superior quality(for which the individual attributes in the pricing model estimated did not adequatelycapture) is not discernable since causality cannot be established. Bulls that had a portionof semen rights retained by the sellers received large premiums; however, the premiumsdecreased rapidly as the percentage of bulls with semen rights retained increased.
One interesting aspect of these bull sales is that some bulls brought considerably higherprices than the sum of the marginal predicted values of their quality differences (contributingto nonnormal residuals). Attempts to model this by combining several traits into compositequality variables failed to improve the models. This phenomenon is similar to what Frankand Cook labeled "the winner take all." 4 In a winner-take-all market the highest valuedperformers receive more than their marginal differences would predict. To examine this
4 We are indebted to an anonymous journal reviewer for bringing this concept to our attention.
406 December 1996

Purebred Beef Bull Price Differentials 407
IU7o
OO/o0%
-10%
° -20%
-30%
-40%
-50%0 10 20 30 40 50 60 70 80 90 100
Sale order (percentile)
Figure 2. Effect of sale order on bull price by size of sale (Model 2)
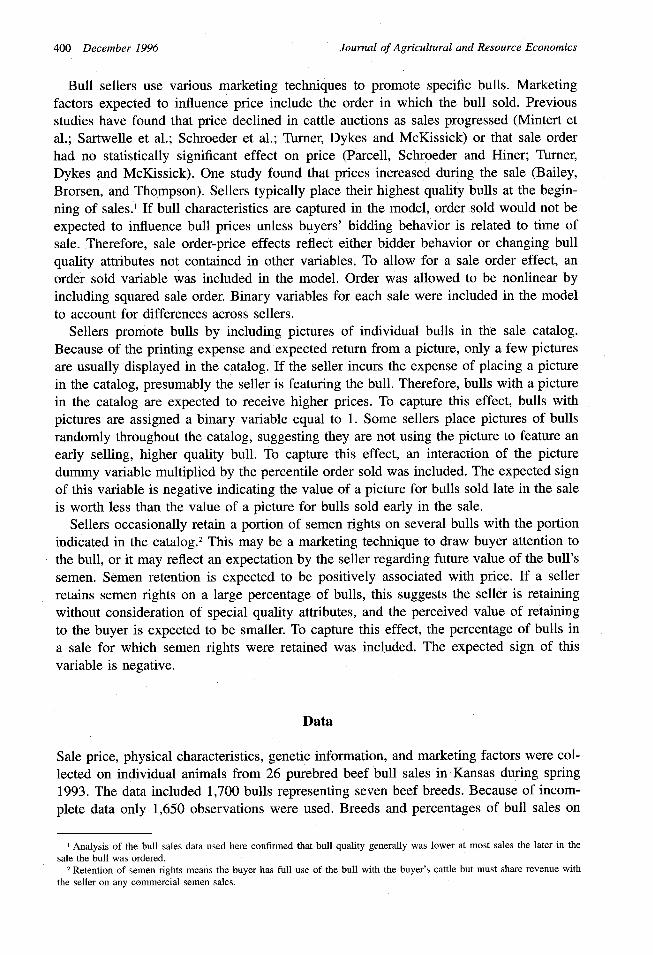
phenomenon more closely, the predicted prices were plotted against the actual prices (fig.3). Bulls receiving the highest actual prices had predicted prices that were less than theyactually received. The top 10% highest priced bulls had an average residual of 16 to 18%,suggesting prices for these bulls were underpredicted on average. Why these bulls broughtsuch high prices is difficult to determine. Some of these bulls could have been purchasedby purebred breeders; however, we were unable to obtain data to confirm this. This suggeststhe possibility of a separate market for these higher priced bulls.
Conclusions
Bull prices are determined by genetic, physical, and expected performance characteristicsof the bull and by marketing techniques not necessarily related to the quality of the bull.While absolute price levels varied by breed, after quality characteristics are accountedfor, generally breed had no effect on price. Buyers paid premiums for black Simmental,Gelbvieh, and Limousin bulls. Polled bulls received premiums. Premiums were paid forbulls receiving higher subjective ratings for conformation, muscling, and disposition in-dicating buyers incorporate visual appraisal of bulls into their pricing decisions. Pricewas nonlinearly related to age indicating producers paid a premium for older bulls, butthe premium decreased as age increased.
Expected performance variables were important in explaining price variability for mostbreeds. Bull prices were negatively correlated with birth weight for all breeds except Lim-ousin. Price was also negatively correlated with birth weight EPDs for most breeds; however,birth weight EPDs were only statistically significant for three of the breeds. Birth weightEPDs did not provide buyers new information compared with actual birth weights for most
Dhuyvetter et al.
I no/,
I
Journal of Agricultural and Resource Economics
uV,VVV
15,000
*S 10,000
a,
5,000
00 5,000 10,000 15,000 20,000
Actual price ($/head)
Figure 3. Comparison of actual and predicted bull prices (Model 2)
breeds. Bull prices were positively correlated with adjusted weaning weight and significantlydifferent from zero for most breeds. Prices were positively correlated with weaning weightEPDs for all breeds and statistically significant for all breeds except Charolais and RedAngus. Milk production EPD significantly affected bull prices in three of the breeds andwas positively correlated with price. Buyers use expected performance measures in theirpurchasing decisions; however, the information used varies by breed. EPDs were statisticallysignificant in explaining the price of Angus, Gelbvieh, and Simmental breeds but were lesssignificant in other breeds. Performance variables were not significant in explaining the priceof Limousin bulls indicating buyers differentiated these bulls based on other factors.
Bull prices varied considerably between sales indicating seller reputation, location, andmarketing factors not included in this analysis significantly impact price. Bull pricesdeclined as sales progressed. If sellers featured a bull by including its picture in the salecatalog, they received a premium for that bull. However, the premium decreased if thepictured bull was sold late in the sale. If sellers retained a portion of the semen rightson a bull, they received a premium for that bull. However, the premium decreased rapidlyas the number of bulls with semen rights retained increased. Finally, some bulls broughtprices considerably higher than the models predicted suggesting the possibility of a sep-arate market for these bulls.
[Received January 1996; final version received July 1996.]
References
Arnold, J. W., J. K. Bertrand, L. L. Benyshek, J. W. Comerford, and T. E. Kiser. "Selection for Low BirthWeight and Height Yearling Weight in Angus Beef Cattle." Livestock Production Sci. 25(1991):31-41.
408 December 1996
In nnn
Purebred Beef Bull Price Differentials 409
Bailey, D., B. W. Brorsen, and M. R. Thompson. "Identifying Buyer Market Areas and the Impact of BuyerConcentration in Feeder Cattle Markets Using Mapping and Spatial Statistics." Amer. J. Agr. Econ.77(1995):309-18.
Bailey, D., M. C. Peterson, and B. W. Brorsen. "A Comparison of Video Cattle Auction and Regional MarketPrices." Amer. J. Agr. Econ. 73(1991):465-75.
Bailey, D., and M. C. Peterson "A Comparison of Pricing Structures at Video and Traditional Cattle Auc-tions." West. J. Agr. Econ. 16(1991):392-403.
Belsley, D. A., E. Kuh, and R. E. Welsch. Regression Diagnostics. New York: John Wiley and Sons, 1980.Clary, G. M., J. W. Jordan, and C. E. Thompson. "Economics of Purchasing Genetically Superior Beef Bulls."
S. J. Agr. Econ. 16(1984):31-36.Commer, M., Jr., W. C. Couvillion, and C. W. Herndon Jr. "The Effects of Promotion in Price Determination
of Beef Bulls." The Professional Animal Scientist 6(1990):5-10.Corah, L., D. D. Simms, and K. O. Zoellner. "How to Use the Latest Beef Cattle Genetic Information."
Coop. Ext. Serv. Bull. No. MF-889, Kansas State University, Manhattan, October 1987.Diaz, C., D. R. Notter, and W. E. Beal. "Relationship between Milk Expected Progeny Differences of Polled
Hereford Sires and Actual Milk Production of Their Crossbred Daughters." J. Animal Sci. 70(1992):396-402.
Faminow, M. D., and R. L. Gum. "Feeder Cattle Price Differentials in Arizona Auction Markets." West. J.Agr. Econ. 11(1986):156-63.
Frank, R. H., and P. J. Cook. The Winner-Take-All Society. New York: Martin Kessler Book, 1995.Gossey, J. "How to Select a Good Herd Bull." Kansas Beef Cattle Handbook No. GPE-8250, Kansas State
University, Manhattan, August 1983.Green, R. D., R. S. Faught, R. A. Long, and K. E. Evans. "A Profile of the Beef Cattle Industry in the
Southwestern United States: II. Breed Composition and Relative Importance of Traits." Tech. Rep. No.T-5-297, Dept. of Animal Science Res. Rep. 1991, Texas Tech University, 1992.
GreeI R. C., and J. J. Urick. "An Annual Model of Purebred Breeding Bull Price." West. J. Agr. Econ. 13(1988):1-6.Jarque, C. M., and A. K. Bera. "Efficient Tests for Normality, Homoscedasticity, and Serial Independence of
Regression Residuals." Econ. Letters 6(1980):255-59.Jones, R., T. Schroeder, J. Mintert, and F Brazle. "The Impacts of Quality on Cash Fed Cattle Prices." S. J.
Agr. Econ. 24(1992):149-62.Judge, G., R. Hill., W. Griffiths, H. Ltitkepohl, and T. Lee. Introduction to the Theory and Practice of
Econometrics, 2nd ed. New York: Wiley, 1988.Kemp, R. A., and P. G. Sullivan. "The Relationship between Progeny Performance and Sire Expected Progeny
Differences for Central Test Postweaning Gain." Can. J. Animal Sci. 75(1995):169-71.Kerr, W. A. "Selective Breeding, Heritable Characteristics and Genetic-Based Technological Change in the
Canadian Beef Cattle Industry." West. J. Agr. Econ. 9(1984):14-28.Ladd, G. W., and M. B. Martin. "Prices and Demands for Input Characteristics." Amer. J. Agr. Econ.
58(1976):21-30.Mahrt, G. S., D. R. Notter, W. E. Beal, W. H. McClure, and L. G. Bettison. "Growth of Crossbred Progeny
of Polled Hereford Sires Divergently Selected for Yearling Weight and Maternal Ability." J. Animal Sci.68(1990): 1889-898.
Mallinckrodt, C. H., R. M. Bourdon, B. L. Golden, R. R. Schalles, and K. G. Odde. "Relationship of MaternalMilk Expected Progeny Differences to Actual Milk Yield and Calf Weaning Weight." J. Animal Sci.71(1993):355-62.
Marshall, D. M., and M. B. Long. "Relationship of Beef Sire Expected Progeny Difference to MaternalPerformance of Crossbred Daughters." J. Animal Sci. 71(1993):2371-374.
Marston, T T., D. D. Simms, R. R. Schalles, K. 0. Zoellner, L. C. Martin, and G. M. Fink. "Relationship ofMilk Production, Milk Expected Progeny Difference, and Calf Weaning Weight in Angus and SimmentalCow-Calf Pairs." J. Animal Sci. 70(1992):3304-310.
Mintert, J., J. Blair, T Schroeder, and F Brazle. "Analysis of Factors Affecting Cow Auction Price Differ-entials." S. J. Agr. Econ. 22(1990):23-30.
Nunez-Dominguez, R., L. D. Van Vleck, and L. V. Cundiff. "Breed Comparisons for Growth Traits Adjustedfor Within-Breed Genetic Trend Using Expect Progeny Differences." J. Animal Sci. 71(1993):1419-428.
Parcell, J. L., T. C. Schroeder, and F D. Hiner. "Determinants of Cow-Calf Pair Prices." J. Agr. and Resour.Econ. 20(1995):328-40.
Dhuyvetter et al.

Journal of Agricultural and Resource Economics
Sartwelle, J. D., III, F K. Brazle, J. R. Mintert, T. C. Schroeder, and M. R. Langemeier. "Buying and SellingFeeder Cattle: The Impact of Selected Characteristics on Feeder Cattle Prices." Coop. Ext. Serv. Bull.No. MF-2162, Kansas State University, Manhattan, January 1996.
Schalles, R. R., and K. 0. Zoellner. "Using EPDs in a Commercial Herd." Coop. Ext. Serv. Bull. No.MF-1082, Kansas State University, Manhattan, September 1993.
Schroeder, T., J. Mintert, F Brazle, and 0. Grunewald. "Factors Affecting Feeder Cattle Price Differentials."West. J. Agr. Econ. 16(1988):71-81.
SHAZAM User's Reference Manual Version 7.0, McGraw-Hill, 1993.Simms, D. D., J. M. Geske, and R. P. Bolze. "Commercial Cattle Producers: Bull Selection Criteria." Agr.
Exp. Sta. Rep. of Prog. 704, pp. 56-59, Kansas State University, March 1994.Sullivan, G. M., and D. A. Linton. "Economic Evaluation of an Alternative Marketing System for Feeder
Cattle in Alabama." S. J. Agr. Econ. 13(1981):85-89.Turner, S. C., N. S. Dykes, and J. McKissick. "Feeder Cattle Price Differentials in Georgia Teleauctions." S.
J. Agr. Econ. 23(1991):75-84.Turner, S. C., J. McKissick, and N. S. Dykes. "Reputation Selling in Feeder Cattle Teleauctions." Rev. Agr.
Econ. 15(1993):9-20.U.S. Department of Agriculture (USDA), Animal and Plant Health Inspection Service, Veterinary Services.
"Part II: Beef Cow/Calf Reproductive & Nutritional Management Practices." Beef Cow/Calf Health &Productivity Audit, pp. 10-11, Center for Epideminiology and Animal Health, USDA:APHIS:VS, FortCollins CO, January 1994.
Wagner, W., J. Gibb, J. Farmer, and D. Strohbehn. "Understanding and Using Sire Summaries." Kansas BeefCattle Handbook No. GPE-8154, Kansas State University, Manhattan, September 1985.
Ward, C. E. "Inter-Firm Differences in Fed Cattle Prices in the Southern Plains." Amer. J. Agr. Econ.74(1992):480-85.
Zellner, A. "Bayesian and Non-Bayesian Analysis of the Regression Model with Multivariate Student-t ErrorTerms." J. Amer. Statis. Assoc. 71(1976):400-5.
410 December 1996


![Welcome! [] · DVE Davidson Pld Dandy 75S PUREBRED • RED • MULTI POLLED • DNA # DC 181275 BULL • FEB 11/06 • DVE 75S • CDGVPD114885 Just a Dandy herd sire! His dam is](https://static.fdocuments.net/doc/165x107/5f65b49251f8692ba22f2870/welcome-dve-davidson-pld-dandy-75s-purebred-a-red-a-multi-polled-a-dna.jpg)


