Determinants of Population Growth Trends for Tanzanian ...
12
Urban and Regional Planning 2019; 4(2): 67-78 http://www.sciencepublishinggroup.com/j/urp doi: 10.11648/j.urp.20190402.13 ISSN: 2575-1689 (Print); ISSN: 2575-1697 (Online) Determinants of Population Growth Trends for Tanzanian Small Towns Ally Hassan Namangaya School of Spatial Planning and Social Sciences, Ardhi University, Dares Salaam, Tanzania Email address: To cite this article: Ally Hassan Namangaya. Determinants of Population Growth Trends for Tanzanian Small Towns. Urban and Regional Planning. Vol. 4, No. 2, 2019, pp. 67-78. doi: 10.11648/j.urp.20190402.13 Received: April 26, 2019; Accepted: July 9, 2019; Published: July 19, 2019 Abstract: The largest share of urbanisation in Sub Saharan Africa is taking place in settlements that are smaller than cities. However, these small urban settlements are conceptually neglected and mostly mistheorised as overriding land governance concepts and institutional procedures were designed for large urban centres or the extreme opposite, villages. As a result, there is either a total lack of specific policies on small urban centres or the policies are designed wrongly thus contributing to challenges of informality, poor servicing and environment degradations. This paper, using the Tanzanian case, is an attempt to contribute in understanding the dynamics of small towns through establishing the population thresholds that can appropriately be classified as small towns and the factors driving their growth. The study analyses census data spatially using geographical information system and statistical software. The results indicate that the typical size of small towns where polarisation forces still gravitate towards the town has a number of people between 10,000 and 50,000 people with population density at the core of the settlements ranging from 40 to 120 people per hectare. The major factors for the development are the presence of economic activities that have value addition options contributing to off-farm employment, and the typical radius of its hinterland for each small town is about a one hour drive. As the number of small towns continues to grow in Sub Saharan Africa due to continued polarisation forces, policies and interventions for the management of small have to be pre-emptive and anticipatory. Keywords: Small Towns, Tanzania, Urban Planning, Urban Population Growth 1. Gaps in the Understanding of Small Towns As the world is urbanising, it has reached a stage where 63 per cent of the urban population is concentrated in intermediate and small towns [1-4]. Contrary to the European and North American experiences, where most of the small towns are experiencing decline or stagnation of population growth [5, 6] in sub-Saharan Africa, there is an increase in population of small towns. This trend calls for a rethinking of policy focus on issues that impact on small towns in sub- Saharan Africa. Despite this realisation, there is a tendency to see development in extremes of cities and rural areas that leave a void in academic discourse and policies specific for small towns [7, 8]. The tendency to marginalise small towns at the expense of villages and large urban centres has a long history in sub- Saharan Africa. During independence days (the 1960s) governments, which mostly subscribed to modernisation theories were subsidizing the cost of living in major urban centres, thus had to some extent neglected small towns [9]. Early indications of failures of moderation theories corresponded with the strengthening of socialistic ideas in some countries, including Tanzania, saw the rekindling of interests in small towns as a tool to drive rural development. Donors through their technical agencies financed projects such as Integrated Rural Developments Plans [9, 10], in which small towns were conceptualised as development nodes to service the hinterlands. The structural adjustment and decentralisation programmes from the very early 1980s to late 1980s shoved requirement to have minimalist states in sub-Saharan African countries, reducing the role of governments thus un-intentionally favouring large urban centres [11]. Since then small towns and large urban centres in sub-Saharan Africa have been proliferating in the
Transcript of Determinants of Population Growth Trends for Tanzanian ...

Urban and Regional Planning 2019; 4(2): 67-78
http://www.sciencepublishinggroup.com/j/urp
doi: 10.11648/j.urp.20190402.13
ISSN: 2575-1689 (Print); ISSN: 2575-1697 (Online)
Determinants of Population Growth Trends for Tanzanian Small Towns
Ally Hassan Namangaya
School of Spatial Planning and Social Sciences, Ardhi University, Dares Salaam, Tanzania
Email address:
To cite this article: Ally Hassan Namangaya. Determinants of Population Growth Trends for Tanzanian Small Towns. Urban and Regional Planning.
Vol. 4, No. 2, 2019, pp. 67-78. doi: 10.11648/j.urp.20190402.13
Received: April 26, 2019; Accepted: July 9, 2019; Published: July 19, 2019
Abstract: The largest share of urbanisation in Sub Saharan Africa is taking place in settlements that are smaller than cities.
However, these small urban settlements are conceptually neglected and mostly mistheorised as overriding land governance
concepts and institutional procedures were designed for large urban centres or the extreme opposite, villages. As a result, there
is either a total lack of specific policies on small urban centres or the policies are designed wrongly thus contributing to
challenges of informality, poor servicing and environment degradations. This paper, using the Tanzanian case, is an attempt to
contribute in understanding the dynamics of small towns through establishing the population thresholds that can appropriately
be classified as small towns and the factors driving their growth. The study analyses census data spatially using geographical
information system and statistical software. The results indicate that the typical size of small towns where polarisation forces
still gravitate towards the town has a number of people between 10,000 and 50,000 people with population density at the core
of the settlements ranging from 40 to 120 people per hectare. The major factors for the development are the presence of
economic activities that have value addition options contributing to off-farm employment, and the typical radius of its
hinterland for each small town is about a one hour drive. As the number of small towns continues to grow in Sub Saharan
Africa due to continued polarisation forces, policies and interventions for the management of small have to be pre-emptive and
anticipatory.
Keywords: Small Towns, Tanzania, Urban Planning, Urban Population Growth
1. Gaps in the Understanding of Small
Towns
As the world is urbanising, it has reached a stage where 63
per cent of the urban population is concentrated in
intermediate and small towns [1-4]. Contrary to the European
and North American experiences, where most of the small
towns are experiencing decline or stagnation of population
growth [5, 6] in sub-Saharan Africa, there is an increase in
population of small towns. This trend calls for a rethinking of
policy focus on issues that impact on small towns in sub-
Saharan Africa. Despite this realisation, there is a tendency to
see development in extremes of cities and rural areas that
leave a void in academic discourse and policies specific for
small towns [7, 8].
The tendency to marginalise small towns at the expense of
villages and large urban centres has a long history in sub-
Saharan Africa. During independence days (the 1960s)
governments, which mostly subscribed to modernisation
theories were subsidizing the cost of living in major urban
centres, thus had to some extent neglected small towns [9].
Early indications of failures of moderation theories
corresponded with the strengthening of socialistic ideas in
some countries, including Tanzania, saw the rekindling of
interests in small towns as a tool to drive rural development.
Donors through their technical agencies financed projects
such as Integrated Rural Developments Plans [9, 10], in
which small towns were conceptualised as development
nodes to service the hinterlands. The structural adjustment
and decentralisation programmes from the very early 1980s
to late 1980s shoved requirement to have minimalist states in
sub-Saharan African countries, reducing the role of
governments thus un-intentionally favouring large urban
centres [11]. Since then small towns and large urban centres
in sub-Saharan Africa have been proliferating in the

Urban and Regional Planning 2019; 4(2): 67-78 68
liberalised economies without clear guidance. This resulted
in multiple maladies such as informal urbanization and poor
servicing in all urban areas. In Europe, too small towns were
neglected for some years because at the time the metropolises
were desired centres of consumerism and small towns were
left to meet natural death [6, 12].
Since the early 1990s, there have been global efforts to
improve the state of urban planning in Tanzania and other
African countries, mostly under UNEP and UN-HABITAT
support, however, these attempts were undertaken mostly in
complex megacity contexts, with donor-funded programmes
[12, 13]. Small towns are under rural councils with
comparatively lower human and financial capacities [14].
Absence or under the capacity of small towns’ planning
institutions failed to capture many potentials existing in small
towns that would make planning concept adaptable and
implementable. These potentials include low population
sizes, the relative abundance of affordable land and cohesive
communities [5, 15, 16].
As thrust towards urban and regional competitiveness
dominates the spatial planning discourses, interests on small
towns as a part of overall regional competitiveness and
prosperity has been rekindled [17, 18]. Different from the Global
North where the issue is mostly rejuvenation of vibrancy and
deteriorating infrastructure in small towns, in the Global South,
the issue is, there has been very low infrastructure investments
and policy neglect in small towns despite burgeoning population
[8]. Sharma [19] summarises problems of small towns to be
financing gap and lack of spatial development planning. In
Tanzania, the Tanzania National Audit Office 2014 [20] shows
that the challenges is not only that 80 per cent of the towns do
not have spatial plans, but even those with the plans never
implement them (as reflected in physical development patterns).
The same situation is widely reported in Tanzania and other Sub
Saharan countries [21-24].
To be able to formulate effective policies to guide the
development of small towns requires the understanding of
such towns, the fact which unfortunately has been ignored by
the scientific community where the assumption has probably
been by understanding large urban centres, policy makers and
planners will automatically gain insights on development
dynamics of small towns [25]. As a result of this neglect,
there are many unanswered questions which hamper
formulations of effective policies. Some of the questions this
research paper intends to answer are; what is the range of
population size that would represent a small town? and what
are main factors for the emergence and populations growth of
small towns? The discussions here under highlights some of
the discourses on these issues.
2. Population Sizes in Small Towns
There is a wide range of population size used to define the
small towns. These population ranges are context-dependents.
There are countries where small towns are considered to be in
the lowest hierarchy of population concentration. In these
countries, the population sizes of small towns are considered to
be below 20,000. These include the United States of America
and Western Europe counties [26-29]. The other set is those
countries where there are village settlements below the small
towns in the settlements hierarchy. In the second type of
contexts, the population range of small towns has the upper limit
of 100,000 people [15]. In these contexts, there are many
variations on the minimum and average population size of small
towns. For instance, Japan only considers small towns when
population size is above 30,000 [26] while many others have set
an average of 50,000 [30, 31]. In Tanzanian there are conflicting
designations and criteria used to define small towns between
three central government institutions, namely then ministry
responsible for lands, the ministry responsible for local
government and the National Bureau of Statistics [32, 33].
A few authors have included density criteria to standardise
more on the definitions of small towns. Rebernik [34] in the
case of Slovenia, states the gross density range to be between
250 and 500 people per km2. Equally, Sharma [19] discussing
the case of India states the minimum gross density for a small
town to be 400 people per km2. These are extreme low
densities designated for small towns, considering a benchmark
Gordon and Richardson [35] have set when discussing the
distributions of worldwide urban densities that the minimum
urban population density for sustainable development should
be between 16,000 - 20,000 people per km2 or 40-50 dwelling
units per hectare. A study conducted in Tanzanian cities found
out that the average gross density on urban areas is around 21
dwelling units per hectare or 8400 people per km2 [24].
3. The Theoretical Explanation for
Urban Populations Growth
In theory, the urban population growth cycle is a function of
regional population interactions among urban centres [26, 36]
[37]. In this cycle, small towns’ urbanisation path starts when
they absorb more populations from hinterland through
migrations and natural growth such that their growth rates
exceed those of surrounding settlements. As they grow they also
feed part of their populations into regional cities and therefore as
long as the regional cities are growing they will continue to
emerge and grow. However, their growth rates will be
decreasing (measured between intercensal periods) until they
stabilise, this is when the regional centres go into polarisations
reversal or stagnations. Possibly a new growth cycle starts again.
As African urbanisation has generally not reached the point of
stabilisation and reversal, this it is only possible to establish
declining trends of growth of small towns from the falling rate
of immigration and structural change in small towns that had a
very specific economic base like mining [37].
4. Determining Context-Relevant Factors
for Populations Growth in Small
Towns
Local Economic Development (LED) framework, which is

69 Ally Hassan Namangaya: Determinants of Population Growth Trends for Tanzanian Small Towns
based on endogenous development and economic base
theories, is one of many possible theoretical frameworks that
could be used to explain the rationale for the number of
people and capital to concentrate and grow in a particular
settlement [38, 39]. Under the LED theorisation, the basic
reason for the people to move to particular locations are
mainly employment opportunities and liveability. An
important condition for the employment opportunities to be
generated in excess of the internal settlement’s labour supply
is to have the endowment of resources within the settlement
or its vicinity as well as to attract and nature capital so that
there are expansions of productions activities.
Natural endowments that make production activities possible
in a context of developing countries like Tanzania where 77.5
per cent of labour force relies upon agriculture [40] include
access to usable agricultural land and water, availability of forest
and wildlife resources and presence of mineral resources. Usable
indicators for potentiality for agriculture to thrive include
presence of rivers, distance to the city and distance to the
competing urban centres and regional centres which provides
the market for its produces and define catchment for its
productions activities. Presence of conservations areas is a proxy
in the richness of biodiversity (wildlife and/or forest resources).
On the other hand, the presence of protected biodiversity areas
may restrict lateral growth of other types of activities including
housing development. Tourism sector, albeit potentially relevant
for attracting migrant labour and capital, is limited by the poor
state of infrastructure in small towns and the structure of the
national economy, in which main tourism offices are in large
urban centres [41].
For the settlement to attract capital and become more
competitive than its peers, it has to express
interconnectedness and agglomeration economies [42].
Interconnectedness means linkage to other markets which
reduces costs of productions and expands the customer base.
To be interconnected in the context of developing countries is
to have a transport node such as highway linkages to other
areas and train stations. Agglomeration economies in the
context of developing countries means having basic sector
economic activities, mainly in agriculture and mining that
attracts other industries businesses and capital for its
expansion [40, 43]. Therefore relevant indicators for the
proximity and growth of productions activities include the
existence of large estate farms, the presence of separate crop
processing factories and the proximity to large government
agricultural projects. Expansion of agricultural areas also can
indicate the growth in production activities. Political
resources such as declarations of a settlement as a district
administrative centre, has the same effect as the introduction
of economic activities through government offices that
provide employment and generate customers for some
producers of goods and services. Cost of doing business, in
addition to the level of interconnectedness, is also reduced by
the quality of labour especially as they serviced higher order
facilities like large hospitals and universities.
5. Data and Methods
The study approach involved using Geographic
Information Systems (GIS), and the specific software used
are ArcGIS and QGIS, to analyse changes in spatial
coverages, density levels and proximity of functions,
facilities and resources to the town centres (similar studies
include Deng [44] and Masron [45]. Statistical Package for
Social Studies (SPSS) was used for correlation analysis and
establishment of central tendencies, while Past 3.24 was used
for Principle Component Analysis. All the factors were
assessed as they relate to the settlements' population growth.
The list of factors tested, methods and intention of the test are
summarised in Table 1. The actual data generated and used
for analysis are presented in Appendix 1.
Table 1. Data used and essence of their analysis.
Factor Methods of analysis The rationale for the analysis
Wards populations, 1978,1988,
2002, 2012
Ward population and boundary data for 1988, 2002, 2012
had to be combined if a particular ward was subdivided to
reflect the boundaries of 1978.
Census data from these years organised by wards
were the basis for population analysis.
Intercensal growth rates in all wards
1978-1988
1988-2002
2002-2012.
Computations of growth rates by wards and spatially
presenting the results. Identify change in the population
growth patterns of the wards.
Identify wards whose growth rates exceed the
national averages of 2.5 and have a population above
12000 which is the higher limit for a village.
Establishing largest settlements (built-up area) in the
fast-growing wards and tracing these as small towns.
Building density at the largest built-
up area in the town core (referred
here as small towns) as per
populations size of 2012.
The digitisation of building as points from high-resolution
archive imagery for years 2016/2017 and calculating point
density of the village/street at the core of a small town.
Establishing the typical building density of a thriving
small town.
Number of highway passing
through the centre as per 2002 data.
Visual counting of roads (directions from the junctions)
passing through the centre.
Establishing the relationship between population
growth rates and transportation (road) functions.
Proximity to railway stations as per
2012 data. Proximity analysis
Establishing the relationship between population
growth rates and the availability of transportation
(railway) services.
Distance to a closest regional city. Proximity analysis (near-table) to the nearest of the three
regional cities existing in the study region.
Influence of the major urban centres on the
population growth of small towns.
Distance to the nearest peer (small
town).
Proximity analysis to the nearest small town assuming
there is no significant travel barrier between them.
Catchment declination for each studied small town.
Establishing the relationship between the
concentration level of small towns and their growth-

Urban and Regional Planning 2019; 4(2): 67-78 70
Factor Methods of analysis The rationale for the analysis
rates.
Expansion of farming areas between
1995 and 2011.
Interpreted land cover data from 30m Resolution Landsat
imagery of 1995 and 2011. The areas of interest were
established from catchment analysis.
The relationship between population growth and
expansion of farming areas in the vicinity of a small
town.
Influence of administrative
functions as per 2002 status of the
centres.
Ranking of the centres as
“0” for not hosting any administrative functions;
“1” for hosting district council offices;
“2” for hosting independent town council functions;
“3” for hosting regional administrative offices.
Establishing the relation between hosting political
governance functions and their growth-rates small
towns.
Proximity to the regional hospital
Proximity analysis to the nearest district or regional or
any higher order hospital assuming there is no significant
travel barrier.
Establishing the relationship between the availability
of social services (health) and growth-rates of small
towns.
Proximity to protected areas Proximity analysis to the nearest protected area assuming
no barrier and flat surface.
Establishing the relationship between the availability
of natural resources and the growth rates of small
towns.
Proximity crop processing factory Proximity analysis to the crop processing factories
assuming no barrier and flat surface.
Establishing the influence of off-farm jobs and
industries on the growth rates of small towns.
Influence of large scale farming Proximity analysis estates farms assuming no barrier and
flat surface.
Influence of agriculture economy on the growth rates
of small towns.
Number of river streams within 10
km radius
Mapping of streams and GIS counting within 10 km
radius.
Influence of accessible water for farming or livestock
on the growth rates of small towns.
The following is the context of the empirical research for
studying small towns is the three neighbouring Tanzanian
regions, namely, the Coast, Morogoro and Iringa (Figure 1).
Iringa region was divided into two regions of Iringa and
Njombe in 2012, but this separation occurred outside the
study period hence not considered in the analysis. The
selection of the regions was based on the fact that they were
adjacent to one another and therefore have significantly
experienced similar policy influences e.g. all being part of
Tanzanian Southern Agriculture Growth Corridor. The
analysis uses population data from the census report of 1978,
1988, 2002 and 2012. The unit of analysis for the census
report is a ward, which is the second lowest rank in the
hierarchy of jurisdictions of governance in the country. The
ward unit, and not villages unit, is adopted as the unit of
analysis because, usually, the lowest thriving urban centre
will involve at least two villages. Ward populations data were
based on the spatial extent of 1978, therefore even when
there have been subdivisions of wards, GIS overlay of
subdivided wards made possible to identify combinations of
wards that coincide with the configuration of the original
wards in 1978.
Source: Data from the National Bureau of Statistics and National Land Use Planning Commission
Figure 1. The study area and major facilities.

71 Ally Hassan Namangaya: Determinants of Population Growth Trends for Tanzanian Small Towns
The sequence of analysis started with ward level and the
wards that showed the trend of growth had their central
villages analysed as possible growth poles. The major criteria
were those wards that grew beyond the national average
population growth rates in. that intercensal period. Twenty-
two centres passed to the stage of analysis of growth factors
from 258 rural wards initially analysed from the three regions
of Morogoro (98 wards) Iringa including Njombe (96 wards)
and Coast (64 wards). Considered wards are those which in
2012 census were not part of urban wards for Iringa and
Morogoro regional cities.
Data on locations of large estate farms, areas for
agricultural projects, crop processing factories, protected
areas, railway stations, highways and junctions, number of
rivers within 10 km radius of the town and the locations of
the urban centres themselves were captured from census data
of 2002. Therefore the facilities were there prior to that year.
However, no exact dates for establishment of the facilities
and functions were obtained. To be able to calculate building
density, data on buildings were generated from by digitising
point position of buildings of the most developed
(concentrations of buildings) part of the village, forming the
centre of a case ward. The raster analysis was done only in
areas within the village boundary of core built-up area to
establish the point (building) destiny. Through this method
densities of the periphery areas of the developed part were
omitted to reduce bias, thus making the building data to
conform only to the inner parts of the small town.
Data on landcover were established from the land cover
series data that Tanzania had undertaken using 30m
resolutions Landsat data of 1995 and 2012. The data has
similar land use classes, and the researcher combined some
classes to get more generalised classes of land cover that had
changed into farm land.
The limitation of the research is the reliance on secondary
data due to the historical and regional nature of the study.
Potentially, undertaking empirical research on each of these
centres might uncover some of the specific determinants in
particular locations. To manage this limitation, the study
concentrated on the population analysis whose basic data are
available through census and used three intercensal census
periods to expand the wideness of the data sample.
Approaching the identifications of small towns from regional
level analysis and undertaking a study in neighbouring
regions which have experienced similar policy context, have
increased the normalisation of the data.
6. Results
The ward level analysis was done on the cases and the
following results are established. There were 57 wards as per
1978 wards configuration that showed to grow above what
has been consistently national average growth rate of 2.5 per
cent per year (see Tanzania census reports of 1978, 1988,
2002 and 2012) in any of the census and had attained a
population size of 12000 people. Some of the 57 wards were
in isolation while others were neighbouring each other. The
results showed that whenever a ward or collections of
neighbouring wards had population growth above 2.5 per
annum, the surrounding wards tended to have negative
populations growth rates (Figure 2). This finding implies that
migration from the surrounding wards played a pivotal role
in fuelling the population growth of the fast-growing ward.
Source: Tanzania Census data of 1978, 1988, 2002 and 2012
Figure 2. Intercensal growth rates.
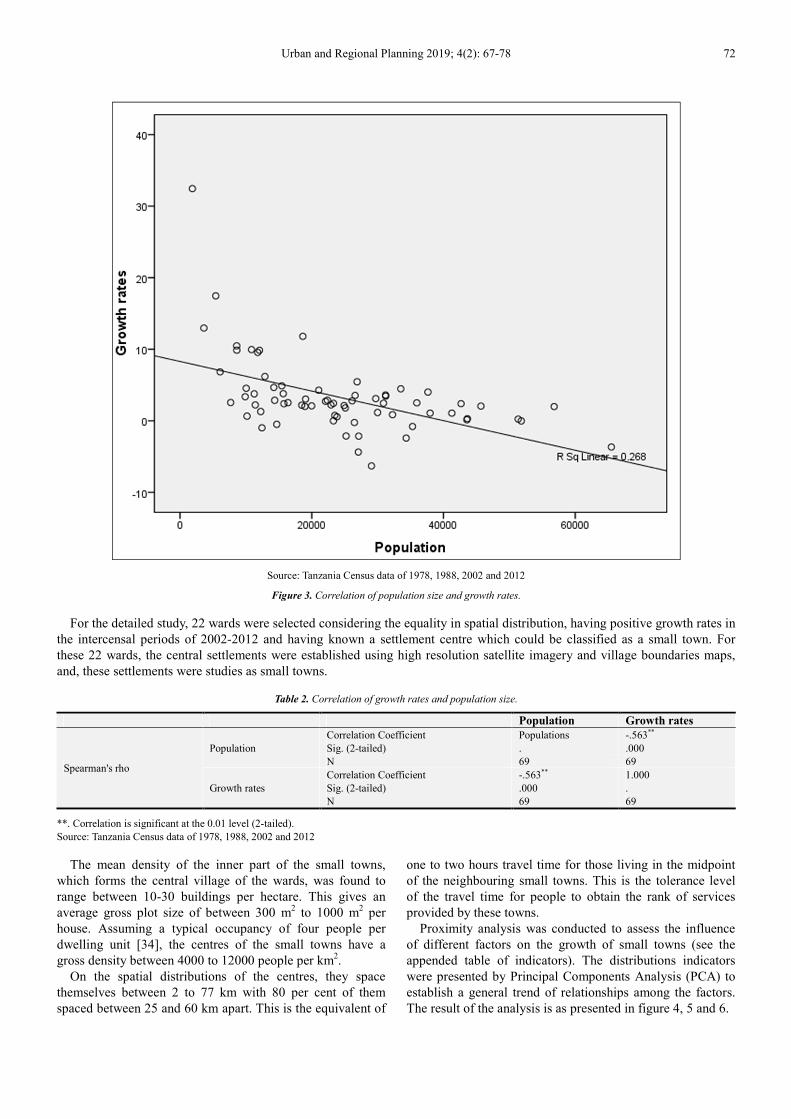
When the growth rates in all the three intercensal periods
were correlated with populations sizes of the growth centres,
it was found that there was a strong correlation with the
significance level of 0.563, and r2 linear regressions
coefficient of 0.268 (Figure 3). This implies that population
growth rates and size influenced one another by at least 27
per cent. Wards whose growth rates correlated strongly with
their population sizes had a population size ranging between
12000 and 45000. The population growth rates were
observed to be higher when the population of the growth
centres was below 30,000 people and maintained at around
2.5 per cent per year when was around 40,000.
Urban and Regional Planning 2019; 4(2): 67-78 72
Source: Tanzania Census data of 1978, 1988, 2002 and 2012
Figure 3. Correlation of population size and growth rates.
For the detailed study, 22 wards were selected considering the equality in spatial distribution, having positive growth rates in
the intercensal periods of 2002-2012 and having known a settlement centre which could be classified as a small town. For
these 22 wards, the central settlements were established using high resolution satellite imagery and village boundaries maps,
and, these settlements were studies as small towns.
Table 2. Correlation of growth rates and population size.
Population Growth rates
Spearman's rho
Population
Correlation Coefficient Populations -.563**
Sig. (2-tailed) . .000
N 69 69
Growth rates
Correlation Coefficient -.563** 1.000
Sig. (2-tailed) .000 .
N 69 69
**. Correlation is significant at the 0.01 level (2-tailed).
Source: Tanzania Census data of 1978, 1988, 2002 and 2012
The mean density of the inner part of the small towns,
which forms the central village of the wards, was found to
range between 10-30 buildings per hectare. This gives an
average gross plot size of between 300 m2 to 1000 m
2 per
house. Assuming a typical occupancy of four people per
dwelling unit [34], the centres of the small towns have a
gross density between 4000 to 12000 people per km2.
On the spatial distributions of the centres, they space
themselves between 2 to 77 km with 80 per cent of them
spaced between 25 and 60 km apart. This is the equivalent of
one to two hours travel time for those living in the midpoint
of the neighbouring small towns. This is the tolerance level
of the travel time for people to obtain the rank of services
provided by these towns.
Proximity analysis was conducted to assess the influence
of different factors on the growth of small towns (see the
appended table of indicators). The distributions indicators
were presented by Principal Components Analysis (PCA) to
establish a general trend of relationships among the factors.
The result of the analysis is as presented in figure 4, 5 and 6.
73 Ally Hassan Namangaya: Determinants of Population Growth Trends for Tanzanian Small Towns
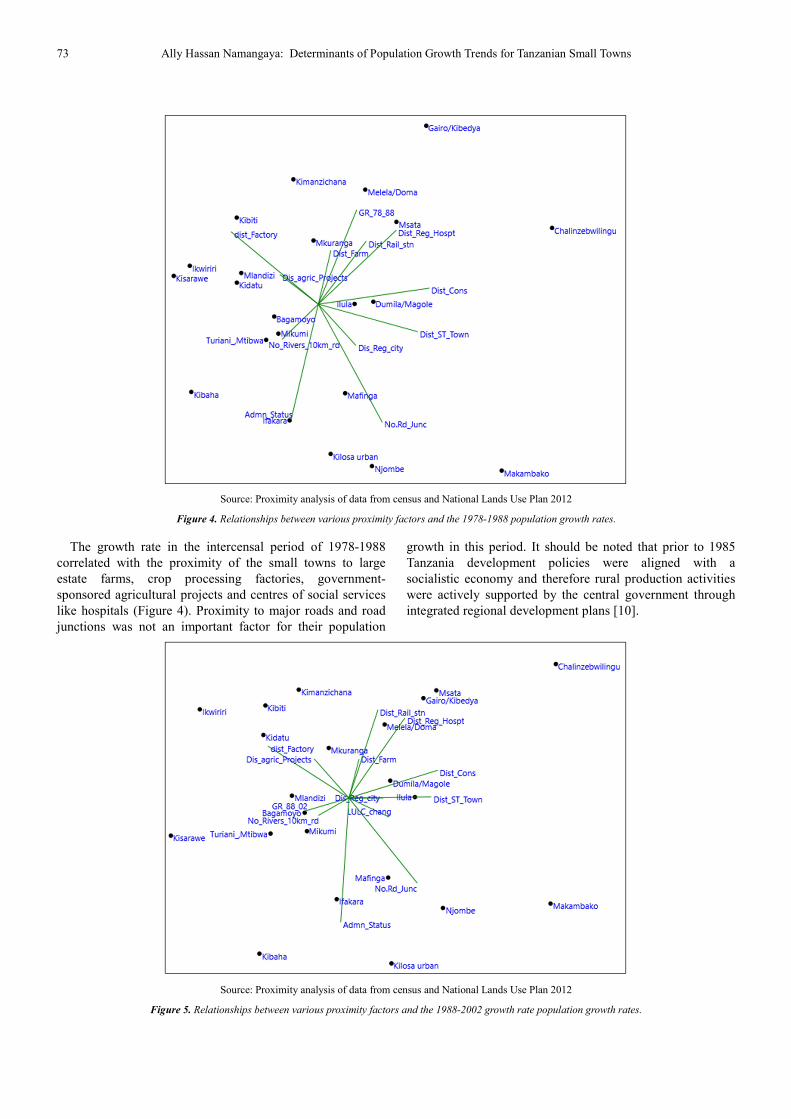
Source: Proximity analysis of data from census and National Lands Use Plan 2012
Figure 4. Relationships between various proximity factors and the 1978-1988 population growth rates.
The growth rate in the intercensal period of 1978-1988
correlated with the proximity of the small towns to large
estate farms, crop processing factories, government-
sponsored agricultural projects and centres of social services
like hospitals (Figure 4). Proximity to major roads and road
junctions was not an important factor for their population
growth in this period. It should be noted that prior to 1985
Tanzania development policies were aligned with a
socialistic economy and therefore rural production activities
were actively supported by the central government through
integrated regional development plans [10].
Source: Proximity analysis of data from census and National Lands Use Plan 2012
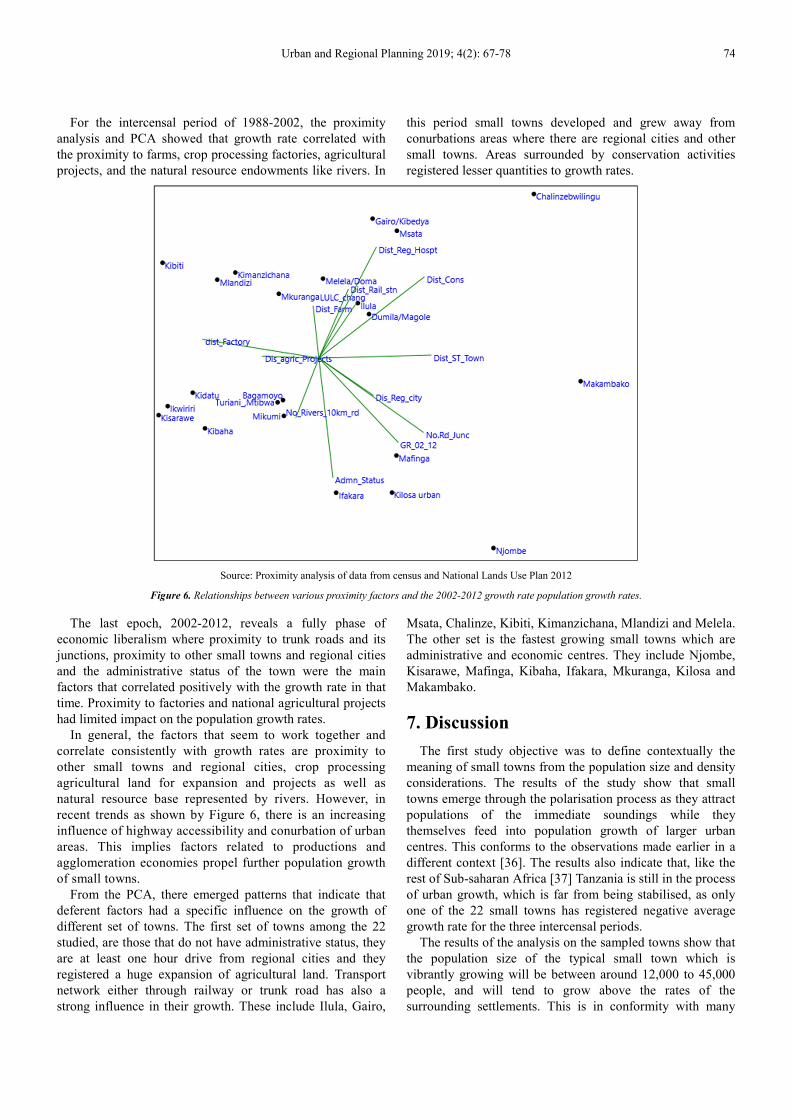
Figure 5. Relationships between various proximity factors and the 1988-2002 growth rate population growth rates.
Urban and Regional Planning 2019; 4(2): 67-78 74
For the intercensal period of 1988-2002, the proximity
analysis and PCA showed that growth rate correlated with
the proximity to farms, crop processing factories, agricultural
projects, and the natural resource endowments like rivers. In
this period small towns developed and grew away from
conurbations areas where there are regional cities and other
small towns. Areas surrounded by conservation activities
registered lesser quantities to growth rates.
Source: Proximity analysis of data from census and National Lands Use Plan 2012
Figure 6. Relationships between various proximity factors and the 2002-2012 growth rate population growth rates.
The last epoch, 2002-2012, reveals a fully phase of
economic liberalism where proximity to trunk roads and its
junctions, proximity to other small towns and regional cities
and the administrative status of the town were the main
factors that correlated positively with the growth rate in that
time. Proximity to factories and national agricultural projects
had limited impact on the population growth rates.
In general, the factors that seem to work together and
correlate consistently with growth rates are proximity to
other small towns and regional cities, crop processing
agricultural land for expansion and projects as well as
natural resource base represented by rivers. However, in
recent trends as shown by Figure 6, there is an increasing
influence of highway accessibility and conurbation of urban
areas. This implies factors related to productions and
agglomeration economies propel further population growth
of small towns.
From the PCA, there emerged patterns that indicate that
deferent factors had a specific influence on the growth of
different set of towns. The first set of towns among the 22
studied, are those that do not have administrative status, they
are at least one hour drive from regional cities and they
registered a huge expansion of agricultural land. Transport
network either through railway or trunk road has also a
strong influence in their growth. These include Ilula, Gairo,
Msata, Chalinze, Kibiti, Kimanzichana, Mlandizi and Melela.
The other set is the fastest growing small towns which are
administrative and economic centres. They include Njombe,
Kisarawe, Mafinga, Kibaha, Ifakara, Mkuranga, Kilosa and
Makambako.
7. Discussion
The first study objective was to define contextually the
meaning of small towns from the population size and density
considerations. The results of the study show that small
towns emerge through the polarisation process as they attract
populations of the immediate soundings while they
themselves feed into population growth of larger urban
centres. This conforms to the observations made earlier in a
different context [36]. The results also indicate that, like the
rest of Sub-saharan Africa [37] Tanzania is still in the process
of urban growth, which is far from being stabilised, as only
one of the 22 small towns has registered negative average
growth rate for the three intercensal periods.
The results of the analysis on the sampled towns show that
the population size of the typical small town which is
vibrantly growing will be between around 12,000 to 45,000
people, and will tend to grow above the rates of the
surrounding settlements. This is in conformity with many

75 Ally Hassan Namangaya: Determinants of Population Growth Trends for Tanzanian Small Towns
authors who have argued the populations limit of small towns
to be below 50,000 people [30, 31, 46]. The consolidated part
of the towns tend to have a gross population density of
between 4000-12000 people per square kilometre and
building density between 10-30 buildings per hectare. The
implied plots sizes are between 300 m2 and -1000 m
2.
Considering the fact that many of these towns are not
planned, this density indicates the average plot size
effectively demanded by small-town residential housing
developers.
The second questions the paper attempted to contribute
to, is the identification of factors for populations growth in
small towns. The findings reveal that economic activities
are playing the leading role in the attraction of population.
In this research context where over three-quarters of the
labour force are engaged in agriculture, this was depicted
by the dominating influence of proximity to large scale
farms, government-sponsored agricultural projects and crop
processing. To qualify further this answer, while agriculture
is everywhere in rural Tanzania, it is commercialised
agriculture and other activities in the agricultural value
chains which generate the type of employment and
economic opportunities attractive to people in nearby
wards.
Transportation, trading and informal servicing sector
supported by the proximity to major roads and important
junctions are becoming influential activities for attracting
population. Government policies and interventions
through the designation of administrative centres which
are bundled with accompanied services and employment
opportunities is another visible factor for population
growth of small towns. The research also presupposes that
there is a reversal influence in which the availability of
roads and adequate population sizes lure the decision
makers into establishing district council offices in such
small towns.
While most towns, especially in the economic liberalism
era, are growing up along the trunk roads, the influence of
the railway as a means of transport is very limited after 2002.
This finding contradicts with some findings in another
context [31]. It is also evident that government policies
towards rural productions have a significant influence on the
growth of small towns.
8. Conclusion and Policy
Recommendations
The study concludes that despite the wide variations in
defining small towns, in Tanzania and similar contexts, the
population size that will make a settlement demonstrate
typical characteristics of a small town will range between
12000 and just below 50000, that is, 4000-12000 per
hectare or 10-30 buildings per hectare. The impetus for the
growth of these centres will likely be commercialised
agriculture and other activities in the agricultural value
chains which generate off-farm employment and economic
opportunities attractive to people in nearby areas.
Transportation, trading and informal servicing sector
supported by the proximity to major roads have important
roles in liberalised economies and where development
activities are less controlled.
While further research is required to trace the growth
history of these towns and relate to these statistical
attributes, it suffices at this juncture to put forward some of
the policy implications of the study in shaping urbanisation
landscape in Tanzania and in areas with similar contexts. It
is evident that small towns are essential and are bound to
emerge, however for a proper functionality they need to be
available at about one-hour drive from their hinterland.
They are likely to grow if there is commercial agriculture or
some value addition activities. Equally, whenever there is
well performing commercial agriculture project with
accompanied off-farm employment opportunities and
existing important highway junctions, there is the likelihood
of the area to emerge as a fast-growing urban centre. Such
areas require immediate interventions to ensure their
developments are guided. As they consolidate, small towns
could be planned with a rather higher and medium density
of buildings with plot sizes between 300 m2
and 1000 m2.
Designations of the status of district administrative centres
can speed the process but may not be the primary factor for
their population growth.
Acknowledgements
I acknowledge the funding received from SIDA for
undertaking this research, and support given by my research
assistant Mr. Jordan Landulila.
Appendix
Table 3. Data Generated and Used for the Analysis.
WARD_NAME Population
Area in (km2) Built-up Area
(km2) Dwellings
Growth rates
1978 1988 2002 2012 1978_1988 1988_2002 2002_2012
Gairo 1878 31198 51339 52578 3.0 10.3 3413 32.5 3.6 0.2
Kisarawe 6081 11788 42662 54053 6.0 3.1 2929 6.8 9.6 2.4
Melela 5423 27121 19984 24559 1124 0.6 217 17.5 -2.1 2.1
Chalinze / Bwilingu 8620 22091 32259 35149 3.6 5.1 2827 9.9 2.7 0.9
Kimanzichana 12070 30888 43546 44172 6.1 3.6 2000 9.9 2.5 0.1
Mtibwa 10170 10851 41269 45890 471.8 3.4 2058 0.7 9.9 1.1
Mafinga 15451 24903 33519 51902 270.6 48.7 5704 4.9 2.1 4.5
Njombe 23828 25213 18643 56912 359.9 48.6 14998 0.6 -2.1 11.8

Urban and Regional Planning 2019; 4(2): 67-78 76
WARD_NAME Population
Area in (km2) Built-up Area
(km2) Dwellings
Growth rates
1978 1988 2002 2012 1978_1988 1988_2002 2002_2012
Kilosa 12887 23500 26131 34425 171.8 12.8 6724 6.2 0.8 2.8
Mikumi 7690 9895 15775 19977 1319 7.1 3347 2.6 3.4 2.4
Mkuranga 10048 15672 26478 25847 228.1 22.8 3750 4.6 3.8 -0.2
Ifakara 22382 29718 45684 55956 265.1 33.6 12360 2.9 3.1 2.05
Dumila / Magole 16386 21054 37967 42242 758.1 8.4 5187 2.5 4.3 1.1
Bagamoyo 18471 22928 31219 43793 765.1 21.9 7069 2.2 2.2 3.4
Msata 6376 8008 9499 13740 840.0 3.1 968 2.3 1.2 3.8
Makambako 34339 26888 56797 69166 253.0 28.0 14897 -2.4 5.5 2.0
Ikwiriri 12436 11268 18967 23136 245.4 9.4 5752 -0.9 3.8 2.0
Kibaha 26574 37638 65485 45083 33.7 99.4 9063 3.5 4.0 -3.7
Ilula 35948 43625 51802 52179 762.3 5.2 3832 2.5 0.3 -0.02
Mlandizi 11431 14242 27066 17318 116.5 17.4 5811 2.2 4.7 -4.4
Kidatu 25091 29991 35293 32589 237.0 7.3 6069 1.8 1.2 -0.8
Kibiti 14373 19067 29067 15156 695.8 7.5 2521 2.9 3.0 -6.3
WARD_NAME Dwelling density
(p/km2)
Planner Distance to
Region city in km
Distance in km to the
next Small town
Land use change
to farms
No.Rivers_10km_r
adius
Administrative
status
Gairo 0.07 116 57 64 4 0
Kisarawe 0.04 26 22 21 5 1
Melela 0 39 39 21 5 0
Chalinze / Bwilingu 0.06 79 77 37 9 0
Kimanzichana 0.02 65 34 21 6 0
Mtibwa 0.04 68 33 29 16 1
Mafinga 0.27 73 71 32 5 1
Njombe 0.31 149 63 29 8 2
Kilosa 0.14 70 40 34 9 2
Mikumi 0.07 99 28 12 4 1
Mkuranga 0.18 34 61 27 5 1
Ifakara 0.26 118 49 30 28 1
Dumila / Magole 0.12 61 41 24 5 0
Bagamoyo 0.15 54 40 18 6 1
Msata 0.02 96 34 49 7 0
Makambako 0.31 147 63 50 5 1
Ikwiriri 0.12 125 25 9 28 0
Kibaha 0.19 31 21 61 9 3
Ilula 0.08 41 42 50 1 0
Mlandizi 0.12 57 26 71 9 0
Kidatu 0.13 120 51 6 5 0
Kibiti 0.05 103 25 39 4 0
WARD_NAME Distance to
estate Farm
Distance to
protected Area
Distance to Crop
Factory
Distance to
agriculture projects.
No. of Road
junctions
Distance to
Railway station
Distance to
Regional _Hospital
Gairo 24 22 110 140 1 59 30
Kisarawe 7 0 148 109 1 8 1
Melela 14 17 59 36 1 32 40
Chalinze / wilingu 10 31 67 55 3 144 69
Kimanzichana 10 12 164 113 1 54 39
Mtibwa 2 6 47 64 1 60 9
Mafinga 1 3 79 52 3 46 1
Njombe 0 10 51 52 3 63 1
Kilosa 1 17 83 34 4 1 7
Mikumi 24 1 120 78 3 7 31
Mkuranga 13 18 172 128 1 35 30
Ifakara 27 1 63 1 3 13 1
Dumila / Magole 1 21 53 26 2 34 31
Bagamoyo 1 6 131 113 2 20 34
Msata 25 16 77 86 2 46 81
Makambako 1 35 1 44 4 11 30
Ikwiriri 1 3 201 143 1 103 5
Kibaha 12 8 136 104 2 1 1
Ilula 30 9 35 40 3 62 1
Mlandizi 1 7 110 89 1 1 26
Kidatu 15 1 126 931 2 20 1
Kibiti 10 9 179 225 1 82 1

77 Ally Hassan Namangaya: Determinants of Population Growth Trends for Tanzanian Small Towns
References
[1] UN-HABITAT, (2009a). The Global Report on Human Settlements: The State of African Cities 2008: A Framework for Addressing Urban Challenges In Africa. UN-Habitat, Nairobi.
[2] UN-HABITAT, (2009b). National Urban Profile, Tanzania, UN-Habitat, Nairobi.
[3] UN-HABITAT, (2009c). Planning Sustainable Cites Human Settlement Reports on experiences of Sustainable Cities Programme. UN-HABITAT, Nairobi.
[4] United Nations Population Division, (2011). World Urbanization Prospects: The 2011 Revision, United Nations Department of Economic and Social Affairs, New York.
[5] Turcotte, M. (2005). Social engagement and civic participation: Are rural and small town populations really at an advantage? (pp. 21-006). Statistics Canada, Agriculture Division.
[6] Kunzmann, K. R. (2010). Medium-sized towns, strategic planning and creative governance. In Making Strategies in Spatial Planning (pp. 27-45). Springer
[7] Shaw, D. (2002). Review Essay Small Towns and Nineteenth-Century Urbanization. Journal of Urban History, 28 (2), 220-230.
[8] Caplan, K. & Harvey, E. (2010): Small Town Water and Sanitation Delivery: Taking a Wider View. WaterAid Report. WaterAid.
[9] Baker, J., & Pedersen, P. (1992). The rural-urban interface in Africa: expansion and adaptation. Nordiska Afrikainstitutet; Centre for Development Research, Copenhagen
[10] Kauzeni, A. S., Kikula, I. S., Mohamed, S. A., Lyimo, J. G., & Dalal-Clayton, D. B. (1993). Land use planning and resource assessment in Tanzania: a case study. IIED environmental planning issues, (3), 132.
[11] Owusu, G. (2005). Small Towns in Ghana: Justifications for their Promotion under Ghana's Decentralisation Programme; African Studies Quarterly, 8 (2).
[12] Kombe, W. J. (2005). Land use dynamics in peri-urban areas and their implications on the urban growth and form: the case of Dar es Salaam, Tanzania. Habitat International, 29 (1), 113-135.
[13] Halla, F. (2005). Critical elements in sustaining participatory planning: Bagamoyo strategic urban development planning framework in Tanzania. Habitat International, 29 (1), 137-161.
[14] UNFPA (United Nations Fund for Population Activities). (2008). Linking population, poverty and development. UNFPA Population Issues. Available via https://www.unfpa.org/pds/urbanization.htm. Accessed 13 Mar 2014.
[15] Wisner, B., Pelling, M., Mascarenhas, A., Holloway, A., Ndong, B., Faye, P., & Simon, D. (2015). Small Cities and Towns in Africa: Insights into Adaptation Challenges and Potentials. In Urban Vulnerability and Climate Change in Africa (pp. 153-196. Springer International Publishing.
[16] Hanna, K. S., Dale, A., & Ling, C. (2009). Social capital and
quality of place: Reflections on growth and change in a small town. Local Environment, 14 (1), 31-44.
[17] Meijers, E. J., Burger, M. J., & Hoogerbrugge, M. M. (2016). Borrowing size in networks of cities: City size, network connectivity and metropolitan functions in Europe. Papers in Regional Science, 95 (1), 181-198.
[18] Waitt, G., & Gibson, C. (2009). Creative Small Cities: Rethinking the Creative Economy in Place. Urban Studies, 46 (5-6), 1223–1246.
[19] Sharma, K. (2012). Rejuvenating India’s Small Towns. Economic & Political Weekly, 47 (30), 63-68.
[20] Tanzania National Audit Office (2014). Performance Audit Report on the Management of Urban Planning in Tanzania. Dar es Salaam Government Press.
[21] Kyessi, A. (2013). Planning of Border Towns: The Case of Strategic Urban Development Plan for Tunduma Township, Mbeya Region, Tanzania, Paper Presented at a Research Workshop on Transborder Urban Networks and Urban/Regional Dynamics in Africa, held at the Nordic Africa Institute, Uppsala, Sweden, December 2-3, 2013.
[22] Chigara, B; Magwaro-Ndiweni, L; Mudzengerere, F. H & Ncube, A. B. (2013). An Analysis of the Effects of Piecemeal Planning on Development of Small Urban Centres in Zimbabwe: Case Study of Plumtree, International Journal of Management and Social Sciences Research, 2 (4), 139-148.
[23] Halsall, J. (2012). Community Governance – Where did it all go wrong? Journal of Administration and Governance JOAAG, 7 (2), 1-8.
[24] Huang, C., Namangaya, A., Weber, M., & Cantada, I. (2017) Urban Planning Study for Tanzania – Impact and Effectiveness of Urban Planning on City Spatial Development. World Bank Group.
[25] Bell, D., & Jayne, M. (2009). Small Cities? Towards a Research Agenda. International Journal of Urban and Regional Research, 33 (3), 683–699.
[26] Pacione, M. (2009). Urban geography–a global perspective, Routledge. New York.
[27] Maier, K. (2005). Czech housing estates: Recent changes and new challenges. Geographia Polonica, 78 (1), 39.
[28] Steinführer, A., Vaishar, A., & Zapletalová, J. (2016). The small town in rural areas as an underresearched type of settlement. Editors’ introduction to the special issue. European Countryside, 8 (4), 322-332.
[29] Zuzanska-Zysko, E. (2005). Economic transformation of small Silesian towns in the years 1990-1999. Geographia Polonica, 78 (1), 137.
[30] Raman, B. (2017). Practices of territory in small and medium cities of South India. In Subaltern urbanisation in India (pp. 235-260). Springer, New Delhi.
[31] Pryadko, I. (2018). Development of small Russian towns in the 19th–21st centuries: socioeconomic factors. In MATEC Web of Conferences (Vol. 193, p. 01019). EDP Sciences.
[32] Muzzini, E., & Lindeboom, W. (2008). The urban transition in Tanzania. Building the Empirical Base for Policy Dialogue, 1-166.

Urban and Regional Planning 2019; 4(2): 67-78 78
[33] United Republic of Tanzania (URT).(2000). Human Settlement Development policy. Government Publisher, Dar es Salaam.
[34] Rebernik, D. (2005). Urbanization trends and processes of population change in the Ljubljana urban region in the 1990s. Geographia Polonica, 78 (1), 67.
[35] Gordon, P., & Richardson, H. W. (1997). Are compact cities a desirable planning goal?. Journal of the American planning association, 63 (1), 95-106.
[36] Geyer, H. S., & Kontuly, T. (1993). A theoretical foundation for the concept of differential urbanization. International Regional Science Review, 15 (2), 157-177.
[37] Gwebu, T. D. (2006). Towards A Theoretical Exploration of the Differential Urbanisation Model In Sub-Saharan Africa: The Botswana Case. Tijdschrift Voor Economische En Sociale Geografie, 97 (4), 418–433.
[38] Namangaya, A. (2014). Urban Spatial Planning and Local Economic Development: Comparative Assessment of Practice in Tanzanian Cities: International Journal of Business, Humanities and Technology, 4 (6).
[39] Krumholz, N. (2008). Equitable Approaches to Local Economic Development: in Scott, B. and Faistein, S. (2008). Readings in Planning Theory: Blackwell, Oxford. Glaser, B. G. (1999). The future of grounded theory. Qualitative health research, 9 (6), 836-845.
[40] National Audit Office of Tanzania -NOAT-(2019). Special Audit Report until March 2019: Government Publisher.
[41] Mrema, A. (2015). Contribution of tourist hotels in the socio-economic development of local communities in Monduli District, Northern Tanzania. Journal of Hospitality Management and Tourism, 6 (6), 71-79.
[42] Meijers, E. J., & Burger, M. J. (2017). Stretching the concept of ‘borrowed size’. Urban Studies, 54 (1), 269-291.
[43] Fujita, M. & Thisse, J. (2002) Economics of Agglomeration: Cities, Industrial Location, and Regional Growth. Cambridge University Press.
[44] Deng, X., Huang, J., Rozelle, S., Zhang, J., & Li, Z. (2015). Impact of urbanization on cultivated land changes in China. Land use policy, 45, 1-7.
[45] Masron, T., Yaakob, U., Ayob, N. M., & Mokhtar, A. S. (2017). Population and spatial distribution of urbanisation in Peninsular Malaysia 1957-2000. Geografia-Malaysian Journal of Society and Space, 8 (2).
[46] Nel, E., Taylor, B., Hill, T., & Atkinson, D. (2011). Demographic and economic changes in small towns in South Africa’s Karoo: Looking from the inside out. In Urban Forum (Vol. 22, No. 4, p. 395). Springer.