Determinants of physical fitness in prepubescent … of... · activity (3$) with strength variables...
135
UNIVERSIDADE DA BEIRA INTERIOR Ciências Sociais e Humanas Determinants of physical fitness in prepubescent children and its training effects Carlos Jorge Soares de Aquino Cavaleiro Marta Tese para obtenção do Grau de Doutor em Ciências do Desporto (3º ciclo de estudos) Orientador: Prof. Doutor Mário C. Marques Co-orientador: Prof. Doutor Daniel A. Marinho Covilhã, Abril de 2013
Transcript of Determinants of physical fitness in prepubescent … of... · activity (3$) with strength variables...

UNIVERSIDADE DA BEIRA INTERIOR Ciências Sociais e Humanas
Determinants of physical fitness in prepubescent
children and its training effects
Carlos Jorge Soares de Aquino Cavaleiro Marta
Tese para obtenção do Grau de Doutor em
Ciências do Desporto (3º ciclo de estudos)
Orientador: Prof. Doutor Mário C. Marques Co-orientador: Prof. Doutor Daniel A. Marinho
Covilhã, Abril de 2013
ii
Marta, C. (2013). Determinants of physical fitness in prepubescent children and its training
effects. University of Beira Interior, Research Centre in Sport, Health and Human
Development.
KEY WORDS: YOUTH, PHYSICAL FITNESS, SOMATOTYPE, MUSCLE POWER, ENDURANCE,
CONCURRENT TRAINING, GENDER DIFFERENCES

iii
“Um desistente nunca ganha e um vencedor nunca desiste.”
Napoleon Hill
Academic dissertation submitted with the purpose of obtaining a doctoral degree in Sport
Sciences according to the provisions of Portuguese Decree-Law 107/2008 of 25 June.

iv

v
Acknowledgements
I would never have been able to finish this study without the guidance of my thesis advisors,
help from friends, and support from my family.
A special thanks to Professors Mário Marques and Daniel Marinho, for their excellent guidance,
patience, and constant encouragement and counseling.
A very big thank you to all the students who participate in this research. This work wouldn’t
be possible without their dedication.
I would also like to thank Professors Mikel Izquierdo, Tiago Barbosa, and Natalina Casanova.
This research would not have been possible without their cooperation.
Finally, I would like to thank my son Gui and my wife Mané. They were always there cheering
me up and stood by me through the good and bad times.

vi

vii
List of Publications
This Doctoral Thesis was supported with the following papers:
Marta C, Marinho DA, Marques MC. Physical fitness in prepubescent children: an update.
Accepted for publication in the Journal of Physical Education and Sport.
Marta C, Marinho DA, Costa AM, Barbosa TM, Marques MC. Somatotype is more interactive
with strength than fat mass and physical activity in peripubertal children. Journal of Human
Kinetics 2011; Special Issue: 83-91.
Marta C, Marinho DA, Barbosa TM, Izquierdo M, Marques MC. Physical fitness differences
between prepubescent boys and girls. Journal of Strength and Conditioning Research
[Published Ahead of Print] DOI: 10.1519/JSC.0b013e31825bb4aa
Marta C, Marinho DA, Barbosa TM, Izquierdo M, Marques MC. Effects of body fat and dominant
somatotype on explosive strength and aerobic capacity trainability in prepubescent children.
Submitted for publication to Pediatric Exercise Science.
Marta C, Marinho DA, Barbosa TM, Izquierdo M, Marques MC. Effects of concurrent training on
explosive strength and VO2max in prepubescent children. Submitted for publication to
International Journal of Sports Medicine.

viii

ix
Table of Contents
Index of Figures xi
Index of Tables xiii
Abstract xv
Resumo xvii
Resumen xix
List of Abbreviations xxi
Chapter 1. General Introduction 1
Chapter 2. Review of Literature 5
Study 1. Physical fitness in prepubescent children: an update 5
Chapter 3. Experimental Studies 23
Study 2. Somatotype is more interactive with strength than fat mass and
physical activity in peripubertal children
23
Study 3. Physical fitness differences between prepubescent boys and girls 33
Study 4. Effects of body fat and dominant somatotype on explosive
strength and aerobic capacity trainability in prepubescent children
51
Study 5. Effects of concurrent training on explosive strength and VO2max in
prepubescent children
63
Chapter 4. General Discussion 77
Chapter 5. Conclusions 83
Chapter 6. Suggestions for future research 85
Chapter 7. References 87

x
xi
Index of Figures
Study 3
Figure 1. Scatterplot between Dimension 1 and Dimension 2 by sex 46
Figure 2. Scatterplot between Dimension 2 and Dimension 3 by sex 46
Study 4
Figure 1. Effect size of fat mass, endomorphic, mesomorphic and ectomorphic on
training-induced explosive strength gains: boys and girls
58
Figure 2. Effect size of fat mass, endomorphic, mesomorphic and ectomorphic on
training-induced VO2max gains: boys and girls
59
Study 5
Figure 1. Counter movement jump (cm) by group 71
Figure 2. Standing long jump (cm) by group 71
Figure 3. 1kg ball throwing (cm) by group 71
Figure 4. 3kg ball throwing (cm) by group 71
Figure 5. Time-at-20m (sec) by group 72
Figure 6. VO2max (ml.kg-1.min-1) by group 72
Figure 7. Counter movement jump (cm) by sex 72
Figure 8. Standing long jump (cm) by sex 72
Figure 9. 1kg ball throwing (cm) by sex 72
Figure 10. 3kg ball throwing (cm) by sex 72
Figure 11. Time-at-20m (sec) by sex 73
Figure 12. VO2max (ml.kg-1.min-1) by sex 73

xii

xiii
Index of Tables
Study 2
Table 1. Descriptive data of FAT, BMI, ENDO, MESO, ECTO, PA and muscle
strength variables
25
Table 2. Correlations between % of FAT, ENDO, MESO, ECTO, PA and strength
variables
27
Table 3. Comparison between different BMI groups with respect to muscle
strength variables
28
Table 4. Comparison between different TYPE groups with respect to strength
variables
28
Table 5. Interaction of morphological type (TYPE), body fat (% FAT) and physical
activity (PA) with strength variables: GLM‐MANOVA test
29
Study 3
Table 1. Descriptive data of anthropometric and morphological parameters,
physical activity indexes and physical performance measures: Overall sample
37
Table 2. Gender`s difference in physical performance: Adjusted means after
MANCOVA
43
Table 3. Effect of the somatotype, physical activity and body fat factors on the
physical performance of boys and girls: MANCOVA
44
Table 4. Statistical significance and effect size of sex on the physical
performance variables: ANCOVA
44
Table 5. Correlations between canonical coefficients and variables 45
Study 4
Table 1. Training program design 54
Table 2. Comparison of explosive strength and endurance tests results mean
(±SD) between experimental and control groups in pre- (T0) and post-test (T1)
conditions: Boys and girls
57
Table 3. Pearson`s correlation between percentage of fat mass (%BF),
endomorphic (END), mesomorphic (MES), ectomorphic (ECT), and explosive
strength and VO2max gains: Boys and girls
58

xiv
Study 5
Table 1. Descriptive data of the control (GC), resistance (GR) and concurrent
(GCON) groups in pre-test condition: Boys and girls (Mean ± SD)
66
Table 2. Training program design 69
Table 3. Evolution of the explosive strength and VO2max from pre- to the post-
training: ANOVA
70
xv
Abstract
The purpose of this investigation was to analyze the effect of somatotype, body fat and
physical activity on overall physical fitness, explosive strength and aerobic capacity
trainability in prepubescent children. Additionally, it was intended to identify the magnitude
of the differences between boys and girls in physical fitness, and the effects of concurrent
training on explosive strength and VO2max adaptations. For the accomplishment of these
purposes the following sequence was used: (i) reviewing available literature; (ii) analyzing the
interaction between somatotype, body fat, physical activity and physical fitness in
prepubescent children; (iii) identifying physical fitness differences between boys and girls;
(iv) analyzing the interaction between somatotype, body fat and training-induced explosive
strength and VO2max gains; (v) and comparing the effects of 8-weeks training period of
strength training alone, or combined strength and aerobic training on explosive strength and
VO2max adaptations. Results suggest that: (i) somatotype is the most important variable
determining overall physical fitness, and training-induced explosive strength and VO2max gains,
in boys and girls; (ii) boys present higher values in muscular strength and endurance, velocity
and aerobic capacity, and girls perform better on tests of balance and flexibility. Gender
differences in the physical fitness are greater in the explosive strength and smaller in the
muscular endurance and flexibility, followed by velocity and balance; (iii) performing
strength and aerobic training in the same workout does not impair strength development, and
allows similar neuromuscular adaptations in prepubescent boys and girls.
Key words
Youth, Physical Fitness, Somatotype, Muscle Power, Endurance, Concurrent Training, Gender
Differences

xvi

xvii
Resumo
Este estudo pretendeu analisar o efeito do somatótipo, gordura corporal e atividade física na
aptidão física geral, no treino de força explosiva e na capacidade aeróbia, em crianças pré-
pubertárias. Adicionalmente pretendeu-se identificar a magnitude das diferenças na aptidão
física entre rapazes e raparigas, e os efeitos do treino concorrente na força explosiva e
VO2max. Para se alcançar estes objetivos foram adotados os seguintes passos: (i) revisão da
literatura; (ii) análise da interação do somatótipo, gordura corporal, atividade física e aptidão
física em crianças pré-púberes; (iii) identificação das diferenças na aptidão física entre
rapazes e raparigas; (iv) análise da interação do somatótipo, gordura corporal e ganhos de
força explosiva e VO2max induzidos pelo treino; (v) e comparação do efeito de um período de
treino de oito semanas exclusivamente de força, e treino combinado de força e endurance na
força explosiva e VO2max. Os resultados sugerem que: (i) o somatótipo é a variável que mais
influencia a aptidão física geral, e os ganhos de força explosiva e VO2max induzidos pelo treino,
quer em rapazes, quer em raparigas; (ii) os rapazes apresentam melhor performance na força
e resistência muscular, velocidade e capacidade aeróbica, e as raparigas têm melhor
desempenho em testes de equilíbrio e flexibilidade. Diferenças de género na aptidão física
são maiores na força explosiva e menores na resistência muscular e flexibilidade, seguidas da
velocidade e equilíbrio; (iii) realizar treino combinado de força e endurance na mesma sessão
de trabalho não prejudica o desenvolvimento da força, e permite adaptações
neuromusculares semelhantes em rapazes e raparigas pré-púberes.
Palavras-chave
Juventude, Aptidão Física, Somatótipo, Potência Muscular, Endurance, Treino Concorrente,
Diferenças de Género

xviii

xix
Resumen
Este estudio ha tenido como objetivo analizar el efecto del somatotipo, de la grasa corporal y
la actividad física en la condición física general, en el entrenamiento de fuerza explosiva y en
la resistencia aeróbica en niños prepúberes. Además se ha pretendido identificar la magnitud
de las diferencias en la condición física entre niños y niñas y los efectos del entrenamiento
combinado en la fuerza explosiva y VO2max. Para lograr estos objetivos se han dado los
siguientes pasos: (i) revisión de la literatura; (ii) análisis de la interacción del somatotipo, de
la grasa corporal, actividad y condición física en niños prepúberes; (iii) identificación de las
diferencias en la condición física entre niños y niñas; (iv) análisis de la interacción del
somatotipo, de la grasa corporal y del aumento de la fuerza explosiva y VO2max inducidos por
el entrenamiento; (v) y comparación del efecto de un periodo de entrenamiento de ocho
semanas sólo de fuerza y entrenamiento combinado de fuerza y resistencia en la fuerza
explosiva y VO2max. Los resultados sugieren que: (i) el somatotipo es la variable que más
influye en la condición física general, el aumento de fuerza explosiva y VO2max inducidos por
el entrenamiento, sea en niños o en niñas; (ii) los niños presentan mejor rendimiento en la
fuerza y resistencia muscular, velocidad y resistencia aeróbica, ya las niñas son mejores en
pruebas de equilibrio y flexibilidad. Las diferencias de género en la condición física son
mayores en la fuerza explosiva y menores en la resistencia muscular y flexibilidad, seguidas
de la velocidad y del equilibrio; (iii) realizar entrenamiento combinado de fuerza y resistencia
en la misma sesión de trabajo no afecta el desarrollo de la fuerza y permite adaptaciones
neuromusculares similares en niños y niñas prepúberes.
Palabras clave
Jóvenes, Condición Física, Somatotipo, Potencia Muscular, Resistencia, Entrenamiento
Concurrente, Diferencias de género

xx

xxi
List of Abbreviations
BF body fat
%BF percent body fat
BMI body mass index
ECTO ectomorphic
ENDO endomorphic
%FAT percentage of fat mass
GC control group
GCON concurrent training group
GE endurance group
GR resistance group
MESO mesomorphic
M‐K Margaria‐Kalamen power stair test
PA physical activity
TYPE morphological typology

xxii

1
Chapter 1. General Introduction
Physical fitness has been recognized as a key determinant in healthy lifestyles based
increasingly on criteria referenced to general health and not merely to motor performance
(Ortega et al., 2007). It is related, among others, with lower prevalence of cardiovascular
disease risk factors, reduces total and abdominal adiposity, improves mental and skeletal
health and increases academic performance (Kvaavik et al., 2009; Ortega et al., 2007).
Furthermore, physical fitness levels track from childhood to adolescence and from
adolescence to adulthood (Stratton et al., 2008; Twist et al., 2000).
The recognition that physical fitness is a major marker of health status at any age (Ortega et
al., 2007) has produced a wide range of studies on the influence of various factors on physical
fitness levels, in particular the influence of body fat and physical activity (Artero et al., 2010;
D'Hondt et al., 2009; Dumith et al., 2010; Lennox et al., 2008). However, there are few
studies (Jakšić & Cvetkovic, 2009; Shukla et al., 2009; Suchomel, 2002) that link somatotype
with fitness in young people. Most studies in this context refer to the influence of body mass
index in the motor performance in youth, but somatotype has been found to be inherited to a
greater extent than body mass index (Reis et al., 2007). One cannot exceed the limits
imposed by what is a manifestation of genetic determinism, observed from the morpho-
constitutional point of view, and there is evidence that by pre-puberty there already exists a
fairly stable somatotype, pointing to 8 years as the age by which somatotype stability
becomes manifest (Malina et al., 2004). Hence it seems relevant to examine, in this age
group, the effect of the presence/absence of certain physical traits on the motor
performance, and compare it with the effect of body fat and physical activity, often
referenced in the literature (Study 2 and Study 3). On the other hand, physical fitness is
often erroneously used as a synonym for aerobic fitness rather than as an umbrella term to
embrace all health-related fitness components (Hands et al., 2009). The majority of studies
on the physical fitness focuses on the aerobic capacity, neglecting the muscular fitness
(Cepero et al., 2011), but there exist evidence that the neuromotor aptitude based on the
muscular force can be as important as the aerobic capacity in the maintenance of the health
(Armstrong & Welsman, 1997). As such, it will be relevant to analyze specifically the
interaction of physical activity, body fat, somatotype and strength development in
prepubescent children (Study 2).
Unfortunately, there exist evidences suggesting that physical fitness has declined worldwide
in the last decades among children and adolescents (Matton et al., 2007; Tomkinson, 2007).
Thus, efforts to promote physical fitness levels in youth should be a priority (Cepero et al.,
2011). One of the pointed reasons for the decreased levels of physical fitness and physical
General Introduction
2
activity is that there is an apparent avoidance of children of the physical education classes
and regular physical activity (Roetert, 2004). This decrease in the interest of children in
physical activity and sport is due, in part, to lack of planning that takes into account the
interest, motivation and success of children in the execution of the exercises, respecting the
differences between them, including gender differences (Haff, 2003). Physical education
classes or extracurricular activities commonly include children of both sexes. This requires
teachers, coaches and trainers to establish a match between the goals they want to achieve
and the means and resources available, taking into account the various constraints that may
arise, such as reduced practice time per session, number of weekly sessions, lack of material
resources and facilities, high numbers of students/athletes by class and variety of content to
be taught, often involving the same activities for boys and girls alike.
In this respect, beyond the duty of the teacher and coaches to maximize the opportunities for
practice, it is necessary to program the exercises in order to make them appealing and
motivating for both boys and girls (NIH, 1996). The psychological saturation and physiological
enervation that may attend on attempts to match results close to those achieved by opposite-
sex colleagues in the same exercise can be alleviated when there is knowledge about which
exercises and the respective capabilities they deploy can be best performed concurrently by
boys and girls. One of the major reasons why many children drop out of sport and physical
activity is that they feel they do not have the necessary skills to be involved. Both girls and
boys tend to be reluctant to participate if their perceived level of skill is low. The proof of
this is that female students reported more positive and adaptive perceptions in same-sex
classes (Lyu & Gill, 2011). The knowledge, not only of the physical capabilities in which boys
and girls are higher, but the magnitude of the differences between them, can help teachers,
coaches and trainers in the planning and organizing of activities that take into account the
success of both boys and girls, and thus, increase levels of physical activity and physical
fitness (Study 3).
In children, because of low aerobic capacity is associated with risk factors of cardiovascular
disease (Anderssen et al., 2007), a great amount of research has focused on activities that
enhance cardiorespiratory fitness (Cepero et al., 2011). However, it is recognized that youth
strength training approaches can be a safe and effective method of conditioning and should
be an important component of youth fitness programs, health promotion objectives, and
injury prevention (American Academy of Pediatrics, 2008; Faigenbaum et al., 2009). Indeed,
improvements in muscular fitness and speed/agility, rather than cardiorespiratory fitness,
seem to have a positive effect on skeletal health (Ortega et al., 2007). Increasing both
aerobic and muscular fitness is essential for promoting health (American College of Sports
Medicine, 2007) and should be a desirable goal in a training program (Taanila et al., 2011).

General Introduction
3
In order to maximize the benefits of training, some studies have reported the influence of
several variables in the implementation of training programs in children and adolescents, such
as the training program supervision, instruction quality and control learning, gender, age and
maturity (Behringer et al., 2011; Faigenbaum et al., 2009). Nevertheless, the influence of
body fat and somatotype on the effects of the implementation of training programs in young
people still needs to be investigated. Body fat represents an inert load, non-contributive,
associated with an increased metabolic cost (Norman et al., 2005) and the somatotype
translates the expression of genetic determinism, observed from the morpho-constitutional
point of view (Malina & Bouchard, 1991). These factors, therefore, may influence the
execution of the planned exercises, training intensity and recovery of the performers,
resulting in different effects of applying a particular training program. Additionally, both
body fat and somatotype are significantly associated with the level of physical fitness
achieved (Dumith et al., 2010; Jakšić & Cvetković, 2009), which appears to influence, in turn,
the development of training programs in children and adolescents (Faigenbaum et al., 2009).
Thus, the knowledge of the effects of body fat and somatotype on training-induced strength
and endurance gains can help in designing and application of training programs for young
people, in order to improve its efficiency (Study 4).
What often happens is that strength and endurance training are regularly performed
concurrently at school or extracurricular activities (Santos et al, 2012), as well as in most
exercise programs in wellness, fitness, and rehabilitative settings in an attempt to obtain
gains in more than 1 physiologic system to achieve total conditioning, to meet functional
demands, or to improve several health-related components simultaneously (Shaw et al.,
2009). During several decades, many studies have reported an interference effect on muscle
strength development when strength and endurance were trained concurrently. The majority
of these studies found that the magnitude of increase in strength was higher in the group that
performed only strength training compared with the concurrent training group, commonly
referred to as the “interference phenomenon” (García-Pallarés & Izquierdo 2011). However,
there exists a relative paucity of published reports focused on the implementation of
concurrent strength and endurance training in school children (Izquierdo-Gabarren et al.,
2010, García-Pallarés & Izquierdo 2011). A recent study showed that performing strength and
endurance training in the same workout does not impair strength development in adolescent
schooled boys (Santos et al., 2012). However, the effects of concurrent strength and
endurance training in prepubescent children, according to our best knowledge, have yet to be
investigated. On the other hand, physical education classes or extracurricular activities
commonly include children of both sexes, as mentioned above. Therefore, it is important to
verify the applicability of a concurrent training program in age-school boys and girls (Study
5).

General Introduction
4
Considering the abovementioned, the aim of this thesis was to analyze the effect of
somatotype, body fat and physical activity on overall physical fitness, explosive strength and
aerobic capacity trainability in prepubescent children. An additional objective was to identify
the magnitude of the differences between boys and girls in physical fitness, and the effects of
concurrent training on explosive strength and VO2max adaptations.

5
Chapter 2 – Review of Literature
Study 1
Physical fitness in prepubescent children: an update
Abstract
This article provides a brief review over the state of art concerning some factors that
influence physical fitness levels in children, namely the role of body fat, physical activity and
somatotype, and how physical fitness might be improved, particularly in terms of strength
and cardiorespiratory fitness. The major research conclusions can be summarized as follows:
(i) there are significant and positive associations between physical activity levels and physical
fitness; (ii) there is a negative relationship between body fat and performance on both
endurance and weight-bearing tasks, whereas flexibility does not seem to differ significantly
between overweight or obese children and normal-weight peers. Absolute handgrip strength
appears to be better in obese children; (iii) by pre-puberty there already exists a fairly stable
somatotype; (iv) Endomorphic is a limiting factor in body propulsion and lifting tasks.
Mesomorphic is positively associated with strength and motor performance in general. The
associations for ectomorphic were the inverse of those for endomorphic and mesomorphic; (v)
the boys are superior in tasks that require strength, speed and endurance, and the girls on
tasks with a predominance of balance, coordination and flexibility; (vi) the girls have higher
levels of body fat than boys; (vii) the boys have higher and consistent levels of physical
activity than girls; (viii) with an intensive training stimulus prepubescent children show
improvements in aerobic capacity compared with controls of the same maturation; and (ix)
strength training can be an effective and safe way for enhancing muscle strength in
prepubescent children.
Key words: youth, body fat, physical activity, somatotype, performance

Physical fitness in prepubescent children
6
Introduction
Physical fitness is a major marker of health status at any age (Ortega et al., 2007). The
recognition that physical fitness is a key determinant in healthy lifestyles based increasingly
on criteria referenced to general health and not merely to motor performance has produced a
wide range of studies on the influence of various factors on physical fitness levels, in
particular the influence of body fat and physical activity. However, there are few studies that
link somatotype with fitness in young people. Most studies in this context refer to the
influence of body mass index in the motor performance in youth, but somatotype has been
found to be inherited to a greater extent than body mass index (Reis et al., 2007).
Unfortunately, there exist evidences suggesting that physical activity (WHO, 2010) and
physical fitness (Matton et al., 2007) has declined worldwide in the last decades among
children. One of the pointed reasons for this decreased levels is that there is an apparent
avoidance of children of the physical education classes and regular physical activity (Roetert,
2004) due, in part, to lack of planning that takes into account the interest, motivation and
success of children in the execution of the exercises, respecting the differences between
them, including gender differences (Haff, 2003). Physical education classes or extracurricular
activities commonly include boys and girls, and this requires teachers, coaches and trainers to
establish a match between the goals they want to achieve and the specificity of each gender
(NIH, 1996).
Because of the low aerobic capacity in children is associated with risk factors of
cardiovascular disease (Anderssen et al., 2007), the majority of the research has focused on
activities that enhance cardiorespiratory fitness disregarding, for instance, neuromotor
fitness conditions based on muscular strength (Cepero et al., 2011). However, it is recognized
that youth strength training can be a safe and effective method of conditioning and should be
an important component of youth fitness programs, health promotion objectives, and injury
prevention (Faigenbaum et al., 2009). Increasing both aerobic and muscular fitness is
essential for promoting health and should be a desirable goal in a training program (Taanila et
al., 2011).
What often happens is that resistance and endurance training are regularly performed
concurrently at school or extracurricular activities (Santos et al, 2012), as well as in most
exercise programs in wellness, fitness, and rehabilitative settings in an attempt to obtain
gains in more than 1 physiologic system to achieve total conditioning, to meet functional
demands, or to improve several health-related components simultaneously (Shaw et al.,
2009). So it is important to know if performing resistance and endurance training in the same
workout does not affect strength development in children, usually referred to as
“interference phenomenon” (García-Pallarés & Izquierdo 2011).
Physical fitness in prepubescent children
7
Physical fitness
The term physical fitness is often erroneously used as a synonym for aerobic fitness rather
than as an umbrella term to embrace all health-related fitness components (Hands et al.,
2009). Physical fitness in children has been defined as the aptitude to realize physic tasks
without fatigue related to the cardiorespiratory general resistance, muscular specific
resistance, and the levels of muscular force, extent of movement, speed and coordination
(Deforche et al., 2003). The majority of studies on the physical fitness centered on the
aerobic capacity, neglecting the neuromotor aptitude based on the muscular force, flexibility
and speed (Cepero et al., 2011). However, the improvements in the muscular capacity, the
speed and agility, instead of the aerobic capacity, seem to have a positive effect on the
musculoskeletal health. Armstrong and Welsman (1997) reported that the neuromotor system
can be as important as the aerobic capacity in the maintenance of the health.
Fitness has been proposed as a major marker of health status at any age (Ortega et al., 2007),
and is considered to be important supportive element for the maintenance and enhancement
of health and quality of life, and hence for the improvement of the holistic development of a
child (Malina, 2001). Physical fitness is associated with lower prevalence of cardiovascular
disease risk factors, improves mental and bone health, increases academic performance,
improves motor skills, and protects against all-cause mortality (Kvaavik et al., 2009; Van
Dusen et al., 2011). It also relates with psychophysical, cognitive, social and affective-
emotional factors (Weineck, 2003). In addition, a strong relationship exists between physical
fitness, especially cardiorespiratory fitness, and various measures of fatness in children and
adolescents (Ruiz et al., 2006).
Physical fitness levels
There is evidence suggesting that physical fitness has declined worldwide in the last decades
among children and adolescents (Matton et al., 2007). However, there is a lack of updated
data (Luguetti et al., 2010). There are evidences that pointed out a decline in strength and
cardiorespiratory fitness about 0.36% per year, since the decade of the 70th, related to social,
behavioral, physical, physiological and psychological factors (Tomkinson & Olds, 2007). In a
recent study, Luguetti et al. (2010) rated the performance of 7- to 16-years-old children
(normative tables: PROESP-BR) in 9-min running, long jump, medicine-ball throwing and 1-min
curl-ups. They observed a poor performance (often exceeding 50%) in all tests, for both boys
and girls, particularly in girls. Physical fitness levels in children are influenced by factors such
as age, sex, body composition, physical activity levels and biological maturity status (Huang &
Malina, 2007). Additionally, children who are competent in the accomplishment of the motor
skills took part more in the type of activities that can improve his/her levels of physical
fitness (Barnett et al., 2008).

Physical fitness in prepubescent children
8
Regarding the differences between boys and girls in the motor performance, several studies
have shown a superiority of boys in tasks that require strength, speed and endurance, and the
girls on tasks with a predominance of balance, coordination and flexibility (Castro-Piñero et
al., 2009; Cepero et al., 2011; Dumith et al., 2010).
Physical activity
Physical activity is widely recognized as an important behavioral characteristic for health
promotion and disease prevention. However, a large portion of the population is not active
enough to obtain these health benefits (WHO, 2010). In the contemporary society there are
many requests for sedentary practices and simultaneously for the consumption of highly
energetic food. Silently, the individuals are conducted to increasingly sedentary standards of
living (Marshall et al., 2002), with a consequent increase of the risk factors for the
development of many chronic hypokinetic diseases. And if the problem used to be centered
on adults, the incidence in children has grown substantially. Children who have a physically
active life can get a set of health benefits, including: reduction of the risk of cardiovascular
disease (Andersen et al., 2006) and hypertension (Sarzynski, et al., 2010), low incidence of
diabetes (Gaya et al., 2009), increased bone mineralization (Hind & Burrows, 2007),
prophylactic action of disorders of the musculoskeletal system (Prentice et al., 2006);
psychological well-being, and higher academic performance (Sallis et al., 2000).
Physical activity levels
It is known that the level of physical activity among young people has been decreasing
considerably, and is currently below the commonly recommended (Sallis et al., 2009; WHO,
2010). For many young people the school-based physical education classes are the only way of
undertaking physical activity (Coleman et al., 2004), but unfortunately, it has been observed
that there is an apparent avoidance of children of the physical education classes and regular
physical activity practice at school (Roetert, 2004). Portuguese children have one of the
lowest rates of physical activity in European Union (Janssen et al., 2005).
There are a number of factors positively associated with the levels of physical activity in
youth, including self-efficacy in one’s ability to overcome barriers to physical activity,
perceptions of physical or sport competence, having positive attitudes toward physical
education, enjoying physical activity, and parent, sibling, and peer support (Sallis et al.,
2000). There are other factors that may influence levels of physical activity, such as the socio
economic and cultural environment (Kriska, 2000). Also the availability of outdoors play
spaces, such as parks and playgrounds, may be especially important because time spent
outdoors is strongly correlated to physical activity (Tudor-Locke et al., 2001).

Physical fitness in prepubescent children
9
Regardless of the recommendations transmitted by different international organizations, the
need for all children and adolescents perform a minimum of 60 min of moderate-to-vigorous
physical activity, in most days of the week, and preferably every day, is unanimously
accepted (Pate et al., 2002; WHO, 2010). The National Association for Sport and Physical
Education (2004) add the need to accumulate peak intensity of 15 or more minutes per day.
According to the British Association of Sport and Exercise Sciences (O`Donovan et al., 2010),
children and adolescents aged 5–16 years should accumulate at least 60 min of moderate-to-
vigorous intensity activity per day, including vigorous-intensity aerobic activities that improve
bone density and muscle strength. Although there are some evidence of a greater
participation of boys in sports activity, especially with vigorous intensity, and girls in leisure
activities and low intensity, in general males have higher and consistent levels of physical
activity than females (Dencker et al. 2010).
Association between physical activity and physical fitness
In children, the strong and positive association between physical activity and physical fitness
that occurs in adults is not so evident, and there is some controversy in studies. To this
contributes a number of factors that hinder the clarification of the relationship between
physical activity and physical fitness, including the difficulty in measuring the daily physical
activity from large samples, the lack of longitudinal studies, the lack of consensus about the
validity of different assessment methods, the various definitions of physical activity and the
difficulty of assessing accurately the intensity of the physical activity (Twist et al., 2000).
Cardiorespiratory fitness has often been considered the best indicator of individual fitness,
since it indirectly favors the other capabilities (Costa et al., 2000). This fact has motivated
many studies about the relationship between physical activity and aerobic fitness in young
people, and cross-sectional epidemiological studies have shown significant associations
between these two variables, although the strength of the relationship has been generally
weak. Graf et al. (2004) evaluated 668 German children (mean age 7.6 years) in their
patterns of physical activity (questionnaire) and 6 min running. They noted that more active
children were significantly better in the selected test. Dencker et al. (2006) evaluated the
relationship between daily physical activity of 248 Swedish children, from 8 to 11 years old,
and VO2max (cycle ergometer). They found significant and positive associations between total
physical activity and VO2max (r = .23, boys and girls). Ara et al. (2007) explored the possible
contribution of physical activity (participation in extra-curricular physical activity) in the
results of the EUROFIT test battery, of 7- to 10-years-old Spanish children. The results showed
that physical activity was positively related to the performance in the 12-min walking/
running test. In the United States of America, a sample of 230 children between 7 and 12
years old, representative of the Illinois area, was evaluated by the FITNESSGRAM test battery,
physical activity (questionnaire, interview and pedometers) and motor skills tests (Castelli &
Physical fitness in prepubescent children
10
Valley, 2007). The results showed that daily physical activity was significantly associated with
FITNESSGRAM test battery (r = .28 to .46), namely the performance in the 20-m Multistage
Fitness test. Dencker et al. (2008) evaluated the associations between objectively measured
daily physical activity (accelerometers for 4 days and daily accumulation of moderate-to-
vigorous and vigorous activity) and aerobic fitness (indirect calorimetry during a maximal
cycle ergometer exercise test), in 225 children (aged 7.9–11.1 years). Significant relationships
were found between vigorous activity and aerobic fitness (r= .38), whereas moderate- to-
vigorous activity displayed weaker relationships (r= .25). Low daily accumulation of vigorous
activity was associated with lower aerobic fitness. A similar relation was not found for daily
accumulation of moderate to vigorous activity. Tovar et al. (2008) observed a significant and
positive correlation (p <0.05) of the self-reported physical activity levels with the
performance in the aerobic multistage fitness test, among 655 boys (between 7 and 18 years)
attending a private school in Bogotá, Colombia. Sveinsson et al. (2009) examined the
interrelationship between aerobic fitness (bicycle ergometer) and physical activity (Actigraph
activity monitors using total activity each day), in 270 participants selected from 18 primary
and secondary schools in Iceland (9- and 15-year-olds). Physical activity explained a smaller
proportion (0%) of the unadjusted variance in fitness for the 9-year-olds than for the 15-year-
olds (19%). The authors also found that gender differences in aerobic fitness after puberty can
largely be explained by gender differences in physical activity. More recently, Dencker et al.
(2010) investigated by direct measurement the cross-sectional relationship between
accelerometer-measured physical activity over a 4-day period and peak oxygen uptake
(VO2peak: ml.min-1.kg-1, by indirect calorimetry during a maximal treadmill exercise test), in
468 children (246 boys, 222 girls) aged 6.7+0.4 years, recruited from a population-based
cohort. Pearson correlation coefficients indicated a weak relationship between daily physical
activity variables and VO2peak in boys (r= .15 to .28), with the exception of time in sedentary
and light activity, which was not related to VO2peak. None of the daily physical activity
variables were related to VO2peak in girls, with the exception of a very weak relationship for
moderate activity (r= .14). Multiple regression analyses indicated that the various physical
activity variables explained between 2 and 8% of the variance in VO2peak in boys. In this
population-based cohort, most daily activity variables were positively related to aerobic
fitness in boys, whereas less clear relationships were observed in girls. The authors' findings
that physical activity was only uniformly related to aerobic fitness in boys partly contradict
previous studies in older children and adolescents.
Beyond the association with aerobic fitness, physical activity correlates with other
components of physical fitness, such as muscle strength and endurance, speed, flexibility,
balance, agility and motor coordination. Wrotniak et al. (2006) examined the relationship
between motor proficiency (Bruininks-Oseretsky Test of Motor Proficiency) and physical
activity (accelerometer) in 8- to 10-year-old children (34 girls and 31 boys). They found that
motor proficiency of children ( running speed, agility, balance, standing broad jump, sit ups,

Physical fitness in prepubescent children
11
push-ups and bilateral coordination) was positively correlated with total physical activity (r =
.32) and percentage of time spent on moderate to vigorous physical activity (r = .30), and
inversely correlated with time spent in sedentary activities (r = - .31). In an investigation to
explore the possible contribution of physical activity (participation in extra-curricular physical
activity) in the results of the EUROFIT test battery, of 7- to 10-years-old Spanish children, Ara
et al. (2007) showed that physical activity was positively related to the physical fitness of
boys (Balance, sit-and-reach, standing broad jump, handgrip strength, sit ups, plate tapping,
and shuttle run). In the United States of America, a sample of 230 children between 7 and 12
years old, representative of the Illinois area, was evaluated by the FITNESSGRAM test battery,
and physical activity levels (questionnaire, interview and pedometers) (Castelli & Valley,
2007). The results found by the authors showed that daily physical activity was significantly
associated with the FITNESSGRAM test battery performance (r = .28 to .46).
Body fat
Health problems associated with excess body fat are so common that in part replaced other
health concerns of the present time, such as malnutrition and infectious diseases. The
importance of health problems arising from excess weight and obesity has become more
pronounced because of the incidence rates in most socioeconomically developed countries
tend to increase, in addition to adults, in children and adolescents (Carmo et al., 2007).
Excess body fat in children is alarming because it is closely related to the increased risk of
diseases with adverse consequences for health (Daniels, 2006), which in the past were
confined to the elderly, because they are typical of the normal degeneration process of aging
(Pertroski, 2007).
The consequences of the excess body fat in children are well known: cardiovascular disease,
elevated insulin levels, high blood pressure, high cholesterol, dyslipidemia, metabolic
syndrome, asthma, sleep apnea, syndrome of hypoventilation, gastrointestinal complications,
liver and kidney diseases, and some types of cancer (Daniels, 2006; Stephen, 2006),
degenerative joint disease and orthopedic abnormalities (Ball et al., 2003), hormonal,
neurological and immunological problems (Denney-Wilson & Baur, 2007), and deficit of self-
esteem, depression, eating disorders and school failure (Denney-Wilson & Baur, 2007).
Additionally, longitudinal studies of children followed into young adulthood suggested that
overweight children may become overweight adults (WHO, 2007), exposed to an increased
comorbidity and mortality risk (Katzmarzyk et al, 2003).
Body fat levels
Many countries are losing the battle against obesity, which is even more striking in the case of
children (Wang & Lobstein, 2006). Also in Portugal, overweight and obesity have reached

Physical fitness in prepubescent children
12
epidemic proportions (Marques-Vidal & Dias, 2005). Portuguese Children have one of the
highest prevalence of obesity in European Union (do Carmo et al., 2006).
Although other factors such as genetics and diet (Mota et al., 2006) play an important role in
overweight-related genesis, the increased prevalence of overweight/ obesity has been
associated with the reduction of physical activity and has been linked to environments that
encourage sedentary behaviors (Aires et al., 2010). For many young people the school-based
physical education classes are the only way of undertaking physical activity (Coleman et al.,
2004). However, the quantity of time in physical educational schools programs and the
interventions of the seasons have limited effects (Lobstein et al., 2004). In a longitudinal,
randomized study of 5 months, to determine the effects of physical education in health-
related fitness among boys and girls (aged 8 to 12 years), Cepero et al. (2011) observed that
the physical activity at school is not sufficient to support an ideal level of health-related
fitness. Several studies have shown higher values of body fat in girls than in boys (Cepero et
al., 2011; Sveinsson et al., 2009).
Association between body fat and physical fitness
Physical fitness of overweight and obese children has extensively been documented.
Numerous studies already established a negative relationship between excessive body fat and
performances on both endurance and weight-bearing tasks (Dumith et al., 2010; Tovar et al.,
2008), whereas flexibility does not seem to differ significantly between overweight or obese
children and normal-weight peers (Casajús et al., 2007). Absolute handgrip strength even
appears to be better in obese children and adolescents, given their increased fat-free mass
(Casajús et al., 2007; Deforche et al., 2003).
Ara et al. (2007) investigated the association of BMI with physical activity (participation in
extra-curricular physical activities), of 1068 Spanish children from 7 to 12 years of age. The
results showed that the aerobic fitness (VO2max) was negatively correlated with adiposity in
both sexes. In the U.S., a sample of 230 children between 7 and 12 years of age,
representative of the area of Illinois, was assessed by the FITNESSGRAM battery and BMI
(Castelli & Valley, 2007). The results found by the authors show a low, but significant
association, between BMI and the motor tests performed (r= -.24 to -.29). In an analysis of
the performance in fundamental motor skills (Movement Assessment Battery for Children (M-
ABC) and BMI of 117 Belgian children, from 5 to 10 years of age, D'Hondt et al. (2009)
observed a significant and negative association between these two variables (r= -.34).
Castro-Piñero et al. (2009) studied the influence of body weight (BMI) on 9 different muscular
strength tests in Spanish children (1513 boys and 1265 girls) aged 6 to 17.9 years. Both
underweight and normal weight children and adolescents had significantly higher
performance than their overweight and obese counterparts in the standing broad jump,
vertical jump and push-ups tests in boys, and bent arm hang test in both boys and girls.
Physical fitness in prepubescent children
13
Sveinsson et al. (2009) examined the interrelationship between aerobic fitness (bicycle
ergometer) and body composition (logarithm of sum of four skinfolds- loge skinfolds, and
BMI), in 270 participants selected from 18 primary and secondary schools in Iceland (9- and
15-year-olds). All the body composition variables explained a similar proportion of the fitness
variance (35-42%) among the 9-year-olds. The authors also found that gender differences in
aerobic fitness after puberty can largely be explained by gender differences in loge skinfolds.
Dumith et al. (2010) undertook a study with 519 Brazilian students (age 7 to 15 years).
Physical fitness was assessed using 8 tests: sit-and-reach, stationary long jump, 1-minute curl-
up, modified pull-up, medicine-ball throw, 9-minute run, 20-m run, and 4-m shuttle-run. The
authors found that higher values of body mass index were associated with declines in physical
fitness, independent of age. Normal weight students performed better than overweight and
obese students (p< 0.01) in all tests, except the sit-and-reach and the medicine-ball throw.
Cardiorespiratory fitness had the strongest association with BMI status. Xianwen et al. (2010)
investigated the association of weight status with physical fitness (standing broad jump, 50m
sprint and 50m x 8 shuttle run) among 6929 Chinese children (aged 6–12 years). An inverse
association of obesity with cardiorespiratory fitness, muscle explosive strength, and speed
was identified. The likelihood of achieving good performance was much lower among
overweight and obese children in comparison with their counterparts with normal weight
(Odds ratio= .13 to .54). Recently, in a study to analyze the relationship of body fat with
fitness levels (Cardiovascular Endurance Run, curl-ups, trunk lifts, push-ups and shoulder
stretches) of 7000 school children in Louisiana, Joshi et al. (2012) observed that the
participants with healthy BMIs have the highest levels of physical fitness.
Somatotype
The description and interpretation of human variability is a central nucleus of research in
many areas of Anthropology, Medicine and Sport Science. Constitution represents a specific
pattern of structural-morphological, physiologically functional and psychological cognitive-
conative features of a person, which distinguish this person from all the others (Jakšić &
Cvetković, 2009, Shukla et al., 2009). These characteristics are predetermined by the
heredity and significantly influenced by various environmental factors (Shukla et al., 2009).
Physique refers to an individual`s body form, and is probably the single aspect of constitution
that is most amenable to systematic study, because it can be readily observed (Malina &
Bouchard, 1991). In an attempt to classify body types, William Sheldon introduced the
concept somatotype (soma = “body”), in the 1940s. Hence, several modifications of Sheldon`s
method were developed, and the resulting approach was the Health-Carter method, that uses
anthropometric procedures to estimate somatotype, which is defined as representing the
individual’s “present morphological conformation” (Carter, 2002). According to Reis et al.

Physical fitness in prepubescent children
14
(2007) there exists a tendency for a genetic influence on the three somatotype components
(endomorphic, mesomorphic and ectomorphic). In reverse, it seems that the effect of
physical activity and biological maturity is very weak in the physique of children (Malina et
al., 2004).
Somatotype´s stability
There is evidence that by pre-puberty there already exists a fairly stable somatotype,
pointing to 8 years as the age by which somatotype stability becomes manifest (Malina &
Bouchard, 1991; Malina et al., 2004). However, an analysis to changes in morphological
typology of children during growth shows that in pre-puberty boys tend to show a slight
increase of the mesomorphic values, and girls show an increase of the endomorphic and a
slight reduction of the ectomorphic values, while the mesomorphic component does not
change significantly (Malina et al., 2004). In an investigation that aimed to study the
somatotype´s (tri-dimensional structure) stability in children and youngsters from Madeira
(Portugal), based on a stratified and proportional sample (from 309 subjects, 157 boys and
152 girls) from a mixed-longitudinal study, Maia et al (2004) found that somatotype was
strongly stable over the age range of 10 to 16 years.
Association of somatotype with physical fitness
The associations between biotype and performance on a variety of motor tasks are generally
weak and limited in prepubertal age (0 to about .35) (Malina & Bouchard, 1991). The most
consistent relationship is a negative association between endomorphic and performance in
running, jumping and agility. The excess body fatness associated with endomorphic adversely
affects motor performance. On the other hand, mesomorphic and ectomorphic do not appear
to be consistently related to motor performance in prepubescent children. Correlations of
endomorphic and mesomorphic with muscular strength tend to be low to moderate and
positive (.20 to .50), whereas correlations between ectomorphic and strength are of about
the same magnitude but negative (-.20 to -.50) (Malina & Bouchard, 1991). The correlations
indicate the importance of overall body size in strength tests, especially body weight, and the
significant relationship between endomorphic and strength indicates the contribution of
muscularity to body weight, which most likely influences endomorphic ratings. On the other
hand, the linearity of physique associated with ectomorphic is indicative of less muscle mass,
and in turn, lower levels of attained muscular strength (Malina & Bouchard, 1991). According
to Ignjatović et al. (2009) it is logical to assume that young people who are stronger and more
powerful have an advantage in motor performance. The relationships between size or
physique, on the one hand, and strength and motor performance, on the other, are consistent
with those for estimates of body composition. In prepubescent children, absolute and relative
fat-free mass are moderately and positively related to strength and motor performance, but
absolute and relative fatness are negatively related to motor items in which the body must be
projected. Throwing is an exception. Absolute fat-free mass is more related to throwing

Physical fitness in prepubescent children
15
performance than relative fat-free mass, indicating the role of absolute body size in distance
throwing (Malina & Bouchard, 1991)
There are few studies that relate somatotype and motor performance variables in children
and adolescents. Suchomel, A. (2002) examined the relationship between the components of
anthropometric somatotype and motor performance in boys and girls (8-9 and 12-13 years old)
with considerably above-average and considerably below-average total score of the test
battery UNIFITTEST. They found a significant positive relation between ectomorphic and the
level of motor performance and, on the contrary, significant negative relation between
endomorphic, as well as mesomorphic, and the level of motor performance of pubescent boys
and girls. They also reported a significantly lower variability of the results of somatotype
components in the high motor efficient group than in the low motor efficient one. The
samples of boys and girls with a high motor performance corresponded to their somatotypes
(mesomorphic-ectomorphic and ectomorphic-mesomorphic, with low level of endomorphic
dominated) and on the contrary boys and girls with a low motor performance were difficult to
characterize. Shukla et al (2009) conducted a cross sectional study on the morphological
typology and motor quality of 900 boys, aged 10-18 years. They found that Mesomorphic
component exhibited a significant and negative correlation with standing broad jump (r= -.28)
and bend knee sit-ups (r= -.19). The association with the Sit-and-reach test was not
significant (r= .08).
Regarding gender differences in the performance of prepubescent children, they reflect, in
part, gender differences in size and body composition. The greater relative fatness of girls
and the greater absolute and relative leanness of boys exert opposite effects on performance.
Excessive fatness, as indicated above, tends to have a negative effect on most motor
performance tasks, and greater fat-free mass tends to have a positive effect. As in
adolescence, prepubescent boys tend to have greater strength per unit body size, especially
in the upper extremities and the trunk, than girls, whereas there are negligible sex
differences in lower extremity strength when body size is controlled (Malina & Bouchard,
1991).
Aerobic training
Aerobic fitness is a health-related component of physical fitness that relates to ability of the
circulatory and respiratory systems to supply oxygen during sustained physical activity (US
Department of Health and Human Services, 1996), and is probably the most important
component of any physical fitness program because it reflects the overall capacity of the
cardiovascular and respiratory systems and the ability to carry out prolonged strenuous
exercise (Astrand et al., 2003). Several studies indicate that a good aerobic capacity is

Physical fitness in prepubescent children
16
associated with a lower risk of coronary heart disease, diabetes and other health problems in
children (Aires et al., 2010; Kvaavik et al., 2009).
Training-induced adaptations in aerobic fitness have been extensively studied in adults,
however, young people appear to respond differently to such exercise stimulus in comparison
to adults (Matos & Winsley, 2007). Some exercise scientists have recommended similar
training programs for young people. However, the subject of the response to aerobic training
of children and adolescents is controversial, and the effects of exercise training on
prepubertal children are particularly debatable. This can be partly explained by different
training designs, which make comparisons between studies very problematic (Baquet et al.,
2003). Several researchers have concluded that pre-pubescent children may be less adaptive
to aerobic training than adolescents and adults (Baquet et al., 2003; Matos & Winsley, 2007),
which was attributed to either a high inherent level of physical activity or to some
unexplained limitations in the biological responsive mechanisms related to maturation (Katch,
1983).
However, some studies have shown that with an intensive training stimulus, pre-pubescent
children show improvement in maximum aerobic power compared with controls of the same
maturation (Baquet et al., 2004; Santos et al., 2012; Vamvakoudis et al., 2007), with
improvements reported at approximately 5% (Matos & Winsley, 2007). Moreover,
improvements in other variables like exercise economy or lactate threshold may occur
without significant changes in peak VO2 (Matos & Winsley, 2007). Unfortunately, despite the
abundant research on aerobic training, the relationship between exercise training and
adaptations in aerobic metabolism are still not well understood in prepubertal and early
pubertal children (Tolfrey, 2007). In order to investigate the ability of children to improve
aerobic fitness after a 12-week period of aerobic training, Rowland and Boyajian (1995) found
that mean VO2max did not change significantly during the control period, but rose from 44.7
(5.8) to 47.6 (6.4) mL kg-1min-1 (6.5%) with training (P < .05). No differences in training
response were observed relative to sex, pre-training VO2max, or sports participation. The
findings of this study support the concept that VO2max can be improved with aerobic training
during the childhood years, but the degree of aerobic trainability is limited in healthy, active
children. The meta-analysis of Payne and Morrow (1997) analyzed the data from 69 studies (of
which 28 met the inclusion criteria) that were either a cross-sectional comparison between
trained and untrained children or a pre-test/ post-test design. Greater differences between
trained and untrained participants (Effect Size 0.94 ± 1.00) were seen, but less than a 5%
change in peak VO2 (approximately 2mL·kg-1·min-1) were noted in the pre-post studies (Effect
Size 0.35 ± 0.82). Baquet et al. (2003) argued that improvements in peak VO2 of around 5-6%
are observed when the data are analyzed independently by sex or pubertal status. These
authors also stated that when only studies that reported significant changes were considered,
peak VO2 improvements rose to 8-10%. In a study in order to determine in healthy children (10

Physical fitness in prepubescent children
17
girls and 9 boys, l0-11-year-old) the effect of a 13-week well-controlled aerobic training
program on cardiac function at maximal exercise and to define whether gender affects the
training-induced cardiovascular response, Obert et al. (2003) observed that the training
program led to a rise in VO2max, brought about however, only by an increase in maximum
stroke volume in both genders. Moreover, the boys increased their VO2max to a greater extent
than the girls (boys: +15%; girls: +8%) only because of a higher maximum stroke volume
improvement (boys: +15%; girls: +11%). An increase in the left ventricular end-diastolic
diameter, concomitant with an improvement in diastolic function, was observed after training
and constituted an essential element in the rise in VO2max after training in these children.
Moreover, during maximal exercise, a decrease in systemic vascular resistances, probably
indicating peripheral cardiovascular adaptive changes, might also play an important role in
the increase in VO2max. Rowland (2005) compiled a series of what he considered to be well-
designed investigations in children and stated that the improvements in aerobic power were
indeed quite small, with the greatest improvement being 10%, but the average change being
5.8%. Vamvakoudis et al. (2007) analyzed the effects of a prolonged aerobic training on
maximal aerobic power of young basketball players (20 players and 18 control boys). All
subjects were tested every 6 months (18 months total, 11(1/2), 12, 12(1/2), 13 years old) for
VO2max. The authors observed that VO2max was altered in both groups on the final test, when
compared to the initial test. However, the training group had a higher VO2max on each of the
6-month follow-up measurements, compared to the control group (p < 0.001). The major
implication suggested by the findings of the study was that, in order to improve the basic
physical components, specific training procedures should be incorporated during the
basketball training sessions. It was recommended that all children should be involved in some
type of cardiovascular and resistance training program.
Regarding sex differences in aerobic trainability, at present, there are few studies which have
addressed sex differences in the trainability of aerobic fitness in children, with the majority
of studies recruiting boys as participants (Matos & Winsley, 2007). Single sex studies using
prepubertal girls however have reported that significant improvements in peak VO2 are
possible (McManus et al., 1997), akin to that seen in boys. The data from those studies that
have directly compared the sexes suggest that boys and girls demonstrate similar responses in
aerobic trainability (Baquet et al. 2003), even though boys’ peak VO2 appears to be slightly
higher than girls (Obert et al., 2003). Obert et al. (2003) had 10 girls and 9 boys participate in
a 13-week aerobic training programme (3 x 1 hour per week) and found that significant
improvements in peak VO2 were observed for both groups; boys increased peak VO2 by 15%
and girls by 8%. Similar findings were reported by Baquet et al. (2002); 9.5% increase in peak
VO2 for the prepubertal boys being not significantly different from the 7.2% increment
observed in girls.

Physical fitness in prepubescent children
18
Strength training
In addition to aerobic activities, research increasingly indicates that strength training can
offer unique benefits for children when appropriately prescribed and supervised (Behringer et
al., 2011; Faigenbaum et al., 2009). Furthermore strength training has been shown to be
associated with several health-related benefits such as increased bone mineral density,
improved body composition, improved insulin sensitivity, normalization of vascular disorders
(Shabi et al., 2006, Benson et al., 2006), and enhanced mental health and well-being (Yu et
al., 2008). It also increases the resistance to sports injuries and makes more effective the
rehabilitation in young athletes (Kraemer & Fleck , 2005).
Although early studies suggested that strength training did not lead to significant
improvements in strength, numerous studies spanning the last 50 years have shown strength
training to be an effective and safe way for enhancing muscle strength in children and
adolescents, if appropriately prescribed and supervised (Behringer et al., 2011). Strength
gains up to 74% have been reported after 8 weeks of progressive resistance training
(Faigenbaum, 1993), although gains of roughly 30% are typically observed after short-term (8–
20 weeks) youth resistance training programs (Faigenbaum et al., 2009). According to Dahab
and McCambridge (2009) children can improve strength between 30% and 50% after only 8 to
12 weeks of a strength training program at a frequency of at least two training times per
week. Isometric and dynamic strength training are effective in increasing strength in pre-
pubertal children and adolescents, with both groups showing considerable improvements
(Rowland, 2005; Tolfrey, 2007). Reported relative (% change above initial levels) strength
gains achieved during preadolescence are equal to if not greater than the relative gains
observed during adolescence (Lillegard et al., 1997).
The mechanisms underlying strength improvements and muscle hypertrophy in adults arise
through an interaction between neural and hormonal mechanisms. However, in the pre-
pubescent population, muscle hypertrophy is not believed to be the primary factor in strength
improvement (Tolfrey, 2007). Without corresponding increases in fat-free mass, it appears
that neural adaptations (i.e., a trend toward increased motor unit activation and changes in
motor unit coordination, recruitment, and firing) (Ozmun et al., 1994; Ramsay et al., 1990)
and possibly intrinsic muscle adaptations (as evidenced by increases in twitch torque)
(Ramsay et al., 1990) are primarily responsible for training-induced strength gains during
preadolescence. Improvements in motor skill performance and the coordination of the
involved muscle groups may also play a significant role because measured increases in
training-induced strength are typically greater than changes in neuromuscular activation
(Ozmun et al., 1994; Ramsay et al., 1990).

Physical fitness in prepubescent children
19
A compelling body of scientific evidence indicates that children and adolescents can
significantly increase their strength, above and beyond growth and maturation, providing that
the resistance training program is of sufficient intensity, volume, and duration. Faigenbaum
et al. (2002) analyzed the effects of 1 and 2 days per week of strength training (8 weeks) on
upper body strength, lower body strength, and motor performance ability in children (21 girls
and 34 boys between the ages of 7.1 and 12.3 years). Only participants who strength trained
twice per week made significantly greater gains in 1RM chest press strength, compared to the
control group (11.5 and 4.4% respectively, p < .05). In a study conducted by Tsolakis et al.
(2004), ten untrained preadolescent males (11-13 years old) were submitted to a 2-month
resistance-training program (6 exercises, 3 x 10 repetitions maximum [RM], 3 times per
week). The effectiveness of the resistance program was determined by measuring pre- and
post-training differences in isometric and isotonic (10RM) strength. The authors observed
significant post-training isometric strength gains (17.5%) in the experimental training group.
Faigenbaum et al. (2005) compared early muscular fitness adaptations in children (23 girls
and 20 boys between the ages of 8.0 and 12.3 years) in response to low repetition maximum
and high repetition maximum resistance training. Children performed one set of 6 to 10 RM or
one set of 15 to 20 RM on child-size exercise machines twice weekly over 8 weeks. Both
experimental groups made significantly greater gains in 1RM strength (21% and 23%,
respectively) as compared with the control group (1%). In order to investigate whether a
whole-body vibration program results in a better strength and postural control performance
than an equivalent exercise program performed without vibration (6 weeks of training at 3
times per week), in 33 Belgian competitive skiers (ages = 9–15 years), Mahieu et al. (2006)
observed that both training programs significantly improved knee muscle strength and
explosive strength (p ≤ 0.05).
Regarding gender differences, there have been few studies that have looked at differences in
training induced strength improvements between boys and girls, but it appears that both
sexes respond similarly (Faigenbaum et al., 2003; Matos & Winsley, 2007).
Concurrent strength and aerobic training
Strength training and aerobic training are often performed concurrently in most exercise
programs in wellness, fitness, and rehabilitative settings in an attempt to obtain gains in
more than 1 physiologic system to achieve total conditioning, to meet functional demands, or
to improve several health-related components simultaneously (Shaw et al., 2009).
Furthermore, children involved in physical education classes often perform strength and
aerobic training concurrently in an effort to achieve specific adaptations to both forms of
training (Santos et al., 2012).

Physical fitness in prepubescent children
20
However, during several decades many studies have reported an interference effect on
muscle strength development when strength and aerobic were trained concurrently (Dudley &
Djamil, 1985; Hickson, 1980). The majority of these studies found that the magnitude of
increase in strength was higher in the group that performed only strength training compared
with the concurrent training group. This is commonly referred to as the “interference
phenomenon” (García-Pallarés et al., 2009). Because strength and aerobic training elicit
distinct and often divergent adaptive mechanisms, the concurrent development of both
fitness components in the same training regimen can lead to conflicting neuromuscular
adaptations, such as: (i) reductions in the motor unit recruitment and decreases of rapid
voluntary neural activations; (ii) chronic depletion of muscle glycogen stores; (iii) skeletal
muscle fibretype transformation; (iv) overtraining produced by imbalances between the
training and recovery process; and (v) decreases in the crosssectional area of muscle fibres
and in the rate of muscle force production, due to the reduction in total protein synthesis
following endurance training (Coffey & Hawley, 2007). Several studies have identified
different factors that can influence the level or degree of interference generated by
concurrent training (García-Pallarés & Izquierdo 2011). These factors include the initial
training status of the subjects, exercise mode, volume, intensity and frequency of training
(González-Badillo et al., 2005; Kraemer & Ratamess, 2004).
Despite all of the experimental studies, there is a lack of information about the effects of
concurrent training in children, with the exception of the recent studies by Santos et al.
(2011, 2012) relating exclusively to the effects of concurrent training in pubertal girls and
boys, respectively. The effects of concurrent training in prepubescent children, according to
our best knowledge, have yet to be investigated. The authors compared the effects of an
8‐week training period of strength training alone, or combined strength and aerobic training,
on power strength and VO2max adaptations. Significant training-induced differences were
observed in 1kg and 3kg medicine ball throw gains, and height-and-length of the counter
movement jumps. Time-at-20m also decreased significantly for both interventions programs.
VO2max increased significantly only in the endurance training group. No significant differences
were found in the post training between strength training group and combined strength and
aerobic training group in any parameters of explosive strength evaluated.
Summary and future directions
There is evidence suggesting that physical fitness has declined worldwide in the last decades
among children. Therefore, the efforts to promote levels of physical fitness in children should
be a priority. The knowledge of the determinants of physical fitness in prepubescent children
and its training effects can help achieve this goal.

Physical fitness in prepubescent children
21
The main research findings can be summarized as follows:
(i) There are significant and positive associations between physical activity levels and
physical fitness;
(ii) There is a negative relationship between excessive body fat and performance on both
aerobic and weight-bearing tasks, whereas flexibility does not seem to differ
significantly between overweight or obese children and normal-weight peers.
Absolute handgrip strength appears to be better in obese children;
(iii) Endomorphic is a limiting factor in body propulsion and lifting tasks. Mesomorphic is
positively associated with strength and motor performance in general. The
associations for ectomorphic were the inverse of those for endomorphic and
mesomorphic.
(iv) The boys are superior in tasks that require strength, speed and aerobic capacity, and
the girls on tasks with a predominance of balance, coordination and flexibility;
(v) The girls have higher levels of body fat than boys;
(vi) The boys have higher and consistent levels of physical activity than girls;
(vii) During pre-puberty, the boys tend to show a slight increase of the mesomorphic and
the girls show an increase of the endomorphic;
(viii) With an intensive training stimulus, prepubescent children show improvements in
aerobic capacity compared with controls of the same maturation;
(ix) Strength training can be an effective and safe way for enhancing muscle strength in
prepubescent children;
(x) The effects of concurrent training in prepubescent children, according to our best
knowledge, have yet to be investigated.
Regarding to the state of the art, researchers should aim future investigation in order to
explore issues that are not completely clear in the available literature. Some of those main
topics can be:
(i) The interaction between physical activity, body fat, somatotype and physical fitness;
(ii) The interaction between physical activity, body fat, somatotype and training-induced
strength and aerobic fitness (and other physical capacities);
(iii) The magnitude of the differences between boys and girls in physical fitness;
(iv) The effects of concurrent training in prepubescent children.

22

23
Chapter 3 – Experimental studies
Study 2
Somatotype is more interactive with strength than fat mass and
physical activity in peripubertal children
Abstract
The purpose of this study was to analyze the interaction between somatotype, body fat and
physical activity in prepubescent children. This was a cross‐sectional study design involving
312 children (160 girls, 152 boys) aged between 10 and 11.5 years old (10.8 ± 0.4 years old).
Evaluation of body composition was done determining body mass index and body fat by means
of skin‐fold measurements, using the method described by Slaughter. Somatotype was
computed according to the Carter’s method. Physical activity was assessed with the Baecke
questionnaire. The physical activity assessment employed sets of curl‐ups, push‐ups, standing
broad jump, medicine ball throw, handgrip strength and Margaria‐Kalamen power stair. There
were negative associations for body fat, endomorphy and mesomorphy with curl‐ups,
push‐ups and broad jump tests and positive associations with ball throw, handgrip strength
and Margaria‐ Kalamen power tests. The associations for ectomorphy were the inverse of
those for endomorphy and mesomorphy. Non-obese children presented higher values for
curl‐ups, push‐ups and standing broad jump. In medicine ball throw, handgrip strength and
Margaria‐Kalamen power test obese children presented higher scores, followed by children
who were overweight. The mesoectomorphic boys and ectomesomorphic girls performed
higher in all tests. The morphological typology presented more interactions with strength
than % of body fat and physical activity. These data seem to suggest that the
presence/absence of certain physical characteristics is crucial in the levels of motor provision
in prepubescent children.
Key words: physical fitness, motor performance, strength, anthropometric
Somatotype is more interactive with strength than fat mass and physical activity
24
Introduction
Children with high levels of motor competence are more active, more capable (Castelli and
Vale, 2007) and spend less time on sedentary tasks (Wrotniak et al., 2006). On the other
hand, improvement in the motor proficiency of children can also influence levels of habitual
physical activity beyond school age, creating expectations of future maintenance of active
lifestyles (Sharkey, 2002; Andersen et al., 2004) and is thus indispensable to potential
decisions influencing the promotion of health (Stodden et al., 2008). Health‐related fitness
includes, besides others, aerobic endurance, muscular strength, and flexibility (Hands et al.,
2009). On this, most studies on physical fitness have focused specially on aerobic capacity
neglecting, among for instance, neuromotor fitness based on muscular strength (Cepero et
al., 2011). Some studies reported positive associations between physical activity in children
and adolescents with performance on tests of muscular strength and muscular endurance
(Lennox et al. 2008; Martínez‐Gómez et al., 2011). Added to that, an evolution of muscular
strength skills throughout adolescence associated with higher levels of physical activity were
also described (Zac and Szopa, 2001). Others, by contrast, report no significant associations
between physical activity and performance in similar tests (Hands et al., 2009). It is also
possible to find studies that negatively relate body fat with tests of strength and muscular
endurance (Castro‐Pistro et al. 2009; Dumith et al., 2010) or, conversely, a positive
relationship in tests such as ball throwing or handgrip strength (Artero et al., 2010; DʹHondt
et al. 2009).
Somatotype assessment may be used to describe changes in the human physique over the
lifespan or as a result of physical activity and has been found to be inherited to a greater
extent than body mass index (Reis et al., 2007). Yet, there are few studies that link
somatotype with muscular strength in young people, with the exception of the recent studies
by Jakšić and Cvetkovic (2009) and Shukla et al. (2009) relating this exclusively to the
standing broad jump and curl‐ups. Currently, efforts to promote physical fitness levels in the
young ought to be a priority (Cepero et al., 2011), but clearly these cannot exceed the limits
imposed by genotype, i.e., the manifestation of genetic determinism; just as important as
the dimensional values are their relative degrees of presence, observed from the
morpho‐constitutional perspective (Malina and Bouchard, 1991). We can define the
morphological typology as a complex entity that describes the overall configuration of the
body, as opposed to individual anatomical characteristics (Malina and Bouchard, 1991). It is
therefore pertinent to examine, in addition to the correspondence between physical activity,
body composition and performance in tests of muscle strength and endurance, the correlation
between somatotype and any such tests.
Therefore, the purpose of the present study was to analyze the relationship between physical
activity, body fat, and somatotype with performance in tests of strength and muscular

Somatotype is more interactive with strength than fat mass and physical activity
25
endurance. An additional objective is to find which of the variables is most interactive with
the muscular strength and endurance parameters selected. It was hypothesized that there is
some kind of relationship between physical activity, body fat and somatotype with muscular
strength and muscular endurance performances.
Material and Methods
Sample
The sample, cross‐sectional in type, consisted of 312 prepubescent children (160 girls, 152
boys) who volunteered for this study. The age, height and weight of the whole sample were:
10.8 ± 0.4 years, 1.45 ± 0.08 m, 40.0 ± 8.7 kg, respectively (girls: 10.8 ± 0.4 years, 1.44 ±
0.07 m, 38.9 ± 8.5 kg; boys: 10.8 ± 0.4 years, 1.45 ± 0.09 m, 41.2 ± 8.8 kg). Descriptive data
of the percentage of fat mass (%FAT), body mass index (BMI) endomorphy (ENDO),
mesomorphy (MESO), ectomorphy (ECTO), physical activity index (PA) and muscle strength
variables are presented in Table 1.
Table 1. Descriptive data of FAT, BMI, ENDO, MESO, ECTO, PA and muscle strength variables
Male Female Overall sample
Mean SD Mean SD Mean SD
%FAT 22.38 8.65 23.10 6.99 22.75 7.84
ENDO 3.62 1.71 3.96 1.60 3.79 1.66
MESO 4.69 1.16 3.68 1.09 4.17 1.23
ECTO 2.49 1.45 2.85 1.45 2.67 1.46
PA 8.85 1.09 8.36 0.890 8.60 1.02
Curl-ups 32.96 19.439 25.23 15.01 29.00 17.71
Push- ups 12.42 8.262 8.58 6.78 10.45 7.77
Broad jump 134.87 23.448 119.33 21.98 126.90 23.97
Medicine ball throw 244.80 36.893 219.72 37.79 231.94 39.35
Handgrip strenght R 18.18 3.987 16.903 4.49 17.52 4.29
Handgrip strenght L 16.90 3.801 15.62 4.23 16.24 4.07
M-K power stair test 42.71 13.499 34.667 12.22 38.58 13.45
Both boys and girls were in Tanner stages 1‐2. Participantsʹ parents provided their written and
informed consent and the procedures were approved by the institutional review board
following the Helsinki Declaration.
Procedures
Parameters of body fat, somatotype, level of physical activity and physical fitness were
evaluated for all subjects participating in the study. For anthropometric measurements the

Somatotype is more interactive with strength than fat mass and physical activity
26
participants were barefoot and wore only underwear. Body weight was measured using the
standard digital floor scale (Seca 841), body height using a precision stadiometer (Seca 214),
and skinfolds using a skinfold caliper. For perimeter measurement a circumference tape was
used (Seca 200).
It was assessed the bi-condyle femoral and humeral diameters (Campbell, 20, RossCraft,
Canada). In the evaluation of body composition, body mass index (BMI) and body fat (%FAT)
were calculated using the skinfold method described by Slaughter et al. (1988). Cohort groups
were defined based in the body mass index according to the cut‐off values suggested by Cole
et al. (2000). The definition of morphological typology (TYPE) used the method described by
Heath‐Carter (1971), while the evaluation of biological maturation followed the sexual
maturation stages of Tanner (1962). Individuals selected were self‐evaluated as being in
stages 1 and 2. The index of physical activity (PA) was measured using the Baecke et al.
(1982) questionnaire. For the assessment of physical fitness, motor tests were chosen to
include the assessment of muscle strength and endurance (curl‐ups and push‐ups: the score
was the number of correct curl‐ups performed at a cadence of 20 curl‐ups per minute, i.e., 1
curl‐up every 3 seconds), explosive strength (standing broad jump and medicine ball throw 2
kg: the score was the the furthest distance), isometric strength and anaerobic fitness
(hand‐grip strength ‐ using a Jamar hydraulic hand dynamometer of 000‐200 lbs: three trails
were given for each hand separately and the score was recorded in kg) and muscular power
(Margaria‐Kalamen power stair test: Power = body mass (kg) x vertical distance between
steps). The test‐retest reliability, as shown by the intraclass correlation coefficient (ICC) was
between 0.91 and 0.94 for all measures.
Statistics
Normality of distribution was checked by applying the Kolmogorov‐Smirnov tests (SPSS 17.0).
Statistical analysis used the Kruskal‐Wallis test in the comparison between groups.
Relationship between variables was performed with the Spearman correlation. Interaction
between the variables referred to the General Linear Model. The statistical significance was
set at p ≤ 0.05.
Results
There were significant negative associations between % FAT, endomorphy (ENDO) and
mesomorphy (MESO) with performance on tests of curl‐ups, push‐ups and standing broad
jump, and positive associations with medicine ball throw, handgrip strength and M‐K tests. In
the opposite direction, ectomorphy (ECTO) was negatively associated with left handgrip
strength, and positively with curl‐ups, push‐ups and standing broad jump. With the exception
of left handgrip strength, for which there were no significant correlations, PA was positively
associated with all the variables of muscle strength and endurance (Table 2).
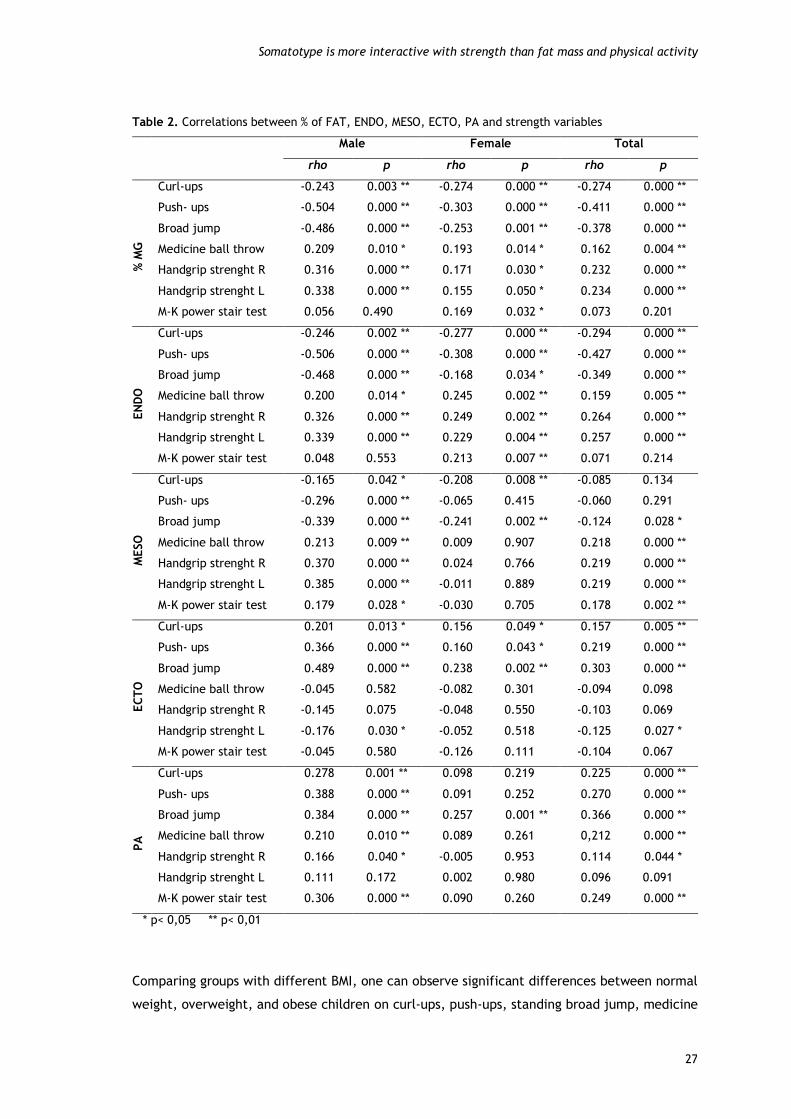
Somatotype is more interactive with strength than fat mass and physical activity
27
Table 2. Correlations between % of FAT, ENDO, MESO, ECTO, PA and strength variables
Male Female Total
rho p rho p rho p
% M
G
Curl-ups -0.243 0.003 ** -0.274 0.000 ** -0.274 0.000 **
Push- ups -0.504 0.000 ** -0.303 0.000 ** -0.411 0.000 **
Broad jump -0.486 0.000 ** -0.253 0.001 ** -0.378 0.000 **
Medicine ball throw 0.209 0.010 * 0.193 0.014 * 0.162 0.004 **
Handgrip strenght R 0.316 0.000 ** 0.171 0.030 * 0.232 0.000 **
Handgrip strenght L 0.338 0.000 ** 0.155 0.050 * 0.234 0.000 **
M-K power stair test 0.056 0.490 0.169 0.032 * 0.073 0.201
EN
DO
Curl-ups -0.246 0.002 ** -0.277 0.000 ** -0.294 0.000 **
Push- ups -0.506 0.000 ** -0.308 0.000 ** -0.427 0.000 **
Broad jump -0.468 0.000 ** -0.168 0.034 * -0.349 0.000 **
Medicine ball throw 0.200 0.014 * 0.245 0.002 ** 0.159 0.005 **
Handgrip strenght R 0.326 0.000 ** 0.249 0.002 ** 0.264 0.000 **
Handgrip strenght L 0.339 0.000 ** 0.229 0.004 ** 0.257 0.000 **
M-K power stair test 0.048 0.553 0.213 0.007 ** 0.071 0.214
MESO
Curl-ups -0.165 0.042 * -0.208 0.008 ** -0.085 0.134
Push- ups -0.296 0.000 ** -0.065 0.415 -0.060 0.291
Broad jump -0.339 0.000 ** -0.241 0.002 ** -0.124 0.028 *
Medicine ball throw 0.213 0.009 ** 0.009 0.907 0.218 0.000 **
Handgrip strenght R 0.370 0.000 ** 0.024 0.766 0.219 0.000 **
Handgrip strenght L 0.385 0.000 ** -0.011 0.889 0.219 0.000 **
M-K power stair test 0.179 0.028 * -0.030 0.705 0.178 0.002 **
EC
TO
Curl-ups 0.201 0.013 * 0.156 0.049 * 0.157 0.005 **
Push- ups 0.366 0.000 ** 0.160 0.043 * 0.219 0.000 **
Broad jump 0.489 0.000 ** 0.238 0.002 ** 0.303 0.000 **
Medicine ball throw -0.045 0.582 -0.082 0.301 -0.094 0.098
Handgrip strenght R -0.145 0.075 -0.048 0.550 -0.103 0.069
Handgrip strenght L -0.176 0.030 * -0.052 0.518 -0.125 0.027 *
M-K power stair test -0.045 0.580 -0.126 0.111 -0.104 0.067
PA
Curl-ups 0.278 0.001 ** 0.098 0.219 0.225 0.000 **
Push- ups 0.388 0.000 ** 0.091 0.252 0.270 0.000 **
Broad jump 0.384 0.000 ** 0.257 0.001 ** 0.366 0.000 **
Medicine ball throw 0.210 0.010 ** 0.089 0.261 0,212 0.000 **
Handgrip strenght R 0.166 0.040 * -0.005 0.953 0.114 0.044 *
Handgrip strenght L 0.111 0.172 0.002 0.980 0.096 0.091
M-K power stair test 0.306 0.000 ** 0.090 0.260 0.249 0.000 **
* p< 0,05 ** p< 0,01
Comparing groups with different BMI, one can observe significant differences between normal
weight, overweight, and obese children on curl‐ups, push‐ups, standing broad jump, medicine
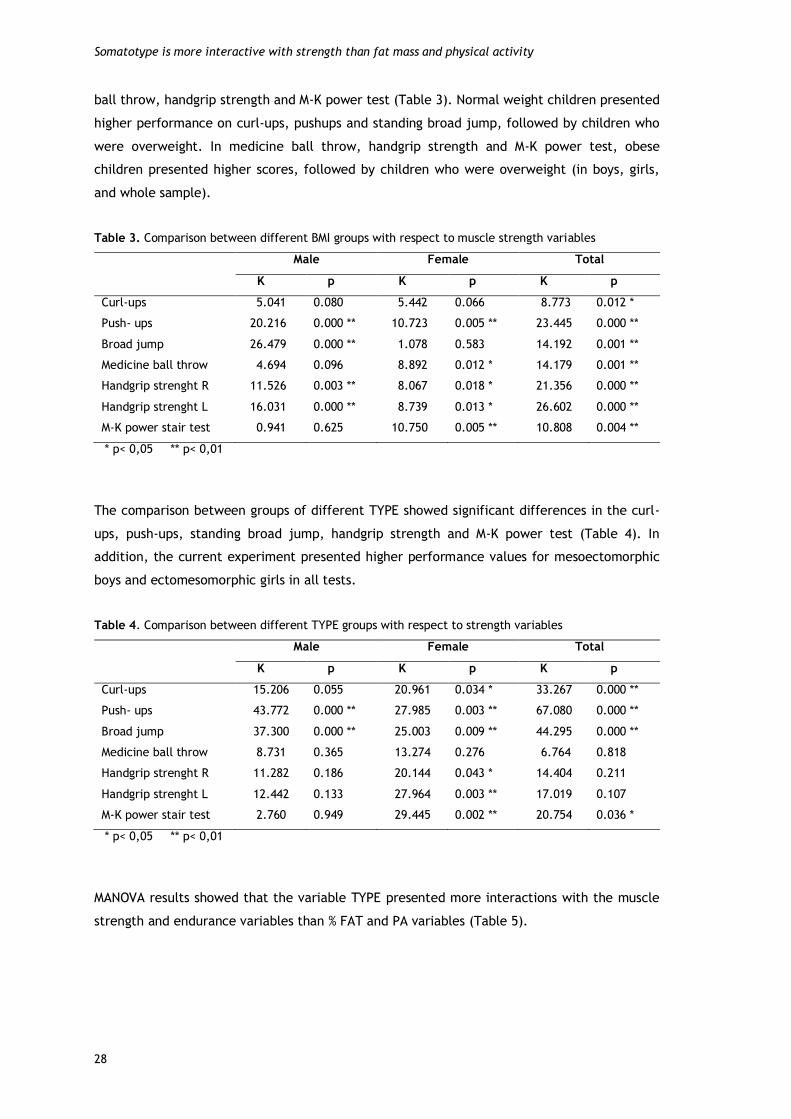
Somatotype is more interactive with strength than fat mass and physical activity
28
ball throw, handgrip strength and M‐K power test (Table 3). Normal weight children presented
higher performance on curl‐ups, pushups and standing broad jump, followed by children who
were overweight. In medicine ball throw, handgrip strength and M‐K power test, obese
children presented higher scores, followed by children who were overweight (in boys, girls,
and whole sample).
Table 3. Comparison between different BMI groups with respect to muscle strength variables
Male Female Total
K p K p K p
Curl-ups 5.041 0.080 5.442 0.066 8.773 0.012 *
Push- ups 20.216 0.000 ** 10.723 0.005 ** 23.445 0.000 **
Broad jump 26.479 0.000 ** 1.078 0.583 14.192 0.001 **
Medicine ball throw 4.694 0.096 8.892 0.012 * 14.179 0.001 **
Handgrip strenght R 11.526 0.003 ** 8.067 0.018 * 21.356 0.000 **
Handgrip strenght L 16.031 0.000 ** 8.739 0.013 * 26.602 0.000 **
M-K power stair test 0.941 0.625 10.750 0.005 ** 10.808 0.004 **
* p< 0,05 ** p< 0,01
The comparison between groups of different TYPE showed significant differences in the curl-
ups, push‐ups, standing broad jump, handgrip strength and M‐K power test (Table 4). In
addition, the current experiment presented higher performance values for mesoectomorphic
boys and ectomesomorphic girls in all tests.
Table 4. Comparison between different TYPE groups with respect to strength variables
Male Female Total
K p K p K p
Curl-ups 15.206 0.055 20.961 0.034 * 33.267 0.000 **
Push- ups 43.772 0.000 ** 27.985 0.003 ** 67.080 0.000 **
Broad jump 37.300 0.000 ** 25.003 0.009 ** 44.295 0.000 **
Medicine ball throw 8.731 0.365 13.274 0.276 6.764 0.818
Handgrip strenght R 11.282 0.186 20.144 0.043 * 14.404 0.211
Handgrip strenght L 12.442 0.133 27.964 0.003 ** 17.019 0.107
M-K power stair test 2.760 0.949 29.445 0.002 ** 20.754 0.036 *
* p< 0,05 ** p< 0,01
MANOVA results showed that the variable TYPE presented more interactions with the muscle
strength and endurance variables than % FAT and PA variables (Table 5).

Somatotype is more interactive with strength than fat mass and physical activity
29
Table 5. Interaction of morphological type (TYPE), body fat (% FAT) and physical activity (PA) with
strength variables: GLM‐MANOVA test
Male Female Total
F p F p F p
Curl-ups %FAT 2.674 0.035 *
Push- ups TYPE 2.713 0.002 **
%FAT 4.205 0.007 **
Broad jump TYPE 2.909 0.001 **
PA 4.383 0.037 *
Medicine ball throw %FAT 2.601 0.037 *
Handgrip strenght R TYPE 2.135 0.023 *
Handgrip strenght L TYPE 2.920 0.002 **
M-K power stair test TYPE 3.018 0.001 ** 2.408 0.007 **
%FAT 2.762 0.028 *
* p< 0,05 ** p< 0,01
Discussion
The purpose of this study was to examine the interaction between physical activity, body fat,
somatotype and performance with muscle strength and endurance. The main results suggest
that in subjects undergoing pre pubescence, somatotype is a more significantly determining
factor than PA and % FAT to the performance in strength tests.
The significant and negative relationship of body fat with body tasks is consistent with results
of previous studies that referred to similar relationships in tests of curl‐ups (Fogelholm et al.
2008; Castro‐Piñero et al. 2009; DʹHondt et al., 2009; Dumith et al., 2010), standing broad
jump (Artero et al., 2010; Xianwen et al., 2010), and push‐ups (Castro‐Piñeroet al., 2009).
The current results are also consistent with others researches that report positive associations
of body fat with handgrip strength and ball‐throwing, as evidenced by studies undertaken by
Deforche et al. (2003), Casajús et al. (2007) and Artero et al. (2010), in the hand
dynamometry test, and DʹHondt et al. (2009), in the basketball throw. On the other hand,
Dumith et al. (2010) found no significant association of body fat with medicine ball throw. In
the M‐K test, it was not possible to compare the results with other studies in the literature.
However, the fact that in the equation for calculating power the numerator must take into
account the weight of the subject, which in addition to body fat also includes the muscle
mass associated with it, might somehow explain the positive association observed in girls.
Concerning the relation of somatotype with physical fitness, it should be stressed‐out that,
more important than the association of each major component with performance, it is the
critical to consider the degree of relative presence of each component, defined by
morphological typology.

Somatotype is more interactive with strength than fat mass and physical activity
30
ENDO was positively related only with handgrip strength, ball‐throwing power and the M‐K
test, these being the same tests in which %FAT had a positive association. These two variables
are very close, either in terms of definition, or by the way they are calculated. Here, ENDO
expresses the degree of adiposity development (Malina and Bouchard, 1991). So the primary
effect of this component in performance will differ depending on the type of task, being a
limiting factor in body propulsion and lifting tasks in which body fat plays a similar function.
Also Malina and Bouchard (1991) reported that ENDO, unlike the tasks of throwing objects,
tends to negatively correlate with performance on most motor tasks, because the absolute
lean body mass is more related to these tasks than the relative lean body mass. However,
according to the same authors, the correlations between body type and motor performance
are generally low and limited in pre pubescence.
MESO reflects muscle development positively associated with strength and motor
performance in general (Malina and Bouchard, 1991). This component is only negatively
correlated with tests related to the propulsion and lifting of the body, in which tasks ECTO
has the advantage, since it is based on weighting index, i.e. the quotient of height by the
cube root of body weight (Malina and Bouchard, 1991). While observing a positive influence
for MESO in most tests, it is also necessary to consider sexual dimorphism in relation to body
type component of the somatotype, reflected in the differences in the values of ECTO and
MESO. These differences only begin to be observed and favorable to boys from early
adolescence, thus increasing with age, while girls tend to increase the value of ENDO (Malina
et al., 2004). If the analysis is carried‐out according to the dominant component, the children
whom the MESO and ECTO were dominant had the best results in all tests considered.
ECTO reflects linearity and muscular hypotonia (Dumith et al. 2010). On this, there were only
positive associations for ECTO with propulsion and lifting body tasks, precisely the reverse of
the associations for ENDO and MESO because of the negative effect of body weight in these
tasks (Dumith et al. 2010; Xianwen et al., 2010). Regarding left handgrip strength, there is a
negative association, since it is a different test, which does not require propulsion or lifting
the body.
In the relationship of TYPE with motor performance it appears that meso‐ectomorphs and
ecto‐mesomorphs, i.e. individuals with a predominance of the primary components of ECTO
and MESO presented higher performances in all tests considered, which is consistent with the
advantage of MESO, noticed in the literature, concerning the tasks that require strength and
motor performance in general. By contrast, the advantage of ECTO was found in tasks related
to the propulsion and lifting movements of the body. Suchomel (2002) also reported a positive
association between the prevalence of these components with the total score of the battery

Somatotype is more interactive with strength than fat mass and physical activity
31
UNIFITT as did Jakšić and Cvetkovic (2009) with the performance analysis in the curl‐ups,
bent arm hang and longest jump distance.
The relationship between PA and motor performance corroborates the findings of most
studies that report a positive association between PA and muscular strength and endurance as
well as overall physical fitness, particularly in the standing broad jump (Lennox et al., 2008;
Loko et al. 2003; Wrotniak et al., 2006), medicine ball throw (Loko et al., 2003), push‐ups
(Lennox et al., 2008, Tovar et al., 2008) and isometric hand dynamometry (Tovar et al.,
2008). Different results were obtained by Hands et al. (2009), who found no significant
associations between PA and performance in standing broad jump, curl‐ups, hand
dynamometry and ball throw. The greatest number of interactions of TYPE with the selected
tests highlights the importance of this parameter in muscle strength and endurance in
prepubescent children.
Conclusions
In summary, body fat, physical activity and somatotype determine physical fitness levels in
children and adolescents. The current study presented similar data, although underlying the
main role of the somatotype on muscular strength and resistance in prepubescent children.
The data from this study seem to suggest that one cannot exceed the limits imposed by what
is a manifestation of genetic determinism, observed from the morph‐constitutional point of
view, by which the presence/absence of certain physical traits determines the appropriate
levels of motor performance required.

32

33
Study 3
Physical fitness differences between prepubescent boys and
girls
Abstract
The purpose of this study was to analyze in which physical capabilities boys and girls are
closer/ distant. An additional objective was to find which of the body fat, physical activity
and somatotype factors have a greater effect on prepubescent children’s physical fitness.
This was a cross-sectional study involving 312 children (10.8 ± 0.4 years). The physical fitness
assessment employed sets of aerobic fitness, strength, flexibility, speed, agility and balance.
Boys presented higher values in all selected tests, except tests of balance and flexibility, in
which girls scored better. Gender differences in the physical fitness were greatest in the
explosive strength of upper (p ≤ 0.01, = 0.09) and lower limbs (p ≤ 0.01, = 0.08),
although with a medium size effect of gender, and smaller in the abdominal (p ˃ 0.05, =
0.007) and upper limbs (p ˃ 0.05, = 0.003) muscular endurance, and trunk extensor
strength and flexibility (p ˃ 0.05, = 0.001). The endomorphic (p ≤ 0.01, = 0.26) in the
girls, and the ectomorphic (p ≤ 0.01, = 0.31) and mesomorphic (p ≤ 0.01, = 0.26) in the
boys, had the high-sized effect on the physical fitness. The physical activity in the girls, and
the endomorphic and body fat in the boys, had not a significant effect. These findings can
help in the planning of activities that take into account the success and motivation of both
boys and girls, and thus, increase levels of physical activity and physical fitness at school.
However, in prepubescent children, one cannot neglect the influence of genetic determinism,
observed from the morpho-constitutional point of view.
Key words: genders difference, somatotype, motor performance, school

Predictors of gender differences in physical fitness
34
Introduction
Physical fitness has been recognized as a key determinant in healthy lifestyles based
increasingly on criteria referenced to general health and not merely to motor performance
(Ortega et al., 2007). It has positively been related, among others, with benefits to
cardiovascular, total and abdominal adiposity, skeletal health, depression, anxiety, self-
esteem, and higher academic performance (Kvaavik et al., 2009; Ortega et al., 2007).
However, many children and adolescents are only exposed to vigorous physical activity during
school-based physical education classes (Coleman et al., 2004). That way, school seems to
provide an excellent setting to enhance physical activity and physical fitness levels.
Unfortunately it has been observed that there is an apparent avoidance of children of the
physical education classes and regular physical activity practice at school (Roetert, 2004).
This decrease in the interest of children in physical education is due in part, to lack of
planning that takes into account the interest, motivation and success of children in the
execution of the exercises, respecting the differences among students, including boys and
girls (Haff, 2003). Physical education classes or extracurricular activities commonly include
children of both sexes. This requires teachers to establish a match between the goals they
want to achieve and the means and resources available, taking into account the various
constraints that may arise, such as reduced practice time per session, number of weekly
sessions, lack of material resources and facilities, high numbers of students by class and
variety of content to be taught, often involving the same activities for boys and girls alike.
In this respect, beyond the duty of the teacher to maximize the opportunities for practice, it
is necessary to program the exercises in school in order to make them appealing and
motivating for both boys and girls (NIH Consensus Development Panel on Physical Activity and
Cardiovascular Health, 1996). The psychological saturation and physiological enervation that
may attend on attempts to match results close to those achieved by opposite-sex colleagues
in the same exercise can be alleviated where there is knowledge about which exercises and
the respective capabilities they deploy can be best performed concurrently by boys and girls.
One of the major reasons why many children drop out of sport and physical activity is that
they feel they do not have the necessary skills to be involved. Both girls and boys tend to be
reluctant to participate if their perceived level of skill is low. The proof of this is that the
female students reported more positive and adaptive perceptions in same-sex classes (Lyu
and Gill, 2011). Thus the knowledge, not only of the physical capabilities in which boys and
girls are higher, but the magnitude of the differences between them, can help teachers in the
planning and organizing of activities at school, increasing the motivational levels in the
exercises, and thus, increasing levels of physical activity and physical fitness of their
students. Also at the level of assessment this knowledge may add value in allowing to the
teacher to better analyze and understand the results obtained in general.

Predictors of gender differences in physical fitness
35
On the other hand, for a better understanding of gender differences in physical fitness, will
be important to understand the interaction of several factors referred in the literature with
the motor performance, in both boys and girls. There are many evidences pointing to
significant differences between boys and girls in motor performance (Cepero et al., 2011;
Hands et al., 2009). These differences are due in large part to gender differences in levels of
habitual physical activity (Sveinsson et al., 2009) and body fat (Cepero et al., 2011; Lennox et
al., 2008). While body fat is associated negatively with several motor tasks, particularly those
related to the propulsion and lift movements of the body (Dumith et al., 2010), higher levels
of physical activity represent a gain in motor performance in general (Sola et al., 2010).
However, there exists a relative paucity of published reports focused on the differences in
the physical fitness between pre-pubertal boys and girls regarding his/her somatotype. Most
studies in this context refers to the influence of body mass index in the motor performance in
youth, but somatotype has been found to be inherited to a greater extent than body mass
index (Reis et al., 2007). The values of relative adiposity, relative muscle-skeletal magnitude,
(robustness) or relative thinness of the subjects (Malina & Bouchard, 1991) allow
performances to vary depending on the type of motor tasks (Jakšić & Cvetković, 2009). One
cannot exceed the limits imposed by what is a manifestation of genetic determinism,
observed from the morpho-constitutional point of view and there is evidence that by pre-
puberty there already exists a fairly stable somatotype, pointing to 8 years as the age by
which somatotype stability becomes manifest (Malina & Bouchard, 1991; Malina et al., 2004).
Hence it seems relevant to examine, in this age group, the effect of the presence/ absence of
certain physical traits on the motor performance, and compare it with the effect of body fat
and physical activity, often referenced in the literature.
The aim of this investigation was to analyze in which physical capabilities boys and girls are
closer/ distant. An additional objective was to find which of the body fat, physical activity
and somatotype factor is more interactive with prepubescent children’s physical fitness level.
It was considered the hypothesis that there is a set of exercises and physical capabilities
inherent to them, in which the performance of boys and girls is very similar/ divergent. We
also hypothesized that, despite the age group considered, somatotype already plays a
determinant role on the performance of selected exercises, in both boys and girls.
Material and Methods
It has been observed that there is an apparent decrease in the interest of children in physical
education due, in part, to lack of planning that takes into account the success of children in
the execution of the exercises respecting the differences among students, including boys and
girls. The knowledge of the magnitude of the differences between boys and girls in physical

Predictors of gender differences in physical fitness
36
fitness can help the planning of activities that promote the success and motivation of both
boys and girls, and thus, improve levels of physical activity and physical fitness at school. On
the other hand, the knowledge of the effect of the somatotype on the performance in the
pre-puberty (comparing it with the effect of body fat and physical activity, often referenced
in the literature), may also allow a better understanding of gender differences.
Three hundred and twelve students were recruited from a Portuguese public basic school
(from 5th and 6th grade) to perform this study. In Portugal, a physical education class has a
set of 45 min and another of 90 min twice a week. Typical physical education classes include
various activities, in which participate simultaneously boys and girls, with a clear pedagogical
focus, but mainly for the purpose of promoting levels of physical activity and physical fitness
of students. Usually these classes start with jogging run during 10 min to general warm up,
proceed to joint mobilization and general stretches. After that the class is divided into 2 or 3
proficiency level groups to start the main activities/sports of the class.
The required data were collected (from January 4th to February 25th of 2011) from self-
assessed of maturity level, anthropometric measurements, questionnaire about habitual
physical activity and application of a battery of previously selected tests. All anthropometric
measurements were carried out prior to any physical performance test. All participants were
familiarized with physical fitness tests and the measurements were performed after a 10 min
warm up period (7 min running with an intensity sufficient to raise breath rate, 3 min
stretching and joint specific warm up). All measurements were performed by the same
investigator, in the first periods in the morning, and the testing assessment procedures were
always conducted in the same indoor sportive facility (with temperature between 15ºC and
18ºC). In the course of conducting testing there was a constant concern to ensure the
necessary security and maintenance of safe hydration levels, as well as to encourage all
children to achieve the best results. Were also given clear instructions about the importance
of adequate nutrition for physical activity. The following exclusion criteria were used:
subjects with a chronic pediatric disease or with an orthopedic limitation. Subsequently, to
minimize the effects of growth, only were selected for the sample the subjects who were
self-assessed in Tanner stages 1-2.
Sample
The sample, cross-sectional in type, consisted of 312 prepubescent children (160 girls, 152
boys) all of whom volunteered for this study. The age, height and weight of the whole sample
were: 10.8 ± 0.4 years, 1.45 ± 0.08 m, 40.0 ± 8.7 kg, respectively (girls: 10.8 ± 0.4 years, 1.44
± 0.07 m, 38.9 ± 8.5 kg; boys: 10.8 ± 0.4 years, 1.45 ± 0.09 m, 41.2 ± 8.8 kg). Both boys and
girls were in Tanner stages 1-2 (girls: stage 1, 53.1% and stage 2, 46.9%; boys: stage 1, 81.6%
and stage 2, 18.4%). This study was approved by the institutional review boards of the
University of Beira Interior (UBI) and Research Centre in Sports, Health and Human
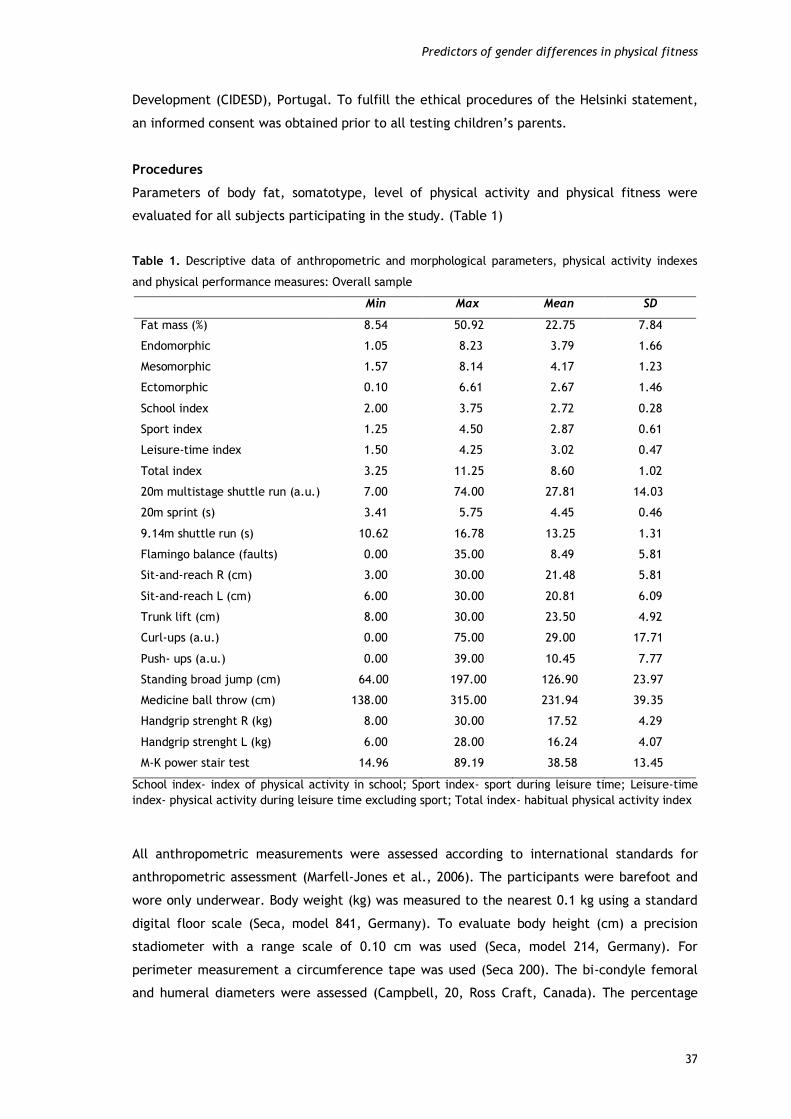
Predictors of gender differences in physical fitness
37
Development (CIDESD), Portugal. To fulfill the ethical procedures of the Helsinki statement,
an informed consent was obtained prior to all testing children’s parents.
Procedures
Parameters of body fat, somatotype, level of physical activity and physical fitness were
evaluated for all subjects participating in the study. (Table 1)
Table 1. Descriptive data of anthropometric and morphological parameters, physical activity indexes
and physical performance measures: Overall sample
Min Max Mean SD
Fat mass (%) 8.54 50.92 22.75 7.84
Endomorphic 1.05 8.23 3.79 1.66
Mesomorphic 1.57 8.14 4.17 1.23
Ectomorphic 0.10 6.61 2.67 1.46
School index 2.00 3.75 2.72 0.28
Sport index 1.25 4.50 2.87 0.61
Leisure-time index 1.50 4.25 3.02 0.47
Total index 3.25 11.25 8.60 1.02
20m multistage shuttle run (a.u.) 7.00 74.00 27.81 14.03
20m sprint (s) 3.41 5.75 4.45 0.46
9.14m shuttle run (s) 10.62 16.78 13.25 1.31
Flamingo balance (faults) 0.00 35.00 8.49 5.81
Sit-and-reach R (cm) 3.00 30.00 21.48 5.81
Sit-and-reach L (cm) 6.00 30.00 20.81 6.09
Trunk lift (cm) 8.00 30.00 23.50 4.92
Curl-ups (a.u.) 0.00 75.00 29.00 17.71
Push- ups (a.u.) 0.00 39.00 10.45 7.77
Standing broad jump (cm) 64.00 197.00 126.90 23.97
Medicine ball throw (cm) 138.00 315.00 231.94 39.35
Handgrip strenght R (kg) 8.00 30.00 17.52 4.29
Handgrip strenght L (kg) 6.00 28.00 16.24 4.07
M-K power stair test 14.96 89.19 38.58 13.45
School index- index of physical activity in school; Sport index- sport during leisure time; Leisure-time
index- physical activity during leisure time excluding sport; Total index- habitual physical activity index
All anthropometric measurements were assessed according to international standards for
anthropometric assessment (Marfell-Jones et al., 2006). The participants were barefoot and
wore only underwear. Body weight (kg) was measured to the nearest 0.1 kg using a standard
digital floor scale (Seca, model 841, Germany). To evaluate body height (cm) a precision
stadiometer with a range scale of 0.10 cm was used (Seca, model 214, Germany). For
perimeter measurement a circumference tape was used (Seca 200). The bi-condyle femoral
and humeral diameters were assessed (Campbell, 20, Ross Craft, Canada). The percentage

Predictors of gender differences in physical fitness
38
body fat (%FAT) from skinfold anthropometry was calculated following Slaughter et al. (1988).
As such, triceps and subscapular skinfolds were determined by internationally recommended
methods (Marfell-Jones et al., 2006). The definition of morphological typology (TYPE) used
the method described by Heath-Carter (1971), expressed quantitatively by a score of three
components: endomorphy (ENDO), mesomorphy (MESO), and ectomorphy (ECTO). Maturity
level based on Tanner stages was self-assessed (Faigenbaum, 1996). Students were asked to
answer to an image with corresponding legend questionnaire, in an individual booth, without
interference from their teachers or school friends.
The habitual physical activity level (PA) was measured using the Baecke et al. (1982)
questionnaire expressed quantitatively by a score of three indexes: physical activity in school,
sport during leisure time and physical activity during leisure time excluding sport.
For the assessment of physical fitness, motor tests were chosen to include the assessment of
aerobic capability (20-meter multistage shuttle-run), flexibility of the lower back and
hamstrings (left and right sit-and-reach), trunk extensor strength and flexibility (trunk lift),
speed (20m sprint), agility and coordination (9.14m shuttle-run), general stability (flamingo
balance), muscle strength and endurance (curl-ups and push-ups), explosive strength
(standing broad jump and medicine ball throw), maximum isometric strength (hand-grip
strength) and anaerobic muscular power (Margaria-Kalamen power stair test). Curl-ups, push-
ups, 20-meter multistage shuttle-run, sit-and-reach and trunk lift were evaluated using field
tests from the FITNESSGRAM test battery (Meredith & Welk, 2007). Standing broad jump, hand
grip strength and flamingo balance were assessed using EUROFIT test battery (Adam et al.,
1988). Shuttle-run agility test was evaluated using the AAHPERD test battery (American
Alliance for Health, Physical Education, Recreation and Dance, 1976). In the Margaria-
Kalamen power stair test, the protocol was used as described by George et al. (1994).
Medicine-ball throw was evaluated using the protocol described by Mayhew et al. (1997).
20-meter multistage shuttle run: This test involved continuous running between two lines
20m apart in time to recorded beeps. The subjects ran between the two lines, turning when
signaled by the recorded beeps. After about one minute, a sound indicated an increase in
speed, and the beep rhythm accelerated. This pattern was continued at intervals of 1-minute
per rhythm level. When the participants failed to reach the line on two consecutive
occasions, they were stopped and the number of completed 20m laps was recorded. The 20-
meter multistage shuttle run has shown an ICC of 0.98.
Left and right sit-and-reach: Subjects were seated with their legs joined and outstretched.
The soles of their feet were supported on a standardized wooden box (Well Box). By means of
a trunk inflection, subjects were required to reach with the index finger (arms joined and
hands superimposed) the maximum attainable distance as marked on the box. The participant
was asked to stretch four times and hold the position for one second during the fourth

Predictors of gender differences in physical fitness
39
attempt. The furthest distance the subject was able to reach was recorded in centimeters.
The ICC of data for left and right sit-and-reach was 0.96 and 0.97, respectively.
Trunk lift: The subjects raised the torso as high as possible from the floor from a prone
position, while keeping the eyes on an object placed on the floor in line with the eyes. This
position was held while the distance from the floor to the chin was measured. Two trials were
given and the furthest distance was measured in centimeters. The trunk lift has shown an ICC
of 0.94.
20-meter sprint running: In a track measuring 20 meters in length, subjects were required to
cover the distance in the shortest time they could. Time to run 20m was obtained using
photocells (Brower Timing System, Fairlee, Vermont, USA). Three trials were performed and
the best time scored (seconds and hundredth) was registered. The sprint running (time) has
shown an ICC of 0.96.
Shuttle-run agility test: Subjects were asked to tack and shift, at the fastest pace they were
capable of, within an area delimited by two lines (9.14m apart each other). Two blocks were
placed on the line opposite the starting line. On a given signal, the participant sprinted to the
opposite line, picked up a block of wood, ran back and placed it on or beyond the starting
line. Then, turning without pause, they ran back to retrieve the second block carrying it back
across the finishing line. Three trials were performed and the best time scored (seconds and
hundredths) was registered. This test has shown an ICC of 0.98.
Flamingo balance: Balancing on a preferred leg, the subject was required to flex the free leg
at the knee with the foot of this leg held close to the buttocks. The stopwatch was stopped
each time the participants lost balance (either by falling off the beam or letting go of the
foot being held). The exercise was then recommenced, and again timed until balance was
lost. The number of such falls occurring over 60 seconds was then counted. The Flamingo
balance has shown an ICC of 0.93.
Standing long jump: The participants stood feet slightly apart (toes behind a starting line)
and jumped as far forwards as possible. Three trials were given and the furthest distance was
measured in centimeters from the starting line to the heel of the foot nearest to this line.
The standing long jump has shown an ICC of 0.97.
Curl-ups: Participants were required to bend their knees at approximately 140 degrees, feet
flat on the floor, arms straight and parallel to the trunk with palms of hands resting on the
mat. The fingers were fully extended and the head placed in contact with the mat. One
measuring strip was placed on the mat under the legs. The participant then curled up slowly,
sliding the fingers across the measuring strip until the fingertips reached the other side, then

Predictors of gender differences in physical fitness
40
curled back down until the head touched the mat. The number of correct curl-ups performed
in a cadence of 20 curl-ups per minute (1 curl-up every 3 seconds) was then scored. This test
has shown an ICC of 0.97.
Push-ups: The participants were positioned with hands and toes touching the floor, body and
legs in a straight line, feet slightly apart, arms at shoulder-width apart, extended and at right
angles to the body. Keeping the back and knees straight, the subject then lowered the body
to the point at which there was a 90-degree angle at the elbows, with the upper arms parallel
to the floor. The total number of correct push-ups was recorded during a cadence of 20
complete push-ups per minute (one complete push-up every 3 seconds). This test has shown
an ICC of 0.97.
Medicine-ball throw: Subjects were seated with the backside of the trunk in touch with a
wall. They were required to hold a medicine-ball (Bhalla International- Vinex Sports, Meerut-
India) weighing 2kg (Vinex, model VMB-002R) with their hands (abreast of chest) and throw it
forward over the maximum distance possible. Hip inflection was not allowed nor withdrawal
of the trunk away from the wall. Three trials were given and the furthest throw was
measured in centimeters from the wall to the first point at which the ball made contact with
floor. The medicine-ball throw has shown an ICC of 0.97.
Left and right hand grip strength: This was measured by the Jamar (0-200 lbs) hydraulic hand
dynamometer. Each participant stood erect in the 90° elbow flexion position. The handle of
the dynamometer was adjusted if required. Subjects were then instructed to exert maximal
grip (for about 3 seconds), interrupted by brief pauses (of about 1 min.). No other body
movement was allowed. Three trials were given for each hand separately and the best score
recorded in kg was chosen for analysis. The ICC of data for left and right hand grip strength
was 0.99 and 0.96, respectively.
Margaria-Kalamen power stair: The participant was placed ready at the starting line 6 meters
in front of the first step. On command, the subject sprinted to and up the flight of steps,
taking preferably three steps at a time in the attempt to mount the steps as fast as possible.
The time taken to get from the third step to the ninth step was then recorded. The test was
repeated three times and the fastest time recorded in hundredths of seconds. Power (kg.m.s-
1) was calculated as follows: Power = body mass (kg) x vertical distance between steps (m) /
time(s). The Margaria-Kalamen power stair has shown an ICC of 0.97.
Statistics
Standard statistical methods were used for the calculation of the means and standard
deviations. Intraclass correlation coefficient (ICC) was used to determine between-subject
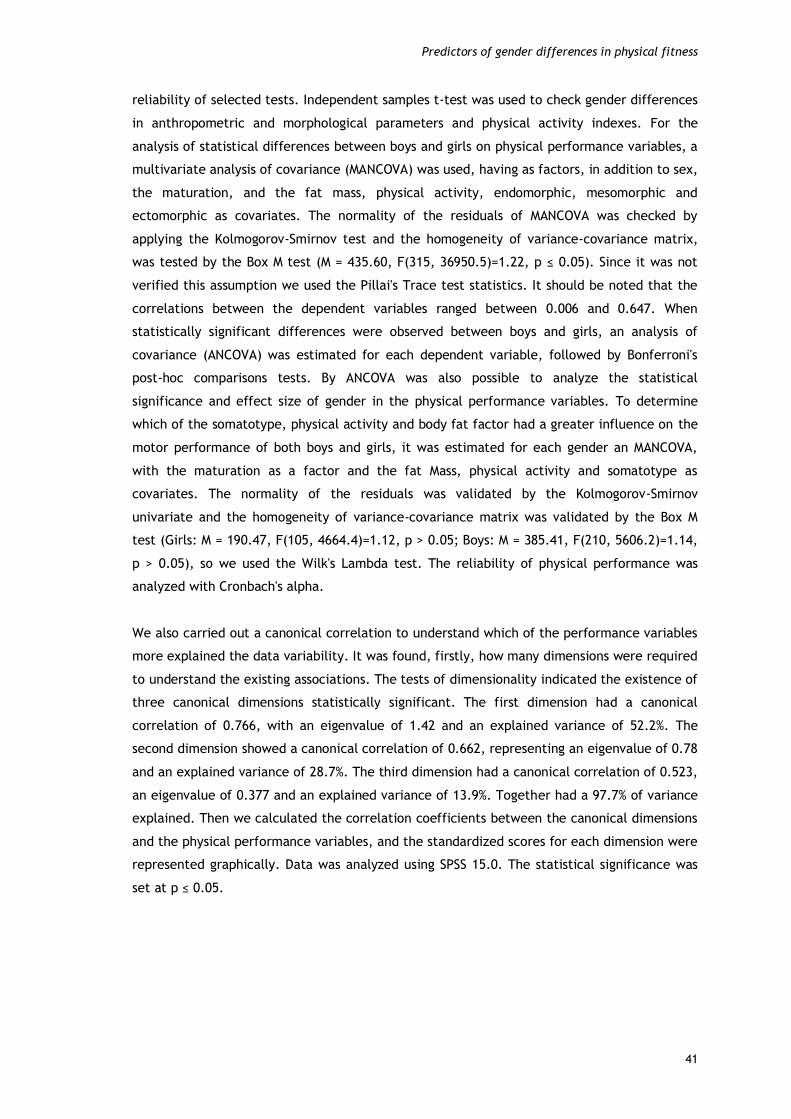
Predictors of gender differences in physical fitness
41
reliability of selected tests. Independent samples t-test was used to check gender differences
in anthropometric and morphological parameters and physical activity indexes. For the
analysis of statistical differences between boys and girls on physical performance variables, a
multivariate analysis of covariance (MANCOVA) was used, having as factors, in addition to sex,
the maturation, and the fat mass, physical activity, endomorphic, mesomorphic and
ectomorphic as covariates. The normality of the residuals of MANCOVA was checked by
applying the Kolmogorov-Smirnov test and the homogeneity of variance-covariance matrix,
was tested by the Box M test (M = 435.60, F(315, 36950.5)=1.22, p ≤ 0.05). Since it was not
verified this assumption we used the Pillai's Trace test statistics. It should be noted that the
correlations between the dependent variables ranged between 0.006 and 0.647. When
statistically significant differences were observed between boys and girls, an analysis of
covariance (ANCOVA) was estimated for each dependent variable, followed by Bonferroni's
post-hoc comparisons tests. By ANCOVA was also possible to analyze the statistical
significance and effect size of gender in the physical performance variables. To determine
which of the somatotype, physical activity and body fat factor had a greater influence on the
motor performance of both boys and girls, it was estimated for each gender an MANCOVA,
with the maturation as a factor and the fat Mass, physical activity and somatotype as
covariates. The normality of the residuals was validated by the Kolmogorov-Smirnov
univariate and the homogeneity of variance-covariance matrix was validated by the Box M
test (Girls: M = 190.47, F(105, 4664.4)=1.12, p > 0.05; Boys: M = 385.41, F(210, 5606.2)=1.14,
p > 0.05), so we used the Wilk's Lambda test. The reliability of physical performance was
analyzed with Cronbach's alpha.
We also carried out a canonical correlation to understand which of the performance variables
more explained the data variability. It was found, firstly, how many dimensions were required
to understand the existing associations. The tests of dimensionality indicated the existence of
three canonical dimensions statistically significant. The first dimension had a canonical
correlation of 0.766, with an eigenvalue of 1.42 and an explained variance of 52.2%. The
second dimension showed a canonical correlation of 0.662, representing an eigenvalue of 0.78
and an explained variance of 28.7%. The third dimension had a canonical correlation of 0.523,
an eigenvalue of 0.377 and an explained variance of 13.9%. Together had a 97.7% of variance
explained. Then we calculated the correlation coefficients between the canonical dimensions
and the physical performance variables, and the standardized scores for each dimension were
represented graphically. Data was analyzed using SPSS 15.0. The statistical significance was
set at p ≤ 0.05.

Predictors of gender differences in physical fitness
42
Results
Regarding gender differences in anthropometric and morphological parameters and physical
activity indexes, we can observe that girls registered higher mean values of % FAT, ENDO, and
ECTO. On the other hand, boys showed higher values in the MESO component and in all levels
of physical activity (school, sport, leisure-time and total physical activity indexes). However,
these differences were only significant in the MESO (t = -7.897, p ≤ 0.001) and ECTO (t =
2.161, p ≤ 0.05) components, and school (t = -2.392, p ≤ 0.05), sport (t = -5.594, p ≤ 0.001)
and total (t = -4.330, p ≤ 0.001) physical activity indexes. In %FAT, ENDO and leisure-time
index, gender differences were not statistically significant.
In the analysis of gender differences in physical performance, the MANCOVA showed that
physical fitness variables had a Cronbach's Alpha of 0.705, which indicates that they have a
reasonable reliability for the physical performance measurement. It was observed a
significant and high-sized effect of gender in all physical performance measures (Pillai’s Trace
= 0.28, F(14, 291) = 8.13, p ≤ 0.01, = 0.28, Power = 1.00). However, we found that the
effect of Tanner`s stage was not significant (Pillai’s Trace = 0.44, F(14, 291) = 0.97, p > 0.05,
= 0.04, Power = 0.61). Through the ANCOVA, estimated for each dependent variable when
statistically significant differences were observed between boys and girls, it was observed
that boys were superior to girls on tests of aerobic capability, speed, agility, explosive
strength and maximum isometric strength. The girls were superior in flexibility of the lower
back and hamstrings and balance. (Table 2)
Regarding MANCOVA estimated for the girls, it was observed a significant and high-sized
effect of endormophic in all physical performance measures, followed by body fat,
Ectomorphic and Mesomorphic, with significant but medium-sized effect. The physical
Activity did not, for girls, a statistically significant effect on physical performance variables.
In the boys there was a significant and high-sized effect of Ectomorphic and Mesomorphic in
all physical performance measures, followed by physical activity with significant but medium-
sized effect. The variables body fat and endomorphic did not, for boys, a statistically
significant effect on physical performance variables. (Table 3)
Through the ANCOVA, it was observed that gender differences in physical fitness were greater
in the explosive strength of upper and lower limbs (medicine ball throw and standing broad
jump), although with a medium size effect of gender. In the opposite direction, gender
differences were smaller in the muscle strength and endurance (curl-ups and push-ups) and
trunk extensor strength and flexibility (trunk lift), followed by speed (20m run) and balance
(flamingo balance). (Table 4)

Predictors of gender differences in physical fitness
43
Table 2. Gender`s difference in physical performance: Adjusted means after MANCOVA
Mean SE 95% CI
p1
LB UB
20m shuttle run (a.u.) Female 25.38 1.05 23.32 27.44 0.001**
Male 31.05 1.19 28.71 33.39
20m sprint (s) Female 4.52 0.04 4.45 4.60 0.047*
Male 4.40 0.04 4.31 4.48
9.14m shuttle run (s) Female 13.56 0.10 13.36 13.77 <0.001**
Male 12.89 0.12 12.65 13.12
Flamingo balance (faults) Female 7.55 0.50 6.56 8.53 0.011*
Male 9.70 0.57 8.58 10.82
Sit-and-reach R (cm) Female 22.95 0.50 21.96 23.93 0.001**
Male 20.07 0.57 18.95 21.18
Sit-and-reach L (cm) Female 23.03 0.52 22.01 24.04 <0.001**
Male 18.62 0.59 17.47 19.78
Trunk lift (cm) Female 23.75 0.44 22.87 24.62 0.583
Male 23.34 0.50 22.35 24.33
Curl-ups (a.u.) Female 26.61 1.50 23.67 29.55 0.145
Male 30.27 1.70 26.93 33.62
Push- ups (a.u.) Female 9.95 0.61 8.75 11.15 0.362
Male 10.89 0.70 9.52 12.25
Standing broad jump (cm) Female 119.30 1.83 115.70 122.90 <0.001**
Male 135.42 2.08 131.33 139.51
Medicine ball throw (cm) Female 218.28 3.29 211.80 224.75 <0.001**
Male 248.91 3.74 241.56 256.27
Handgrip strenght R (Kg) Female 16.88 0.36 16.17 17.58 0.006**
Male 18.53 0.41 17.72 19.33
Handgrip strenght L (Kg) Female 15.54 0.35 14.86 16.22 0.003**
Male 17.27 0.39 16.50 18.04
M-K power stair test Female 34.62 1.16 32.35 36.90 <0.001**
Male 43.88 1.31 41.29 46.46
1 Bonferroni’s Test; SE - Standard Error; CI - Confidence Interval; LB - Lower Bound; UB - Upper Bound. * p ≤ 0.05; ** p ≤ 0.01
Table 5 shows the correlation coefficients between the canonical dimensions and physical
performance variables. The performance variables with the greatest effect on the first
dimension were the endurance (0.708), explosive strength of lower limbs (0555), abdominal
muscular endurance (0.494), agility (-0.491) and speed (-0.465). In the second dimension the
variables flexibility of the lower back and hamstrings (right: -0.349, and left: -0.374) and
balance (0.373) were the ones that had a stronger correlation with this dimension. In the
third dimension the speed (-0.515) and agility (-0.507) were the variables with the highest
correlation with this dimension. (Table 5)

Predictors of gender differences in physical fitness
44
Table 3. Effect of the somatotype, physical activity and body fat factors on the physical performance of boys and girls: MANCOVA
Effect F p Partial Eta
Squared
Observed
Power
Male
Fat mass (%) 0.599 0.862 0.060 0.359
Physical activity 2.217 0.010** 0.190 0.960
Endomorphic 1.196 0.286 0.113 0.705
Mesomorphic 3.379 <0.001** 0.264 0.998
Ectomorphic 4.314 <0.001** 0.314 1,000
Female
Fat mass (%) 2.585 0.002** 0.205 0.984
Physical activity 1.554 0.100 0.135 0.843
Endomorphic 3.444 <0.001** 0.256 0.998
Mesomorphic 2.131 0.013* 0.176 0.952
Ectomorphic 2.422 0.005** 0.195 0.976
* p ≤ 0.05; ** p ≤ 0.01
Table 4. Statistical significance and effect size of sex on the physical performance variables: ANCOVA
Dependent Variable F p Partial Eta
Squared
Observed
Power
20m multistage shuttle run (a.u.) 10.490 0.001** 0.033 0.898
20m sprint (s) 3.966 0.047* 0.013 0.510
9.14m shuttle run (s) 14.927 <0.001** 0.047 0.971
Flamingo balance (faults) 6.558 0.011* 0.021 0.723
Sit-and-reach R (cm) 11.869 0.001** 0.038 0.930
Sit-and-reach L (cm) 25.937 <0.001** 0.071 0.999
Trunk lift (cm) 0.302 0.583 0.001 0.085
Curl-ups (a.u.) 2.138 0.145 0.007 0.308
Push- ups (a.u.) 0.834 0.362 0.003 0.149
Standing broad jump (cm) 27.710 <0.001** 0.084 0.999
Medicine ball throw (cm) 30.933 <0.001** 0.092 1,000
Handgrip strenght R (kg) 7.529 0.006** 0.024 0.781
Handgrip strenght L (kg) 8.928 0.003** 0.029 0.846
M-K power stair test 22.827 <0.001** 0.070 0.997
* p <0.05, ** p < 0.01

Predictors of gender differences in physical fitness
45
Table 5. Correlations between canonical coefficients and variables
Canonical Dimensions1
1 2 3
Performance
variables
20m shuttle run (a.u.) 0.708 -0.224 0.035
20m sprint (s) -0.465 0.142 -0.515
9.14m shuttle run (s) -0.491 0.049 -0.507
Flamingo balance (faults) -0.262 0.373 0.114
Sit-and-reach R (cm) 0.139 -0.349 -0.318
Sit-and-reach L (cm) -0.004 -0.374 -0.262
Trunk lift (cm) -0.109 -0.121 -0.337
Curl-ups (a.u.) 0.494 -0.010 0.024
Push- ups (a.u.) 0.274 -0.026 0.031
Standing broad jump (cm) 0.555 -0.148 0.459
Medicine ball throw (cm) -0.034 0.333 0.332
Handgrip strenght R (kg) -0.201 0.308 0.519
Handgrip strenght L (kg) -0.202 0.303 0.412
M-K power stair test 0.082 0.243 0.099
Eigenvalue and
variance
Eigenvalue 1.417 0.780 0.377
% of Variance 52.2 28.7 13.9
% of Cumulative Variance 52.2 80.9 94.8
Canonical Corrrelations 0.766 0.662 0.523
Wilks lambda 0.147 0.355 0.632
Multivariate tests
F 7.420 4.839 2.748
DF 1 90.0 70.0 52.0
DF 2 1643.1 1394.3 1136.9
p <0.001 ** <0.001 ** <0.001 **
1Significant Canonical dimensions; DF 1: Hypothesis Degrees Freedom; DF 2: Error Degrees Freedom ** p < 0.01
Figure 1 shows the standardized scores for the first dimension (has the variables with the
greatest positive effect the endurance, explosive strength of lower limbs and abdominal
muscular endurance, in which boys have greater values than the average, and greatest
negative effect the speed and agility, where boys have smaller values than the average), and
second dimension (has the variable with the greatest positive effect the balance, where boys
have a number of faults greater than the average, and greatest negative effect the flexibility
of the lower back and hamstrings, where boys have smaller values than the average). It is
observed that the scores of the boys are more concentrated in the 4th quadrant (values above
the average in the first dimension, and below the average in the second dimension), while in
girls the values are more concentrated in the 1st quadrant (values above the average in the
second dimension and below the average in the first dimension).

Predictors of gender differences in physical fitness
46
Figure 1. Scatterplot between Dimension 1 and Dimension 2 by sex
Figure 2 shows the standardized scores for the second and third dimensions. The third
dimension has the variables with the greatest positive effect the maximum isometric strength
and explosive strength of lower limbs, in which boys have greatest values than the average,
and greatest negative effect the speed and agility, where boys have smaller values than the
average. It is observed that the scores of the boys are more concentrated in the 2nd quadrant
(values below the average in the second dimension, and above the average in the third
dimension) while in girls the values are more concentrated in the 4th quadrant (values above
the average in the second dimension and below the average in the third dimension).
Figure 2. Scatterplot between Dimension 2 and Dimension 3 by sex
Boys
Girls
Boys
Girls

Predictors of gender differences in physical fitness
47
Discussion
The purpose of this study was to analyze in which physical capabilities boys and girls are
closer/ divergent. An additional objective was to find which of the body fat, physical activity
and somatotype factor is more interactive with prepubescent children’s physical fitness level.
The main results suggested that the somatotype had the greatest influence on the motor
performance of both boys and girls (ectomorphic and mesomorphic in the boys and
endomorphic in the girls). The physical activity in the girls, and the endomorphic and body fat
in the boys, had not a significant effect. The difference between boys and girls in the physical
fitness was greater in the explosive strength of upper and lower limbs, and smaller in the
abdominal and upper limbs muscular endurance, and trunk extensor strength and flexibility,
followed by speed and balance.
The girls studied showed higher values of %FAT, ENDO, and ECTO compared to boys. The
higher percentage values of body fat in girls are consistent with several studies in the
literature that report higher such values for females in general (Cepero et al., 2011; Lennox
et al., 2008; Sveinsson et al., 2009). ENDO expresses the degree of adiposity development
(Malina & Bouchard, 1991) being a variable close to % FAT, either in terms of definition or the
way they are both calculated, so that values here also show higher for girls than for boys
(Malina & Bouchard, 1991). This body fat represents an inert non-contributory load and thus
an increased metabolic cost for children, making them less efficient in terms of
cardiorespiratory response as well as performance on tests that require lifting and propulsion
tasks (Artero et al., 2010; Dumith et al., 2010; Tovar et al., 2008). ECTO represents the
relative thinness of the subject (Malina & Bouchard, 1991) and therefore associates negatively
with strength (Malina & Bouchard, 1991). At the chronological ages under discussion it seems
that the weighting index, i.e., the quotient of height by the cube root of body weight, which
is based on the ECTO (Malina & Bouchard, 1991) is in favor of girls. This becomes more
noticeable if we consider that the height growth curves in male and female intersect for a
time, referred to as "crossing over", when girls overtake boys in stature, a stage which
coincides with pre-puberty (Malina & Bouchard, 1991). The boys showed higher values in the
MESO component and in all levels of physical activity (school index, sport index, leisure-time
index and total index) relative to the girls. The main literature also refers to higher MESO
values (Malina & Bouchard, 1991; Malina et al., 2004) and higher levels of physical activity
(Hands et al., 2009; Lennox et al., 2008; Sveinsson et al., 2009) in males subjects. MESO
represents the relative skeletal-muscle magnitude (robustness), and therefore associates
positively with strength and motor performance in general (Malina & Bouchard, 1991).
Similarly, higher levels of physical activity are associated with a better physical fitness of
children (Hands et al., 2009; Lennox et al., 2008; Reed & Metzker, 2004; Tovar et al., 2008).

Predictors of gender differences in physical fitness
48
The curious in this study is that the variables with no significant effect on the physical fitness
of boys are the ones that had the greatest effect on the performance of girls (endomorphic
and body fat). The greater robustness (Malina & Bouchard, 1991) and higher levels of physical
activity (Sveinsson et al., 2009) of the boys, as well as the higher levels of body fat (Cepero
et al., 2011; Lennox et al., 2008) and a more sedentary lifestyle (Sveinsson et al., 2009) of
the girls seem to have influenced the effect of each of these factors on the physical fitness of
boys and girls. No less interesting is that the primary components of the somatotype had the
greatest influence on the motor performance of both boys and girls (ectomorphic and
mesomorphic in the boys and endomorphic in the girls), and therefore the relative skeletal-
muscle magnitude of the boys and the degree of adiposity development of the girls seems to
have reduced the dependence of the other factors on the motor performance. This fact
highlights the importance of the morphological typology in the prepubescent children’s
physical fitness level, and seems to suggest that one cannot neglect the limits imposed by
what is a manifestation of genetic determinism, observed from the morpho-constitutional
point of view, since the presence/absence of certain physical traits seems to be determinant
on the physical performance of both boys and girls.
In terms of gender differences in motor performance, the results confirm those of other
studies that report the superiority of boys in tests of aerobic fitness and muscular strength
and of girls in tests of balance and flexibility (Cepero et al., 2011; Hands et al., 2009; Lennox
et al., 2008). Additionally, our findings indicate that the difference between boys and girls in
physical fitness was greater in the explosive strength of upper and lower limbs, although with
a medium size effect of gender. In the opposite direction, gender differences were smaller in
the muscle strength and endurance (curl-ups and push-ups) and trunk extensor strength and
flexibility, followed by speed and balance. Looking for the canonical correlation, the physical
performance variables that most explain the variability of the data were the endurance,
velocity, agility, handgrip strength, abdominal muscular endurance and explosive strength of
lower limbs, in which boys are better, and flexibility of the lower back and hamstrings and
balance, in which girls scored better. According to several studies in the literature, the boys
are superior to girls in aerobic fitness because, among other factors such as higher levels of
physical activity (Hands et al., 2009; Lennox et al., 2008) and lower fat mass (Artero et al.,
2010; Dumith et al., 2010; Ortega et al., 2007), to other factors mainly linked to the cardiac
size and oxygen-carrying capacity (i.e. left ventricular inner diastolic diameter, maximal
heart rate and maximal stroke volume) (Dencker et al., 2007). These factors seem to
determine the difference found between boys and girls in cardiorespiratory fitness. In the
same way, the fat-free mass or lean body mass statistically higher in boys and higher levels of
physical activity permits a better muscular strength (Lennox et al., 2008; Tovar et al., 2008).
However, the absence of statistically significant differences between boys and girls in the
muscular endurance tests (curl-ups and push-ups), corroborates the results of previous studies
with children of similar age (Castro-Piñero et al., 2009), and may be due to the fact that the

Predictors of gender differences in physical fitness
49
weight of the boys, close to the weight of girls in pre-pubertal stage (Malina & Bouchard,
1991), be an extra load to be moved during weight-bearing tasks, added to the fact that the
boys still present a reduced muscle mass in pre-pubertal ages, because the effects of
circulating androgens, particularly testosterone, only manifest themselves at puberty (Malina
& Bouchard, 1991). Also the lower values for body fat recorded by boys give them an
advantage on tests of speed (Dumith et al., 2010) and agility (Artero et al., 2010; Dumith et
al., 2010) as well as the higher levels of physical activity permits better performance in the
same capabilities (Reed & Metzker, 2004; Sola et al., 2010). Some approximation found in
speed between boys and girls, may be due to the fact that speed is a specific capability,
highly dependent on the influence of genetic factors such as neuromuscular components and
muscle fiber quality (i.e., fiber type proportion), and the high degree of gene transfer
implied in this aptitude is today recognized (Little & Williams, 2005). Regarding the
flexibility, there are many reports than girls have larger range of motion. Some of the factors
presented are the difference of extensibility of muscle and tendon tissues, the greater
passive dorsiflexion angle of girls, because boys have a higher muscle volume, and dynamic
property of tendon tissues (Kato et al., 2005). There are also studies in the literature
referring to the absence of significant associations of this capability with physical activity
(Hands et al., 2009), and skeletal-muscle magnitude (robustness), favorable to boys (Shukla
et al., 2009). There are even studies that report a negative association between the physical
activity levels with performance on tests of flexibility (Lennox et al., 2008). However, in this
capability, the difference by gender there occupies a place emphasized during periods of
rapid growth (Monyeki et al., 2005), which may explain in part the proximity between boys
and girls in the trunk lift, associated to the fact that this capability is also very dependent of
the upper body strength (Meredith & Welk, 2007). The study of Monyeki et al. (2005) showed
that boys at this age can be more flexible than girls. Also in the balance boys and girls showed
some proximity. These results may be due to the fact that in pre-pubertal period the
difference in stature between boys and girls gradually decrease, due to the growth velocity of
girls at this stage be higher than for boys, reaching the peak height velocity (PHV) earlier
(Malina & Bouchard, 1991). A greater stature leads to a high body's center of mass, in turn
responsible for increased postural instability on balance exercises (Allard et al., 2001).
However, other factors absent from this study may account for the approximation/
divergence of boys and girls in physical fitness. Such factors may include, among others,
different practice opportunities (Thomas & French, 1985) or the preference for activities that
require more endurance, strength and velocity, or balance and flexibility (Branta et al.,
1984).
Conclusions
It has been observed that there is an apparent decrease in the interest of children in physical
education classes and regular physical activity practice at school. This seems to be due, in

Predictors of gender differences in physical fitness
50
part, to lack of planning that takes into account the success of children in the execution of
the exercises respecting the differences among students, including boys and girls. The
knowledge of the magnitude of the differences between boys and girls in physical fitness
(greater in the explosive strength of upper and lower limbs, and smaller in the abdominal and
upper limbs muscular endurance and trunk extensor strength and flexibility, balance and
speed), can help in the planning of activities that take into account the success of both boys
and girls, and thus, increase levels of physical activity and physical fitness at school. However
the results seem to suggest that one cannot neglect the influence of genetic determinism,
observed from the morpho-constitutional point of view, since the presence of certain physical
traits girls (ectomorphic and mesomorphic in the boys and endomorphic in the girls) shown to
be determinant in prepubescent children’s physical fitness level.

51
Study 4
Effects of body fat and dominant somatotype on explosive
strength and aerobic capacity trainability in prepubescent
children
Abstract
Background: The school provides an excellent setting to enhance health-related physical
fitness, by implementing training programs. The purpose of our study was to analyze the
influence of body fat and somatotype on explosive strength and aerobic capacity trainability
in prepubescent children. Methods: One hundred twenty-five healthy children (58 boys, 67
girls), aged 10-11 years old (10.8 ± 0.4 years) were assigned into two experimental groups to
train twice a week for 8 weeks: resistance group (GR: 19 boys, 22 girls), aerobic group (GE: 21
boys, 24 girls) and a control group (GC: 18 boys, 21 girls; no training program). Results: Fat
mass (r= -.45 to -.68) and endomorphic (r= -.50 to -.70) were significantly associated with
training-induced gains in vertical (girls) and horizontal jumps, running speed and aerobic
capacity (boys and girls). The associations for ectomorphic (r= .42 to .81) were the inverse of
those for fat mass and endomorphic. The mesomorphic (r= -.44 to -.68) was only negatively
associated with training-induced VO2max gains. The mesomorphic had the high-sized effect on
the training-induced explosive strength gains, in both boys ( = 0.458) and girls ( =
0.446), and the ectomorphic on the VO2max gains, also in boys ( = 0.214) and girls ( =
0.144). Conclusions: We cannot neglect the effect of somatotype and body fat on explosive
strength and aerobic capacity trainability. At this point, it seems that the presence/ absence
of certain physical traits can be a crucial factor in prepubescent children.
Key words: school, intervention, power, aerobic, health-related physical fitness

Children’s resistance and endurance trainability
52
Introduction
During the last decade physical activity participation among young people has been
decreasing considerably, being below the WHO recommendation for health-status and well-
being (World Health Organization, 2010). Many children and adolescents are only exposed to
vigorous physical activity during school-based physical education classes (Evenson et al.,
2009), and the majority of them do not participate in any organized physical activity during
non-school hours (Centers for Disease Control and Prevention, 2003). Thus, it is important to
ensure that during these classes students are exposed to physical activities that promote
health-related physical fitness development and an active lifestyle. School seems to provide
an excellent setting to enhance and promote physical activity and physical fitness levels
(Burgeson et al., 2001; Strong et al., 2005) by implementing training programs (Evenson et
al., 2009; Stenevi-Lundgren et al., 2009). In children, because of low aerobic capacity is
associated with risk factors of cardiovascular disease (Anderssen et al., 2007), a great amount
of research has focused on activities that enhance cardiorespiratory fitness disregarding, for
instance, neuromotor fitness based on muscular strength (Cepero et al., 2011). However, it is
recognized that youth strength training approaches can be a safe and effective method of
conditioning and should be an important component of youth fitness programs, health
promotion objectives, and injury prevention(Faigenbaum et al., 2009). Indeed, improvements
in muscular fitness and speed/agility, rather than cardiorespiratory fitness, seem to have a
positive effect on skeletal health (Ortega et al., 2007). Increasing both aerobic and muscular
fitness is a desirable goal in a training program (Taanila et al., 2011).
In order to maximize the benefits of training, some studies have reported the influence of
several variables in the implementation of training programs children and adolescents, such
as the training program, supervision, instruction quality and control learning, gender, age and
maturity (Faigenbaum et al., 2009; Behringer et al., 2011). However, the influence of body
fat and somatotype on the effects of the implementation of training programs in young
people still needs to be elucidated. Body fat represents an inert load, non-contributive,
associated with an increased metabolic cost (Norman et al., 2005) and the somatotype
translates the expression of genetic determinism, observed from the morpho-constitutional
point of view (Malina & Bouchard, 1991). These factors, therefore, may influence the
execution of the planned exercises, training intensity and recovery of the performers,
resulting in different effects of applying a particular training program. Additionally, both
body fat and somatotype are significantly associated with the level of physical fitness
achieved (Dumith et al., 2010; Jakšić & Cvetković, 2009) and appears to influence the
development of a training program in children and adolescents (Faigenbaum et al., 2009).
Moreover, according to Ignjatovic et al. (2009) it would be logical to assume that young
people who are stronger and more powerful would have an advantage for the strength
training, so it will be interesting to verify this presupposition, given that during

Children’s resistance and endurance trainability
53
preadolescence the neural adaptations are the primarily responsible for training-induced
strength gains (Ramsay et al., 1990).
The purpose of the present study was to analyze the influence of body fat and somatotype on
the training of explosive strength and aerobic in prepubescent children. It was hypothesized
that somatotype and body fat have a significant effect on the training-induced strength and
aerobic gains in prepubescent untrained school children.
Material and Methods
Sample
The sample consisted of 125 prepubescent children, aged between 10 and 11 years old, all of
whom volunteered for this study. The age, height and weight of the whole sample were: 10.8
± 0.4 years, 1.43 ± 0.08 m, and 39.7 ± 9.0 kg, respectively (boys: 10.8 ± 0.5 years, 1.42 ± 0.07
m, 39.7 ± 9.3 kg; girls: 10.8 ± 0.4 years, 1.42 ± 0.07 m, 39.6 ± 8.5 kg). Both boys and girls
were in Tanner stages 1-2 (boys: stage 1, 81% and stage 2, 19%; girls: stage 1, 53.7% and stage
2, 46.3%). No subject had regularly participated in any form of strength training program prior
to this experiment. The following exclusion criteria were used: subjects with a chronic
pediatric disease or with an orthopedic limitation. Subsequently, to minimize the effects of
growth, only were selected for the sample the subjects who were self-assessed in Tanner
stages 1-2.
Procedures
One hundred twenty-five healthy children recruited from a Portuguese public basic school
(from 5th and 6th grade) were divided into two experimental groups (8 weeks training
program, twice a week, from January 9th to March 2th´of 2012) and one control group as
follows: one group performing power training (GR: 19 boys, 22 girls); another group
performing aerobic training (GE: 21 boys, 24 girls), and the third was the control group (GC:
18 boys, 21 girls; without a training program). There were no significant differences (p>0.05)
between groups for age or Tanner ratings, neither in anthropometric, morphological or
performance variables at the beginning of the protocol, in both boys and girls.
In physical education classes and after a 10 min warm up period (7 min running with an
intensity sufficient to raise breath rate, 3 min stretching and joint specific warm up), the GR
group was submitted to a strength training program composed by: 1 and 3 kg medicine ball
throws; jumps onto a box (from 0.3 m to 0.5 m); plyometric jumps above 0.3‐0.5 m of height
hurdle and; sets of 30 to 40m speed running. The GE group was subjected to a 20m shuttle
run exercise. This aerobic task was developed based on an individual training volume ‐ set to
about 75% of the established maximum aerobic volume achieved on a previous test. After 4
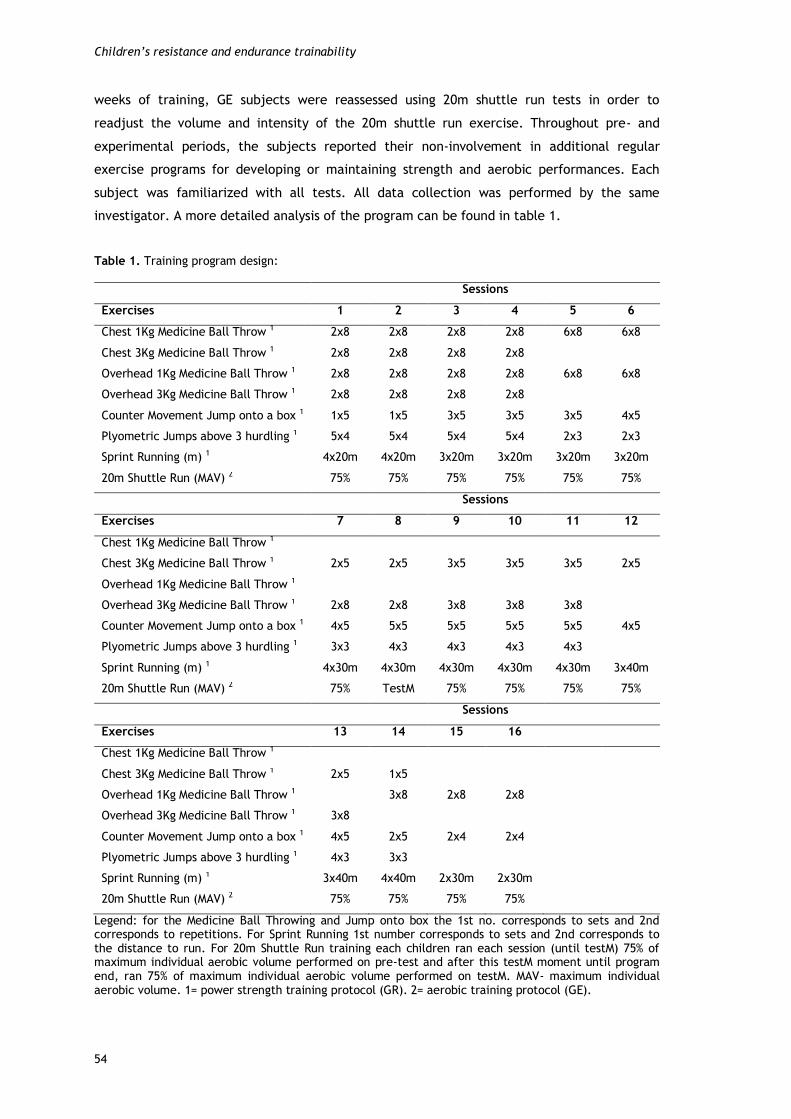
Children’s resistance and endurance trainability
54
weeks of training, GE subjects were reassessed using 20m shuttle run tests in order to
readjust the volume and intensity of the 20m shuttle run exercise. Throughout pre- and
experimental periods, the subjects reported their non-involvement in additional regular
exercise programs for developing or maintaining strength and aerobic performances. Each
subject was familiarized with all tests. All data collection was performed by the same
investigator. A more detailed analysis of the program can be found in table 1.
Table 1. Training program design:
Sessions
Exercises 1 2 3 4 5 6
Chest 1Kg Medicine Ball Throw 1 2x8 2x8 2x8 2x8 6x8 6x8
Chest 3Kg Medicine Ball Throw 1 2x8 2x8 2x8 2x8
Overhead 1Kg Medicine Ball Throw 1 2x8 2x8 2x8 2x8 6x8 6x8
Overhead 3Kg Medicine Ball Throw 1 2x8 2x8 2x8 2x8
Counter Movement Jump onto a box 1 1x5 1x5 3x5 3x5 3x5 4x5
Plyometric Jumps above 3 hurdling 1 5x4 5x4 5x4 5x4 2x3 2x3
Sprint Running (m) 1 4x20m 4x20m 3x20m 3x20m 3x20m 3x20m
20m Shuttle Run (MAV) 2 75% 75% 75% 75% 75% 75%
Sessions
Exercises 7 8 9 10 11 12
Chest 1Kg Medicine Ball Throw 1
Chest 3Kg Medicine Ball Throw 1 2x5 2x5 3x5 3x5 3x5 2x5
Overhead 1Kg Medicine Ball Throw 1
Overhead 3Kg Medicine Ball Throw 1 2x8 2x8 3x8 3x8 3x8
Counter Movement Jump onto a box 1 4x5 5x5 5x5 5x5 5x5 4x5
Plyometric Jumps above 3 hurdling 1 3x3 4x3 4x3 4x3 4x3
Sprint Running (m) 1 4x30m 4x30m 4x30m 4x30m 4x30m 3x40m
20m Shuttle Run (MAV) 2 75% TestM 75% 75% 75% 75%
Sessions
Exercises 13 14 15 16
Chest 1Kg Medicine Ball Throw 1
Chest 3Kg Medicine Ball Throw 1 2x5 1x5
Overhead 1Kg Medicine Ball Throw 1 3x8 2x8 2x8
Overhead 3Kg Medicine Ball Throw 1 3x8
Counter Movement Jump onto a box 1 4x5 2x5 2x4 2x4
Plyometric Jumps above 3 hurdling 1 4x3 3x3
Sprint Running (m) 1 3x40m 4x40m 2x30m 2x30m
20m Shuttle Run (MAV) 2 75% 75% 75% 75%
Legend: for the Medicine Ball Throwing and Jump onto box the 1st no. corresponds to sets and 2nd corresponds to repetitions. For Sprint Running 1st number corresponds to sets and 2nd corresponds to the distance to run. For 20m Shuttle Run training each children ran each session (until testM) 75% of maximum individual aerobic volume performed on pre-test and after this testM moment until program end, ran 75% of maximum individual aerobic volume performed on testM. MAV- maximum individual aerobic volume. 1= power strength training protocol (GR). 2= aerobic training protocol (GE).
Children’s resistance and endurance trainability
55
All anthropometric measurements were assessed according to international standards for
anthropometric assessment (Marfell-Jones et al., 2006) and were carried out prior to any
physical performance test. Body weight (kg) was measured to the nearest 0.1 kg using a
standard digital floor scale (Seca, model 841, Germany). To evaluate body height (cm) a
precision stadiometer with a range scale of 0.10 cm was used (Seca, model 214, Germany).
For perimeter measurement a circumference tape was used (Seca 200). It was assessed the
bi-condyle femoral and humeral diameters (Campbell, 20, Ross Craft, Canada). The percent
body fat (%BF) from skinfold anthropometry was calculated by using the method of Slaughter
et al. (1988). As such, triceps and subscapular skinfolds were determined by internationally
recommended methods (Marfell-Jones et al., 2006). The principal components of the
morphological typology, endomorphic (ENDO), mesomorphic (MESO), and ectomorphic (ECTO),
were calculated using the method described by Heath-Carter (1971). Maturity level based on
Tanner stages was self-assessed (Faigenbaum et al., 1996). To assess upper and lower body
explosive strength (medicine ball throwing and standing long jump and vertical jump,
respectively), running speed (20m sprint run) and VO2max (20m shuttle run test) the following
tests were used:
Counter movement Vertical Jump: This test was conducted on a contact mat connected to an
electronic power timer, control box and handset (Globus Ergojump, Italy). From a standing
position, with the feet shoulder-width apart and the hands placed on the pelvic girth, the
children performed a counter movement with the legs before jumping. Such movement makes
use of the stretch-shorten cycle, where the muscles are pre-stretched before shortening in
the desired direction (Linthorne, 2001). Each participant performed three jumps and the
highest jump (cm) was recorded. (ICC = 0.94)
Standing long jump: This test was assessed using EUROFIT test battery (Adam et al., 1988).
The participants stood feet slightly apart (toes behind a starting line) and jumped as far
forwards as possible. Three trials were given and the furthest distance was measured in
centimeters from the starting line to the heel of the foot nearest to this line. (ICC = 0.94)
Medicine-ball throwing: This test was performed according to the protocol described by
Mayhew et al. (1997). Subjects were seated with the backside of the trunk in touch with a
wall. They were required to hold a medicine-balls (Bhalla International - Vinex Sports, Meerut
- India) weighing 1kg (Vinex, model VMB-001R, perimeter 0.72m) and 3kg (Vinex, model VMB-
003R, perimeter 0.78m) with their hands (abreast of chest) and throw it forward over the
maximum distance possible. Hip inflection was not allowed nor withdrawal of the trunk away
from the wall. Three trials were given and the furthest throw was measured in centimeters
from the wall to the first point at which the ball made contact with floor. (ICC = 0.94 and
0.97, respectively)

Children’s resistance and endurance trainability
56
20-meter sprint running: In a track measuring 20 meters in length, subjects were required to
cover the distance in the shortest time they could. Time to run 20m was obtained using
photocells (Brower Timing System, Fairlee, Vermont, USA). Three trials were performed and
the best time scored (seconds and hundredth) was registered. (ICC = 0.97)
20-meter multistage shuttle run: This test involved continuous running between two lines
20m apart in time to recorded beeps. The subjects ran between the two lines, turning when
signaled by the recorded beeps. After about one minute, a sound indicates an increase in
speed, and the beeps will be closer together. This continues each minute (level). We used the
common version with an initial running velocity of 8.5 km/h, and increments of 0.5 km/h
each minute (Léger et al., 1988). When the participants failed to reach the line on two
consecutive occasions, they were stopped and the number of completed 20m laps was
recorded. Estimated VO2max (ml.kg-1.min-1) was calculated by the Léger's equation (Léger et
al., 1988), which is based on the level reached before boys were unable to keep up with the
audio recording. (ICC = 0.97)
Statistics
Standard statistical methods were used for the calculation of the means and standard
deviations. Normality of distribution was checked by applying the Kolmogorov-Smirnov test.
The between-subject reliability of aerobic and power tests was determined by the Intraclass
correlation coefficient (ICC). The training related effects in the control and experimental
groups were assessed using a paired-samples t-test. The relationships between body fat,
primary components of the somatotype, and training-induced gains were performed with the
Pearson`s correlation. To determine which of the somatotype and body fat factor had a
greater influence on training-induced gains in all the explosive strength measures it was
estimated, through the multivariate analysis of covariance (MANCOVA), the effect size
(Partial Eta Squared) of each independent variable. To determine which of those factors had
a greater influence on the VO2max gains, it was estimated an analysis of covariance (ANCOVA)..
Data was analyzed using SPSS 15.0. The statistical significance was set at p ≤ 0.05.
Results
At baseline, there were no significant differences between the control and experimental
groups in the explosive strength measures for either the counter movement vertical jump
(boys: t= 0.522, p= 0.605; girls: t= 0.835, p= 0.409), standing long jump (boys: t= 1.718, p=
0.095; girls: t= 1.899, p= 0.065), 1Kg (boys: t= 0.339, p= 0.737; girls: t= 1.699, p= 0.097) and
3Kg medicine ball throwing (boys: t= 0.123, p= 0.903; girls: t= 0.301, p= 0.765) or the running

Children’s resistance and endurance trainability
57
speed (boys: t= 0.583, p= 0.423; girls: t= -0.687, p= 0.496). Similarly, there were no
significant differences between groups for baseline VO2max values (boys: t= -0.604, p= 0.550;
girls: t= 1.333, p= 0.190). In the post-test, also there were no significant differences between
control and experimental groups, in both boys and girls.
Compared with the values of the beginning of the protocol, the 8-week training programs
produced significant improvements in all power strength (p ≤ 0.05) and aerobic measures (p ≤
0.01) for both boys and girls. No significant changes were observed in GC group (p ˃ 0.05).
(Table 2)
Table 2. Comparison of explosive strength and aerobic tests results mean (±SD) between experimental
and control groups in pre- (T0) and post-test (T1) conditions: Boys and girls
Group TO T1 Gains1 p
Boys
Counter Movement Jump (cm) GC 23.43 ± 5.2 24.35 ± 6.1 0.91 0.095
GR 22.50 ± 5.6 23.55 ± 6.4 1.04 0.033*
Standing Long Jump (cm) GC 140.16 ± 21.9 145.16 ± 27.4 5.00 0.117
GR 129.68 ± 14.6 136.21 ± 16.8 6.52 ˂0.001*
1Kg Medicine Ball Throwing (cm) GC 375.33 ± 74.5 380.11 ± 77.9 4.77 0.096
GR 367.52 ± 65.6 389.36 ± 68.7 21.84 ˂0.001*
3Kg Medicine Ball Throwing (cm) GC 233.22 ± 44.5 237.16 ± 46.3 3.94 0.238
GR 231.52 ± 39.0 250.36 ± 42.2 18.84 ˂0.001*
20m Sprint Running (s) GC 4.37 ± 0.2 4.34 ± 0.27 0.02 0.086
GR 4.30 ± 0.2 4.20 ± 0.26 0.09 ˂0.001*
20m Shuttle Run (ml.kg-1.min-1) GC 45.20 ± 3.9 45.70 ± 4.4 0.50 0.195
GE 45.90 ± 3.3 47.52 ± 4.1 1.61 ˂0.001*
Girls
Counter Movement Jump (cm) GC 21.06 ± 3.8 21.43 ± 4.1 0.37 0.216
GR 20.20 ± 2.8 21.33 ± 3.7 1.12 0.005*
Standing Long Jump (cm) GC 127.95 ± 15.6 130.28 ± 17.3 2.33 0.314
GR 120.36 ± 14.1 126.81 ± 11.7 6.45 ˂0.001*
1Kg Medicine Ball Throwing (cm) GC 353.14 ± 35.2 357.14 ± 39.8 4.00 0.096
GR 330.77 ± 49.5 349.72 ± 54.3 18.95 ˂0.001*
3Kg Medicine Ball Throwing (cm) GC 221.00 ± 37.6 230.33 ± 39.0 9.33 0.081
GR 217.50 ± 38.5 235.13 ± 40.6 17.63 ˂0.001*
20m Sprint Running (s) GC 4.38 ± 0.2 4.37 ± 0.2 0.01 0.420
GR 4.43 ± 0.1 4.33 ± 0.2 0.01 ˂0.001*
20m Shuttle Run (ml.kg-1.min-1) GC 44.11 ± 2.8 44.23 ± 2.8 0.12 0.703
GE 43.01 ± 2.6 44.33 ± 3.5 1.32 0.002*
1absolute gains; GC- control group; GR- resistance training group; GE- aerobic training group; *significant difference from TO to T1 (p˂0,05)

Children’s resistance and endurance trainability
58
After applying the training programs, one can note that %BF and ENDO were significantly and
negatively associated with training-induced gains in vertical (girls) and horizontal jumps,
running speed and aerobic capacity (boys and girls). ECTO was positively associated with
training-induced gains in vertical (girls) and horizontal jumps, running speed and aerobic
capacity (boys and girls). MESO was only negatively associated with training-induced VO2max
gains (boys and girls). (Table 3)
Table 3. Pearson`s correlation between percentage of fat mass (%BF), endomorphic (ENDO),
mesomorphic (MESO), ectomorphic (ECTO), and explosive strength and VO2max gains: Boys and girls
Boys Girls
%BF ENDO MESO ECTO %BF ENDO MESO ECTO
Counter Movement Jump (cm) -.40 -.42 .18 .08 -.45* -.50* -.31 .42*
Standing Long Jump (cm) -.68** -.70** .37 .55* -.65** -.69** -.33 .57**
1Kg Med. Ball Throwing (cm) -.24 -.25 .40 -.03 -.06 -.09 .36 -.17
3Kg Med. Ball Throwing (cm) -.16 -.15 .33 -.02 -.10 -.05 .21 -.18
20m Sprint Running (s) -.53* -.54* -.25 .47* -.45* -.50* -.17 .53*
20m Shuttle Run (ml.kg-1.min-1) -.59** -.59** -.68** .81** -.51* -.54** -.44* .55**
* p< 0,05 ** p< 0,01
Comparing the effect of the somatotype and body fat on the training-induced strength and
aerobic gains, through the MANCOVA, we found that MESO had the high-sized effect on
training-induced explosive strength gains, in both boys ( = 0.458) and girls ( = 0.446).
The estimated ANCOVA, that disaggregate the whole effect of the explosive strength
variables, show that this effect is mainly due to the influence of MESO on training-induced
1Kg (p = 0.011, = 0.380) and 3Kg (p = 0.019, = 0.333) ball throwing gains, in boys, and
running speed gains (p = 0.022, = 0.271), in girls. The variables %BF (boys: = 0.344,
girls: = 0.296) and ECTO (boys: = 0.347 and girls: = 0.305) had the smaller size
effect on the explosive strength gains. (Figure 1)
Figure 1. Effect size of fat mass, endomorphic, mesomorphic and ectomorphic on training-induced
explosive strength gains: boys and girls

Children’s resistance and endurance trainability
59
ECTO had the high-sized effect on the training-induced VO2max gains, in both boys ( = 0.214)
and girls ( = 0.144). Only in this variable the effect size is greater in boys than in girls. In
the boys, %BF ( = 0.002) and ENDO ( = 0.001) had almost no effect on the training-
induced aerobic gains. In the girls, %BF ( = 0.078) and MESO ( = 0.099) had the smaller
size effect on the aerobic gains. The %BF, MESO and ENDO variables had a greater effect on
the training-induced VO2max gains in girls than in boys. (Figure 2)
Figure 2. Effect size of fat mass, endomorphic, mesomorphic and ectomorphic on training-induced
VO2max gains: boys and girls
Discussion
At a first moment, the significant increasing observed for explosive strength of upper limbs
(e.g. medicine ball throw with 1kg and 3kg) and lower limbs (e.g. standing long jump and
counter movement vertical jump) as well as in 20-meter sprint running, indicates that the
implementation of a strength training program at school can be a positive stimulus to
enhance explosive strength in healthy prepubescent children. The current results also showed
a significant enhancement in VO2max (ml·kg-1·min-1), highlighting the potential of the
application of aerobic training programs in this age group, in untrained boys and girls. These
findings are consistent with the results of previous studies conducted with children and
adolescents, in which were applied strength (Dorgo et al., 2009; Santos & Janeira, 2008) and
aerobic training programs (Sandbakk et al., 2011; Santos et al., 2012).
After applying training programs can be observed that ECTO was positively associated with
training-induced gains in vertical and horizontal jumps, running speed and VO2max, these being
the same capabilities with which %BF and ENDO had a negative association. These results
seem to show that the inert non-contributory load imposed by body fat, which represents an
increased metabolic cost for children (Norman et al., 2005), makes them less efficient in the
performing of the proposed training program, as well as in terms of cardiorespiratory
response. ENDO and %BF variables are very close, either in terms of definition, or by the way

Children’s resistance and endurance trainability
60
they are calculated. The excess body fatness associated with ENDO adversely affects motor
performance (Malina & Bouchard, 1991), being a limiting factor especially in projection body
tasks and aerobic fitness (Suchomel, 2002), in which body fat plays a similar function (Dumith
et al., 2010; Castro-Piñero et al., 2009). On the contrary, the relative linearity associated
with ECTO (Malina & Bouchard, 1991), seems to contribute significantly on the development
of training programs to improve the explosive strength and cardiorespiratory fitness. Because
of the negative effect of body weight on the propulsion tasks and motor items in which the
body must be projected (Dumith et al., 2010; Castro-Piñero et al., 2009), the ECTO
component has the advantage (Jakšić & Cvetković, 2009), since it is based on weighting
index, i.e. the quotient of height by the cube root of body weight (Malina & Bouchard, 1991).
Also Chaouachi et al. (2005) reported the greatest gains in the aerobic capacity for the
individuals with a predominance of the ECTO component. It is important to stress that MESO,
which reflects the relative muscle-skeletal magnitude (Malina & Bouchard, 1991), only
associated significantly and negatively with the training-induced VO2max gains. At this point,
the literature also reports negative associations of MESO with propulsion tasks (Shukla et al.,
2009), in which ECTO has the advantage (Chaouachi et al., 2005), as mentioned above.
Regarding the association of MESO with the explosive strength gains, must be taken into
account that during preadolescence, beyond the small muscle mass of the girls, the boys still
present a reduced muscle mass, because the effects of circulating androgens, particularly
testosterone, only manifest themselves at puberty (Malina & Bouchard, 1991). Additionally, it
appears that during preadolescence the neural adaptations (i.e., a trend toward increased
motor unit activation and changes in motor unit recruitment, and firing) and possibly intrinsic
muscle adaptations (as evidenced by increases in twitch torque) are primarily responsible for
training-induced strength gains in this age group (Ramsay et al., 1990; Ozmun et al., 1994). A
better motor coordination of the involved muscle groups may also play a significant role
(Ozmun et al., 1994). These facts are corroborated by the results of some studies in the
literature that reported no significant associations of strength training with increases in gross
limb morphology (Ramsay et al., 1990; Ozmun et al., 1994).
Comparing the effect of somatotype and body fat on the training-induced changes in
performance after training interventions, the high-sized effect of MESO registered on the
explosive strength gains, as well as the high-sized effect of ECTO on the VO2max gains, in both
boys and girls, highlights the importance of the morphological typology on the training of
these capabilities in prepubescent children. There is evidence that by pre-puberty there
already exists a fairly stable somatotype, pointing to 8 years as the age by which somatotype
stability becomes manifest (Malina & Bouchard, 1991; Malina et al., 2004). However, an
analysis to changes in morphological typology of children during growth shows that in pre-
puberty boys tend to show a slight increase of the mesomorphic values, and girls show an
increase of the endomorphic and a slight reduction of the ectomorphic values, while the
mesomorphic component does not change significantly (Malina et al., 2004), so the effect of

Children’s resistance and endurance trainability
61
the MESO component on the training-induced explosive strength gains, in the boys, and ECTO
on the VO2max gains, in the girls, can be even more evident.
Conclusions
Our results suggest that school-based strength and aerobic training programs seems
considerably effective on both explosive strength and cardiorespiratory fitness feature of age-
school children. It seems that the relative musculoskeletal development, on the explosive
strength, and the relative linearity, on the aerobic capacity, can be a crucial factor on
training-induced gains, in both boys and girls.
The school provides an excellent setting to enhance health-related physical fitness, by
implementing training programs. Increasing both aerobic and muscular fitness is essential for
promoting health, and should be a desirable goal in a training program. However, despite the
many constraints existing in school (e.g. reduced practice time per session, number of weekly
sessions, lack of material resources and facilities, or a large number and diversity of
students), it is unacceptable the standardization of any form of training. One of the principles
of training is the biological individuality. Physically, each subject has its own configuration,
which makes him different from the others, commonly designated as somatotype, which is
defined as representing the individual`s present morphological conformation. The knowledge
of the influence of certain physical traits on the training-induced strength and aerobic gains
can help to bring the training closer to the individual characteristics, and thus improving the
results achieved.

62

63
Study 5
Effects of concurrent training on explosive strength and VO2max
in prepubescent children
Abstract
The purpose of this study was to compare the effects of 8-weeks training period of resistance
training alone (GR), combined resistance and endurance training (GCON) and a control group
(GC) on explosive strength and VO2max in a large sample of prepubescent boys and girls.
Methods: One hundred twenty-five healthy children (58 boys, 67 girls), aged 10-11 years old
(10.8 ± 0.4 years) were assigned into two training groups to train twice a week for 8 weeks:
GR (19 boys, 22 girls), GCON (21 boys, 24 girls) and a control group (GC: 18 boys, 21 girls; no
training program). Results: It was observed a significant but medium-sized increase from pre-
to the post-training in the vertical jump (F= 33.35, p< .01), standing long jump (F= 81.77, p<
.01) and VO2max (F= 25.15, p< .01). A significant high-sized increase in the 1 kg (F= 244.73, p<
.01) and 3 kg (F= 150.63, p< .01) ball throwing and running speed (F= 148.9, p < .01). The
training group (GR and GCON) and sex factors did not significantly influence the evolution of
strength variables from pre- to the post-training. The VO2max increased significantly only in
GCON. Conclusion: Concurrent training is equally effective on training-induced explosive
strength, and more efficient than resistance training only for VO2max, in prepubescent boys
and girls. This should be taken into consideration to optimize strength training school-based
programs.
Key words: youth, exercise school-based programs, power, endurance

Concurrent training in elementary school students
64
Introduction
Nowadays, the efforts to promote levels of physical fitness and physical activity in youth
should be a priority. Physical fitness and physical activity are considered to be important
supportive elements for the maintenance and enhancement of health and quality of life, and
hence for the improvement of the holistic development of a child (Kvaavik et al., 2009;
Ortega et al., 2007). Unfortunately, there exist evidences suggesting that physical fitness and
physical activity have declined worldwide in the last decades among children and adolescents
(Matton et al., 2007). Many children and adolescents are only exposed to vigorous physical
activity during school-based physical education classes (Coleman et al., 2004). Therefore, it is
important to ensure that during these classes students are exposed to physical activities that
promote health-related physical fitness development and an active lifestyle (Dorgo et al.,
2009). School seems to provide an excellent setting to enhance and promote physical activity
and physical fitness levels, by implementing training programs (Marques et al., 2011; Stenevi-
Lundgren et al., 2009).
Because of the low aerobic capacity in children is associated with risk factors of
cardiovascular disease (Anderssen et al., 2007), the majority of the research has focused on
activities that enhance cardiorespiratory fitness disregarding, for instance, neuromuscular
fitness conditions based on muscular strength (Cepero et al., 2011). However, it is recognized
that youth strength training can be a safe and effective method of conditioning and should be
an important component of youth fitness programs, health promotion objectives, and injury
prevention (Faigenbaum et al., 2009). Increasing both aerobic and muscular fitness is
essential to promote health (American College of Sports Medicine, 2006) and should be a
desirable goal in a training program (Taanila et al., 2011).
Due to various school constraints (i.e. reduced practice time per session, number of weekly
sessions or lack of material resources and facilities), children and adolescents involved in
physical education classes often perform concurrently strength and endurance training
(Santos et al., 2012) in an attempt to reach different physical fitness goals (Anderson &
Haraldsdottir, 1995) at the same time. However, during several decades many studies have
reported an interference effect on muscle strength development when strength and
endurance were trained concurrently (Dudley & Djamil, 1985; Izquierdo-Gabarren et al.,
2010). The majority of these studies found that the magnitude of increase in strength was
higher in the group that performed only strength training compared with the concurrent
training group. This is commonly referred to as the “interference phenomenon” (García-
Pallarés & Izquierdo, 2011). On the other hand, physical education classes or extracurricular
activities commonly include children of both sexes, and therefore it is important to verify the
applicability of a concurrent training program in age-school boys and girls. There exists a
small body of evidences about the effect of concurrent resistance and endurance training

Concurrent training in elementary school students
65
implemented in school environment (Izquierdo-Gabarren et al., 2010). A recent study showed
that performing resistance and endurance training in the same workout does not impair
strength development in adolescent schooled boys (Santos et al., 2012). However, the effects
of concurrent resistance and endurance training in prepubescent students, according to our
best knowledge, have yet to be investigated.
The purpose of the present study was to analyze the effects of power strength training alone
and combined power strength and endurance training in the selected sample. It was
hypothesized that concurrent resistance and endurance training would have a main positive
effect on power strength development of untrained school children, compared with those
found when power training was applied alone.
Material and Methods
Sample
The sample consisted of 125 prepubescent children, aged between 10 and 11 years old, all of
whom volunteered for this study. Before data collection and the start of the training, each
participant reported any health problems, physical limitations, physical activity habits, and
training experiences for the last 6 months. The following exclusion criteria were used:
subjects with a chronic pediatric disease or with an orthopedic limitation and subjects with
regular oriented extra-curricular physical activity (e.g. practice of some sport in a club).
Subsequently, to minimize the effects of growth, only were selected for the sample children
who were self-assessed in Tanner stages 1-2 (boys: GC, stage 1, 77.8% and stage 2, 22.2%; GR,
stage 1, 73.7% and stage 2, 26.3%; GCON, stage 1, 90.5% and stage 2, 9.5%; girls: GC, stage
1, 47.6% and stage 2, 52.4%; GR, stage 1, 50% and stage 2, 50%; GCON, stage 1, 62.5% and
stage 2, 37.5%). No subject had regularly participated in any form of strength training
program prior to this experiment. Subjects were carefully informed about the design of the
study and subsequently the children’s parents signed an informed consent document prior to
the start of the study. The study was conducted according to the ethical standards of the
International Journal of Sports Medicine (Harriss & Atkinson, 2011) and to the declaration of
Helsinki, and was approved by the institutional review boards of the University of Beira
Interior (UBI) and Research Centre in Sports, Health and Human Development (CIDESD),
Portugal. Parameters of body dimensions and physical performance measures were evaluated
for all subjects in pre-test. (Table 1)

Concurrent training in elementary school students
66
Table 1. Descriptive data of the control (GC), resistance (GR) and concurrent (GCON) groups in pre-test
condition: Boys and girls (Mean ± SD)
Boys Girls
GC GR GCON GC GR GCON
Decimal age 10.8±0.5 10.7±0.4 10.7±0.5 10.9±0.4 10.8±0.4 10.75±0.4
Height (cm) 139.5±7.0 141.6±5.9 146.7±8.3 140.8±6.3 144.8±8.0 142.7±7.2
Weight (kg) 37.8±7.6 38.9±10.7 42.0±9.0 37.4±6.9 41.3±9.8 39.7±9.4
CM jump 23.4±5.2 22.5±5.6 24.5±2.9 21.0±3.8 20.2±2.8 20.3±3.8
SL jump 140.1±21.9 129.6±14.6 140.7±10.6 127.9±15.6 120.3±10.1 121.8±17.6
1Kg ball throw 375.3±74.5 367.5±65.6 389.3±60.7 353.1±35.2 330.7±49.5 331.0±51.2
3Kg ball throw 233.2±44.5 231.5±39.0 243.2±39.1 221.0±37.6 217.5±38.5 208.0±35.4
20m Sprint 4.37±0.2 4.30±0.2 4.25±0.1 4.38±0.2 4.43±0.1 4.50±0.2
VO2max 45.2±3.9 45.8±3,4 45.9±3,3 44.1±2.8 42.4±1.7 43.0±2.6
CM jump - counter movement jump (cm); SL jump - standing long jump (cm); 1kg ball throw – 1 kg medicine ball throwing (cm); 3kg ball throw – 3 kg medicine ball throwing (cm); 20m sprint – 20m sprint running (sec); VO2max - 20m multistage shuttle run (ml.kg-1.min-1); ** p< 0.01
Procedures
One hundred twenty-five healthy children recruited from a Portuguese public elementary
school (from 5th and 6th grade), which volunteered to take part in this study, were randomly
assigned into two training groups (8 weeks training program, twice a week) and one control
group as follows: one group performing power training only (GR: 19 boys, 22 girls); another
group performing combined power strength and endurance training (GCON: 21 boys, 24 girls);
and the third was the control group (GC: 18 boys, 21 girls; that followed the physical
education classes curriculum, without a specific training program).
Prior to training, subjects warmed up for approximately 10 minutes with low to moderate
intensity exercises (e.g., running, stretching and joint specific warm-up). Joint-rotations
included slow circular movements, both clockwise and counter-clockwise, until the entire
joint seems to move smoothly. Stretching exercises included back and chest, shoulders and
side stretch, as well as quadriceps, calf, groin, and hamstring stretches. At the end of the
training sessions, subjects performed 5 minutes of static stretching exercises. After the
warm-up period, both GR and GCON groups were submitted to a strength training program
composed by: 1 and 3 kg medicine ball throws; jumps onto a box (from 0.3 m to 0.5 m);
plyometric jumps above 0.3‐0.5 m of height hurdle and; sets of 30 to 40m speed running.
After finishing strength training for both GR and GCON groups, the GCON group was further
subjected to a 20m shuttle run exercise. This endurance task, which occurred immediately
after the strength training session, was developed based on an individual training volume ‐ set
to about 75% of the established maximum aerobic volume achieved on a previous test. After 4
weeks of training, GCON subjects were reassessed using 20m shuttle run tests in order to
readjust the volume and intensity of the 20m shuttle run exercise. Each training session
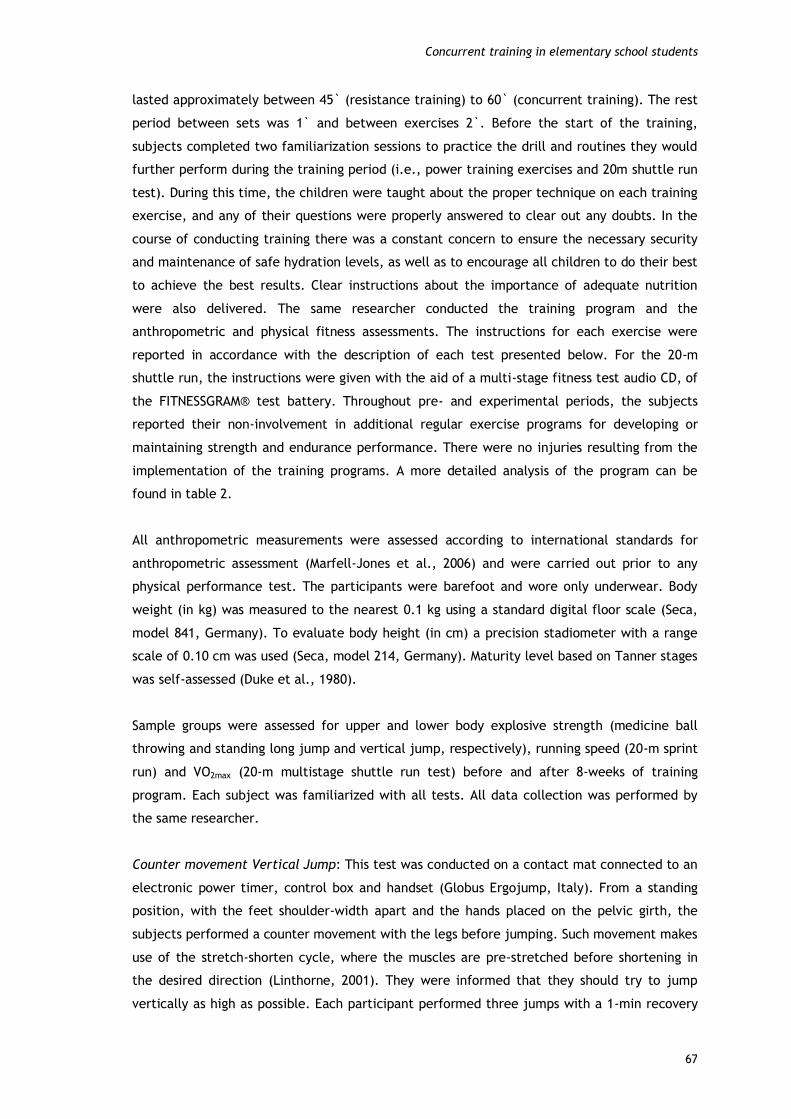
Concurrent training in elementary school students
67
lasted approximately between 45` (resistance training) to 60` (concurrent training). The rest
period between sets was 1` and between exercises 2`. Before the start of the training,
subjects completed two familiarization sessions to practice the drill and routines they would
further perform during the training period (i.e., power training exercises and 20m shuttle run
test). During this time, the children were taught about the proper technique on each training
exercise, and any of their questions were properly answered to clear out any doubts. In the
course of conducting training there was a constant concern to ensure the necessary security
and maintenance of safe hydration levels, as well as to encourage all children to do their best
to achieve the best results. Clear instructions about the importance of adequate nutrition
were also delivered. The same researcher conducted the training program and the
anthropometric and physical fitness assessments. The instructions for each exercise were
reported in accordance with the description of each test presented below. For the 20-m
shuttle run, the instructions were given with the aid of a multi-stage fitness test audio CD, of
the FITNESSGRAM® test battery. Throughout pre- and experimental periods, the subjects
reported their non-involvement in additional regular exercise programs for developing or
maintaining strength and endurance performance. There were no injuries resulting from the
implementation of the training programs. A more detailed analysis of the program can be
found in table 2.
All anthropometric measurements were assessed according to international standards for
anthropometric assessment (Marfell-Jones et al., 2006) and were carried out prior to any
physical performance test. The participants were barefoot and wore only underwear. Body
weight (in kg) was measured to the nearest 0.1 kg using a standard digital floor scale (Seca,
model 841, Germany). To evaluate body height (in cm) a precision stadiometer with a range
scale of 0.10 cm was used (Seca, model 214, Germany). Maturity level based on Tanner stages
was self-assessed (Duke et al., 1980).
Sample groups were assessed for upper and lower body explosive strength (medicine ball
throwing and standing long jump and vertical jump, respectively), running speed (20-m sprint
run) and VO2max (20-m multistage shuttle run test) before and after 8-weeks of training
program. Each subject was familiarized with all tests. All data collection was performed by
the same researcher.
Counter movement Vertical Jump: This test was conducted on a contact mat connected to an
electronic power timer, control box and handset (Globus Ergojump, Italy). From a standing
position, with the feet shoulder-width apart and the hands placed on the pelvic girth, the
subjects performed a counter movement with the legs before jumping. Such movement makes
use of the stretch-shorten cycle, where the muscles are pre-stretched before shortening in
the desired direction (Linthorne, 2001). They were informed that they should try to jump
vertically as high as possible. Each participant performed three jumps with a 1-min recovery

Concurrent training in elementary school students
68
between attempts. The highest jump (in cm) was recorded. The counter movement vertical
jump has shown an Intraclass Correlation Coefficient (ICC) of 0.94.
Standing long jump: This test was assessed using EUROFIT test battery (Adam et al., 1988).
The participants stood feet slightly apart (toes behind a starting line) and jumped as far
forwards as possible. Three trials were given and the furthest distance was measured (in cm)
from the starting line to the heel of the foot nearest to this line. The standing long jump has
shown an ICC of 0.94.
Medicine-ball throwing: This test was performed according to the protocol described by
Mayhew et al. (1997). Subjects were seated with the backside of the trunk in touch with a
wall. They were required to hold a medicine-balls (Bhalla International - Vinex Sports, Meerut
- India) weighing 1kg (Vinex, model VMB-001R, perimeter 0.72m) and 3kg (Vinex, model VMB-
003R, perimeter 0.78m) with their hands (abreast of chest) and throw it forward over the
maximum distance possible. Hip inflection was not allowed nor withdrawal of the trunk away
from the wall. Three trials were given and the furthest throw was measured (in cm) from the
wall to the first point at which the ball made contact with floor. One-minute of rest among 3
trials was done. The ICC of data for 1kg and 3 kg medicine ball throwing was 0.94 and 0.97,
respectively.
20-meter sprint running: In a 20 m length track, subjects were required to cover such
distance in the shortest time they could. Time (in sec) to run 20m was obtained using
photocells (Brower Timing System, Fairlee, Vermont, USA). Three trials were performed and
the best time scored (seconds and hundredth) was registered. The sprint running (time) has
shown an ICC of 0.97.
20-meter multistage shuttle run: This test involved continuous running between two lines
20m apart in time to recorded beeps. The subjects ran between the two lines, turning when
signaled by the recorded beeps. After about one minute, a sound indicates an increase in
speed, and the beeps will be closer together. This continues each minute (level). It was used
the common version with an initial running velocity of 8.5 km/h, and increments of 0.5 km/h
each minute (Léger et al., 1988). When the participants failed to reach the line on two
consecutive occasions, they were stopped and the number of completed 20m laps was
recorded. Estimated VO2max (ml.kg-1.min-1) was calculated by Léger's equation (Léger et al.,
1988), which is based on the level reached before boys were unable to keep up with the audio
recording. The 20m Shuttle Run test has shown an ICC of 0.97.

Concurrent training in elementary school students
69
Table 2. Training program design:
Sessions
Exercises 1 2 3 4 5 6
Chest 1Kg Medicine Ball Throw 1,2 2x8 2x8 2x8 2x8 6x8 6x8
Chest 3Kg Medicine Ball Throw 1,2 2x8 2x8 2x8 2x8
Overhead 1Kg Medicine Ball Throw 1,2 2x8 2x8 2x8 2x8 6x8 6x8
Overhead 3Kg Medicine Ball Throw 1,2 2x8 2x8 2x8 2x8
Counter Movement Jump onto a box 1,2 1x5 1x5 3x5 3x5 3x5 4x5
Plyometric Jumps above 3 hurdling 1,2 5x4 5x4 5x4 5x4 2x3 2x3
Sprint Running (m) 1,2 4x20m 4x20m 3x20m 3x20m 3x20m 3x20m
20m Shuttle Run (MAV) 2 75% 75% 75% 75% 75% 75%
Sessions
Exercises 7 8 9 10 11 12
Chest 1Kg Medicine Ball Throw 1,2
Chest 3Kg Medicine Ball Throw 1,2 2x5 2x5 3x5 3x5 3x5 2x5
Overhead 1Kg Medicine Ball Throw 1,2
Overhead 3Kg Medicine Ball Throw 1,2 2x8 2x8 3x8 3x8 3x8
Counter Movement Jump onto a box 1,2 4x5 5x5 5x5 5x5 5x5 4x5
Plyometric Jumps above 3 hurdling 1,2 3x3 4x3 4x3 4x3 4x3
Sprint Running (m) 1,2 4x30m 4x30m 4x30m 4x30m 4x30m 3x40m
20m Shuttle Run (MAV) 2 75% TestM 75% 75% 75% 75%
Sessions
Exercises 13 14 15 16
Chest 1Kg Medicine Ball Throw 1,2
Chest 3Kg Medicine Ball Throw 1,2 2x5 1x5
Overhead 1Kg Medicine Ball Throw 1,2 3x8 2x8 2x8
Overhead 3Kg Medicine Ball Throw 1,2 3x8
Counter Movement Jump onto a box 1,2 4x5 2x5 2x4 2x4
Plyometric Jumps above 3 hurdling 1,2 4x3 3x3
Sprint Running (m) 1,2 3x40m 4x40m 2x30m 2x30m
20m Shuttle Run (MAV) 2 75% 75% 75% 75%
Legend: for the Medicine Ball Throwing and Jump onto box the 1st no. corresponds to sets and 2nd corresponds to repetitions. For Sprint Running 1st number corresponds to sets and 2nd corresponds to the distance to run. For 20m Shuttle Run training each children ran each session (until testM) 75% of maximum individual aerobic volume performed on pre-test and after this testM moment until program end, ran 75% of maximum individual aerobic volume performed on testM. MAV- maximum individual aerobic volume. 1= power strength training protocol (GR). 2= concurrent training (GCON).
Statistics
Standard statistical methods were used for the calculation of the means and standard
deviations. The between-subject reliability of endurance and power tests was determined by
the Intraclass Correlation Coefficient (ICC). One-way analysis of variance ANOVA, followed by
Scheffe's post-hoc multiple comparison tests, was used to find the differences in the explosive
strength and endurance among the control and experimental groups. ANOVA with repeated
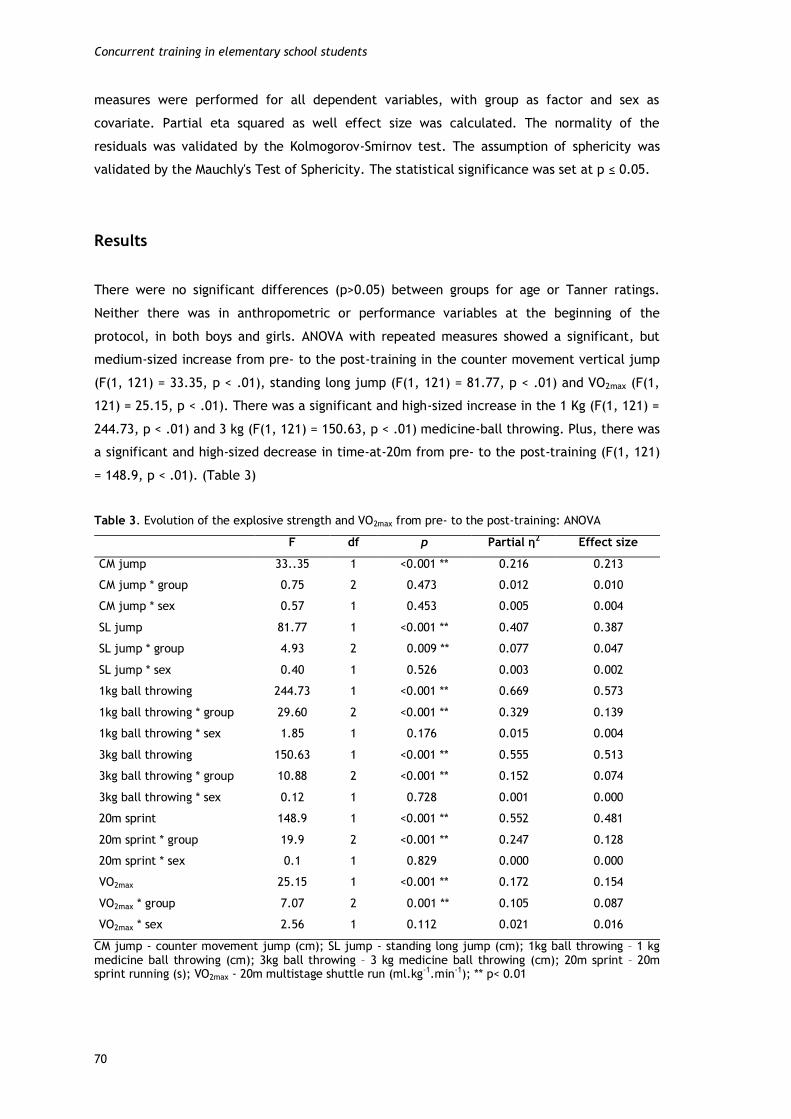
Concurrent training in elementary school students
70
measures were performed for all dependent variables, with group as factor and sex as
covariate. Partial eta squared as well effect size was calculated. The normality of the
residuals was validated by the Kolmogorov-Smirnov test. The assumption of sphericity was
validated by the Mauchly's Test of Sphericity. The statistical significance was set at p ≤ 0.05.
Results
There were no significant differences (p>0.05) between groups for age or Tanner ratings.
Neither there was in anthropometric or performance variables at the beginning of the
protocol, in both boys and girls. ANOVA with repeated measures showed a significant, but
medium-sized increase from pre- to the post-training in the counter movement vertical jump
(F(1, 121) = 33.35, p < .01), standing long jump (F(1, 121) = 81.77, p < .01) and VO2max (F(1,
121) = 25.15, p < .01). There was a significant and high-sized increase in the 1 Kg (F(1, 121) =
244.73, p < .01) and 3 kg (F(1, 121) = 150.63, p < .01) medicine-ball throwing. Plus, there was
a significant and high-sized decrease in time-at-20m from pre- to the post-training (F(1, 121)
= 148.9, p < .01). (Table 3)
Table 3. Evolution of the explosive strength and VO2max from pre- to the post-training: ANOVA
F df p Partial η2 Effect size
CM jump 33..35 1 <0.001 ** 0.216 0.213
CM jump * group 0.75 2 0.473 0.012 0.010
CM jump * sex 0.57 1 0.453 0.005 0.004
SL jump 81.77 1 <0.001 ** 0.407 0.387
SL jump * group 4.93 2 0.009 ** 0.077 0.047
SL jump * sex 0.40 1 0.526 0.003 0.002
1kg ball throwing 244.73 1 <0.001 ** 0.669 0.573
1kg ball throwing * group 29.60 2 <0.001 ** 0.329 0.139
1kg ball throwing * sex 1.85 1 0.176 0.015 0.004
3kg ball throwing 150.63 1 <0.001 ** 0.555 0.513
3kg ball throwing * group 10.88 2 <0.001 ** 0.152 0.074
3kg ball throwing * sex 0.12 1 0.728 0.001 0.000
20m sprint 148.9 1 <0.001 ** 0.552 0.481
20m sprint * group 19.9 2 <0.001 ** 0.247 0.128
20m sprint * sex 0.1 1 0.829 0.000 0.000
VO2max 25.15 1 <0.001 ** 0.172 0.154
VO2max * group 7.07 2 0.001 ** 0.105 0.087
VO2max * sex 2.56 1 0.112 0.021 0.016
CM jump - counter movement jump (cm); SL jump - standing long jump (cm); 1kg ball throwing – 1 kg medicine ball throwing (cm); 3kg ball throwing – 3 kg medicine ball throwing (cm); 20m sprint – 20m sprint running (s); VO2max - 20m multistage shuttle run (ml.kg-1.min-1); ** p< 0.01

Concurrent training in elementary school students
71
In the boys the training-induced strength gains ranged from 2.9% to 8.30% (GR), and from
1.08% to 8.30% (GCON). In the girls strength gains ranged from 2.25% to 8.10% (GR), and from
2% to 9.11% (GCON). In both boys and girls the poorest gains were in the time-at-20m and the
best ones in the 3 kg medicine ball throwing. The training-induced VO2max gains ranged from
3.06% (girls) to 8.30% (boys). In the post-test, there were no statistically significant
differences between the GR and GCON groups in the explosive strength and VO2max measures.
Regarding the effect of the group factor on the evolution of strength and aerobic capacity
from pre- to the post-training, there was no statistically significant influence of this factor on
the evolution of the vertical jump (F(2, 121) = 0.75, p ≥ .05). It was observed a significant,
but small-sized effect of the group on the evolution of the standing long jump (F(2, 121) =
4.93, p < .01), 3 kg medicine-ball throwing (F(2, 121) = 10.88; p < .01) and VO2max (F(2, 121) =
7.07, p < .01). There was a significant and medium-sized effect of the group on the evolution
of the 1 kg medicine-ball throwing (F(2, 121) = 26.60; p < .01) and running velocity (F(2, 121)
= 19.9; p < .01). However, the ANOVA with repeated measures for each group showed that
the positive influence of the group on the standing long jump, 1 kg and 3 kg medicine-ball
throwing and running speed was due to significant increases from pre- to the post-training in
GR and GCON. In the control group there were no significant differences between the two
moments. The VO2max increased significantly only in GCON. (Figures 1 to 6).
Figure 1. Counter mov. jump (cm) by group Figure 2. Standing long jump (cm) by group
Figure 3. 1kg ball throwing (cm) by group Figure 4. 3kg ball throwing (cm) by group
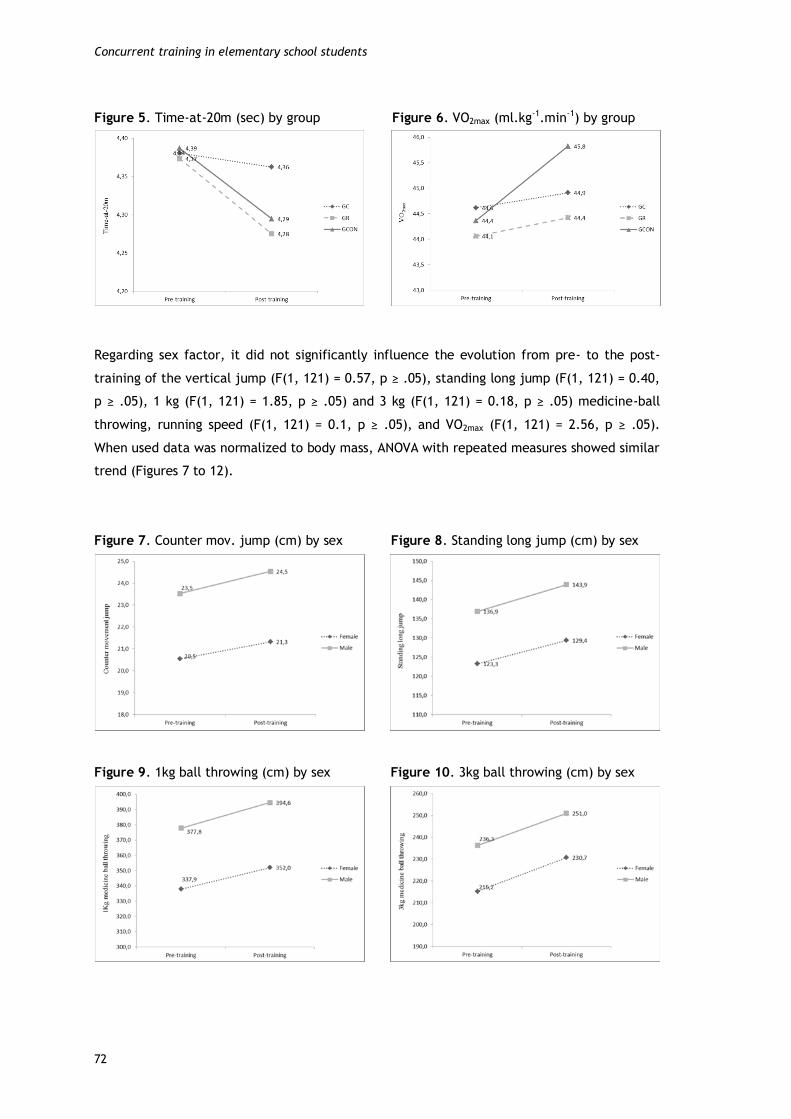
Concurrent training in elementary school students
72
Figure 5. Time-at-20m (sec) by group Figure 6. VO2max (ml.kg-1.min-1) by group
Regarding sex factor, it did not significantly influence the evolution from pre- to the post-
training of the vertical jump (F(1, 121) = 0.57, p ≥ .05), standing long jump (F(1, 121) = 0.40,
p ≥ .05), 1 kg (F(1, 121) = 1.85, p ≥ .05) and 3 kg (F(1, 121) = 0.18, p ≥ .05) medicine-ball
throwing, running speed (F(1, 121) = 0.1, p ≥ .05), and VO2max (F(1, 121) = 2.56, p ≥ .05).
When used data was normalized to body mass, ANOVA with repeated measures showed similar
trend (Figures 7 to 12).
Figure 7. Counter mov. jump (cm) by sex Figure 8. Standing long jump (cm) by sex
Figure 9. 1kg ball throwing (cm) by sex Figure 10. 3kg ball throwing (cm) by sex
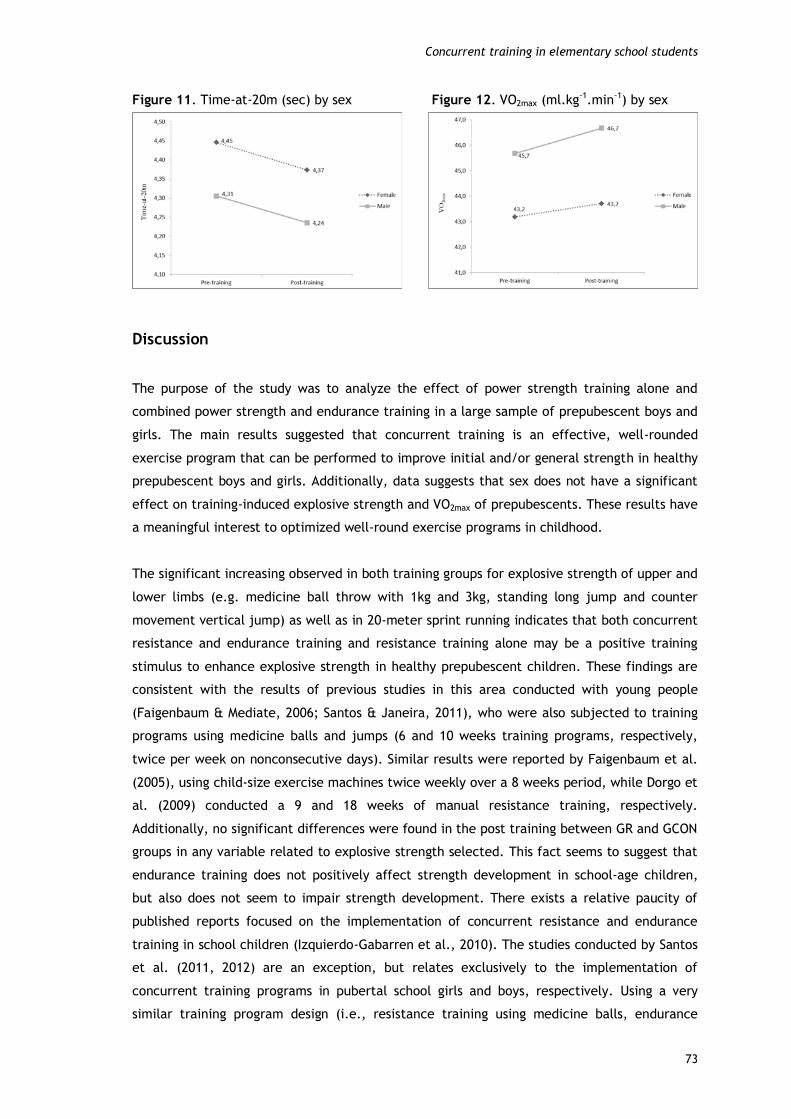
Concurrent training in elementary school students
73
Figure 11. Time-at-20m (sec) by sex Figure 12. VO2max (ml.kg-1.min-1) by sex
Discussion
The purpose of the study was to analyze the effect of power strength training alone and
combined power strength and endurance training in a large sample of prepubescent boys and
girls. The main results suggested that concurrent training is an effective, well-rounded
exercise program that can be performed to improve initial and/or general strength in healthy
prepubescent boys and girls. Additionally, data suggests that sex does not have a significant
effect on training-induced explosive strength and VO2max of prepubescents. These results have
a meaningful interest to optimized well-round exercise programs in childhood.
The significant increasing observed in both training groups for explosive strength of upper and
lower limbs (e.g. medicine ball throw with 1kg and 3kg, standing long jump and counter
movement vertical jump) as well as in 20-meter sprint running indicates that both concurrent
resistance and endurance training and resistance training alone may be a positive training
stimulus to enhance explosive strength in healthy prepubescent children. These findings are
consistent with the results of previous studies in this area conducted with young people
(Faigenbaum & Mediate, 2006; Santos & Janeira, 2011), who were also subjected to training
programs using medicine balls and jumps (6 and 10 weeks training programs, respectively,
twice per week on nonconsecutive days). Similar results were reported by Faigenbaum et al.
(2005), using child-size exercise machines twice weekly over a 8 weeks period, while Dorgo et
al. (2009) conducted a 9 and 18 weeks of manual resistance training, respectively.
Additionally, no significant differences were found in the post training between GR and GCON
groups in any variable related to explosive strength selected. This fact seems to suggest that
endurance training does not positively affect strength development in school-age children,
but also does not seem to impair strength development. There exists a relative paucity of
published reports focused on the implementation of concurrent resistance and endurance
training in school children (Izquierdo-Gabarren et al., 2010). The studies conducted by Santos
et al. (2011, 2012) are an exception, but relates exclusively to the implementation of
concurrent training programs in pubertal school girls and boys, respectively. Using a very
similar training program design (i.e., resistance training using medicine balls, endurance

Concurrent training in elementary school students
74
training through the 20-m multistage shuttle-run test, twice weekly for 8 weeks), the authors
found significant training-induced gains in ball throw, running speed and height-and-length of
the jumps, in both strength training alone, and combined strength and aerobic training. No
significant differences were found in the post training between these experimental training
groups.
However, a training program design different than in this particular study, or different
methods of organizing training workouts, can lead to different results, due to several factors
that can influence the level or degree of interference generated by concurrent training
(García-Pallarés & Izquierdo, 2011). These factors include the initial training status of the
subjects (Kraemer & Ratamess, 2004), exercise mode, volume, intensity and frequency of
training (García-Pallarés et al., 2009; González-Badillo et al., 2005; Izquierdo et al., 2005).
E.g., Sale et al. (1990) could observe that concurrent resistance and endurance training
applied on separate days produced higher gains to those produced by concurrent training on
the same day. Strength and endurance training elicit distinct and often divergent adaptive
physiological mechanisms. The concurrent development of both fitness components in the
same training regimen can lead to conflicting neuromuscular adaptations, such as reductions
in the motor unit recruitment, decreases of rapid voluntary neural activations, chronic
depletion of muscle glycogen stores, skeletal muscle fibre type transformation, decreases in
the cross-sectional area of muscle fibres and in the rate of muscle force production due to
the reduction in total protein synthesis (Coffey & Hawley, 2007; Hawley, 2009).
The current results also showed a significant enhancement in VO2max only for GCON. In
agreement with previous studies (Dorgo et al., 2009; Santos et al., 2011; Santos et al., 2012),
these finding seems to indicate that resistance training program component was not effective
to an improvement of the aerobic fitness in prepubescent school children. After 18-weeks of
manual resistance training, Dorgo et al. (2009) observed that only the subjects who were
exposed to additional cardiovascular endurance training achieved significant improvements
for the 1-mile run performance. The subjects who performed only manual resistance training
showed some improvement from pre- to midterm- and pre- to post-test. But these changes
were not statistically significant. Similarly, Santos et al. (2011, 2012) found that VO2max
increased significantly only in the endurance training group, after 8-weeks.
Regarding the gender gap, the results seem to suggest that there is no significant effect on
training-induced strength and VO2max adaptations. These data corroborate the results of
previous studies conducted with children, reporting no significant differences in aerobic
training response related to sex. Rowland and Boyajian (1995) observed no significant
differences relative to sex in maximal oxygen uptake after an endurance training program
(three 30-minute sessions of aerobic activity weekly for 12 weeks at an intensity-producing a
mean heart rate of 166 beats per minute). Similarly, Obert et al. (2003) found that sex did

Concurrent training in elementary school students
75
not affect training-induced cardiovascular response in prepubescent children (13-week
endurance training program, 3 x 1h week-1, intensity: > 80% heart rate maximum). Aerobic
training increased VO2max in children, no matter the sex, mediated by an improvement in
maximum stroke volume Obert et al. (2003). Similar mechanisms, including loading conditions
and cardiac morphology, appear to be involved in both boys and girls in order to explain such
an improvement Obert et al. (2003). According to Vinet et al. (2003) during pre-adolescence
there are no significant sex differences in maximal heart rate and arteriovenous oxygen, and
although the stroke volume is significantly higher in boys than in girls, when expressed
relative to lean body mass, the difference is no longer significant.
The observed similarity between boys and girls in training-induced strength is also consistent
with findings of previous studies conducted with prepubescent children. After applying a 12-
week progressive resistance program Lillegard et al. (1997) found significant main effects
favoring strength gains in males, only in lat pull and leg extension (three sets of ten
repetitions of 10RM on barbell curl, triceps extension, bench press, lat pull, leg extension and
leg curl exercises, three 1-hour session per week). There were no significant post training sex
differences in jumping and running speed. Siegel et al. (1989) also observed that following a
similar training period, but using hand-held weights, stretch tubing, balls, and self-supported
movements, training responses of boys and girls were similar, although they have been
reported significant differences in favor of boys on all initial strength evaluation. Training-
induced strength gains during and after puberty in males are associated with increases in fat-
free mass, due to the effect of testosterone on muscle hypertrophy. In reverse, smaller
amounts of testosterone in females (resulting from enzymatic conversion of androgenic
precursors in the adrenal gland) seem to limit the magnitude of training-induced strength
gains (Kraemer et al., 1989). However, during preadolescence, beyond the small muscle mass
of the girls, the boys still present a reduced muscle mass, because the effects of circulating
androgens, particularly testosterone, only manifest themselves at puberty (Ramsay et al.,
1990).
Conclusions
In brief, our data suggest that a concurrent resistance and endurance school-based training
program seems to be effective on both strength and endurance fitness feature of age-school
children. The results also indicates that sex does not affect explosive strength improvement,
either in the resistance training alone, or combined resistance and endurance training. In this
sense, and assuming various school constraints (i.e. reduced practice time per session,
number of weekly sessions or lack of material resources and facilities) in order to increase the
physical education classes efficiency, combined training programs of resistance and
endurance should be considered in school-based programs.
Concurrent training in elementary school students
76
It can be considered as main limitations: (i) different training program design or different
methods of organizing training workouts, can lead to different training-induced outcomes; (ii)
different methods of evaluating pre- and post-training muscular strength and aerobic capacity
may also lead to data bias.

77
Chapter 4. General Discussion
The main purpose of this investigation was to analyze the effect of somatotype, body fat and
physical activity on overall physical fitness, explosive strength and aerobic capacity
trainability in prepubescent children. Additionally, it was intended to verify in which physical
capabilities boys and girls are closer/ distant, and the effects of concurrent training on
explosive strength and aerobic adaptations. Results suggest that: (i) somatotype is a crucial
factor on overall physical fitness, and training-induced explosive strength and VO2max gains, in
both boys and girls; (ii) physical fitness differences between boys and girls are greater in the
explosive strength; (iii) concurrent training is an effective program that can be performed to
improve strength in prepubescent children; and (iv) gender does not have a significant effect
on training-induced explosive strength and VO2max adaptations.
Physical Fitness has been recognized as a major marker of health status at any age (Ortega et
al., 2007). This recognition has produced a wide range of studies on the influence of various
factors on physical fitness levels, in particular the influence of body fat and physical activity.
There is evidence that by pre-puberty there already exists a fairly stable somatotype,
pointing to 8 years as the age by which somatotype stability becomes manifest (Malina et al.,
2004), however there are few studies that link somatotype with fitness in young people. As
such, we sought to examine the effect of the presence/ absence of certain physical traits on
physical fitness and compare it with the effect of body fat and physical activity, often
referenced in the literature (Study 2 and Study 3). Because most studies on physical fitness
have focused specially on cardiorespiratory fitness, neglecting the muscular fitness (Cepero et
al., 2011), we have placed great emphasis on strength development.
The significant and negative associations found between body fat and tasks that require
propulsion or lifting of the body mass are consistent with results of previous studies
conducted in school-aged children, that referred to similar relationships in tests of curl-ups,
standing broad jump, push-ups and running (Dumith et al., 2010; Fogelholm et al. 2008). By
contrast, the better performance of children with high body fat observed in the throw ball
test and handgrip strength, also described in the literature (Castro-Piñero et al., 2009;
D'Hondt et al., 2009), might be explained by their increased fat-free mass. Overweight and
obese individuals appeared to have more body fat, but also more fat-free mass, than those
with normal weight (Wells et al., 2006). Also the positive association found between physical
activity and muscular strength corroborates the findings of several studies that report a
positive association between this variable and overall physical fitness (Lennox et al., 2008;
Tovar et al., 2008). However, different results were obtained by Dumith et al. (2010), who
found no significant associations between body fat and ball throwing, and Hands et al. (2009),
General Discussion
78
between physical activity and performance in standing broad jump, curl-ups, hand
dynamometry and ball throw. Regarding the somatotype, we observed that endomorphic has
similar associations to those presented by body fat. Endomorphic expresses the degree of
adiposity development (Malina and Bouchard, 1991), so the primary effect of this component
in performance will differ depending on the type of task, being a limiting factor in propulsion
and lifting body tasks, in which body fat plays a similar function. Mesomorphic reflects the
robustness (Malina and Bouchard, 1991) and was only negatively correlated with tests related
to the propulsion and lifting movements, in which the ectomorphic has the advantage (Jakšić
& Cvetković, 2009; Suchomel, 2002), because of the negative effect of body weight in these
tasks (Dumith et al. 2010; Xianwen et al., 2010). On this, the associations observed for
ectomorphic, that reflects the relative linearity of build (Malina and Bouchard, 1991), were
precisely the reverse of those found for endomorphic and mesomorphic. The greatest number
of interactions of the somatotype with muscular strength and strength tests, as well as the
greatest influence of the somatotype on overall physical fitness of both boys and girls
(ectomorphic and mesomorphic in the boys and endomorphic in the girls), compared with
body fat and physical activity, seem to suggest that one cannot neglect the influence of
genetic determinism, observed from the morpho-constitutional point of view, by which the
presence/absence of certain physical traits determines the appropriate levels of motor
performance required.
Unfortunately, there are evidences suggesting that physical fitness has declined worldwide in
the last decades among young people (Matton et al., 2007; Tomkinson, 2007). One of the
reasons for the decreased levels of physical fitness and physical activity is that there is an
apparent avoidance of children of the physical education classes and extracurricular activities
(Roetert, 2004) due, in part, to lack of planning that takes into account the motivation and
success of children in the execution of the exercises, respecting the differences between
them, including gender differences (Haff, 2003). Thus the knowledge of the magnitude of the
differences between boys and girls can help teachers, coaches and trainers in the planning of
activities that take into account the success of both boys and girls, and thus, increase levels
of physical activity and physical fitness (Study 3).
In terms of gender differences in motor performance, the results confirm those of other
studies that report the superiority of boys in tests of aerobic fitness and muscular strength
and of girls in tests of balance and flexibility (Cepero et al., 2011; Hands et al., 2009).
Additionally, our findings indicate that the difference between boys and girls in physical
fitness was greater in the explosive strength, although with a medium size effect of gender.
In the opposite direction, gender differences were smaller in muscular endurance tests and
flexibility, followed by speed and balance. The fat-free mass statistically higher in boys
permits a better muscular strength (Lennox et al., 2008; Tovar et al., 2008). However, the
absence of statistically significant differences between boys and girls in muscular endurance

General Discussion
79
tests, reported in the literature with children of similar age (Castro-Piñero et al., 2009), may
be due to the fact that the weight of the boys, close to the weight of the girls in pre-pubertal
stage (Malina & Bouchard, 2001), is an extra load to be moved during weight-bearing tasks,
added to the fact that the boys still present a reduced muscle mass in pre-pubertal ages
(Malina & Bouchard, 2001). Some approximation found in speed between boys and girls, may
be due to the fact that speed is a specific capability, highly dependent on the influence of
genetic factors such as neuromuscular components and muscle fiber quality (i.e., fiber type
proportion). The high degree of gene transfer implied in this aptitude is today recognized
(Little & Williams, 2005). Regarding the flexibility, there are many reports that girls have
larger range of motion. Some of the factors presented are the difference of extensibility of
muscle and tendon tissues, the greater passive dorsiflexion angle of girls, because boys have a
higher muscle volume, and dynamic property of tendon tissues (Kato et al., 2005). However,
in this capability, the difference by gender there occupies a place emphasized during periods
of rapid growth. At this age the boys can be more flexible than the girls (Monyeki et al.,
2005). Also in the balance boys and girls showed some proximity. These results may be due to
the fact that in pre-pubertal period the difference in stature between boys and girls gradually
decreases, due to the growth velocity of girls at this stage that is higher than for boys,
reaching the peak height velocity (PHV) earlier (Malina & Bouchard, 2001). A greater stature
leads to a high body's center of mass, in turn responsible for increased postural instability on
balance exercises (Allard et al., 2001).
In children, because of low aerobic capacity is associated with risk factors of cardiovascular
disease (Anderssen et al., 2007), a great amount of research has focused on activities that
enhance cardiorespiratory fitness (Cepero et al., 2011). However, it is recognized that youth
strength training approaches should be an important component of youth fitness programs
and health promotion objectives (Faigenbaum et al., 2009). The knowledge of the influence
of body fat and somatotype on training-induced strength and aerobic gains can help in
designing and application of training programs for young people in order to improve its
efficiency (Study 4).
The significant increasing observed for explosive strength and VO2max indicates that the
implementation of strength and aerobic training programs can be a positive stimulus to
enhance these capacities in prepubescent children. These findings are consistent with the
results of previous studies conducted with children and adolescents, in which were applied
strength (Dorgo et al., 2009; Santos & Janeira, 2008) and aerobic training programs (Sandbakk
et al., 2011; Santos et al., 2012). After applying training programs can be observed that the
ectomorphic was positively associated with training-induced gains in vertical and horizontal
jumps, running speed and VO2max, these being the same capabilities with which body fat and
endomorphic had a negative association. These results seem to show that the inert non-
contributory load imposed by body fat, which represents an increased metabolic cost for

General Discussion
80
children makes them less efficient in the performing of the proposed training program, as
well as in terms of cardiorespiratory response (Norman et al., 2005). Mesomorphic associated
significantly and negatively with training-induced VO2max gains, because the negative
association of this component with propulsion tasks (Shukla et al., 2009), in which
ectomorphic has the advantage (Chaouachi et al., 2005), as mentioned above. The absence of
significant associations of the mesomorphic with strength gains may be justified because
prepubescent children still present a reduced muscle mass, due to the effects of circulating
androgens only manifest themselves at puberty (Malina & Bouchard, 1991). As such, during
preadolescence, the neural adaptations are primarily responsible for training-induced
strength gains (Ozmun et al., 1994; Ramsay et al., 1990). The high-sized effect of
mesomorphic registered on the explosive strength gains, as well as the high-sized effect of
ectomorphic on the VO2max gains, in both boys and girls, highlights the importance of the
morphological typology on training-induced strength and aerobics gains in prepubescent
children.
On the other hand, due to various constraints, children and adolescents involved in physical
education classes or extracurricular activities often perform concurrently strength and
aerobic training (Santos et al, 2012), in an attempt to reach different physical fitness goals
(Anderson & Haraldsdottir, 1995). However, the effects of concurrent strength and aerobic
training in prepubescent children, according to our best knowledge, still needs to be
investigated (Study 5).
Because strength and aerobic training elicit distinct and often divergent adaptive
mechanisms, the concurrent development of both fitness components in the same training
regimen can lead to conflicting neuromuscular adaptations (Coffey et al., 2007; Hawley,
2009), commonly referred to as the “interference phenomenon” (García-Pallarés and
Izquierdo 2011). Our results, which are consistent with the results of previous studies in this
area, but conducted with pubertal children (Santos et al., 2012), seems to suggest that
aerobic training does not positively affect strength development in prepubescent boys and
girls, but also does not seem to impair strength development. However, it is important to
stress that a training program design different than in this particular study, e.g. exercise
mode, volume, intensity and frequency of training (González-Badillo et al., 2005; García-
Pallarés et al., 2009), can lead to different results, due to several factors that can influence
the level or degree of interference generated by concurrent training (García-Pallarés and
Izquierdo 2011).
General Discussion
81
Some main limitation of this thesis can be addressed:
(i) The physical fitness comprises other components absent from this study, as for
example motor coordination (Lämmle et al., 2010);
(ii) It was only applied field tests. Laboratory tests with a higher control standard might
presented more accurate data (Faigenbaum et al., 2009);
(iii) A training program design different, or different methods of organizing training
workouts, can lead to different results (García-Pallarés & Izquierdo 2011);
(iv) There are other biological and behavior variables that might also determine physical
fitness differences between boys and girls (e.g., different practice opportunities)
(Branta et al., 1984; Thomas & French, 1985).

82

83
Chapter 5. Overall Conclusions
The main findings of this work emphasize the importance of the presence/absence of certain
physical characteristics on overall physical fitness, explosive strength and aerobic capacity
trainability, in prepubescent children. They also show that physical fitness differences
between boys and girls are greater in the explosive strength, and that concurrent training can
be performed to improve strength in this age group:
i. in subjects undergoing pre pubescence, the somatotype has the greatest influence on
the motor performance of both boys and girls, i.e., ectomorphic and mesomorphic in
the boys and endomorphic in the girls;
ii. mesomorphic has the high-sized effect on training-induced explosive strength gains,
and ectomorphic on VO2max gains, in both boys and girls. Endomorphic and body fat
have the smaller size effect on training-induced explosive strength gains.
Endomorphic and body fat in boys, and mesomorphic and body fat in girls, have the
smaller size effect on the VO2max gains;
iii. physical fitness differences between boys and girls are greater in the explosive
strength of upper and lower limbs, and smaller in the abdominal and upper limbs
muscular endurance, and trunk extensor strength and flexibility, followed by speed
and balance;
iv. concurrent training is an effective, well-rounded exercise program that can be
performed to improve initial or general strength in healthy prepubescent boys and
girls;
v. gender does not have a significant effect on training-induced explosive strength and
VO2max adaptations in this age group.

84

85
Chapter 6. Suggestions for future research
Some suggestions are highlighted in order to encourage future research:
i. Replicate the study with pubertal children (given that during adolescence the boys
tend to show a slight increase of the mesomorphic values, and the girls show an
increase of the endomorphic and a slight reduction of the ectomorphic values);
ii. Use other physical fitness components (health-related physical fitness and/or skill-
related fitness);
iii. Check the effect of the implementation of a concurrent training program on the
cardiorespiratory fitness (we only analyzed the effect on the explosive strength);
iv. Perform aerobic training before strength training or the scheduling of both types of
training on alternate days (we performed strength training before aerobic training, in
the same workout).

86

87
Chapter 7. References
Chapter 1
American Academy of Pediatrics: Council on Sports Medicine and Fitness. Strength training by
children and adolescents. Pediatrics 2008; 121: 835-840.
American College of Sports Medicine. Guidelines for Exercise Testing and Prescription (7th
ed.). Philadelphia, PA: Lippincott, Williams & Wilkins, 2007.
Anderssen SA, Cooper AR, Riddoch C, Sardinha LB, Harro M, Brage S, Andersen LB. Low
cardiorespiratory fitness is a strong predictor for clustering of cardiovascular disease
risk factors in children independent of country, age and sex. Eur J Cardiovasc Prev
Rehabil 2007; 14: 526-531.
Armstrong N, Welsman J. Young people and physical activity. Oxford: Oxford University Press,
1997.
Behringer M, Vom Heede A, Matthews M, Mester J. Effects of Strength Training on Motor
Performance Skills in Children and Adolescents: A Meta-Analysis. Pediatr Exerc Sci
2011; 23: 186-206.
Cepero M, López R, Suárez-Llorca C, Andreucabrera E, Rojas F. Fitness test profiles in
children aged 8-12 years old in Granada (Spain). J Hum Sport Exerc 2011; 6: 135-146.
Dumith S, Ramires V, Souza M, Moraes D, Petry F, Oliveira E, Ramires S, Hallal P.
Overweight/Obesity and Physical Fitness Among Children and Adolescents. J Phys Act
Health 2010; 7: 641-648.
Faigenbaum AD, Kraemer WJ, Blimkie CJR, Jeffreys I, Micheli LJ, Nitka M, Rowland, TW.
Youth resistance training: Updated position statement paper from the National
Strength and Conditioning Association. J Strength Cond Res 2009; 23: S60-S79.
García-Pallarés J, Izquierdo M. Strategies to Optimize Concurrent Training of Strength and
Aerobic Fitness for Rowing and Canoeing. Sports Med 2011; 41: 329-343.
Haff, GG. Roundtable discussion: Youth resistance training. Strength Cond J 2003; 25: 49-64.
Hands B, Larkin D, Parker H, Straker L, Perry M. The relationship among physical activity,
motor competence and health- related fitness in 14-year-old adolescents. Scand J
Med Sci Sports 2009; 19: 655-663.
References
88
Izquierdo-Gabarren M, Exposito R, Garcia-Pallarés J, Sánchez-Medina L, De Villareal ES,
Izquierdo M. Concurrent endurance and strength training not to failure optimizes
performance gains. Med Sci Sports Exerc 2010; 42: 1191-1199
Jakšić D, Cvetković M. Neural network analysis of somatotype differences among males
related to the manifestation of motor abilities. Acta Kinesiologica 2009; 3: 107-113.
Kvaavik E, Klepp KI, Tell GS, Meyer HE, Batty GD. Physical fitness and physical activity at age
13 years as predictors of cardiovascular disease risk factors at ages 15, 25, 33, and 40
years: extended follow-up of the Oslo Youth Study. Pediatrics 2009; 123: e80-e86.
Lyu M, Gill D. Perceived physical competence, enjoyment and effort in same-sex and
coeducational physical education classes. J Educ Psychol 2011; 31: 247-260.
Malina R, Bouchard C. Growth maturation and physical activity. Champaign, Illinois: Human
Kinetics, 1991.
Malina R, Bouchard C, Bar-Or O. Growth, maturation and physical activity. Champaign,
Illinois: Human Kinetics, 2004.
Matton L, Duvigneeaud N, Wijndaele K, Philippaerts R, Duquet W, Beunen G, Claessens A,
Thomis M, Lefevre J. Secular trends in anthropometric characteristics, physical
fitness, physical activity and biological maturation in flemish adolescents between
1969 and 2005. Am J Hum Biol 2007; 19: 326-624.
NIH Consensus Development Panel on Physical Activity and Cardiovascular Health. Physical
activity and cardiovascular health. J Am Med Assoc 1996; 276: 241-246.
Norman A, Drinkard B, McDuffie J, Ghorbani S, Yanoff L, Yanovski J. Influence of excess
adiposity on exercise fitness and performance in overweight children and adolescents.
Pediatrics 2005; 115: 690-696.
Ortega B, Tresaco B, Ruiz J, Moreno L, Matillas M, Mesa J, Warnberg J, Bueno M, Tercedor P,
Gutiérrez A, Castillo M. Cardiorespiratory fitness and sedentary activities are
associated with adiposity in adolescents. Obesity 2007; 15: 1589-1599.
Reis VM, Machado JV, Fortes MS, Fernandes PR, Silva AJ, Dantas PS, Filho JF. Evidence for
higher heritability of somatotype compared to body mass index in female twins. J
Physiol Anthropol 2007; 26: 9-14.
Roetert, EP. The lack of childhood activity in the United States. Strength Cond J 2004; 26: 22-
23.

References
89
Santos A, Marinho DA, Costa AM, Izquierdo M, Marques MC. The effects of concurrent
resistance and endurance training follow a detraining period in elementary school
students. J Strength Cond Res 2012; 26: 1708-1716
Shaw BS, Shaw I, Brown GA. Comparison of resistance and concurrent resistance and
endurance training regimes in the development of strength. J Strength Cond Res
2009; 23: 2507-2514.
Stratton G, Canoy D, Boddy LM, Taylor SR, Hackett AF, Buchan IE. Cardiorespiratory fitness
and body mass index of 9-11-year-old English children: A serial cross-sectional study
from 1998 to 2004. Int J Obes (Lond) 2008; 32: 1-11.
Taanila H, Hemminki A, Suni J, Pihlajamäki H, Parkkari J. Low physical fitness is a strong
predictor of health problems among young men: a follow-up study of 1411 male
conscripts. BMC Public Health 2011; 11: 590.
Tomkinson GR, Olds TS, Kang SJ, Kim DY. Secular trends in the aerobic fitness test
performance and body mass index of Korean children and adolescents (1968-2000). Int
J Sports Med 2007; 28: 314-320.
Twist J, Kemper H, Van Mechelen W. Tracking of activity and fitness and the relationship with
cardiovascular disease risk factors. Med Sci Sports Exerc 2000; 32: 1455-1461.
Chapter 2
Study 1
Aires L, Silva P, Silva G, Santos M, Ribeiro J, Mota J. Intensity of Physical Activity,
Cardiorespiratory Fitness, and Body Mass Index in Youth. J Phys Activ Health 2010; 7:
54-59.
Andersen LB, Harro M, Sardinha L, Froberg K, Ekelund U, Brage S, Anderssen S. Physical
activity and clustered cardiovascular risk in children: a cross-sectional study (The
European Youth Heart Study). Lancet 2006; 368: 299-304.
Anderssen SA, Cooper AR, Riddoch C, Sardinha LB, Harro M, Brage S, Andersen LB. Low
cardiorespiratory fitness is a strong predictor for clustering of cardiovascular disease
risk factors in children independent of country, age and sex. Eur J Cardiovasc Prev
Rehabil 2007; 14: 526–531.
Ara I, Moreno L, Leiva M, Gutin B, Casajús J. Adiposity, physical activity and physical fitness
among children from Aragón, Spain. Obesity 2007; 15: 1918-1924.

References
90
Armstrong N, Welsman J. Young people and physical activity. Oxford: Oxford University Press,
1997.
Astrand PO, Rodahl K, Dahl H, Stromme S. Textbook of work physiology. New York: McGraw-
Hill, 2003.
Ball G, Marshall J, McCargar L. Fatness and fitness in obese children at low and high health
risk. Pediatr Exerc Sci 2003; 15: 392-405.
Baquet G, Berthoin S, Dupont G, Blondel N, Fabre C, Van Praagh E. Effects of high intensity
intermittent training on peak VO2 in prepubertal children. Int J Sports Med 2002; 23:
439-444.
Barnett LM, Van Beurden E, Morgan PJ, Brooks LO, Beard JR. Does children motor skill
proficiency predict adolescent fitness? Med Sci Sport Exerc 2008; 40: 2137-44.
Behringer M, Vom Heede A, Matthews M, Mester J. Effects of Strength Training on Motor
Performance Skills in Children and Adolescents: A Meta-Analysis. Pediatr Exerc Sci
2011; 23: 186-206.
Benson A, Torade M, Singh, MA. Muscular strength and cardiorespiratory fitness is associated
with higher insulin sensitivity in children and adolescents. Int J Pediatr Obes 2006; 1:
222-231.
Carmo I, Santos O, Camolas J, Vieira J, Carreira M, Medina L, Reis L, Myatt J, Galvão-Teles A.
National prevalence of obesity. Overweight and obesity in Portugal: Nacional
prevalence in 2003-2005. Obes Rev 2007; 9: 11-19.
Carter JL. The heath-carter anthropometric somatotype. Instruction manual. San Diego, USA:
Department of Exercise and Nutritional Sciences, San Diego State University, 2002
Casajús J, Leivia M, Villarroya A, Legaz A, Moreno, L. Physical performance and school
physical education in overweight Spanish children. Ann Nutr Metab 2007; 51: 288-296.
Castelli DM, Valley JA. The relationship of physical fitness and motor competence to physical
activity. J Teach Phys Educ 2007; 26: 358-374.
Castro-Piñero J, González-Montesinos J, Mora J, Keating X, Girela-Rejón M, Sjöström, M, Ruiz
J. Percentile values for muscular strength field tests in children aged 6 to 17 years:
influence of weight status. J Strength Cond Res 2009; 23: 2295-2310.
Cepero M, López R, Suárez-Llorca C, Andreucabrera E, Rojas F. Fitness test profiles in
children aged 8-12 years old in Granada (Spain). J Hum Sport Exerc 2011; 6: 135-146.
Coffey VG, Hawley JA. The molecular bases of training adaptation. Sports Med 2007; 37: 737-
763.

References
91
Coleman KJ, Heath EM, Alcala IS. Overweight and aerobic fitness in children in the United
States/Mexico border region. Rev Panam Salud Públ / Pan Am J Public Health 2004;
15: 262-271.
Costa R, Guerra S, Ribeiro J, Leandro C, Duarte J, Mota, J. Aptidão cardiorespiratória de uma
população pediátrica da zona do grande Porto. Rev Port Med Desp 2000; 18: 27-40.
Daniels S. The consequences of childhood overweight and obesity. Future Child 2006; 16(1):
47-67.
Dahab KS, McCambridge TM. Strength Training in Children and Adolescents: Raising the Bar
for Young Athletes? Sports Health 2009; 1: 223-226.
Deforche B, Lefevre J, De Bourdeaudhuij I, Hills A, Duquet W, Bouckaert J. Physical fitness
and physical activity in obese and nonobese Flemish youth. Obes Res 2003; 11: 434-
441.
Dencker M, Bugge A, Hermansen B, Andersen L. Objectively measured daily physical activity
related to aerobic fitness in young children. J Sports Sci 2010; 28: 139-145.
Dencker M, Thorsson O, Karlsson M, Lindén C, Svensson J. Wollmer P. Daily physical activity
and its relation to aerobic fitness in children aged 8-11 years. Eur J Appl Physiol 2006;
96: 587-592.
Dencker M, Thorsson O, Karlsson M, Lindén C, Wollmer P, Andersen L. Daily physical activity
related to aerobic fitness and body fat in an urban sample of children. Scand J Med
Sci Spor 2008; 18: 728-735.
Denney-Wilson E, Baur L. Clinical correlates of overweight and obesity. In A Hills, N King & N
Byrne (Eds), Children, obesity and exercise: Prevention, treatment and management
of childhood and adolescent obesity. Washington, USA: Routledge, 2007: 25-36.
D`Hont E, Deforche B, Bourdeaudhuij I, Lenoir M. Relationship between motor skill and Body
Mass Index in 5-to 10-year-old children. Adapt Phys Act Q 2009; 26: 21-37.
Do Carmo I, Santos O, Camolas J, Vieira J, Carreira M, Medina L, Reis L, Galvão-Teles A.
Prevalence of obesity in Portugal. Obes Rev2006; 7: 233-237.
Dudley GA, Djamil R. Incompatibility of endurance and strength training modes of exercise. J
Appl Physiol 1985; 59: 1446-1451.
Dumith S, Ramires V, Souza M, Moraes D, Petry F, Oliveira E, Ramires S, Hallal P.
Overweight/Obesity and Physical Fitness Among Children and Adolescents. J Phys Act
Health 2010; 7: 641-648.

References
92
Faigenbaum AD. The effects of twice per week strength training in children. Pediatr Exerc Sci
1993; 5: 339-346.
Faigenbaum AD, Kraemer WJ, Blimkie CJR, Jeffreys I, Micheli LJ, Nitka M, Rowland, TW.
Youth resistance training: Updated position statement paper from the National
Strength and Conditioning Association. J Strength Cond Res 2009; 23(Supplement 5):
S60–S79.
Faigenbaum A, Milliken L, LaRosa Loud R, Burak B, Doherty C, Westcott W. Comparison of 1
day and 2 days per week of strength training in children. Res Q Exerc Sport 2002; 73:
416-424.
Faigenbaum A, Milliken L, Moulton L, Westcott W. Early muscular fitness adaptations in
children in response to two different resistance training regimens. Pediatr Exerc Sci
2005; 17: 237-248.
García-Pallarés J, Izquierdo M. Strategies to Optimize Concurrent Training of Strength and
Aerobic Fitness for Rowing and Canoeing. Sports Med 2011; 41: 329-343.
García-Pallarés J, Sánchez-Medina L, Carrasco L, Diaz A, Izquierdo M. Endurance and
neuromuscular changes in world-class level kayakers during a periodized training
cycle. Eur J Appl Physiol 2009; 106: 629-638.
Gaya A, Alves A, Aires L, Martins C, Ribeiro J, Mota J. Association between time spent in
sedentary, moderate to vigorous physical activity, body mass index, cardiorespiratory
fitness and blood pressure. Ann Hum Biol 2009; 36: 379-387.
González-Badillo JJ, Gorostiaga EM, Arellano R, Izquierdo M. Moderate resistance training
volume produces more favorable strength gains than high or low volumes. J Strength
Cond Res 2005; 19: 689-97.
Graf C, Koch B, Kreetschmann-Kandel E, Falkowski G, Christ H, Coburguer S, Lenhmacher W,
Bjarnason-Weherens B, Platen P, Tokarski W, Predel H, Dordel, S. Correlation
between BMI, leisure habits and motor abilities in childhood (CHILT-Project). Int J
Obes 2004; 28: 22-26.
Haff, GG. Roundtable discussion: Youth resistance training. Strength Cond J 2003; 25: 49-64.
Hands B, Larkin D, Parker H, Straker L, Perry M. The relationship among physical activity,
motor competence and health- related fitness in 14-year-old adolescents. Scand J
Med Sci Sports 2009; 19: 655-663.
Hickson RC. Interference of strength development by simultaneously training for strength and
endurance. Eur J Appl Physiol Occup Physiol 1980; 45: 255-263.

References
93
Hind K, Burrows M. Weight-bearing exercise and bone mineral accrual in children and
adolescents: a review of controlled trials. Bone 2007; 40: 14-27.
Huang Y, Malina R. (2007). BMI and health-related physical fitness in Taiwanese youth 9-18
years. Med Sci Sports Exerc 2007; 39: 701-708.
Ignjatović A, Stanković R, Radovanović D, Zivorad MZ, Cvecka J. Resistance training for
youths. Facta Universitatis 2009; 1: 189-196.
Jakšić D, Cvetković M. Neural network analysis of somatotype differences among males
related to the manifestation of motor abilities. Acta Kinesiologica 2009; 3, 107-113.
Janssen I, Katzmarzyk PT, Boyce WF, Vereecken C, Mulvihill C, Roberts C, Currie C, Pickett
W. Comparison of overweight and obesity prevalence in school-aged youth from 34
countries and their relationships with physical activity and dietary patterns. Obes Rev
2005; 6: 123-132.
Joshi P, Bryan C, Howat H. Relationship of body mass index and fitness levels among
schoolchildren. J Strength Cond Res 2012; 26: 1006-1014.
Katch V. Physical conditioning of children. J Adolesc Health Care 1983; 3: 241-246.
Katzmarzyk P, Janssen I, Ardern, C. Physical activity, excess adiposity and premature
mortality. Obesity Review 2003; 4: 257-290.
Kraemer WJ, Fleck SJ. Strength training for young athletes (2nd Ed.). Champaign, Ill: Human
Kinetics, 2005.
Kraemer WJ, Ratamess NA. Fundamentals of resistance training: progression and exercise
prescription. Med Sci Sports Exerc 2004; 36: 674-88.
Kriska A. Ethnic and cultural issues in assessing physical activity. Res Q Exerc Sport 2000; 71:
47-53.
Lillegard W, Brown E, Wilson D, Henderson R, Lewis E. Efficacy of strength training in
prepubescent to early postpubescent males and females: Effects of gender and
maturity. Pediatr Rehabil 1997; 1: 147-157.
Lobstein T, Baur L, Uauy R. Obesity in children and young people: a crisis in public health.
Obes rev 2004; 5: 4-85.
Luguetti C, Ré A, Böhme M. Indicators of physical fitness in school children from the midwest
region of São Paulo City. Rev Bras Cineantropom Desempenho Hum 2010; 12: 331-337.
References
94
Mahieu N, Witvrouw E, Van de Voorde D, Michildsens D, Arbyn V, Vvan den Broecke W.
Improving strength and postural control in young skiers: Whole-body vibration versus
equivalent resistance training. J Athl Training 2006; 41: 286-293.
Maia J, Silva, Freitas D, Beunen G, Lefevre J, Claessens A, Marques A, Thomis M. Modeling
stability in the somatotype of children and youngsters from 10 to 16 years of the
Madeira growth study (Portugal). Rev Bras Cineantropom Desempenho Hum 2004; 6:
36-45.
Malina R. Physical activity and fitness : pathways from childhood to adulthood. Am J Hum Biol
2001; 13: 162-172.
Malina R, Bouchard C. Growth maturation and physical activity. Champaign, Illinois: Human
Kinetics, 1991.
Malina R, Bouchard C, Bar-Or O. Growth, maturation and physical activity. Champaign,
Illinois: Human Kinetics, 2004.
Marques-Vidal P, Dias C. Trends in overweight and obesity in Portugal: The National Health
Surveys 1995-6 and 1998-9. Obes Res 2005; 13: 1141-1145.
Marshall SJ, Biddle SH, Sallis JF, Mckenzie TL, Conway TL. Clustering of sedentary behaviors
and physical activity among youth : a cross-national study. Pediatr Exerc Sci 2002; 14:
401-417.
Matos N, Winsley RJ. Trainability of young athletes and overtraining. J Sports Sci Med 2007; 6:
353-367.
Matton L, Duvigneeaud N, Wijndaele K, Philippaerts R, Duquet W, Beunen G, Claessens A,
Thomis M, Lefevre J. Secular trends in anthropometric characteristics, physical
fitness, physical activity and biological maturation in flemish adolescents between
1969 and 2005. Am J Hum Biol 2007; 19: 326-624.
McManus A, Armstrong N, Williams C. Effect of training on the aerobic power and anaerobic
performance of prepubertal girls. Acta Paediatr 1997; 86: 456-459.
Mota J, Flores L, Flores L, Ribeiro J, Santos M. Relationship of single measures of
cardiorespiratory fitness and obesity in young schoolchildren. Am J of Hum Biol 2006;
18: 335-341.
National Association for Sport and Physical Education. Physical activity for children: A
statement of guidelines for children ages 5-12. Reston, VA: National Association for
Sport and Physical Education Publications, 2004.
References
95
NIH Consensus Development Panel on Physical Activity and Cardiovascular Health. Physical
activity and cardiovascular health. J Am Med Assoc 1996; 276: 241-246.
Obert P, Mandigouts S, Nottin S, Vinet A, N'Guyen LD, Lecoq AM. Cardiovascular responses to
endurance training in children: effect of gender. Eur J Clin Invest 2003; 33: 199-208.
O`Donovan G, Blazevich A, Boreham C, Cooper A, Crank H, Ekelund U, Fox K, Gately P, Giles-
Corti B, Gill J, Hamer M, McDermott I, Murphy M, Mutrie N, Reilly J, Saxton J,
Stamatakis E. The ABC of Physical Activity for Health: A consensus statement from the
British Association of Sport and Exercise Sciences. Journal of Sports Sciences 2010;
28: 573-591.
Ortega B, Tresaco B, Ruiz J, Moreno L, Matillas M, Mesa J, Warnberg J, Bueno M, Tercedor P,
Gutiérrez A, Castillo M. Cardiorespiratory fitness and sedentary activities are
associated with adiposity in adolescents. Obesity 2007; 15: 1589-1599.
Ozmun J, Mikesky A, Surburg P. Neuromuscular adaptations following prepubescent strength
training. Med Sci Sports Exerc 1994; 26: 510-514.
Pate R, Freedson P, Sallis J, Taylor WC, Sirard J, Trost SG, Dowda M. Compliance with
physical activity guidelines: prevalence in a population of children and youth. Ann
Epidemiol 2002; 12: 303-308.
Payne V, Morrow J, Johnson L, Dalton S. Resistance training in children and youth: Meta-
analysis. Res Q Exerc Sport 1997; 68: 80-88.
Pertroski, E. Diagnóstico de obesidade infantil. In A Silva, J Neto, M Monteiro & V Reis (Eds),
Medidas e Avaliação. Montes Claros: Editora CGB Artes Gráficas, 2007: 53-75.
Prentice A, Schoenmakers I, Laskey MA, de Bono, S, Ginty F, Goldberg GR. Nutrition and bone
growth and development. Proc Nutr Soc 2006 65: 348-360.
Ramsay J, Blimkie C, Smith K, Garner S, MacDougall J, Sale D. Strength training effects in
prepubescent boys. Med Sci Sports Exerc 1990; 22: 605-614.
Reis VM, Machado JV, Fortes MS, Fernandes PR, Silva AJ, Dantas PS, Filho JF. Evidence for
higher heritability of somatotype compared to body mass index in female twins. J
Physiol Anthropol 2007; 26: 9-14.
Roetert, EP. The lack of childhood activity in the United States. Strength Cond J 2004; 26: 22-
23.
Rowland TW. Children's Exercise Physiology. Champaign, IL: Human Kinetics, 2005.
Rowland TW, Boyajian A. Aerobic Response to Endurance Exercise Training in Children.
Pediatrics 1995; 96: 654-658.

References
96
Ruiz JR., Rizzo NS, Hurtig-Wennlof A, Ortega FB, Warnberg J, Sjostrom M. Relations of total
physical activity and intensity to fitness and fatness in children: The European Youth
Heart Study. Am J Clin Nutr 2006; 84, 299-303.
Sallis J, Rosemberg D, Kerr J. Early physical activity, sedentary behavior and dietary patterns.
In L Heinberg & J Thompson, J. (Eds), Obesity in Youth: Causes, consequences and
cures. American Psychological Association, 2009: 37-53.
Sallis J, Prochaska J, Taylor W. A review of correlates of physical activity of children and
adolescents. Med Sci Sports Exerc 2000; 32: 963-975.
Santos A, Marinho DA, Costa AM, Izquierdo M, Marques MC. The Effects of concurrent
resistance and endurance training follow a specific detraining cycle in young school
girls. J Hum Kinet 2011; Special Issue: 93‐103.
Santos A, Marinho DA, Costa AM, Izquierdo M, Marques MC. The effects of concurrent
resistance and endurance training follow a detraining period in elementary school
students. J Strength Cond Res 2012; 26: 1708-1716
Sarzynski M, Eisenmann J, Welk G, Tucker J, Glenn K, Rothschild M, Heelan K. ACE I/D
genotype, habitual physical activity, and blood pressure in children. Pediatr Exerc Sci
2010; 22: 301-313.
Shabi G, Cruz M, Ball G, Weigensberg M, Salem G, Crespo N, Goran M. Effects of resistance
training on insulin sensitivity in overweight Latino adolescent males. Med Sci Sports
Exerc 2006; 38: 1208-1215.
Shaw BS, Shaw I, Brown GA. Comparison of resistance and concurrent resistance and
endurance training regimes in the development of strength. J Strength Cond Res
2009; 23: 2507-2514.
Shukla M, Venugopal R, Mitra M. A cross sectional study of body composition somatotype and
motor quality of rural and urban boys of Chhattisgarh. Int J Fitness 2009; 5: 1-7.
Stephen R. The consequences of childhood overweigh and obesity. Future Child 2006; 16: 47-
67.
Suchomel A. Relation between anthropometric somatotype and motor performance in
prepubescent and pubescent Czech. Anthropologie 2002; 40: 193-201.
Sveinsson T, Arngrimsson S, Johannsson E. Association between aerobic fitness, body
composition, and physical activity in 9- and 15-year-olds. Eur J Sport Sci 2009; 9: 141-
150.

References
97
Taanila H, Hemminki A, Suni J, Pihlajamäki H, Parkkari J. Low physical fitness is a strong
predictor of health problems among young men: a follow-up study of 1411 male
conscripts. BMC Public Health 2011; 11: 590.
Tolfrey K. Responses to training. In: N Armstrong (Eds), Pediatric exercise science: Advances
in sport and exercise science series. Edinburgh: Churchill Livingston Elsevier, 2007:
213-234.
Tomkinson GR, Olds TS. Secular changes in pediatric aerobic fitness test performance: The
global picture. Med Sport Sci 2007; 50: 46-66.
Tovar G, Poveda J, Pinilla M, Lobelo F. Relationship between overweight, physical activity
and physical fitness in school-aged boys in Bogotá Colombia. Arch Latinoam Nutr
2008; 58: 265-273.
Tsolakis C, Vagenas G, Dessypris A. Strength adaptations and hormonal responses to
resistance training and detraining in preadolescent males. J Strength Cond Res 2004;
18: 625-629.
Tudor-Locke C, Ainsworth BE, Popkin BM. Active commuting to school: an overlooked source
of childrenʼs physical activity. Sports Med 2001; 31: 309-313.
Twist J, Kemper H, Van Mechelen W. Tracking of activity and fitness and the relationship with
cardiovascular disease risk factors. Med Sci Sports Exerc 2000; 32: 1455-1461.
US Department of Health and Human Services. Physical Activity and Health: A Report of the
Surgeon General. Atlanta, GA: US Department of Health and Human Services, Centers
for Disease Control and Prevention, National Center for Chronic Disease Prevention
and Health Promotion, 1996.
Vamvakoudis E, Vrabas IS, Galazoulas C, Stefanidis P, Metaxas TI, Mandroukas K. Effects of
basketball training on maximal oxygen uptake, muscle strength, and joint mobility in
young basketball players. J Strength Cond Res 2007; 21: 930-936.
Van Dusen DP, Kelder SH, Kohl HW, Ranjit N, Perry CL. Associations of Physical Fitness and
Academic Performance Among Schoolchildren. J Sch Health 2011; 81:733-740.
Wang Y, Lobstein T. Worldwide trends in childhood overweight and obesity. Int J Pediatr Obes
2006; 1: 11-25.
Weineck J. Atividade física e esporte: Para quê? Barueri, Brasil: Ed. Manole, 2003.
World Health Organization European Office. The challenge of obesity in the WHO European
Region and strategies for response. WHO, 2007.

References
98
World Health Organization (WHO). Global Recommendations on Physical Activity for Health.
Geneva: WHO, 2010.
Wrotniak B, Epstein L, Dorn J, Jones K, Kondilis V. The relationship between motor
proficiency and physical activity in children. Pediatrics 2006; 118: 1758-1765.
Xianwen S, Ailing L, Yanping L, Xiaoqi H, Lin D, Jun M, Guifa X, Ying L, Hongwei G, Guansheng
M. The association of weight status with physical fitness among Chinese children. Int J
Pediatr 2010; 1-6. doi:10.1155/2012/943653
Yu C, Sung R, Hau K, Lam P, Nelson E, So R. The effect of diet and strength training on obese
children’s physical self concept. J Sports Med Phys Fitness 2008; 48: 76-82.
Chapter 3
Study 2
Andersen L, Hasseltrom H, Gronfeldt V, Hansen S, Karsten K. The relationship between
physical fitness and clustered risk, and tracking of clustered risk from adolescence to
young adulthood: Eight years follow‐up in the Danish Youth and Sport Study. Int J
Behav Nutr Phys Act 2004; 1: 6.
Artero E, España‐Romero V, Ortega F, Jiménez‐Pavón D, Ruiz J, Vicente‐Rodríguez G, Bueno
M, Marcos A, Gómez‐Martínez S, Urzanqui A, González‐Gross M, Moreno L, Gutiérrez
A, Castillo M. Healthrelated fitness in adolescents: underweight, and not only
overweight, as an influencing factor. The AVENA study. Scand J Med Sci Spor 2010;
20: 418‐427.
Baecke J, Burema J, Frijiters J. A short questionnaire for the measurement of habitual
physical activity in epidemiological studies. Am J Clin Nutr 1982; 36: 936‐942.
Casajús J, Leivia M, Villarroya A, Legaz A, Moreno L. Physical performance and school physical
education in overweight Spanish children. Ann Nutr Metab 2007; 51: 288‐296.
Castelli D, Valley J. The relationship of physical fitness and motor competence to physical
activity: Chapter 3. J Teach Phys Educ 2007; 26: 358‐374.
Castro‐Piñero J, González‐Montesinos J, Mora J, Keating X, Girela‐Rejón M, Sjöström M, Ruiz
J. Percentile values for muscular strength field tests in children aged 6 to 17 years:
influence of weight status. J Strength Cond Res 2009; 23: 2295‐2310.
Cepero M, López R, Suárez‐Llorca C, Andreucabrera E, Rojas F. Fitness test profiles in
children aged 8‐12 years old in Granada (Spain). J Hum Sport Exerc 2011; 6: 135 146.

References
99
Cole T, Billizzi M, Flegal K, Dietz W. Establishing a standard definition for child overweight
and obesity worldwide: International survey. Brit Med J 2000; 320: 1240‐1243.
Deforche B, Lefevre J, De Bourdeaudhui I, Hills A, Duquet W, Bouckaert J. Physical fitness
and physical activity in obese and nonobese Flemish youth. Obes Res 2003; 11:
434‐441.
D`Hont E, Deforche B, Bourdeaudhuij I, Lenoir M. Relationship between motor skill and Body
Mass Index in 5‐to 10‐year‐old children. Adapt Phys Act Q 2009; 26: 21‐37.
Dumith S, Ramires V, Souza M, Moraes D, Petry F, Oliveira E, Ramires S, Hallal P.
Overweight/Obesity and physical fitness among children and adolescents. J Phys Act
Health 2010; 7: 641‐648.
Fogelholm M, Stigman S, Huisman T, Metsämuuronen J. Physical fitness in adolescents with
normal weight and overweight. Scand J Med Sci Sport 2008; 18: 162‐170.
Heath H, Carter L. Growth and somatotype patterns of Manus children, Territory of Papua and
New Guinea: Application of a modified somatotype method to the study of growth
patterns. Am J Phys Anthropol 1971; 35: 49‐67.
Hands B, Larkin D, Parker H, Straker L, Perry M. The relationship among physical activity,
motor competence and health‐ related fitness in 14‐year‐old adolescents. Scand J
Med Sci Sport 2009; 19: 655‐663.
Jakšić D, Cvetković M. Neural network analysis of somatotype differences among males
related to the manifestation of motor abilities. Acta Kinesiologica 2009; 3: 107‐113.
Lennox A, Pienaar A, Wilders C. Physical fitness and the physical activity status of 15‐year‐old
adolescents in a semi‐urban community. S Afr J Res Sport Phys Educ Recreation 2008;
30: 59‐73.
Loko J, Aule R, Sikkut T, Ereline J, Viru A. Age differences in growth and physical abilities in
trained and untrained girls 10‐17 years of age. Am J Hum Biol 2003; 15: 72-77.
Malina R, Bouchard C. Growth maturation and physical activity. Champaign, Illinois: Human
Kinetics, 1991.
Malina R, Bouchard C, Bar‐Or O. Growth, maturation and physical activity. Champaign,
Illinois: Human Kinetics, 2004.
Martínez‐Gómez D, Welk G, Puertollano M, del‐Campo J, Moya J, Marcos A, Veiga O.
Associations of physical activity with muscular fitness in adolescents. Scand J Med Sci
Sport 2011; 21: 310‐318.
References
100
Reis VM, Machado JV, Fortes MS, Fernandes PR, Silva AJ, Dantas PS, Filho JF. Evidence for
higher heritability of somatotype compared to body mass index in female twins. J
Physiol Anthropol 2007; 26: 9‐14.
Sharkey, BJ. Fitness & Health. Hong Kong: Human Kinetics, 2002.
Shukla M, Venugopal R, Mitra M. A cross sectional study of body composition somatotype and
motor quality of rural and urban boys of Chhattisgarh. Int J Fitness 2009; 5: 1‐7.
Slaughter M, Lohman T, Boileau R, Horswill C, Stillman R, VanLoan M, Bemben D. Skinfold
equations for estimation of body fatness in children and youth. Hum Biol 1988; 60:
709‐723.
Stodden D, Goodwway J, Langendorfer S, Roberton M, Rudisill M, et al. A developmental
perspective on the role of motor skill competence in physical activity: An emergent
relationship. Quest 2008; 60: 290‐306.
Suchomel A. Relation between anthropometric somatotype and motor performance in
prepubescent and pubescent Czech. Anthropologie 2002; 40: 193‐201.
Tanner JM. Growth at adolescence. Oxford: Blackwell Scientific Publications, 1962.
Tovar G, Poveda J, Pinilla M, Lobelo F. Relationship between overweight, physical activity
and physical fitness in school‐aged boys in Bogotá Colombia. Arch Latinoam Nutr
2008; 58(3): 265‐273.
Wrotniak B, Epstein L, Dorn J, Jones K, Kondilis V. The relationship between motor
proficiency and physical activity in children. Pediatrics 2006; 118: 1758‐1765.
Xianwen S, Ailing L, Yanping L, Xiaoqi H, Lin D, Jun M, Guifa X, Ying L, Hongwei G,
Guansheng, M. The association of weight status with physical fitness among Chinese
children. Int J Pediatr 2010; 1-6. doi:10.1155/2012/943653
Zak S, Szopa J. Effects of diversified motor activity on the level of motor fitness in children
and Youth from Cracow (Poland). J Hum Kinetic 2001; 6: 47‐58.
Study 3
Adam C, Klissouras V, Ravassolo M, Renson R, Tuxworth W, Kemper H, Van Mechelen W, Hlobil
H, Beunen G, Levarlet-Joye H, Van Lierde A. Eurofit: Handbook for the Eurofit Test
of Physical Fitness. Rome: Council of Europe. Committee for the Development of
Sport, 1988.

References
101
Allard P, Nault M, Hinse S, Leblawc R, Labelle H. Relationship between morphologic
somatotypes and standing posture equilibrium. Ann Hum Biol 2001; 28: 624-633.
American Alliance for Health, Physical Education, Recreation and Dance. Youth fitness test
manual. Washington: AAHPERD, 1976.
Artero EG, España-Romero V, Ortega FB, Jiménez-Pavón D, Ruiz JR, Vicente-Rodríguez G,
Bueno M, Marcos A, Gómez-Martínez S, Urzanqui A, González-Gross M, Moreno L,
Gutiérrez A, Castillo, MJ. Health-related fitness in adolescents: underweight, and not
only overweight, as an influencing factor. The AVENA study. Scand J Med Sci Spor
2010; 20: 418-427.
Baecke JA, Burema J, Frijiters JE. A short questionnaire for the measurement of habitual
physical activity in epidemiological studies. Am J Clin Nutr 1982; 36: 936-942.
Branta C, Haubenstricker J, Seefeldt V. Age changes in motor skills during childhood and
adolescence. Exercise Sport Sci Rev 1984; 12: 467-520.
Castro-Piñero J, González-Montesinos JL, Mora J, Keating XD, Girela-Rejón MJ, Sjöström M,
Ruiz JR. Percentile values for muscular strength field tests in children aged 6 to 17
years: influence of weight status. J Strength Cond Res 2009; 23: 2295-2310.
Cepero MR, López R, Suárez-Llorca C, Andreu-cabrera E, Rojas FJ. Fitness test profiles in
children aged 8-12 years old in Granada (Spain). J Hum Sport Exerc 2011; 6: 135-146.
Coleman KJ, Heath EM, Alcala IS. Overweight and aerobic fitness in children in the United
States/Mexico border region. Rev Panam Salud Públ / Pan Am J Public Health 2004;
15: 262-271.
Dencker M, Thorsson O, Karlsson M, Lindén C, Eiberg S, Wollmer P, Andersen B. Gender
differences and determinants of aerobic fitness in children aged 8–11 years. Eur J
Appl Physiol 2007; 99: 19-26.
Dumith SC, Ramires VV, Souza MA, Moraes DS, Petry FG, Oliveira ES, Ramires SV, Hallal PC.
Overweight/Obesity and physical fitness among children and adolescents. J Phys Act
Health 2010; 7: 641-648.
Faigenbaum AD, Westcott WL, Micheli LJ, Outerbridge AR, Long CJ, LaRosa-Loud R,
Zaichkowsky LD. The Effects of Strength Training and Detraining on Children. J
Strength Cond Res 1996; 10: 109-114.
George JD, Fisher AG, Vehrs, PR. Laboratory experiences in exercise science. Boston: Jones
& Bartlett Publishers, Inc, 1994.
Haff GG. Roundtable discussion: Youth resistance training. Strength Cond J 2003; 25: 49-64.

References
102
Hands B, Larkin D, Parker H, Straker, L, Perry M. The relationship among physical activity,
motor competence and health- related fitness in 14-year-old adolescents. Scand J
Med Sci Sports 2009; 19: 655-663.
Heath BH, Carter, JEL. Growth and somatotype patterns of Manus children, Territory of Papua
and New Guinea: Application of a modified somatotype method to the study of growth
patterns. Am J Phys Anthropol 1971; 35: 49-67.
Jakšić D, Cvetković M. Neural network analysis of somatotype differences among males
related to the manifestation of motor abilities. Acta Kinesiologica 2009; 3: 107-113.
Kato E, Oda T, Chino K, Kurihara T, Nagayoshi T, Fukunaga T, Yasuo Kawakami Y.
Musculotendinous Factors Influencing Difference in Ankle Joint Flexibility between
Women and Men. Int J Sport Health Sci 2005; 3(Special Issue): 218-225.
Kvaavik E, Klepp KI, Tell GS, Meyer HE, Batty GD. Physical fitness and physical activity at age
13 years as predictors of cardiovascular disease risk factors at ages 15, 25, 33, and 40
years: extended follow-up of the Oslo Youth Study. Pediatrics 2009; 123: e80-e86.
Lennox A, Pienaar AE, Wilders, C. Physical fitness and the physical activity status of 15-year-
old adolescents in a semi-urban community. S Afr J Res Sport Phys Educ Recreation
2008; 30: 59-73.
Little T, Williams AG. Specificity of acceleration, maximum speed, and agility in professional
soccer players. J Strength Cond Res 2005; 19:76-78.
Lyu M, Gill D. Perceived physical competence, enjoyment and effort in same-sex and
coeducational physical education classes. J Educ Psychol 2011; 31: 247-260.
Malina RM, Bouchard C. Growth maturation and physical activity. Champaign, Illinois: Human
Kinetics, 1991.
Malina RM, Bouchard C, Bar-Or, O. Growth, maturation and physical activity. Champaign,
Illinois: Human Kinetics, 2004.
Marfell-Jones M, Olds T, Stewart A, Carter L. International standards for anthropometric
assessment. Potchefstroom, South Africa: ISAK, 2006.
Mayhew JL, Ware JS, Johns RA, Bemben MG. Changes in upper body power following heavy-
resistance strength training in college men. Int J Sports Med 1997; 18: 516-520.
Meredith MD, Welk GJ. FITNESSGRAM / ACTIVITYGRAM Test Administration Manual (4th Ed).
Champaign, IL: Human Kinetics, 2007.

References
103
Monyeki MA, Koppes LJ, Kemper HG, Monyeki KD, Toriola AL, Pienaar AE, Twisk JW. Body
composition and physical fitness of undernourished South African rural primary school
children. Eur J Clin Nutr 2005; 59:877-83.
NIH Consensus Development Panel on Physical Activity and Cardiovascular Health. Physical
activity and cardiovascular health. J Am Med Assoc 1996; 276, 241-246.
Ortega FB, Tresaco B, Ruiz JR, Moreno LA, Matillas M, Mesa JL, Warnberg J, Bueno M,
Tercedor P, Gutiérrez A, Castillo MJ. Cardiorespiratory fitness and sedentary activities
are associated with adiposity in adolescents. Obesity 2007; 15: 1589-1599.
Reed JA, Metzker A. Relationships between physical activity and motor skills in middle school
children. Percept Motor Skill 2004; 99: 483-494.
Reis VM, Machado JV, Fortes MS, Fernandes,PR, Silva AJ, Dantas PS, Filho JF. Evidence for
higher heritability of somatotype compared to body mass index in female twins. J
Physiol Anthropol 2007; 26: 9-14.
Roetert EP. The lack of childhood activity in the United States. Strength Cond J 2004; 26: 22-
23.
Shukla M, Venugopal R, Mitra M. A cross sectional study of body composition somatotype and
motor quality of rural and urban boys of Chhattisgarh. Int J Fitness 2009; 5: 1-7.
Slaughter MH, Lohman TG, Boileau RA, Horswill CA, Stillman RJ, VanLoan MD, Bemben DA.
Skinfold equations for estimation of body fatness in children and youth. Hum Biol
1988; 60: 709-723.
Sola K, Brekke N, Brekke M. An activity-based intervention for obese and physically inactive
children organized in primary care: feasibility and impact on fitness and BMI a one-
year follow-up study. Scand J Prim Health 2010; 28: 199-204.
Sveinsson T, Arngrimsson SA, Johannsson E. Association between aerobic fitness, body
composition, and physical activity in 9- and 15-year-olds. Eur J Sport Sci 2009; 9: 141-
150.
Thomas JR, French KE. Gender differences across age in motor performance: A meta-
analyses. Psychol Bull 1985; 98: 260-282.
Tovar G, Poveda JG, Pinilla MI, Lobelo F. Relationship between overweight, physical activity
and physical fitness in school-aged boys in Bogotá Colombia. Arch Latinoam Nutr
2008; 58: 265-273.
References
104
Study 4
Adam C, Klissouras V, Ravassolo M, Renson R, Tuxworth W, Kemper H, Van Mechelen W, Hlobil
H, Beunen G, Levarlet-Joye H, Van Lierde A. Eurofit: Handbook for the Eurofit Test
of Physical Fitness. Rome: Council of Europe. Committee for the Development of
Sport, 1988.
Anderssen SA, Cooper AR, Riddoch C, Sardinha LB, Harro M, Brage S, Andersen LB. Low
cardiorespiratory fitness is a strong predictor for clustering of cardiovascular disease
risk factors in children independent of country, age and sex. Eur J Cardiovasc Prev
Rehabil 2007; 14: 526–531.
Behringer M, Vom Heede A, Matthews M, Mester J. Effects of strength training on motor
performance skills in children and adolescents: A Meta-Analysis. Pediatr Exerc Sci
2011; 23: 186-206.
Burgeson CR, Wechsler H, Brener ND, Young JC, Spain CG. Physical Education and Activity:
Results from the School Health Policies and Programs Study 2000. J Sch Health 2001;
71: 279-293.
Castro-Piñero J, González-Montesinos J, Mora J, Keating X, Girela-Rejón M, Sjöström, M, Ruiz
J. Percentile values for muscular strength field tests in children aged 6 to 17 years:
influence of weight status. J Strength Cond Res 2009; 23: 2295-2310.
Centers for Disease Control and Prevention. Physical activity levels among children aged 9–13
years - United States, 2002. Morb Mort Wk Rep 2003; 52: 785-788.
Cepero MR, López R, Suárez-Llorca C, Andreu-cabrera E, Rojas FJ. Fitness test profiles in
children aged 8-12 years old in Granada (Spain). J Hum Sport Exerc 2011; 6: 135-146.
Chaouachi M, Chaouachi A, Chamari K, Chtara M, Feki Y, Amri M, Trudeau F. Effects of
dominant somatotype on aerobic capacity trainability. Br J Sports Med 2005; 39: 954-
959.
Dorgo S, King GA, Candelaria NG, Bader JO, Brickey GD, Adams CE. Effects of manual
resistance training on fitness in adolescents. J Strength Cond Res 2009; 23: 2287-
2294.
Dumith S, Ramires V, Souza M, Moraes D, Petry F, Oliveira E, Ramires S, Hallal P.
Overweight/Obesity and Physical Fitness Among Children and Adolescents. J Phys Act
Health 2010; 7: 641-648.
Evenson KR, Ballard K, Lee G, Ammerman A. Implementation of a School-Based State Policy to
Increase Physical Activity. J Sch Health. 2009; 79: 231-238.

References
105
Faigenbaum AD, Kraemer WJ, Blimkie CJR, Jeffreys I, Micheli LJ, Nitka M, Rowland, TW.
Youth resistance training: Updated position statement paper from the National
Strength and Conditioning Association. J Strength Cond Res 2009; 23: S60–S79.
Faigenbaum AD, Westcott WR, Micheli, L. The Effects of Strength Training and Detraining on
Children. J Strength Cond Res 1996; 10: 109-114.
Heath BH, Carter JEL. Growth and somatotype patterns of Manus children, Territory of Papua
and New Guinea: Application of a modified somatotype method to the study of growth
patterns. Am J Phys Anthropol 1971; 35: 49-67.
Ignjatović A, Stanković R, Radovanović D, Zivorad MZ, Cvecka J. Resistance training for
youths. Facta Universitatis 2009; 7: 189-196.
Jakšić D, Cvetković M. Neural network analysis of somatotype differences among males
related to the manifestation of motor abilities. Acta Kinesiologica 2009; 3: 107-113.
Léger LA, Mercier D, Gadoury C, Lambert J. The multistage 20 meter shuttle run test for
aerobic fitness. J Sports Sci 1988; 6: 93-101.
Linthorne NP. Analysis of standing vertical jumps using a force platform. Am J Physics 2001;
69: 1198-1204.
Malina R, Bouchard C. Growth maturation and physical activity. Champaign, Illinois: Human
Kinetics, 1991.
Malina R, Bouchard C, Bar-Or O. Growth, maturation and physical activity. Champaign,
Illinois: Human Kinetics, 2004.
Marfell-Jones M, Olds T, Stewart A, Carter L. International standards for anthropometric
assessment. Potchefstroom, South Africa: ISAK, 2006.
Mayhew JL, Ware JS, Johns RA, Bemben MG. Changes in upper body power following heavy-
resistance strength training in college men. Int J Sports Med 1997; 18: 516-520.
Norman A, Drinkard B, McDuffie J, Ghorbani S, Yanoff L. Yanovski J. Influence of excess
adiposity on exercise fitness and performance in overweight children and adolescents.
Pediatrics 2005; 115: 690-696.
Ortega B, Tresaco B, Ruiz J, Moreno L, Matillas M, Mesa J, Warnberg J, Bueno M, Tercedor P,
Gutiérrez A, Castillo M. Cardiorespiratory fitness and sedentary activities are
associated with adiposity in adolescents. Obesity 2007; 15: 1589-1599.
Ozmun J, Mikesky A, Surburg P. Neuromuscular adaptations following prepubescent strength
training. Med Sci Sports Exerc 1994; 26: 510-514.

References
106
Ramsay J, Blimkie C, Smith K, Garner S, Macdougall J, Sale D. Strength training effects in
prepubescent boys. Med Sci Sports Exerc 1990; 22: 605-614.
Sandbakk Ø, Welde B, Holmberg HC. Endurance training and sprint performance in elite junior
cross-country skiers. J Strength Cond Res 2011; 25: 1299-1305.
Santos E, Janeira M. Effects of complex training on explosive strength in adolescent male
basketball players. J Strength Cond Res 2008; 22: 903-909.
Santos A, Marinho DA, Costa AM, Izquierdo M, Marques MC. The effects of concurrent
resistance and endurance training follow a detraining period in elementary school
students. J Strength Cond Res 2012; 26: 1708-16.
Shukla M, Venugopal R, Mitra M. A cross sectional study of body composition somatotype and
motor quality of rural and urban boys of Chhattisgarh. Int J Fitness 2009; 5: 1-7.
Slaughter MH, Lohman TG, Boileau RA, Horswill CA, Stillman RJ, VanLoan MD, Bemben DA.
Skinfold equations for estimation of body fatness in children and youth. Hum Biol
1988; 60: 709-723.
Stenevi-Lundgren S, Daly RM, Lindén C, Gärdsell P, Karlsson MK. Effects of a daily school
based physical activity intervention program on muscle development in prepubertal
girls. Eur J Appl Physiol 2009; 105(4): 533-541.
Strong WB, Malina RM, Blimkie CJ, Daniels SR, Dishman RK, Gutin B. Hergenroeder AC, Must A,
Nixon PA, Pivarnik JM, Rowland T, Trost S, Trudeau F. Evidence based physical
activity for school-age youth. Pediatrics 2005; 146: 732-737.
Suchomel A. Relation between anthropometric somatotype and motor performance in
prepubescent and pubescent Czech. Anthropologie 2002; 40: 193-201.
Taanila H, Hemminki A, Suni J, Pihlajamäki H, Parkkari, J. Low physical fitness is a strong
predictor of health problems among young men: a follow-up study of 1411 male
conscripts. BMC Public Healt. 2011; 11: 590.
World Health Organization (WHO). Global Recommendations on Physical Activity for Health.
Geneva: World Health Organization, 2010.
Study 5
Adam C, Klissouras V, Ravassolo M, Renson R, Tuxworth W, Kemper H, Van Mechelen W, Hlobil
H, Beunen G, Levarlet-Joye H, Van Lierde A. Eurofit: Handbook for the Eurofit Test
of Physical Fitness. Rome: Edigraf Editoriale Gráfica, 1988.
References
107
American College of Sports Medicine. Guidelines for Exercise Testing and Prescription. 7th
ed. Philadelphia, PA: Lippincott Williams & Wilkins, 2006.
Anderson LB, Haraldsdottir J. Coronary heart disease risk factors, physical activity, and
fitness in young Danes. Med Sci Sports Exerc 1995; 27: 158–163.
Anderssen SA, Cooper AR, Riddoch C, Sardinha LB, Harro M., Brage S, Andersen LB. Low
cardiorespiratory fitness is a strong predictor for clustering of cardiovascular disease
risk factors in children independent of country, age and sex. Eur J Cardiovasc Prev
Rehabil 2007; 14: 526–531.
Cepero MR, López R, Suárez-Llorca C, Andreu-cabrera E, Rojas FJ. Fitness test profiles in
children aged 8-12 years old in Granada (Spain). J Hum Sport Exerc 2011; 6: 135–146.
Coffey VG, Hawley JA. The molecular bases of training adaptation. Sports Med 2007; 37: 737–
63.
Coleman KJ, Heath EM, Alcala IS. Overweight and aerobic fitness in children in the United
States/Mexico border region. Rev Panam Salud Publica 2004; 15: 262–271.
Dorgo S, King GA, Candelaria NG, Bader JO, Brickey GD, Adams CE. Effects of manual
resistance training on fitness in adolescents. J Strength Cond Res 2009; 23: 2287–
2294.
Dudley GA, Djamil R. Incompatibility of endurance- and strengthtraining modes of exercise. J
Appl Physiol 1985; 59: 1446–1451.
Duke PM, Litt IR, Gross RT. Adolescentsʹ self-assessment of sexual maturation. Pediatrics
1980; 66: 918–920.
Faigenbaum AD, Kraemer WJ, Blimkie CJR, Jeffreys I, Micheli LJ, Nitka M, Rowland TW. Youth
resistance training: Updated position statement paper from the National Strength and
Conditioning Association. J Strength Cond Res 2009; 23: S60–S79.
Faigenbaum A, Mediate P. The effects of medicine ball training on physical fitness in high
school physical education students. Phys Educ 2006; 63: 160–167.
Faigenbaum A, Milliken L, Moulton L, Westcott W. Early muscular fitness adaptations in
children in response to two different resistance training regimens. Pediatr Exerc Sci
2005; 17: 237–248.
García-Pallarés J, Izquierdo M. Strategies to Optimize Concurrent Training of Strength and
Aerobic Fitness for Rowing and Canoeing. Sports Med 2011; 41: 329–343.

References
108
García-Pallarés J, Sánchez-Medina L, Carrasco L, Diaz A, Izquierdo M. Endurance and
neuromuscular changes in world-class level kayakers during a periodized training
cycle. Eur J Appl Physiol 2009; 106: 629–638.
González-Badillo JJ, Gorostiaga EM, Arellano R, Izquierdo M. Moderate resistance training
volume produces more favorable strength gains than high or low volumes. J Strength
Cond Res 2005; 19: 689–697.
Harriss DJ, Atkinson G. Update–Ethical standards in sport and exercise science research. Int J
Sports Med 2011; 32: 819–821.
Hawley JA. Molecular responses to strength and endurance training: are they incompatible?
Appl Physiol Nutr Metab 2009; 34: 355–361.
Hickson RC. Interference of strength development by simultaneously training strength and
endurance. Eur J Appl Physiol 1980; 45: 255–263.
Izquierdo-Gabarren M, Exposito R, Garcia-Pallarés J, Sánchez-Medina L, De Villareal ES,
Izquierdo M. Concurrent endurance and strength training not to failure optimizes
performance gains. Med Sci Sports Exerc 2010; 42: 1191–1199.
Izquierdo M, Häkkinen K, Ibánez J, Kraemer WJ, Gorostiaga EM. Effects of combined
resistance and cardiovascular training on strength, power, muscle cross-sectional
area, and endurance markers in middle-aged men. Eur J Appl Physiol 2005; 94: 70–75.
Kraemer W, Fry A, Frykman P, Conroy B, Hoffman J. Resistance training and youth. Pediatr
Exerc Sci 1989; 1: 336–350.
Kraemer WJ, Ratamess NA. Fundamentals of resistance training: progression and exercise
prescription. Med Sci Sports Exerc 2004; 36: 674–688.
Kvaavik E, Klepp KI, Tell GS, Meyer HE, Batty, GD. Physical fitness and physical activity at age
13 years as predictors of cardiovascular disease risk factors at ages 15, 25, 33, and 40
years: extended follow-up of the Oslo Youth Study. Pediatrics 2009; 123: e80–e86.
Léger LA, Mercier D, Gadoury C, Lambert J. The multistage 20 meter shuttle run test for
aerobic fitness. J Sports Sci 1988; 6: 93–101.
Lillegard WA, Brown EW, Wilson DJ, Henderson R, Lewis E. Efficacy of strength training in
prepubescent to early postpubescent males and females: effects of gender and
maturity. Pediatr Rehabil 1997; 1: 147–157.
Linthorne, NP. Analysis of standing vertical jumps using a force platform. Am J Physics 2001;
11: 1198–1204.
References
109
Marfell-Jones M, Olds T, Stewart A, Carter L. International standards for anthropometric
assessment. Potchefstroom, South Africa: ISAK, 2006.
Marques MC, Zajac A, Pereira A, Costa AM. Strength training and detraining in different
populations: Case studies. J Hum Kinet 2011; (Special Issue): 7–14.
Matton L, Duvigneeaud N, Wijndaele K, Philippaerts R, Duquet W, Beunen G, Claessens A,
Thomis M, Lefevre J. Secular trends in anthropometric characteristics, physical
fitness, physical activity and biological maturation in flemish adolescents between
1969 and 2005. Am J Hum Biol 2007; 19: 326–624.
Mayhew JL, Ware JS, Johns RA, Bemben MG. Changes in upper body power following heavy-
resistance strength training in college men. Int J Sports Med 1997; 18: 516–520.
Obert P, Mandigouts S, Nottin S, Vinet A, N'Guyen LD, Lecoq AM. Cardiovascular responses to
endurance training in children: effect of gender. Eur J Clin Invest 2003; 33: 199–208.
Ortega FB, Tresaco B, Ruiz JR, Moreno LA, Matillas M, Mesa JL, Warnberg J, Bueno M,
Tercedor P, Gutiérrez A, Castillo MJ. Cardiorespiratory fitness and sedentary activities
are associated with adiposity in adolescents. Obesity 2007; 15: 1589–1599.
Ramsay J, Blimkie C, Smith K, Garner S, Macdougall J, Sale D. Strength training effects in
prepubescent boys. Med Sci Sports Exerc 1990; 22: 605–614.
Rowland TW, Boyajian A. Aerobic Response to Endurance Exercise Training in Children.
Pediatrics 1995; 96: 654–658.
Sale DG, McDougall J.D, Jacobs I, Garner S. Interaction between concurrent strength and
endurance training. J Appl Physiol 1990; 68: 260–270.
Santos E, Janeira, M. The effects of plyometric training followed by detraining and reduced
training periods on explosive strength in adolescent male basketball players. J
Strength Cond Res 2011; 25: 441–452.
Santos A, Marinho DA, Costa AM, Izquierdo M, Marques MC. The Effects of concurrent
resistance and endurance training follow a specific detraining cycle in young school
girls. J Hum Kinet 2011; Special Issue: 93–103.
Santos A, Marinho DA, Costa AM, Izquierdo M, Marques MC. The effects of concurrent
resistance and endurance training follow a detraining period in elementary school
students. J Strength Cond Res 2012; 26: 1708–1716.
Siegel JA, Camaione DN, Manfredi TG. The effects of upper body resistance training on
prepubescent children. Pediatr Exerc Sci 1989; 1: 145–154.

References
110
Stenevi-Lundgren S, Daly RM, Lindén C, Gärdsell P, Karlsson MK. Effects of a daily school
based physical activity intervention program on muscle development in prepubertal
girls. Eur J Appl Physiol 2009; 105: 533–541.
Taanila H, Hemminki A, Suni J, Pihlajamäki H, Parkkari J. Low physical fitness is a strong
predictor of health problems among young men: a follow-up study of 1411 male
conscripts. BMC Public Health 2011; 11: 590.
Vinet A, Mandigout S, Nottin S, Nguyen L, Lecoq N, Courteix D, Obert P. Influence of Body
Composition, Hemoglobin Concentration, and Cardiac Size and Function of Gender
Differences in Maximal Oxygen Uptake in Prepubertal Children. Chest 2003; 124:
1494–1499.
Chapter 4
Allard P, Nault M, Hinse S, Leblawc R, Labelle H. Relationship between morphologic
somatotypes and standing posture equilibrium. Ann Hum Biol 2001; 28: 624-633.
Andersen LB, Haraldsdottir J. Changes in physical activity, maximal isometric strength and
maximal oxygen uptake from late teenage to adulthood. An 8-year follow-up study of
adolescents in Denmark. Scand J Med Sci Sports 1994; 4: 19-25.
Anderssen SA, Cooper AR, Riddoch C, Sardinha LB, Harro M, Brage S, Andersen LB. Low
cardiorespiratory fitness is a strong predictor for clustering of cardiovascular disease
risk factors in children independent of country, age and sex. Eur J Cardiovasc Prev
Rehabil 2007; 14: 526–531.
Branta C, Haubenstricker J, Seefeldt V. Age changes in motor skills during childhood and
adolescence. Exercise Sport Sci Rev 1984; 12: 467-520.
Castro-Piñero J, González-Montesinos J, Mora J, Keating X, Girela-Rejón M, Sjöström, M, Ruiz
J. Percentile values for muscular strength field tests in children aged 6 to 17 years:
influence of weight status. J Strength Cond Res 2009; 23: 2295-2310.
Cepero M, López R, Suárez-Llorca C, Andreucabrera E, Rojas F. Fitness test profiles in
children aged 8-12 years old in Granada (Spain). J Hum Sport Exerc 2011; 6: 135-146.
Chaouachi M, Chaouachi A, Chamari K, Chtara M, Feki Y, Amri M, Trudeau F. Effects of
dominant somatotype on aerobic capacity trainability. Br J Sports Med 2005; 39: 954-
959.
Coffey VG, Hawley JA. The molecular bases of training adaptation. Sports Med 2007; 37: 737-
63.

References
111
D`Hont E, Deforche B, Bourdeaudhuij I, Lenoir M. Relationship between motor skill and Body
Mass Index in 5-to 10-year-old children. Adapt Phys Act Q 2009; 26: 21-37.
Dorgo S, King GA, Candelaria NG, Bader JO, Brickey GD, Adams CE. Effects of manual
resistance training on fitness in adolescents. J Strength Cond Res 2009; 23: 2287-
2294.
Dumith S, Ramires V, Souza M, Moraes D, Petry F, Oliveira E, Ramires S, Hallal P.
Overweight/Obesity and Physical Fitness Among Children and Adolescents. J Phys Act
Health 2010; 7: 641-648.
Faigenbaum AD, Kraemer WJ, Blimkie CJR, Jeffreys I, Micheli LJ, Nitka M, Rowland, TW.
Youth resistance training: Updated position statement paper from the National
Strength and Conditioning Association. J Strength Cond Res 2009; 23: S60-S79.
Fogelholm M, Stigman S, Huisman T, Metsämuuronen J. Physical fitness in adolescents with
normal weight and overweight. Scand J Med Sci Sports 2008; 18: 162-170.
García-Pallarés J, Izquierdo M. Strategies to Optimize Concurrent Training of Strength and
Aerobic Fitness for Rowing and Canoeing. Sports Med 2011; 41: 329-343.
García-Pallarés J, Sánchez-Medina L, Carrasco L, Diaz A, Izquierdo M. Endurance and
neuromuscular changes in world-class level kayakers during a periodized training
cycle. Eur J Appl Physiol 2009; 106: 629-638.
González-Badillo JJ, Gorostiaga EM, Arellano R, Izquierdo M. Moderate resistance training
volume produces more favorable strength gains than high or low volumes. J Strength
Cond Res 2005; 19: 689-97.
Haff, GG. Roundtable discussion: Youth resistance training. Strength Cond J 2003; 25: 49-64.
Hands B, Larkin D, Parker H, Straker L, Perry M. The relationship among physical activity,
motor competence and health- related fitness in 14-year-old adolescents. Scand J
Med Sci Sports 2009; 19: 655-663.
Hawley JA. Molecular responses to strength and endurance training: are they incompatible?
Appl Physiol Nutr Metab 2009; 34: 355-361.
Jakšić D, Cvetković M. Neural network analysis of somatotype differences among males
related to the manifestation of motor abilities. Acta Kinesiologica 2009; 3: 107-113.
Kato E, Oda T, Chino K, Kurihara T, Nagayoshi T, Fukunaga T, Yasuo Kawakami Y.
Musculotendinous Factors Influencing Difference in Ankle Joint Flexibility between
Women and Men. Int J Sport Health Sci 2005; 3: 218-225.

References
112
Lämmle L, Tittlbach S, Oberger J, Worth A, Bös K. A two-level model of motor performance
Ability. J Exerc Sci Fit 2010; 8: 41-49.
Lennox A, Pienaar A, Wilders C. Physical fitness and the physical activity status of 15-year-old
adolescents in a semi-urban community. S Afr J Res Sport Phys Educ Recreation 2008;
30: 59-73.
Little T, Williams AG. Specificity of acceleration, maximum speed, and agility in professional
soccer players. J Strength Cond Res 2005; 19: 76-78.
Malina R, Bouchard C. Growth maturation and physical activity. Champaign, Illinois: Human
Kinetics, 1991.
Malina R, Bouchard C, Bar-Or O. Growth, maturation and physical activity. Champaign,
Illinois: Human Kinetics, 2004.
Matton L, Duvigneeaud N, Wijndaele K, Philippaerts R, Duquet W, Beunen G, Claessens A,
Thomis M, Lefevre J. Secular trends in anthropometric characteristics, physical
fitness, physical activity and biological maturation in flemish adolescents between
1969 and 2005. Am J Hum Biol 2007; 19: 326-624.
Monyeki MA, Koppes LJ, Kemper HG, Monyeki KD, Toriola AL, Pienaar AE, Twisk, JW. Body
composition and physical fitness of undernourished South African rural primary school
children. Eur J Clin Nutr 2005; 59:877-883.
Norman A, Drinkard B, McDuffie J, Ghorbani S, Yanoff L, Yanovski J. Influence of excess
adiposity on exercise fitness and performance in overweight children and adolescents.
Pediatrics 2005; 115: 690-696.
Ortega B, Tresaco B, Ruiz J, Moreno L, Matillas M, Mesa J, Warnberg J, Bueno M, Tercedor P,
Gutiérrez A, Castillo M. Cardiorespiratory fitness and sedentary activities are
associated with adiposity in adolescents. Obesity 2007; 15: 1589-1599.
Ozmun J, Mikesky A, Surburg P. Neuromuscular adaptations following prepubescent strength
training. Med Sci Sports Exerc 1994; 26: 510-514.
Ramsay J, Blimkie C, Smith K, Garner S, MacDougall J, Sale D. Strength training effects in
prepubescent boys. Med Sci Sports Exerc 1990; 22: 605-614.
Roetert, EP. The lack of childhood activity in the United States. Strength Cond J 2004; 26: 22-
23.
Sandbakk Ø, Welde B, Holmberg HC. Endurance training and sprint performance in elite junior
cross-country skiers. J Strength Cond Res 2011; 25: 1299-1305.
References
113
Santos E, Janeira, M. The effects of plyometric training followed by detraining and reduced
training periods on explosive strength in adolescent male basketball players. J
Strength Cond Res 2011; 25: 441-452.
Santos A, Marinho DA, Costa AM, Izquierdo M, Marques MC. The effects of concurrent
resistance and endurance training follow a detraining period in elementary school
students. J Strength Cond Res 2012; 26: 1708-1716
Shukla M, Venugopal R, Mitra M. A cross sectional study of body composition somatotype and
motor quality of rural and urban boys of Chhattisgarh. Int J Fitness 2009; 5: 1-7.
Suchomel A. Relation between anthropometric somatotype and motor performance in
prepubescent and pubescent Czech. Anthropologie 2002; 40: 193-201.
Thomas JR, French KE. Gender differences across age in motor performance: A meta-
analyses. Psychol Bull 1985; 98: 260-282.
Tomkinson GR, Olds TS, Kang SJ, Kim DY. Secular trends in the aerobic fitness test
performance and body mass index of Korean children and adolescents (1968-2000). Int
J Sports Med 2007; 28: 314-320.
Tovar G, Poveda J, Pinilla M, Lobelo F. Relationship between overweight, physical activity
and physical fitness in school-aged boys in Bogotá Colombia. Arch Latinoam Nutr
2008; 58: 265-273.
Wells JC, Fewtrell MS, Williams JE, Haroun D, Lawson MS, Cole TJ. Body composition in
normal weight, overweight and obese children: matched case-control analyses of
total and regional tissue masses, and body composition trends in relation to relative
weight. Int J Obes (Lond) 2006; 30: 1506-1513.
Xianwen S, Ailing L, Yanping L, Xiaoqi H, Lin D, Jun M, Guifa X, Ying L, Hongwei G, Guansheng
M. The association of weight status with physical fitness among Chinese children. Int J
Pediatr 2010; 1: 1-6. doi:10.1155/2012/943653