The Determinants of Stock Returns in the Emerging Market ...

MK012/1305
DETERMINANTS OF MOBILE TOURISM:
AN EMERGING MARKET PERSPECTIVE
BY
CHIN YUK YOON
LIEW SING HANG
NG KAR KENG
PHOON JI HOE
POH SUE ANNE
A research project submitted in partial fulfillment of the
requirement for the degree of
BACHELOR OF MARKETING (HONS)
UNIVERSITI TUNKU ABDUL RAHMAN
FACULTY OF BUSINESS AND FINANCE
DEPARTMENT OF MARKETING
APRIL 2014

Determinants of Mobile Tourism: An Emerging Market Perspective
ii
Copyright @ 2014 ALL RIGHTS RESERVED. No part of this paper may be reproduced, stored in a retrieval system, or transmitted in any form or by any means, graphic, electronic, mechanical, photocopying, recording, scanning, or otherwise, without the prior consent of the authors.

Determinants of Mobile Tourism: An Emerging Market Perspective
iii
DECLARATION
We hereby declare that:
(1) This undergraduate research project is the end result of our own work and
that due acknowledgement has been given in the references to ALL
sources of information be they printed, electronic, or personal.
(2) No portion of this research project has been submitted in support of any
application for any other degree or qualification of this or any other
university, or other institutes of learning.
(3) Equal contribution has been made by each group member in completing
the research project.
(4) The word count of this research report is 10850 words.
Name of Student: Student ID: Signature:
1. CHIN YUK YOON 10ABB04078 _______________
2. LIEW SING HANG 10ABB03197 _______________
3. NG KAR KENG 10ABB03698 _______________
4. PHOON JI HOE 10ABB03748 _______________
5. POH SUE ANNE 10ABB04075 _______________
Date: __________________

Determinants of Mobile Tourism: An Emerging Market Perspective
iv
ACKNOWLEDGEMENT
Special thanks to those who make this research project possible. We would like to
acknowledge the contribution of a number of people. This research study would
not come to a success without their guidance, assistance.
First and foremost, we would like to extend our heartfelt appreciation to our
research supervisor, Mr. Garry Tan Wei Han, for his great support and assistance
throughout the way in completing the research. His precious time, efforts, and
patience on guiding us throughout the process have been very helpful. He has
enlighten us a lot with his insightful point of view, opinions and even sharing his
personal experience and knowledge on the aspect of research along the way of
completing the research.
Next, we would like to take this opportunity to thank Universiti Tunku Abdul
Rahman (UTAR) which has provided us rich research databases that ease us in
gathering fruitful information.
Thirdly, we would like to thank all the respondents who willing to spare their time
and efforts by participating in our survey. Throughout the participating, valuable
opinions and knowledge were gained to improve our research study. Their
feedbacks are our backbone for the research study to come to a success.
Last but not least, we would also take this opportunity to thank to all our group
members in contributing their ideas, effort, and time as well as being cooperative
and worked hard to complete this Final Year Project.
To all of you, who helped us in a way or another, we are truly grateful and thank
you again.

Determinants of Mobile Tourism: An Emerging Market Perspective
v
DEDICATION
We would like to dedicate this research mainly to our supervisor, Mr. Garry Tan
Wei Han, who provides guidance, motivation, assistance, opinions, and useful
experience to us throughout the way of completing this research. We deeply
appreciate his contribution and hard work.
This dissertation is also dedicated to our family and friends for their supports and
encouragements. Thanks for their understanding and patience that helped us a lot
throughout the process of completing the research.

Determinants of Mobile Tourism: An Emerging Market Perspective
vi
TABLE OF CONTENTS
Page
Copyright……………………………………………………………………….....ii
Declaration……………………………………………………………..…………iii
Acknowledgement………………………………………………………………...iv
Dedication…………………………………………………………………...…….v
Table of Contents..………………………………………………………………..vi
List of Tables…..………………………………………………………………….xi
List of Figures……………………………………………………………………xii
List of Abbreviations...………………………………………………………….xiii
List of Appendices…………………………………………………...………….xiv
Abstract………………………………………………………….……………….xv
CHAPTER 1 INTRODUCTION………………………………………………….1
1.0 Introduction………………………………………………………..1
1.1 Research Background……………………………………….……..1
1.2 Problem Statement………………………………………...............2
1.3 Research Objectives……………………………………………….4
1.3.1 General Objective………………….………………………...4
1.3.2 Specific Objectives………………………….……………….5
1.4 Research Questions………………………………………………..5
1.5 Hypothesis of the Study…………………………………………...6
1.6 Significance of the Study………………………………………….7
1.7 Conclusion………………………………………………………....7
CHAPTER 2 LITERATURE REVIEW….……………….……………………...8

Determinants of Mobile Tourism: An Emerging Market Perspective
vii
2.0 Introduction………………………………………………………..8
2.1 Review of Literature………………………………….……………8
2.1.1 Mobile Tourism…………………………………………....8
2.2 Review of Relevant Theoretical Frameworks……………………..9
2.2.1 Theory of Reasoned Action (TRA)…………….………….9
2.2.2 Technology Acceptance Model (TAM)………………….10
2.2.3 Theory of Planned Behavior (TPB)……………………...10
2.2.4 Diffusion of Innovation Theory (DOI)……………….…..11
2.2.5 Unified Theory of Acceptance and Use of Technology
(UTAUT)……………….………………………………...12
2.2.6 Extended UTAUT Model……………….………………..13
2.3 Proposed Conceptual Framework………………………………..14
2.4 Hypotheses Development………………………….……………..15
2.4.1 Performance Expectancy (PE)……………………...…....15
2.4.2 Effort Expectancy (EE)…………………………………..16
2.4.3 Social Influence (SI)……………………….……………..16
2.4.4 Facilitating Condition…………………………………….17
2.4.5 Wireless Trust (WT)…………………………….………..18
2.4.6 Perceived Risk………………………………….………...19
CHAPTER 3 RESEARCH METHODOLOGY………….………………………21
3.0 Introduction………………………………………………………21
3.1 Research Design………………………………………………….21
3.1.1 Quantitative Research Design……………………………21
3.1.2 Descriptive Research……………………….…………….21
3.2 Data Collection Methods………………………………….……...22
3.2.1 Primary Data……………………………………………..22

Determinants of Mobile Tourism: An Emerging Market Perspective
viii
3.2.2 Secondary Data…………………………………………..22
3.3 Sampling Design…………………………………………………23
3.3.1 Target Population…………………………………...........23
3.3.2 Sampling Location……………………………………….23
3.3.3 Sampling Elements……………………….………………24
3.3.4 Sampling Techniques…………………………………….24
3.3.5 Sample Size………………………………………………24
3.4 Research Instrument……………………………………………...25
3.4.1 Purpose of Using Questionnaire……….…………………25
3.4.2 Questionnaire…………………………………………….25
3.4.3 Pilot Test…………………………………………………26
3.4.4 Data Collection…………………….……………………..26
3.5 Constructs Measurement…………………………………………27
3.5.1 Scale Management……………………………………….27
3.5.1.1 Nominal Scale……………………………………27
3.5.1.2 Ordinal Scale……………………………………..27
3.5.1.3 Likert Scale………………………………………28
3.6 Data Processing…………………………………………………..29
3.6.1 Data Checking……………………………………………29
3.6.2 Data Editing…………………….………………………...29
3.6.3 Data Coding……………………….……………………...29
3.6.4 Data Transcription………….…………………………….30
3.6.5 Data Cleaning…………………………………………….30
3.7 Data Analysis…………………………………………………….30
3.7.1 Descriptive Analysis……………………………………..31

Determinants of Mobile Tourism: An Emerging Market Perspective
ix
3.7.1.1 Frequency Distribution……….…………………..31
3.7.2 Scale Measurement………………………………………31
3.7.2.1 Reliability Test…………………………………...31
3.7.3 Inferential Analysis………………………………………32
3.7.3.1 Validity Test……………………………………...32
3.7.3.2 Multiple Regressions…………….……………….33
3.8 Conclusion………………………………….…………………….34
CHAPTER 4: DATA ANALYSIS………………….……………………………35
4.0 Introduction………………………………………………………35
4.1 Descriptive Analysis……………………………………………..35
4.1.1 Respondent’s Demographic Profile……....……………...35
4.1.1.1 Gender……………………………………35
4.1.1.2 Age……………………………………….36
4.1.1.3 Marital Status…………………………….36
4.1.1.4 Academic Qualification…………………..37
4.1.1.5 Respondent’s Industry…….……………...37
4.1.1.6 Internet Accessibility………….………….38
4.1.1.7 Credit or Debit Card……………………...39
4.1.1.8 Shop using Mobile Devices……….……...39
4.1.1.9 Mobile Devices…………………………..40
4.1.1.10 Monthly Income………………………….41
4.1.1.11 Shopping Location……………………….41
4.2 Scale Measurement………………………………………………42
4.2.1 Internal Reliability Analysis…….………………………..42
4.3 Inferential Analysis………………………………………………43

Determinants of Mobile Tourism: An Emerging Market Perspective
x
4.3.1 Pearson Correlation Analysis…………………………….43
4.3.1.1 Test of significant……………….………..44
4.3.2 Multiple Regression Analysis………………….………...46
4.3.2.1 Strength of Relationship………….………46
4.4 Conclusion……………………………….……………………….47
CHAPTER 5: DISCUSSION, CONCLUSION AND CONCLUSION….………48
5.0 Introduction………………………………………………………48
5.1 Summary of Statistical Analysis…………………………………48
5.1.1 Descriptive Analysis…………………………………..…48
5.1.1.1 Respondent’s Demographic Profile…...…48
5.1.2 Scale Measurement………………………………………49
5.1.2.1 Reliability Test…………………………...49
5.1.3 Inferential Analysis………………………………………50
5.1.3.1 Pearson Correlation Coefficient………….50
5.1.3.2 Multiple Regression Analysis……………50
5.2 Discussion of Major Findings……………………………………51
5.3 Implication of Study……………………………….……………..54
5.3.1 Managerial Implication…………………………………..54
5.3.2 Theoretical Implication…………………………………..55
5.4 Limitation of Study and Directions for Future Study……………55
5.5 Conclusion………………………………………………………..56
References………………………………………………………………………..57
Appendices……………………………………………………………………….71
Determinants of Mobile Tourism: An Emerging Market Perspective
xi
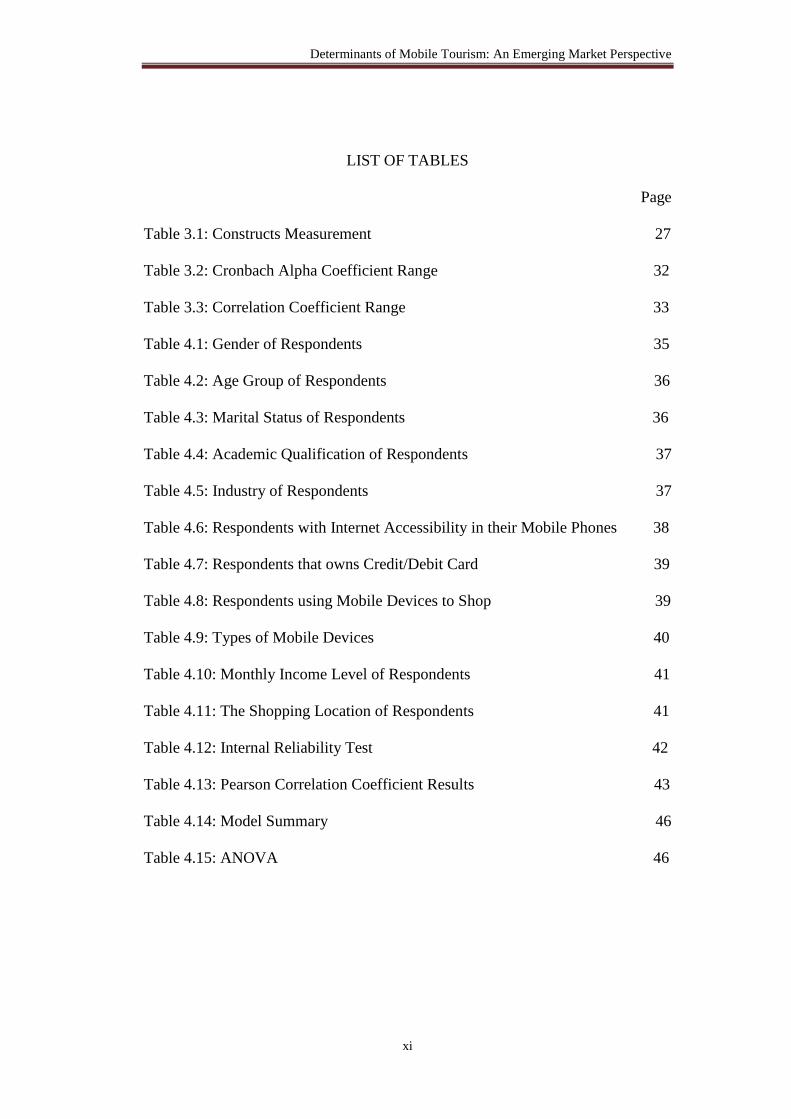
LIST OF TABLES
Page
Table 3.1: Constructs Measurement 27
Table 3.2: Cronbach Alpha Coefficient Range 32
Table 3.3: Correlation Coefficient Range 33
Table 4.1: Gender of Respondents 35
Table 4.2: Age Group of Respondents 36
Table 4.3: Marital Status of Respondents 36
Table 4.4: Academic Qualification of Respondents 37
Table 4.5: Industry of Respondents 37
Table 4.6: Respondents with Internet Accessibility in their Mobile Phones 38
Table 4.7: Respondents that owns Credit/Debit Card 39
Table 4.8: Respondents using Mobile Devices to Shop 39
Table 4.9: Types of Mobile Devices 40
Table 4.10: Monthly Income Level of Respondents 41
Table 4.11: The Shopping Location of Respondents 41
Table 4.12: Internal Reliability Test 42
Table 4.13: Pearson Correlation Coefficient Results 43
Table 4.14: Model Summary 46
Table 4.15: ANOVA 46

Determinants of Mobile Tourism: An Emerging Market Perspective
xii
LIST OF FIGURES
Page
Figure 2.1: UTAUT Framework 13
Figure 2.2: Proposed Conceptual Framework - Extended UTAUT 14

Determinants of Mobile Tourism: An Emerging Market Perspective
xiii
LIST OF APPENDICES
Page
Appendix 1.1: MCMC’s Handphone Users Survey 2012…………………….….71
Appendix 1.2: MCMC Report on Mobile Penetration Rate in each State……….72
Appendix 1.3: MCMC Report on Mobile Apps Downloaded…………………...72
Appendix 3.1: Questionnaire……………………………………………………..73
Appendix 4.1: Demographic Analysis…………………………………………...77
Appendix 4.2: Internal Reliability Test…………………………………………..84
Appendix 4.3: Pearson’s Correlation Test and Multiple Regression Test……….86

Determinants of Mobile Tourism: An Emerging Market Perspective
xiv
LIST OF ABBREVIATIONS
MCMC Malaysian Communications and Multimedia Commission
Gen Y Generation Y
TRA Theory of Reasoned Action
TAM Technology Acceptance Model
TPB Theory of Planned Behavior
DOI Diffusion of Innovation Theory
UTAUT Unified Theory of Acceptance and Use of Technology
PE Performance Expectancy
EE Effort Expectancy
SI Social Influence
FC Facilitating Condition
WT Wireless Trust
PR Perceived Risk

Determinants of Mobile Tourism: An Emerging Market Perspective
xv
ABSTRACT
Nowadays, mobile devices are commonly found among Generation Y’s consumer
and the number of users is growing rapidly along with emergence of smart phone.
However, m-commerce in Malaysia is still at its infancy stage as compared to
other developed countries. The purpose of this study is to identify the factors
affecting the adoption of mobile device as a medium of online shopping that
constitute to the consumption of tourism products among Generation Y consumers
in Malaysia, in short, mobile tourism. Therefore, the study develops a model to
predict on Generation Y’s behavioral intention to adopt mobile tourism by
extending Perceived Risk and Wireless Trust with Unified Theory of Acceptance
and Use of Technology model. In order to test the validity of the model, Statistical
Analysis System (SAS) is used to analyze the effect between performance
expectancy, effort expectancy, facilitating condition, social influence, wireless
trust, and perceived risk towards behavioral intention. Performance expectancy,
effort expectancy, facilitating condition, social influence, and wireless trust is
significant to have positive relationship towards Generation Y behavioral
intention to adopt mobile tourism, whereas, perceived risk is significant to have
negative relationship towards Generation Y behavioral intention to adopt mobile
tourism. The research findings is believe to deliver invaluable theoretical and
managerial implication that will contribute to the decision making process by tour
agencies, software developers, government, and etc. to formulate their business
strategies more accurately in developing mobile tourism platform.

Determinants of Mobile Tourism: An Emerging Market Perspective
1
CHAPTER 1: INTRODUCTION
1.0 Introduction
Chapter one provides the overview of the research. This chapter covers research
background, problem statement, research objectives, hypotheses of study and
significance of study.
1.1 Research Background
According to United Nation World Tourism Organization, Malaysia was
nominated as one of the top 10 most-visited countries in the world with the record
of 25 millions of visitors in year 2012 and earned about 20.25 billion USD
(RM65.44 billion) (The Star Online, 2013). The total visitors to Malaysia show
an increase of 3.3 percent from January to September in both year 2012 and 2013
with 18,153,643 and 18,756,476 respectively. Even though the result does not
show the statistic during the peak period (October to December) yet the visitors
that visited Malaysia has increased in year 2013 as compared to year 2012
(Tourism Malaysia, 2013). According to our Prime Minister Datuk Seri Najib Tun
Razak, 26.8 million tourists will be attracted to Malaysia in 2013/2014 as it is the
Visit Malaysia Year (New Straits Times, 2012).
With the emergence of mobile and wireless networks, it has created a new
platform for business to exchange product and service known as mobile
commerce (m-commerce). Unlike e-commerce, m-commerce connects wirelessly
in a mobile environment using handheld mobile devices. M-commerce was
viewed as the use of wireless technology, usually mobile Internet and handheld
mobile devices, for transaction processing, information retrieval and user task
performance in consumer, business-to-business (B2B) and intra-enterprise
communication (Chan & Fang, 2001; Kannan, Chang, & Whinston, 2001;
Varshney & Vetter, 2001).

Determinants of Mobile Tourism: An Emerging Market Perspective
2
In recent years, statistics from Malaysian Communications and Multimedia
Commission (MCMC) (2010) showed that there are more than 33,106,000 mobile
phones subscribers in Malaysia with penetration rate of 116.6%. However, the
hand phone users survey (2010) conducted by the MCMC revealed that only
39.9% of mobile phone users are aware of m-commerce and only 17.9% of these
users purchased products and services via mobile phones. Furthermore, MCMC
hand phone users survey report (2012) revealed that there are as much as 68.8% of
smartphones users accessed the Internet via their devices, indicating Malaysian
are gradually moving towards mobile platform.
It is also undeniable that mobile applications have brought smartphone, tablet and
other portable devices to a whole new level in term of functionality. According to
Wang, Liao and Yang (2013), mobile application is a software application
designed to run on mobile devices. This mobile technology opens up a new
opportunity to mobile market in replacing the traditional business model in the
tourism industry because mobile apps help to connect users to Internet services
via their portable devices more conveniently than ever before.
M-commerce in Malaysia is still at infancy stage as compared to other developed
countries such as South Korea and Japan (Wong & Hiew, 2005) and limited
research exists on consumers’ behavioral intention to adopt mobile tourism in
Malaysia. However, great potential exists in mobile tourism due to the statistics
reported by Nielsen Digital Consumer Study 2011. The report revealed that there
is an increase mobile shopping spending from RM 101 million in 2010 to RM 467
million in 2011, and predicted that mobile commerce will be valued at RM 3.43
billion by the year 2015 (Mobile88.com, 2012).
1.2 Problem Statement
Although the emerging of technology helps to boost tourists’ experience during
their vacation by using mobile service, yet we found that Generation Y (Gen Y) in

Determinants of Mobile Tourism: An Emerging Market Perspective
3
Malaysia are still not familiarize with the adoption of mobile tourism in Malaysia
based on the MCMC report 2010.
Study showed that there has been a considerable growth in the adoption of mobile
devices in m-commerce and mobile tourism. M-commerce tends to provide great
flexibility in tourism industry for both travelers as well as suppliers. For travelers,
they can access the web, news updates and conduct transactions using their mobile
devices. From supplier’s point of view, promotional messages can be amended
easier and faster as compared to the use of traditional media (Lee & Mills, 2010).
Unlike other industries which regard m-commerce as an added convenience to
customers, tourism industry regard m-commerce as an essential part of their
customers’ travel experiences (Eriksson, 2002). The emergence of innovative
mobile devices such as smartphones and Tablet PCs has opened up new ways of
communication and non-location based access to information (Lee & Mills,
2010).
Recent studies also revealed that mobile phones influenced every stage in
travelers’ behavior, from searching information (Rasinger et al., 2007) to
purchasing (Riebeck et al., 2008) and post purchase evaluation (Wang et al.,
2011) as well as travel aspects such as providing directions, public transportation
navigation and air travel (Hopken et al., 2010). Additionally, mobile tourist
application such as AirAsia, MHmobile, Agoda, and Expedia was developed to
assist tourist by providing them with information and services given his goal at
that moment. Such findings imply that travelers are always looking for interesting,
new alternatives to carry out their travel plans.
The rise of mobile subscribers, internet usage and people’s zeal on tourism
industry can benefit the mobile tourism in Malaysia. However, the insecurities of
users and risk correlating during the process of mobile financial transactions such
as software failure, and input mistakes, that caused them to barely trust and
confidence on purchasing via new technology because of the fear of outflow on
their personal privacy information and were de-motivated (Tai, 2013). The
advancement of mobile and other portable devices is clearly becoming more and
more advanced.

Determinants of Mobile Tourism: An Emerging Market Perspective
4
However, commercial technologies in this respective area have gained only a
limited success. The network connectivity influences the adoption of mobile
tourism because mobile shopping requires high 3G connection that enables
shoppers to purchase tourism products online (Fort, 2013). Shoppers are unable to
adopt mobile tourism without a proper network connectivity infrastructure.
Therefore, mobile service providers have to look for ways to upgrade the
infrastructures and provide wider coverage (Haque, 2004).
The lack of adoption towards mobile tourism in Malaysia may trigger the
country’s economy in future. As tourism industry is the third contributor after
manufacturing and palm oil industry (New Straits Times, 2012). Hence, the
purpose of this study is about developing a conceptual framework that explain and
predict the core determinants that influence mobile tourism adoption in Malaysia.
The research that we conducted focuses on generation Y. This is further supported
by the statistics that revealed Malaysia has the youngest mobile internet user base
in Southeast Asia with 64% of users ranging from the age of 18 to 35 (Mobile
Marketing Association, 2013).
1.3 Research Objectives
Research objective provides a clear path and focus for researchers.
1.3.1 General Objective
The main focus of this research is to investigate the determinants that
influence Gen Y’s behavioral intention towards mobile tourism adoption
in Malaysia.

Determinants of Mobile Tourism: An Emerging Market Perspective
5
1.3.2 Specific Objectives
The factors examined in this research are performance expectancy, effort
expectancy, social influence, facilitating condition, wireless trust and
perceived risk.
The objectives of our research are as follows:
1. To examine the relationship between performance expectancy and
Gen Y’s behavioral intention towards adopting mobile tourism.
2. To examine the relationship between effort expectancy and Gen Y’s
behavioral intention towards adopting mobile tourism.
3. To examine the relationship between social influence and Gen Y’s
behavioral intention towards adopting mobile tourism.
4. To examine the relationship between facilitating condition and Gen
Y’s behavioral intention towards adopting mobile tourism.
5. To examine the relationship between wireless trust and Gen Y’s
behavioral intention towards adopting mobile tourism.
6. To examine the relationship between perceived risk and Gen Y’s
behavioral intention towards adopting mobile tourism.
1.4 Research Questions
Based on the objectives of our study, research questions that are need to be
answered are as follows:
1. Does performance expectancy affect Gen Y’s behavioral intention
towards adopting mobile tourism?
2. Does effort expectancy affect Gen Y’s behavioral intention
towards adopting mobile tourism?
3. Does social influence affect Gen Y’s behavioral intention towards

Determinants of Mobile Tourism: An Emerging Market Perspective
6
adopting mobile tourism?
4. Does facilitating condition affect Gen Y’s behavioral intention
towards adopting mobile tourism?
5. Does affect wireless trust Gen Y’s behavioral intention towards
adopting mobile tourism?
6. Does perceived risk affect Gen Y’s behavioral intention towards
adopting mobile tourism?
1.5 Hypothesis of the Study
Findings from past researches along with the objectives of the study lead to the
development of the following hypotheses.
H1: There is significant relationship between performance expectancy and
Gen Y’s behavioral intention towards mobile tourism adoption.
H2: There is significant relationship between effort expectancy and Gen Y’s
behavioral intention towards mobile tourism adoption.
H3: There is significant relationship between social influence and Gen Y’s
behavioral intention towards mobile tourism adoption.
H4: There is significant relationship between facilitating condition and Gen
Y’s behavioral intention towards mobile tourism adoption.
H5: There is significant relationship between wireless trust and Gen Y’s
behavioral intention towards mobile tourism adoption.
H6: There is significant relationship between perceived risk and Gen Y’s
behavioral intention towards mobile tourism adoption.

Determinants of Mobile Tourism: An Emerging Market Perspective
7
1.6 Significance of the Study
Mobile commerce is gaining popularity and increasingly becoming an interesting
research topic in tourism industry due to its potentiality in overcoming the barriers
of e-commerce. Thus, the purpose of the study is to serve as a foundation for
Malaysia tourism service provider to gain better insight of the factors influencing
the behavioral intention towards mobile tourism adoption in Malaysia, enabling
them to gather sufficient knowledge and capability to grab the upcoming golden
opportunity.
Understanding the factors that drive Gen Y’s behavioral intention towards mobile
tourism adoption is crucial to business success and longevity. Constructs that has
the greatest influence can act as guidance for tourism-related companies or
Malaysian marketers who wish to build their market share in mobile tourism area.
Simultaneously, this study can help them to understand how those factors are
affecting consumers’ behavioral intention towards adoption mobile tourism.
1.7 Conclusion
In brief, chapter one provides an overview of the study of mobile tourism. It
highlighted some of the main aspects of m-commerce and mobile tourism to better
understand Gen Y’s behavior and acceptance towards new technology innovation.
Further review of relevant studies and past researches will be continued in the
following chapter.

Determinants of Mobile Tourism: An Emerging Market Perspective
8
CHAPTER 2: LITERATURE REVIEW
2.0 Introduction
This chapter starts with a brief review of five related models that have widely
adopted in past studies to predict the behavioral intention towards new
technology. Then, this chapter continues with the six core determinants related to
mobile tourism adoption, performance expectancy, effort expectancy, social
influence, facilitating condition, wireless trust and perceived risk used in proposed
conceptual framework. Lastly, this chapter will be covering all hypotheses that
have been formed to test the relationship of these determinants towards Gen Y’s
intention to adopt mobile tourism.
2.1 Review of Literature
2.1.1 Mobile Tourism
Mobile tourism offered a new trend in the aspect of tourism industry involving
mobile devices such as smartphone, tablet, and personal digital assistants (PDA)
as tourist guide (Kenteris, Gavalas & Economou, 2009). Mobile tourism involves
using mobile devices via wireless network and means of payment to conduct
transaction (Hu & Liu, 2013). Mobile tourism provides convenience to consumer
by launching mobile website which use to cater the unique features and content of
mobile devices rather than simply transferring the websites content into mobile
sites (Hu & Liu, 2013). As an electronic tourist guides, mobile tourism provide
attractive characteristics such as convenience, ubiquity and positioning, users can
access and receive related services and information in their specific location by
employing global positioning system (GPS) technology (Kenteris, Gavalas, &
Economou, 2009; Varshney, 2003). According to Gavalas & Kenteris (2011),

Determinants of Mobile Tourism: An Emerging Market Perspective
9
mobile tourism also help in personalized and consolidated user profiles,
recommended content will be provided to match with the user preferences.
2.2 Review of Relevant Theoretical Frameworks
A number of frameworks that had been employed in the past to explain the
information system usage behavior were being reviewed in our study. The models
include Theory of Reasoned Action (TRA), Technology Acceptance Model
(TAM), Theory of Planned Behavior (TPB), Diffusion of Innovation Theory
(DOI) and United Theory of Acceptance and Use of Technology (UTAUT) so as
to investigate Gen Y’s intention to adopt mobile tourism in Malaysia.
2.2.1 Theory of Reasoned Action (TRA)
According Fishbein and Ajzen (1975), Theory of Reasoned Action (TRA) is a
well-established model that has been widely used to predict and explain human
behavior in various areas. TRA consists of rational, volitional, and systematic
behavior (Fishbein & Ajzen, 1975; Chang, 1998). In terms of behavior, TRA
shows the individual has the control over it (Thompson, Haziris, & Alekos, 1994).
From technology perspective, there is a potential that a person forms an attitude
towards a certain object whether with or without intention. The intention to
behave initially affects one’s actual behavior (Hansen, Jensen, & Solgaard, 2004).
Wu (2003) defined that a person’s behavior subjective norms is as important as
the determinant of intention.
According to Fishbein and Ajzen (1975), TRA developed two key factors that
only emphasize on technology usage. First, attitude towards behavior is defined as
“the degree to which a person trusts that using a particular system would improve
his or her job performance”. Second, subjective norm involved the opinion of
others and source of motivation before using a particular system.

Determinants of Mobile Tourism: An Emerging Market Perspective
10
Behavioral intention are presumed to capture the stimulating factors that influence
a behavior, they act as a indicator of the amount of efforts that people are willing
to exert and try in order to perform a particular behavior.
2.2.2 Technology Acceptance Model (TAM)
TAM was developed from TRA to explain and predict users’ acceptance towards
a wide range of new technology (Fishbein & Ajzen, 1975). It describes how
consumers’ behavior is related with their intentions while performing tasks
(Davis, 1989). TAM helps to explain why a particular technology is accepted or
rejected by users when the technology is first introduced (Wallace & Sheetz,
2014). In TAM, there are two main constructs, which is perceived ease of use
(PEOU) and perceived usefulness (PU). According to Davis (1989), PEOU refer
to “the degree to which users trust that adopting a specific technology would be
easy” and PU defined as “the degree to which a person trusts that using a specific
system would improve the job performance”.
TAM has been widely adopted and served as a major theoretical framework in the
research of information system field such as online shopping (Gefen et al., 2003),
personal computers (Davis, 1989), mobile technology adoption (Kim et al., 2008)
and etc. Taylor and Todd (1955) also found TAM to be able to explain 53 % of
variance in behavioral intention.
2.2.3 Theory of Planned Behavior (TPB)
Theory of Planned Behaviour (TPB) is an enhanced model of TRA by integrating
a new construct, perceived behavioral control (PBC), in which Ajzen (1991)
defined as the ease or difficulty an individual perceived when performing
particular behavior. Ajzen (2010) stated that TPB was developed and designed
based on the assumption of human beings who usually aware of the circumstances
of the information are available and the consequences of their actions. TPB was

Determinants of Mobile Tourism: An Emerging Market Perspective
11
found to be able to predict 44.05% of variance in behavioral intention after the
inclusion of TPB as compared to the initial 37.27% variance in the TRA model
(Hagger, Chatzisarantis, & Biddle, 2002). Additionally, Khalifa and Shen (2008)
also stated that TPB is a model that has been widely used in past studies to explain
IT adoption and m-commerce adoption (Khalifa & Cheng, 2002).
2.2.4 Diffusion of Innovation Theory (DOI)
DOI theory is described as a social process in which an innovation or a new idea
is communicated through channels over a period of time to different parts of
society members (Rogers, 1995). This theory not only focuses on awareness and
knowledge but also on decision making process and attitude change that resulted
in the adoption and process of innovation (Rogers & Singhal, 1996). In DOI, four
main components are identified, that is innovation, communication channels,
social system, and length of time (Rogers, 2003). Adopters are classified into
innovators, early adopters, early majority, late majority, and laggards, and
sometimes including non-adopters.
DOI model comprises of five core constructs to determine the adoption rate of
new technology, which is relative advantage, compatibility, observability,
complexity and trialibilty. Relative advantage is similar to PU as they both refer to
the usefulness of new technology adoption for the sake of performance.
Complexity is similar as PEOU since complex innovation tends to lower PEOU
(Im & Ha, 2012). Innovation and technology must be easy to learn and use in
order to increase the adoption rate of innovation or it will discourage the adoption
of innovation. Rogers (2003) revealed that DOI accounted for 49% to 87% of
variance in adoption.

Determinants of Mobile Tourism: An Emerging Market Perspective
12
2.2.5 Unified Theory of Acceptance and Use of Technology
(UTAUT)
UTAUT is developed based on the combination of eight well-established theories
- i.e TRA, TAM/TAM2, Motivational Model (MM), TPB, Decomposed Theory of
Planned Behavior (DTPB), Model of PC Utilisation (MPCU), Innovation
Diffusion Theory (IDT) and Social Cognitive Theory (SCT) with the aim to
explain and predict behavioral intention to adopt a new technology (Venkatesh et
al., 2003). This model has been proven to be superior as compared to other
predominant models (Venkatesh et al. 2003; Park et al., 2007; Venkatesh &
Zhang, 2010). UTAUT consists of four core determinants that affect behavioral
intention which includes performance expectancy, effort expectancy, social
influence and facilitating condition. Venkatesh et al. (2003) empirically identified
that performance expectancy, effort expectancy and social influence affect the
behavioral intention to use a technology, while facilitating condition and
behavioral intention will have direct influence on the adoption behavior. UTAUT
also has been tested with dependent variable variance of 70%, higher than TAM
and TPB (Min, Ji, & Qu, 2008).
Initially, UTAUT was applied to study technological innovation acceptance in
organization such as e-commerce applications (Sutanonpaiboon & Pearson, 2006).
Later on, Martin and Herrero (2012) further extended the model to study
consumers and private users’ acceptance towards information systems such as
mobile internet adoption by end users (Wang & Wang, 2010). In recent studies,
UTAUT has been widely employed as the base model in m-commerce field such
as mobile learning (Wang, Wu & Wang, 2009), mobile Internet (Wang & Wang,
2010), mobile shopping services adoption (Yang, 2010) and mobile banking (Yu,
2012).

Determinants of Mobile Tourism: An Emerging Market Perspective
13
Figure 2.1 UTAUT Framework
2.2.6 Extended UTAUT Model
According to Min, Ji and Qu (2008), the integration of constructs from the most
influential, widely used IT adoption models such as TRA, TPB and TAM has
made UTAUT as the most comprehensive model to explain the behavioral
intention of using an innovation. However, they also stated that UTAUT is yet a
perfect model. Besides, Venkatesh et al. (2003) also suggested that revision and
modification can be apply to UTAUT model as needed particularly in distinct IT
application such as m-commerce field.
In recent years, there are increasing amount of efforts from researchers to extend
UTAUT model by adding new variables, especially trust and perceived risk such
as information and communication technology (ICT) services (Lee, Kim, & Song,
2010), m-commerce (Min, Ji, & Qu, 2008), mobile wallet (Shin, 2009) and
Internet banking (Emad, Pearson, & Setterstrom, 2010). The imperfection of
UTAUT was further supported when Im, Kim and Han (2008) stated that trust and
perceived risk has been overlooked in the original UTAUT. To our knowledge,

Determinants of Mobile Tourism: An Emerging Market Perspective
14
extension of UTAUT model by integrating trust and perceived risk on mobile
tourism is yet to be tested in Malaysia. Thus, our study in mobile tourism seek to
contribute to the IS research community.
Previous technology adoption literatures also proved that trust and perceived risk
are critical factors in explaining users’ use intention. Research conducted by
Pavlou (2003), Warkentin et al. (2002), and Lee, Kim and Song (2010) shown
trust and perceived risk has direct effect on intention to use. Leong, Hew, Tan,
and Ooi (2013) shown that the effect of trust on intention to use mobile credit
card. User’s trust on technology and m-commerce service providers is crucial in
determining m-commerce success (Siau & Shen, 2003). Hence, Lee (2005)
postulated that trust will be playing an important role in reducing consumers’
uncertainty and ultimately, their transaction intention. In the context of our study,
perceived risk is an important factor as any technology failure during transaction
via mobile devices may lead to consumers’ financial or psychological loss.
2.3 Proposed Conceptual Framework
Figure 2.2 Proposed Conceptual Framework - Extended UTAUT
UTAUT constructs
H1
H2
H3
H4
Extended Constructs H5
H6
Performance Expectancy (PE)
Effort Expectancy (EE)
Social Influence (SI)
Facilitating Condition (FC)
Wireless Trust (WT)
Perceived Risk (PR)
Behavioral Intention towards
Mobile Tourism Adoption

Determinants of Mobile Tourism: An Emerging Market Perspective
15
2.4 Hypotheses Development
2.4.1 Performance Expectancy (PE)
Performance expectancy is developed from five different constructs, which is
perceived usefulness (TAM/TAM2), extrinsic motivation (MM), job-fit (MPCU),
outcome expectation (SCT) and relative advantage (IDT) and is similar as these
constructs. Venkatesh et al. (2003) explained that PE as “the extent to which a
person believes system will assist him or her to achieve an enhancement in the job
performance”. PE are proven to have influential impact towards the adoption of
particular system because users believer there is positive relationship between use
and performance (Agarwal & Karahanna, 2000).
Previous researchers found that there is significant relationship exists between PE
and usage intention in Malaysia (Ndubisi & Jantan, 2003; Ramayah & Suki, 2006;
Amin, 2007). The findings showing the existence of positive relationship between
PE and usage intention was also seen in mobile personal computer usage (Ndubisi
& Jantan, 2003; Ramayah & Suki, 2006) and mobile banking (Amin, 2007).
Tourists are always in search for more useful information on-the-go while
traveling. Services that tourists seek during their trip are most probably
transportation, reservation, safety information, directories and context-aware
services (Goh, Ang, Lee & Lee, 2010). When mobile tourism services help users
save time and acquire relevant information in their hands whenever needed, users
are expected to have positive intention towards mobile tourism. Thus, the
following hypothesis is put forward:
H1: Performance expectancy has significant influence on Gen Y’s
behavioral intention towards mobile tourism adoption in Malaysia.

Determinants of Mobile Tourism: An Emerging Market Perspective
16
2.4.2 Effort Expectancy (EE)
Effort expectancy is defined as the extent of ease associated with consumers’ use
of technology or system (Venkatesh et al., 2003). EE is similar as PEOU
(TAM/TAM2), ease of use (IDT) and complexity (MPCU). Website setting,
access time, and the efforts in developing views are effort of acceptance and ease
of technologies (Venkatesh et al., 2003; Park, Yang, & Lehto, 2007). According
to UTAUT model, female’s technology acceptance are normally depends on effort
expectancy. Based on the results from previous researchers, EE are considered to
be more essential to people with lower education levels and people in earlier
stages of adoption are most likely to be more sensitive to EE factor as the
technology presents a sort of hurdle to them (Szajna 1996; Venkatesh and Morris,
2000). From the context of this study, ease of use of mobile tourism can be
related to ease of access to mobile tourism sites and navigating its features. Effect
of EE towards the intention to use mobile tourism is expected to be significant.
Hence, the following hypothesis is formulated:
H2: Effort expectancy has significant influence on Gen Y’s behavioral
intention towards mobile tourism adoption in Malaysia.
2.4.3 Social Influence (SI)
Social influence refers to “the extent to which consumers perceive that important
others (e.g., friends and family) believe they should use a particular technology”
(Venkatesh, Thong, & Xu, 2012). This construct was supported by research from
Teo & Pok (2003), Ainin, Lim & Wee (2005), Lu & Su (2009), and Tan, & Ooi
(2013) in the adoption of WAP-enable mobile phones, mobile data, wireless
mobile data services, online banking and mobile credit card respectively. Social
influence signifies subjective norm in TRA, TAM2, C-TAM-TPB, TPB, image in
IDT and social factors in MPCU (Venkatesh, et al., 2003).

Determinants of Mobile Tourism: An Emerging Market Perspective
17
SI focuses on the role and views of friends, peer groups, relatives, and superiors
(Tan, Ooi, Chong, & Hew, 2013). Venkatesh and Davis (2000) explained the SN
impact on behavioral intention. They stated that a new technology will only be
adopted by potential users when they are influenced by the people who are
important to them.
Subsequently, study conducted by Yang (2010) explained that individual
behavioral intention to adopt mobile shopping services is considered to be altered
by the important others’ perception of mobile shopping services use. Taken the
above together, it supports Singh, Srivastava and Srivastava (2010) argument
stating that m-commerce users depend largely on their social interaction. In the
context of our study, users are more likely to rely on perception of others
regarding mobile tourism services. Thus, the following hypothesis is posited:
H3: Social influence has significant influence on Gen Y’s behavioral
intention towards mobile tourism adoption in Malaysia.
2.4.4 Facilitating Condition (FC)
Venkatesh et al. (2003) defined facilitating conditions as “the degree to which an
individual believes the existence of organizational and technical infrastructure to
support the use of technology”. In UTAUT, FC captures three different constructs,
facilitating conditions (MPCU), perceived behavioral control (TPB and C-TAM-
TPB), and compatibility (IDT) (Ratnasingam, 2005). Training or technical support
are also objective factors of FC that make users to adopt new system more easily
(Armida, 2008). According to Venkatesh et al. (2003), FC is a concept that relates
to use behavior as well as intention, especially during the absent of effort
expectancy. While another researcher suggest that FC have an influence on
acceptance intention instead on effective use of the technology (Eckhardt,
Laumer, & Weitzel, 2009). UTAUT model establishes that the FC perceived by
the users is a direct factor of the adoption of a technology, as they reveal the
environmental factors that incentivize or limit their adoption (Venkatesh et al.,

Determinants of Mobile Tourism: An Emerging Market Perspective
18
2003). Our study adopted literature of Yang (2010) stating that Internet-enabled
mobile devices that come with fine interface for mobile sites browsing increase
the likelihood of intention to use. Hence, if it is technical infrastructure are readily
available, allowing users to grasp the idea of mobile tourism instantly, they are
expected to use it. The following hypothesis is put forth:
H4: Facilitating condition has significant influence on Gen Y’s behavioral
intention towards mobile tourism adoption in Malaysia.
2.4.5 Wireless Trust (WT)
Wireless trust was developed by Lu, Yu and Liu (2005) so as to adapt to current
mobile technology era. Past studies conducted by Doney and Cannon (1997);
Jarvenppa and Tractinsky (1999) redefined trust to suit the electronic and mobile
commerce environment. Jarvenppa & Tractinsky (1999) defined trust as “a
consumer’s willingness to rely on seller in an online environment and take action
in circumstances where such action makes consumer vulnerable to the seller”.
According to Siau and Shen (2003), trust of m-commerce service providers and
trust of technology are used to explain the user trust towards the wireless mobile
system. Trust of m-commerce service providers is referring to the users is not only
looking for the acceptance of new technology, but also looking for the services
provided by service operator in term of payment system, transaction standards and
others. While, the utility of the newly technology such as convenience and
usefulness constitute the trust of technology from users.
Lu, Liu, Yu & Ku (2004) and Lu, Yu, & Yao (2003) proposed that wireless trust
issues can affect consumers’ intention to adopt wireless mobile technology for
commercial activities as well as important data services. Wireless trust is built on
the confidence level of consumers in a company’s ability in term of system
reliability, data transmission security and privacy protection (Liu & Arnet, 2002).
Lu et al. (2004) stated that it is imperative for users to have confident in software

Determinants of Mobile Tourism: An Emerging Market Perspective
19
applications that they rely on for data transmission, and these data are correct and
well-protected. In the context of this study, users must willing to trust and believe
that mobile tourism services is reliable during transactions. This lead to the
formulation of the following hypothesis:
H5: Wireless trust has significant influence on Gen Y’s behavioral
intention towards mobile tourism adoption in Malaysia.
2.4.6 Perceived Risk (PR)
Perceived risk is the expected losses for buying and it is a major obstacle to
discourage consumers from buying (Zhou, 2011; Wong, Lee, Lim, Chua, & Tan,
2012). This was further supported by Chang (2010) that in adopting mobile
phones for commercial transaction such as shopping. According to Huei (2004),
PR is one of the influencing determinants for adopting m-commerce. In order to
attract and retain online customers, it is essential to reduce PR towards online
transaction (Floh & Treiblmaier, 2006). This factor has similar result to adopting
m-commerce as m-commerce is extended from e-commerce (Malik, Kumra, &
Srivastava, 2013). When PR of consumers increased, it will cause the adoption to
decreased (Lee, Lee, & Eastwood, 2003).
In addition, Ba and Pavlou (2002) have stated that the potential risk of illegal
scenarios and fraud has been a major concern for consumers and also the service
provider. This was further supported by Tan et al. (2013) that failure in
technology could be a potential reason that leads to financial or psychological
loss. Mobile monetary transactions make consumers’ perceived risk in term of
financial loss of money or insecure in the sense of using credit card online
(Forsythe et al., 2006; Ghosh & Swaminatha, 2001; Malik, Kumra, & Srivastava,
2013). In the context of this study, financial risk is described as whether users
think it is risky to disclose their personal along with credit card information while
using mobile tourism, which they have no control over it. If users perceived
mobile adoption as risky, perceived risk will negatively affect users’ intention

Determinants of Mobile Tourism: An Emerging Market Perspective
20
towards mobile tourism adoption. Taken the above together, we proceed with the
following hypothesis:
H6: Perceived risk will negatively influence Gen Y’s behavioral intention
mobile tourism adoption in Malaysia.

Determinants of Mobile Tourism: An Emerging Market Perspective
21
CHAPTER 3: RESEARCH METHODOLOGY
3.0 Introduction
This chapter explains the methodology used to obtain relevant information for our
research purposes. Arrangements of this chapter are as follows: research design
(3.1), data collection methods (3.2), sampling design (3.3), research instrument
(3.4), constructs measurement (3.5), data processing (3.6) and data analysis (3.7).
3.1 Research Design
Research design is a framework specifying the methods for collecting information
and analyzing data (Burns & Bush, 2010).
3.1.1 Quantitative Research Design
Quantitative research design emphasizes on objective measurement and
numerical analysis of statistics gathered through surveys. Quantitative
research basically was implemented to generalize results from a large
number of samples (Babbie, 2010). The research is conducted using
descriptive research design.
3.1.2 Descriptive Research
Descriptive research is used to describe the characteristic of the population
being studied (Burns & Bush, 2010). It describes things such as consumers’
attitude and behavior towards certain product or situation and market
potential (Armstrong & Kotler, 2006). Descriptive research was adopted to

Determinants of Mobile Tourism: An Emerging Market Perspective
22
determine the six identified factors that influence Gen Y’s intention to use
mobile tourism in Malaysia.
3.2 Data Collection Methods
This part involved the process of collecting and gathering information and data for
the use of the research. It includes primary and secondary data sources.
3.2.1 Primary Data
Primary data is data collected by researchers for a specific purpose to
address the issue at hand (Malhotra, 2004). It is obtained from first-hand
sources by means of observation or surveys. The primary data for this
study was collected using survey in four areas, which is Kuala Lumpur,
Penang, Perak and Johor. Five people were assigned to distribute the
questionnaire to respondents. Exposure of mobile tourism is relatively low
to Malaysian, hence hybrid survey method was used involving both
person-administered and self-administered to ensure respondents
understand the questions. We will be there to assist those respondents who
faced difficulty while answering the questionnaire. For those who able to
comprehend the questionnaire well, we leave the respondents to control
survey. After compiling all the data from the questionnaire, it will be
analyzed using SAS software.
3.2.2 Secondary Data
Secondary data is the data that has been collected previously for research
purposes other than problems at hand (Malhotra, 2010). This study used
secondary data to clarify and support our constructs in our proposed
framework. Various sources are accessed to acquire relevant data such as

Determinants of Mobile Tourism: An Emerging Market Perspective
23
electronic journals, reference books, online journal databases such as
EBSCOhost, ProQuest, Emerald and others.
3.3 Sampling Design
Sample design can be explained as a framework that acts as the fundamental of a
survey sample and influence many other factors in a survey (Shapiro, 2008). This
part consists of method used to identify sample size, target population, method of
selecting respondents, and sampling technique.
3.3.1 Target Population
According to Malhotra and Peterson (2006), total population is the
collection of objects that possess information sought by researcher to
conduct their research. As the nature of our study is regarding mobile
technology adoption, the target population is Gen Y who own mobile
devices and may have experienced in mobile transaction in Malaysia.
3.3.2 Sampling Location
Sample units and list of respondents from few areas are chosen in
conducting this research. Few geographic areas were chose by us to
facilitate our research. These locations were Kuala Lumpur, Penang, Perak
and Johor. According to report revealed by MCMC (2013), these locations
are chosen due to the high mobile phones penetration rate of 203.5, 142.3,
114.6 and 128.7 respectively. Therefore, 500 set of questionnaires were
distributed to the people that stay in the place that mentioned earlier.

Determinants of Mobile Tourism: An Emerging Market Perspective
24
3.3.3 Sampling Elements
Target respondents vary considerably from working adults, students and
anyone who are comfortable using technological gadgets often, especially
mobile devices. This study focuses more on generation-Y, those who are
born between 1980 to1994 (age 17 to 31), who have higher tendency to
use new technology innovation (McCrindle, 2006).
3.3.4 Sampling Techniques
Non-probability sampling technique is adopted for this research where
there is no fix probability of chance in selecting a sample, but depends on
researcher’s judgment (Malhotra, 2004). In convenience sampling,
respondents are chosen due to their existence in that area at that time. It
also enables us to better identify potential respondents with characteristics
suitable to our research purpose. Furthermore, snowball sampling is
applied where the initial respondents are asked to identify others who are
similar to the target population of interest (Malhotra & Birks, 2007). As a
result, the respondents in our targeted population will have more or less
the same demographic and psychographic characteristics.
3.3.5 Sample Size
Malhotra (2004) defined sample size as the number of elements to be
included. In this study, 500 respondents from Kuala Lumpur, Penang,
Perak and Johor have participated during our survey. Majority of
respondents are targeted based on our judgment and aforementioned
respondents’ criteria.

Determinants of Mobile Tourism: An Emerging Market Perspective
25
3.4 Research Instrument
3.4.1 Purpose of using Questionnaire
According to University of Bristol, questionnaire was used as a mechanism
for data collection. Benefits of questionnaire are the ease of distributing to
large number of respondents at low cost, enable researcher to collect data
about individual belief, knowledge, behavior, and attitude (Oppenheim,
1992)
3.4.2 Questionnaire
Questionnaire design is imperative as the value of final research conclusions
depends largely on the quality of the questionnaire (Bernard & Makienko,
2012). Close-ended question are used in the questionnaire whereby set of
response alternatives has been provided, asking respondents to select
response that are closest to their perception (Given, 2008). It usually
associated with structured format.
Generally, the questionnaire is divided into two sections. Section A
comprises of 11 questions regarding demographic profile such as age,
academic qualification, respondent industry and others. Nominal scale is
used whereby named questions are classified into one or more categories
describing characteristics of interest.
In Section B, a total of 25 questions was designed to investigate the factors
influencing users’ behavioral intention towards adopting mobile tourism.
This section includes performance expectancy, effort expectancy,
facilitating condition, social influence, wireless trust, perceived risk and
behavioral intention towards adopting mobile tourism. Likert scale with 7-
point was used in this section.

Determinants of Mobile Tourism: An Emerging Market Perspective
26
3.4.3 Pilot Test
Pilot test used prior to actual survey which examines the reliability of each
constructs in the study. It allows researcher know that whether the
questionnaire wording are clear enough for the respondents to comprehend
the questions in the questionnaire (Burgess, 2001).
Prior to questionnaire distribution, the questionnaire was reviewed by our
supervisor, Mr. Garry Tan to see whether there is any problem with it. 50
respondents from Universiti Tunku Abdul Rahman were chosen to conduct
the survey and feedbacks regarding the questionnaire were obtained.
3.4.4 Data Collection
The questionnaire is distributed to respondents through survey and the
questionnaires are collected back immediately. Out of 500 questionnaires,
there is only 450 set of questionnaire qualified to use in the research as some
of the questionnaire are incomplete. As a result, there is 90% of respond rate
from the entire questionnaire distributed.

Determinants of Mobile Tourism: An Emerging Market Perspective
27
3.5 Constructs Measurement
Table 3.1 Constructs Measurement
Each constructs in the framework was tested using seven-point likert scale with
anchors of “strongly disagree” to “strongly agree”. Such scales can provide
balance between enough points of perception without maintaining too many
response rates (Sauro, 2010). These variables were adopted from the sources as
shown in Table 3.5.
3.5.1 Scale Management
3.5.1.1 Nominal Scale
According to Stevens (2012), nominal scale refer to label that cannot be
quantified. Basically, nominal scale can be used to categorize age, gender,
occupation, marital status, and race (Stevens, 2012). In the research, total of
four questions has been designed using nominal scale.
3.5.1.2 Ordinal Scale
Ordinal scale measures qualitative concepts. It is the direction of the values
of what is significant (Stevens, 2012). Therefore, ordinal scale is used to

Determinants of Mobile Tourism: An Emerging Market Perspective
28
determine “greater than or less than” types of questions. The example of
question that used ordinal scale is:
3.5.1.3 Likert Scale
Likert (1932) developed this method to measure attitudes by answering a
sequence of statements about an issue, in relations of the degree to which
the respondents agree with them. In Section B questionnaire, 7-point likert
scale has been used ranging from “strongly disagree”, “disagree”, “slightly
disagree”, “neutral”, “slightly agree”, “agree”, and “strongly agree”.
Example of likert scale used in this questionnaire is as below:
Determinants of Mobile Tourism: An Emerging Market Perspective
29
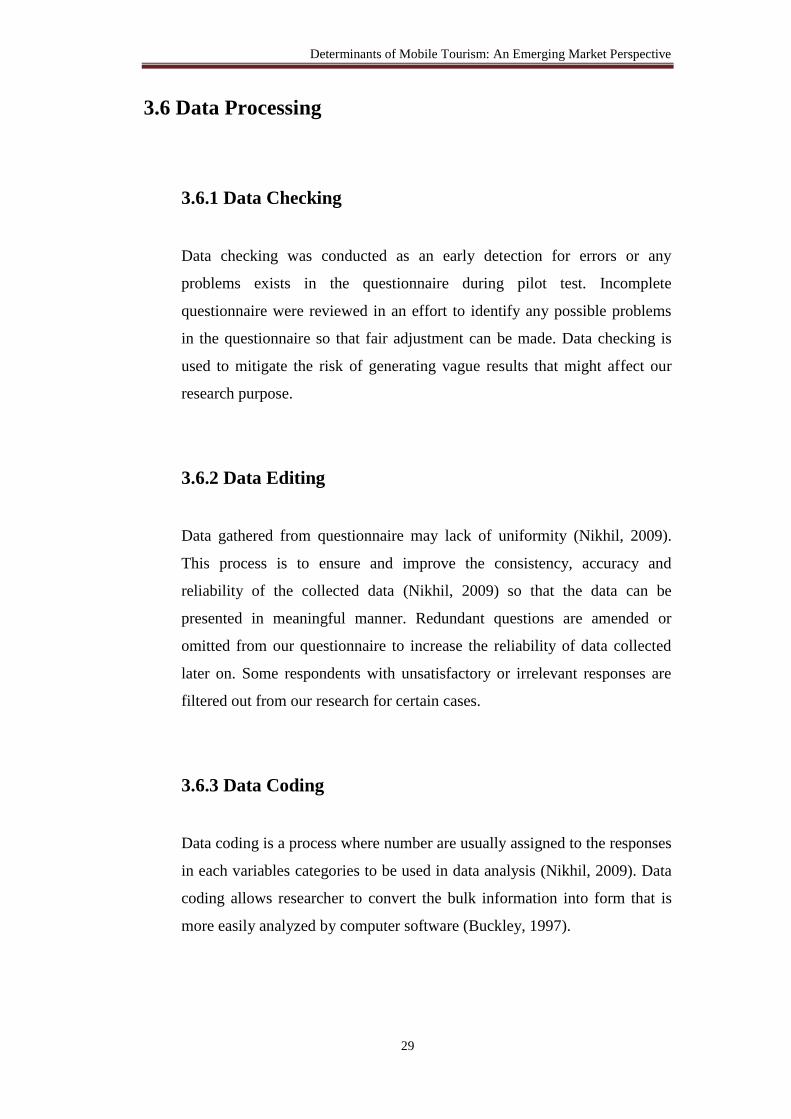
3.6 Data Processing
3.6.1 Data Checking
Data checking was conducted as an early detection for errors or any
problems exists in the questionnaire during pilot test. Incomplete
questionnaire were reviewed in an effort to identify any possible problems
in the questionnaire so that fair adjustment can be made. Data checking is
used to mitigate the risk of generating vague results that might affect our
research purpose.
3.6.2 Data Editing
Data gathered from questionnaire may lack of uniformity (Nikhil, 2009).
This process is to ensure and improve the consistency, accuracy and
reliability of the collected data (Nikhil, 2009) so that the data can be
presented in meaningful manner. Redundant questions are amended or
omitted from our questionnaire to increase the reliability of data collected
later on. Some respondents with unsatisfactory or irrelevant responses are
filtered out from our research for certain cases.
3.6.3 Data Coding
Data coding is a process where number are usually assigned to the responses
in each variables categories to be used in data analysis (Nikhil, 2009). Data
coding allows researcher to convert the bulk information into form that is
more easily analyzed by computer software (Buckley, 1997).

Determinants of Mobile Tourism: An Emerging Market Perspective
30
3.6.4 Data Transcription
Data transcription is a process of translating source of data to software
readable format so that computer processing of the data can be done. Since
raw data was completed during data coding, these data will be directly
keyed in into SAS software for analysis.
3.6.5 Data Cleaning
Data cleaning is used to check inconsistencies, detected errors from the data
and treatment of the missing responses so as to improve the reliability of the
data. The possible errors are missing information, miscoding data or invalid
data (Rahm & Hong, 2000). In this stage, consistency check is run using
SAS software to determine data that are logically inconsistent or outliers
where corrections may be required.
3.7 Data Analysis
Data analysis is used to develop explanations, detect patterns, describe facts, and
test hypothesis (Levine, 1996). SAS Enterprise Guide 5.1 was used to analyze the
data collected from the survey. Later on, the output generated from SAS will be
translated into statistical tables and visuals such as chart and diagrams, allowing
us to have better understanding on the information. Data evaluation will be
conducted using logical reasoning methods – descriptive analysis, multiple
regression analysis, and inferential analysis.

Determinants of Mobile Tourism: An Emerging Market Perspective
31
3.7.1 Descriptive Analysis
Descriptive statistics refers to the process of summarizing raw data into
interpretable descriptive information and value which researchers able to
comprehend (Zikmund, 2003). This analysis also provides simple graphics
analysis and basic virtual quantitative analysis of the data (Trochim, 2006).
In this research, frequency distribution and percentage distribution will be
conducted and the information gained will be shown in the table form.
3.7.1.1 Frequency Distribution
Frequency distribution acts as a tabular representative of the research data
and basically used to summarize and organize the data. Frequency
distribution also used to interpret the data and detect outliers in the data
(Lavrakas, 2008). It classifies data into group and show the number of
observation obtained for each groups. For instance, frequency distribution
for age presented number of respondents that belong to certain group age in
table form.
3.7.2 Scale Measurement
3.7.2.1 Reliability Test
Reliability test refer to the degree to which result are accurate and consistent
for the constructs being measured (Malhotra & Peterson, 2006). By using
SAS software, correlation of each variable can be determined. Cronbach’s
alpha was used to test homogeneity that explains how good independent
variables are related to dependent variables (Joppe, 2000). For interpretation
purposes, George and Mallery (2003) stated the following rules of thumb:

Determinants of Mobile Tourism: An Emerging Market Perspective
32
Table 3.2 Cronbach Alpha Coefficient Range
Cronbach’s Alpha Internal Consistency
> 0.9 Excellent
> 0.8 Good
> 0.7 Acceptable
> 0.6 Questionable
> 0.5 Poor
< 0.5 Unacceptable
Cronbach’s alpha coefficient usually ranges between 0 and 1. The nearer
the value to 1.0, the better it is.
3.7.3 Inferential Analysis
3.7.3.1 Validity test
Based on Zikmund (2003), Pearson correlation analysis is deemed as a
statistical measure of co-variation and the strength of association between
independent variables and dependent variable. Pearson correlation usually
ranges from -1 to +1, in which the sign (+ or -) indicates the direction of the
relationship and the coefficient value indicates the strength of relationship
(Coakes & Steed, 2007). If the result of the test is -1, then it result in perfect
negative relationship and if the result shows 1 its means it result in perfect
positive relationship. Lastly, if the result is 0, it means there is no
relationship exists (Winter, 2000). Hair, Bush and Ortinau (2003) introduced
the following guidelines to interpret the strength of correlations:

Determinants of Mobile Tourism: An Emerging Market Perspective
33
Table 3.3 Correlation Coefficient Range
Correlation Coefficient Strength of Correlation
±0.81 - ±1.00 Very strong
±0.61 - ±0.80 Strong
±0.41 - ±0.60 Moderate
±0.21 - ±0.40 Weak
±0.00 - ±0.20 None
In our study, the determinants that influence users’ behavioral intention
towards mobile tourism adoption are classified as independent variable
(IV), while intention to use mobile tourism is dependent variable (DV).
Pearson correlation will be used to analyze the validity and significant
relationship between IV and DV.
3.7.3.2 Multiple Regressions
According to Zikmund (2003), multiple linear regressions allow
simultaneous investigation of the effect of two or more IV on a single DV.
The basic formula used is stated as below:
Y= a + b1X1 + b2X2 + b3X3 + b4X4 + b5X5+ … + bkXk
In our study, our equation will be as followed:
BI= a + b1(PE) + b2(EE) + b3(SI) + b4(FC) + b5(WT) + b6(PR)
whereby,
BI = Behavioral Intention
a = constant
PE = Performance Expectancy
EE = Effort Expectancy

Determinants of Mobile Tourism: An Emerging Market Perspective
34
FC = Facilitating Condition
SI = Social Influence
WT = Wireless Trust
PR = Perceived Risk
This equation enables researchers to identify the independent variables that
have the most influential impact on dependent variable.
3.8 Conclusion
This chapter discuss on the research methodology on how the process of creating
questionnaire, method of gaining data, processing the data, analyze the data and so on.
The information that provided in this chapter will become guidance in Chapter 4 on
data analysis.

Determinants of Mobile Tourism: An Emerging Market Perspective
35
CHAPTER 4: DATA ANALYSIS
4.0 Introduction
In this chapter, data collected from the questionnaire were analyzed and the result
of findings was obtained. SAS software is used to conduct the analysis process.
The analyses include descriptive analysis, scale measurement analysis and
inferential analysis.
4.1 Descriptive Analysis
4.1.1 Respondent’s Demographic Profile
4.1.1.1 Gender
Source: Developed for the research
From Table 4.1, the statistics has showed that the majority of the
respondents for our research are female in a total of 250 respondents that
has a percentage of 55.56% whereas male respondents comprises of 200
respondents that results in 44.44%. Based on this table, it has shown that
the questionnaires are distributed evenly among male and female.

Determinants of Mobile Tourism: An Emerging Market Perspective
36
4.1.1.2 Age
Source: Developed for the research
Based on Table 4.2, it has shown that the highest number of respondents
falls at the age of 21 to 25 which resulted in 286 respondents with 63.56%.
Followed by the next age group are respondents below 20 years old that
has a total of 164 respondents and shows a percentage of 36.44%. The rest
of the age groups have not participated in the questionnaire distributed.
4.1.1.3 Marital Status
Source: Developed for the research
As shown in Table 4.3, there are a large number of respondents that are
single resulted in a total of 442 respondents and a large portion of
percentage, 98.22%. Only 8 respondents who are married that had done
this questionnaire which brings 1.78%.

Determinants of Mobile Tourism: An Emerging Market Perspective
37
4.1.1.4 Academic Qualification
Source: Developed for the research
Table 4.4 displays the academic qualification of the respondent of the
research. Respondents that had a bachelor degree or professional
qualification are the majority respondent of our study that leads to a total
of 336 respondents holding 74.67%. Followed by a total of 82 respondents
that has no college degree and resulting to 18.22%. The next respondent
group has a diploma or advance diploma qualification with 24
respondents, 5.33%. Lastly, with a total of 8 respondents from
postgraduates that have 1.78%.
4.1.1.5 Respondent’s Industry
Source: Developed for the research

Determinants of Mobile Tourism: An Emerging Market Perspective
38
As shown in Table 4.5, most of the respondents work in other field which
is not stated in the questionnaire which consists of 209 respondents, 46.44
%. The next highest industry respondents works’ in is manufacturing with
a total of 92 respondents that holds 20.44 percent. Followed by
respondents that works’ in retail industry comprises of 71 respondents that
have 15.78 percent. Moving on is the financial institution that comprises of
35 respondents with 7.78%. Banking industry is the following industry
that has a total of 27 respondents holding 6%. . Lastly, the least number of
respondents works in telecommunication and education industry that has 8
respondents and 1.78 percent respectively.
4.1.1.6 Internet Accessibility
Source: Developed for the research
Table 4.6 displays whether respondents are using their mobile phones to
access to the internet and it has been shown that there are a large number
of respondents that has internet accessibility on their mobile phones
comprising of 426 respondents with a majority of 94.67% whereas there
are only 24 respondents (5.33%) does not use mobile phones to access the
internet.

Determinants of Mobile Tourism: An Emerging Market Perspective
39
4.1.1.7 Credit or Debit Card
Source: Developed for the research
Based on Table 4.7, its shows the number of respondents that owns a
credit or debit card. From this table, there is a majority of respondents who
owns credit or debit card with a total of 414 respondents (92%) and 36
respondents (8%) that has no credit or debit card.
4.1.1.8 Shop using Mobile Devices
Source: Developed for the research
Based on Table 4.8, it shows how frequent a respondent uses mobile
phones to shop. Most of the respondents shop 1 to 10 times using their
mobile phones with a total of 174 respondents taking up 38.67%, followed
by respondents using mobile phone to shop with the frequency of 11 to 20

Determinants of Mobile Tourism: An Emerging Market Perspective
40
times totaled to 30 respondents, 6.67%. Meanwhile, there are only 8
respondents, 1.78% fall at the frequency of 21 to 30 and above
respectively. There are 230 respondents that do not shop at all using
mobile phone with the highest percentage of 51.11%.
4.1.1.9 Mobile Devices
Source: Developed for the research
Table 4.9 shows the types of mobile devices that are owned by our
respondents. The number of respondents that owned a smart phone is the
highest which leads to a total of 323 respondents taking up 71.78%.
Moreover, the number of respondents using mobile phone comprises of
127 respondents which lead to a percentage of 28.22% and there are no
respondents that use Personal Digital Assistant (PDA).

Determinants of Mobile Tourism: An Emerging Market Perspective
41
4.1.1.10 Monthly Income
Source: Developed for the research
As shown in Table 4.10, there are a majority of 423 respondents that has
an income less than RM1000 which comprises of 94%. Followed by, 27
respondents that falls into the income group of RM1001 to RM2000 with
only 6%. The rest of the income groups are not available among our
respondents.
4.1.1.11 Shopping Location
Source: Developed for the research

Determinants of Mobile Tourism: An Emerging Market Perspective
42
Table 4.11 shows the location of respondents they are at when they are
using their mobile phones. Based on Table 4.11, the highest number of
respondents using their mobile phones recorded was at home with a total
of 232 respondents that has a majority of 51.56%. The next common place
respondents using their mobile phones are at a friend’s place with a total of
72 respondents holding 16% followed by, at school with 44 respondents
(9.78%). Nonetheless, in two locations which are at work and in a library
with an amount of 35 respondents and 7.78% respectively. The least place
that respondents used mobile phones is at others with 32 respondents
(7.11%).
4.2 Scale Measurement
4.2.1 Internal Reliability Analysis
Source: Developed for the research
Based on Table 4.12, all the independent variables for reliability has been
proven to be consistent and reliable due to all alpha coefficient value are
above 0.7. The Cronbach’s Alpha value from the table has showed 0.7342
for 3 items of performance expectancy (PE), 0.7287 for 4 items of effort
expectancy (EE), 0.7265 for 4 items of facilitating condition (FC), 0.7396

Determinants of Mobile Tourism: An Emerging Market Perspective
43
for 4 items of social influence (SI), 0.7404 for 3 items of wireless trust
(WT), and 0.9441 for 3 items of perceived risk (PR). In addition to that,
the Cronbach’s Alpha value for behavioural intention (dependent variable)
is 0.7301 for 4 items which has also proven to be reliable and consistent.
4.3 Inferential Analysis
4.3.1 Pearson Correlation Analysis
Source: Developed for the research

Determinants of Mobile Tourism: An Emerging Market Perspective
44
4.3.1.1 Test of Significant
H1: Performance Expectancy (PE)
According to Table 4.13, the correlation between performance expectancy
(PE) and behavioral intention (BI) towards the adoption of mobile tourism
is at 0.7614 (p<0.01). This result showed that performance expectancy
(PE) has significant association towards Gen Y’s behavioral intention to
adopt mobile tourism. Therefore, PE is supported. According to Hair,
Bush and Ortinau (2003), PE of 0.7614 falls under strong coefficient
range.
H2: Effort Expectancy (EE)
Based on Table 4.13, the correlation of effort expectancy (EE) with Gen
Y’s behavioral intention (BI) of consumers towards mobile tourism
adoption is at 0.7907 (p<0.01). Hence, there is significant association
between effort expectancy and behavioral intention to adopt mobile
tourism. Therefore, EE is supported. EE of 0.7907 falls under strong
coefficient range (Hair, Bush, & Ortinau, 2003).
H3: Facilitating Condition (FC)
Table 4.13 presents the correlation of facilitating condition (FC) with Gen
Y’s behavioral intention (BI) towards mobile tourism adoption is 0.8055
(p<0.01). Thus, the value indicates that facilitating condition (FC) has
significant impact on behavioral intention towards adopting mobile
tourism. Therefore, FC is supported. According to the rules of coefficient
size (Hair, Bush, & Ortinau, 2003), FC of 0.8055 is categorized as very
strong coefficient range.

Determinants of Mobile Tourism: An Emerging Market Perspective
45
H4: Social Influence (SI)
Table 4.13 depicts the correlation of 0.7399 (p<0.01) between social
influence (SI) and Gen Y’s behavioral intention (BI) towards mobile
tourism adoption. This proved that social influence (SI) has significant
influence on behavioral intention towards adopting mobile tourism.
Therefore, social influence (SI) is supported. The coefficient value of
0.7399 is classified as strong coefficient range based on Hair, Bush, and
Ortinau (2003).
H5: Wireless Trust (WT)
Based on Table 4.21, the correlation is 0.7283 (p<0.01) between wireless
trust (WT) and Gen Y’s behavioral intention (BI) towards adopting mobile
tourism. This signifies that wireless trust (WT) has significant association
with behavioral intention to adopt mobile tourism. Therefore, WT is
supported. Wireless trust with coefficient value of 0.7283 falls into strong
coefficient range.
H6: Perceived Risk (PR)
Table 4.13 shows the correlation of perceived risk (PR) with Gen Y’s
behavioral intention (BI) towards the adoption of mobile tourism is -
0.6164 (p<0.01). This has proven that perceived risk (PR) has significant
negative association with behavioral intention to adopt mobile tourism.
Therefore, PR is supported. Based on the rules for correlation size (Hair,
Bush, and Ortinau, 2003), PR falls into the category of very strong
coefficient range.

Determinants of Mobile Tourism: An Emerging Market Perspective
46
4.3.2 Multiple Regression Analysis
4.3.1.1 Strength of Relationship
Source: Developed for the research
Based on Table 4.14, it has showed that the figure for R Square (R2) is 0.7703,
which shows that 77.03% of the outcome is significant accounted for the
examined regression line. In another words, there are 77.03% of behavioral
intention to adopt mobile tourism are significantly explained by our six
independent constructs (performance expectancy, effort expectancy, facilitating
condition, social influence, wireless trust, and perceived risk).
Source: Developed for the research
Based on Table 4.23, we are able to identify that the F value is 247.61 with the
significance level (Pr>F) of <0.0001. Therefore, the six variables (performance
expectancy, effort expectancy, facilitating condition, social influence, wireless
trust, and perceived risk) in the overall regression model were able to work well in

Determinants of Mobile Tourism: An Emerging Market Perspective
47
the explanation of the variation in Gen Y’s behavioral intention towards the
adoption of mobile tourism.
4.4 Conclusion
In this research, SAS statistical analysis technique was used to analyze the data
obtained from our respondents. Based on the statistical results in chapter 4, we are
able to interpret the relationship of performance expectancy, effort expectancy,
social influence, facilitating conditions, wireless trust, perceived risk, and
behavior intention. In the next chapter, an in-depth discussion will be done to the
major findings, implications of the study, limitations and direction proposed for
future study.

Determinants of Mobile Tourism: An Emerging Market Perspective
48
CHAPTER 5: DISCUSSION, CONCLUSION, AND
IMPLICATIONS
5.0 Introduction
Chapter five provide an overall conclusion for the entire research. It discusses the
summary of the entire descriptive and inferential analyses presented in previous
chapter, proceed with the discussion on the major findings so as to validate our
research objectives and hypotheses. Towards the end, implication and limitations
of the study is discussed, followed by directions for future research.
5.1 Summary of Statistical Analysis
5.1.1 Descriptive Analysis
5.1.1.1 Respondent’s Demographic Profile
Based on the analysis of respondent demographic summary in
Chapter Four, female respondents claim to have the highest
response with a percentage of 55.56% and male respondents with
the remaining of 44.44%. Most of the respondents fall into the age
group ranging from 21 to 25 years old with the percentage of
63.56%. Most of the respondents are single with a high percentage
of 98.22%. Most respondents have bachelor degree/ professional
qualification as their highest academic qualification levels with
percentage of 74.67%. For the industry section, retail industry
comprises of 46.44% which is the highest number among other
industries. The number of respondent with smart phone showed a
Determinants of Mobile Tourism: An Emerging Market Perspective
49
positively high percentage of 71.78. Additionally, the number of
respondents with Internet accessibility is relatively high with a
percentage of 94.67%. Despite the high Internet accessibility
percentage, the number of online shopping with ‘0’ frequency is
still holding the highest number with a percentage 51.11%. Most of
the mobile transaction takes place at their home with a high
percentage of 51.56%. Additionally, the number of respondents
carrying a credit/debit card is also high consisting 92%. There is an
87.78% of respondents claim that theirs income are below RM
1000.
5.1.2 Scale Measurement
5.1.2.1 Reliability Test
According to internal reliability analysis, both independent
variables and dependent variable are reliable. Cronbach Coefficient
Alpha was used to observe of 25 items which are made up to
evaluate the six independent variables (PE, EE, FC, SI, WT, PR)
and dependent variable (BI). From the six independent constructs,
PR had gained the highest Cronbach’s Alpha with a value of
0.9441, followed by WT (0.7404), SI (0.7396), PE (0.7342), EE
(0.7287) and FC (0.7265) respectively. As for dependent variable,
behavioral intention scored 0.7301 for its reliability test.

Determinants of Mobile Tourism: An Emerging Market Perspective
50
5.1.3 Inferential Analysis
5.1.3.1 Pearson Correlation Coefficient
Pearson Correlation was used to analyze the strength of
relationship and association among the seven constructs (PE, EE,
SI, FC, WT, PR and BI). Based on the results of correlation test, all
independent variables showed significant positive correlation with
the dependent variable, and PR negatively correlated with the
dependent variable. FC has the strongest positive relationship with
BI (0.8055), whereas the WT (0.7283) has the weakest positive
correlation with BI. On top of that, p-value of all independent
variables are < 0.0001. Hence, all constructs have significant
association with BI.
5.1.3.2 Multiple Regression Analysis
According to multiple linear regression table, the F-value is 247.61
with a significant level <.0001. Based on the multiple linear
regression output, all six constructs – PE, EE, SI, FC, WT and PR
are significant. Meanwhile, WT was found to have highest impact
towards towards BI with parameter estimate of 0.2309. As a result,
H11, H21, H31, H41, H51, and H61 are supported. The following
multiple regression equation is established:
Behavioral Intention = 0.9814 + 0.1631(PE) + 0.1972(EE) +
0.1572(FC) + 0.2013(SI) + 0.2309(WT) – 0.207(PR)
Based on the table of model summary, adjusted R2
of 0.7672
implies that 76.72% of the variation in Gen Y’s behavioral
intention towards adopting mobile tourism in Malaysia has been

Determinants of Mobile Tourism: An Emerging Market Perspective
51
significantly explained by PE, EE, SI, FC, WT and PR. The
extended UTAUT model shows a higher variance in adjusted R2 as
compared to the original UTAUT model with variance of 70%.
5.2 Discussion of Major Findings
Table 5.1 Summary of the Result of Hypotheses Testing
Hypotheses Results Supported/
Not Supported
H10:
Performance expectancy has
significant positive relationship on
Gen Y’s behavioral intention towards
mobile tourism adoption in Malaysia.
p-value = 0.0003
parameter estimate
= 0.1631
p-value < 0.05,
thus H10 is
supported.
H20:
Effort expectancy has significant
positive relationship on Gen Y’s
behavioral intention towards mobile
tourism adoption in Malaysia.
p-value = 0.0004
parameter estimate
= 0.1972
p-value < 0.05,
thus H20 is
supported.
H30:
Facilitating condition has significant
positive relationship on Gen Y’s
behavioral intention towards mobile
tourism adoption in Malaysia.
p-value = 0.0111
parameter estimate
= 0.1572
p-value < 0.05,
thus H30 is
supported.
H40:
Social influence has significant
positive relationship on Gen Y’s
behavioral intention towards mobile
tourism adoption in Malaysia.
p-value = <.0001
parameter estimate
= 0.2013
p-value < 0.05,
thus H40 is
supported.
H50:
Wireless trust has significant positive
relationship on Gen Y’s behavioral
p-value = <.0001
parameter estimate
= 0.2309
p-value < 0.05,
thus H50 is
supported.

Determinants of Mobile Tourism: An Emerging Market Perspective
52
intention towards mobile tourism
adoption in Malaysia.
H60:
Perceived risk has significant
negative relationship on Gen Y’s
behavioral intention towards mobile
tourism adoption in Malaysia.
p-value = <.0001
parameter estimate
= -0.2070
p-value < 0.05,
thus H60 is
supported.
Source: Developed for the research
H11: Performance expectancy has significant positive relationship on Gen
Y’s behavioral intention towards mobile tourism adoption in
Malaysia.
According to recent past studies, Yu (2012) found PE to have significant positive
relationship with behavioral intention towards adoption of any particular IT
system as users believe there is an existence of extra benefit by exploiting it.
Basically, it shows how people link the mobile system and performance together
in accomplishing their mission. Hence, to make the mobile tourism adoption in
Malaysia a success, PE is proven to increase the behavioral intention.
H21: Effort expectancy has significant positive relationship on Gen Y’s
behavioral intention towards mobile tourism adoption in Malaysia.
Venkatesh et al. (2012) stated that EE would bring a positive effect towards
behavioral intention on using a new system or technology. This is further
supported by recent past study by Chang (2013) which found that EE to have a
significant positive relationship with behavioral intention towards mobile
applications.
H31: Facilitating condition has significant positive relationship on Gen Y’s
behavioral intention towards mobile tourism adoption in Malaysia.

Determinants of Mobile Tourism: An Emerging Market Perspective
53
The result is consistent with Chong’s (2013) research stating that, FC have
positive relationship with behavioral intention towards m-commerce adoption as
he argued that FC reflect the need of support on using the system or technology.
FC reflects it is necessary to have knowledge on the system or technology before
people start using it.
H41: Social influence has significant positive relationship on Gen Y’s
behavioral intention towards mobile tourism adoption in Malaysia.
This findings is in parallel with Singh, Srivastava, & Srivastava (2010) stating that
social influence to have positive significant relationship with behavioral intention
in mobile banking adoption. The study mentioned that important of others such as
friends and family are believe to influence he or she to adopt on a new technology
or system. Based on Venkatesh, Speier, and Morris (2002), SI refers as an
individual perceived through someone important that influence the adoption of
technology.
H51: Wireless trust has significant positive relationship on Gen Y’s
behavioral intention towards mobile tourism adoption in Malaysia.
Study conducted by Toh, Marthandan, Chong, Ooi and Arumugam (2009) in m-
commerce adoption in Malaysia, their findings showed that wireless trust has
strong positive relationship towards technology adoption. Our findings is also
consistent with most of the past studies such as Toh et al., (2009), Luarn & Lin
(2005), Cho, Kwon & Lee (2007) and Lin & Wang (2005), stating that wireless
trust was one of the key predictors to justify the adoption of mobile tourism
through many other existing technology adoption.
H61: Perceived risk has significant negative relationship on Gen Y’s
behavioral intention towards mobile tourism adoption in Malaysia.
Based on past study, Kazi and Mannan (2013) found that PR is proven to have
negative relationship towards technology adoption such as mobile banking. In line
with many past studies stated that consumers that perceived a higher risks and

Determinants of Mobile Tourism: An Emerging Market Perspective
54
uncertainty of the system that may ultimately lead to loss of data or misuse of
information would expose them into a risk that discouraging them from adopting a
new technology (Kazi & Mannan, 2013; Al-Jabri & Sohail, 2012; Luo, Li, Zhang,
& Shim, 2010; Gu, Lee & Suh, 2009; Tan & Teo, 2000).
5.3 Implication of the Study
5.3.1 Managerial Implication
Since tourism sector is one of the main contributors to the Malaysia GDP,
hence it is important to understand the determinants that influence Gen Y’s
intention to adopt mobile tourism. The review of all findings delivered
important information to all the tour agencies, merchants, practitioners,
software developers, and governments to build a better platform to
increase the rate of mobile tourism adoption.
As PE and EE have found to have positive effect towards mobile tourism
adoption if Gen Y found that the application or user-interface is handy and
user-friendly. Service provider or software developer for mobile tourism
should focuses on convenient information acquisition mechanism by
restricting the unstable items that does not come along with mobile. The
performance of the mobile tourism will be faster as non-core contents are
simplified or cut-off. As most of Gen Y mobile users, the screens are
usually small, thus, information are more likely to be short but precise in
order to reduce the effort of understanding.
Meanwhile, FC showed that the need of support is relevant towards
achieving a positive effect towards mobile tourism adoption. Thus, support
system is suggested such as tutorial, call center and toll-free hotline to
guide users and to ensure users have full knowledge on the interface before
using it. As for SI, relationship among Gen Y is concern to show positive

Determinants of Mobile Tourism: An Emerging Market Perspective
55
result towards mobile tourism adoption. For instance, service provider
should focuses on social network, as it is the key to encourage more Gen Y
to adopt mobile tourism instead of the traditional ways (e.g. televisions,
radios and newspaper). The reason behind this is social network (e.g.
Facebook, Twitter, Blog, and LinkedIn) has the function of sharing that
link the friends and family together as friends and family play the key role
to encourage the adoption of mobile tourism.
Besides, WT and PR identify that Gen Y will adopt the mobile tourism if
they found that system is stable. Hence, network facilitators are named to
provide a more stable network, meanwhile, a bigger server to prevent any
system breakdown or failure. Additionally, a more stable payment system
is suggested to prevent any transaction failure. In that case, the risk
perceived by Gen Y’s traveler will be lowered down while promoting
more trust to Gen Y’s traveler to adopt mobile tourism in the future.
5.3.2 Theoretical Implications
From the theoretical viewpoint, UTAUT model has successfully extended
by including the two extra variables of Wireless Trust and Perceived Risk.
The extended model is believed to contribute to the knowledge bank as it
was tested and verified through Statistical Analysis System (SAS). As the
result of findings, enable the knowledge gap to be narrow down
concerning the determinants of mobile tourism adoption while providing
more facts to support the basis of UTAUT.
5.4 Limitation of Study and Directions for Future Study
We diagnose that our study consists of two main limitations. First of all, we found
that the result may not be generalized throughout the Malaysia as limitation on the
samples collected are from few state in Malaysia with a higher mobile penetration

Determinants of Mobile Tourism: An Emerging Market Perspective
56
rate such as Kuala Lumpur, Perak, Penang, and Johor. Hence, in the near future,
we recommend that the future researchers to use the same model to study on the
other state of Malaysia. Besides, it would be appealing to found out vary in
research findings in other state with a lower mobile penetration rate to improve
the validity of the model.
Next, we also found that there is a limitation of variables includes into our model
and other variables may also appear to be possibilities on explaining the adoption
of mobile tourism, as Malaysia is a multi-ethnic country. Thus, we recommend the
future researchers to look upon the extension of the model by including the
variables related to culture and sub-culture as it may bring additional value on
how it influence behavioral intention that trigger the adoption of mobile tourism
in Malaysia.
Lastly, we also recommend the future researchers to use the same model on other
potential mobile field such as mobile commerce, mobile advertising, M-coupons;
and etc. as the model consist of variables that enable them to justify the behavioral
intention in adopting the respective mobile field.
5.5 Conclusion
In a conclusion, the purpose of this research is to study on the constructs that
affects the behavioral intention to adopt mobile tourism. Performance expectancy,
effort expectancy, facilitating condition, social influence, wireless trust, and
perceived risk has significantly influence behavioral intention. This study is
beneficial for future researches, tour agencies, software developers, and
government to formulate their business strategies more accurately in developing
mobile tourism platform.

Determinants of Mobile Tourism: An Emerging Market Perspective
57
REFERENCES
Agarwal, R., & Karahanna, E. (2000). Time flies when you're having fun:
cognitive absorption and beliefs about information technology usage 1.
MIS Quarterly, 24(4), 665-694.
Ainin, S., Lim, C.H., & Wee, A. (2005). Prospects and challenges of E-banking in
Malaysia. The Electronic Journal of Information Systems in Developing
Countries.
Ajzen, I. (2010). Attitudes, personality, and behavior (2nd
ed.). New Delhi, India:
Tata McGraw- Hill.
Ajzen, I. (1991). The theory of planned behavior. Organizational Behavior and
Human Decision Processes, 50, 179-211.
Al-Jabri, I. M., & Sohail, M. S. (2012). Mobile banking adoption: Application of
Diffusion of Innovation Theory. Journal of Electronic Commerce
Research, 13(4), 379-391.
Amin, H. (2007). An analysis of mobile credit card usage intentions. Information
Management & Computer Security, 15(4), 260-269.
Armida, E. E. (2008). Adoption Process for VOIP: The Influence of Trust in the
UTAUT Model. ProQuest, 18.
Armstrong, G., & Kotler, P. (2006). Marketing: An Introduction (8th
ed.). Prentice
Hall.
Ba, S. & Pavlou, P. A. (2002). Evidence of the Effect of Trust Building
Technology in Electronic Markets: Price Premiums and Buyer Behavior.
MIS Quarterly, 26(3), 243-268
Babbie, E. R. (2010). The Practice of Social Research (12th
ed.). Belmont, CA:
Wadsworth.

Determinants of Mobile Tourism: An Emerging Market Perspective
58
Bernard, E. K., & Makienko, I. (2012). Teaching applied value of marketing
research: A questionnaire design project. The International Journal of
Management Education, 10(2), 139-145.
Buckley, D. J. (1997). Data Organization and Storage. Retrieved Febuary 27,
2014, from http://bgis.sanbi.org/gis-primer/page_27.htm
Burgess, T. F. (2001). General Introduction to the design of questionnaires for
survey research. Leeds, University of Leeds.
Burns, A. C., & Bush, R. F. (2010). Marketing Research (6th
ed.).
Pearson/Prentice Hall.
Chan, S., & Fang, X. (2001). User Interface for Mobile Commerce. Unpublished
manuscript.
Chang, C. C. (2013). Library Mobile Applications in University Libraries. Library
Hi Tech, 31(3), 478-492.
Chang, M. K. (1998). Predicting unethical behaviour: A comparison of the theory
of reasoned action and the theory of planned behaviour. Journal of
Business Ethics, 17(16), 1825–1834.
Chang, P.C., (2010). Drivers and moderators of consumer behaviour in the
multiple use of mobile phones. International Journal Mobile
Communications, 8(1), 88-105.
Cho, D. Y., Kwon, H. J. & Lee, H. Y. (2007). Analysis of trust in internet and
mobile commerce adoption. Proceedings of the 40th Hawaii International
Conference on System Science.
Chong, A. Y. L. (2013). Predicting m-commerce adoption determinants: A neural
network approach. Expect Systems with Application, 40(2), 523-530.
Coakes, S. J., & Steed, L. (2007). SPSS Version 14.0 for windows: Analysis
without anguish. Milton, Australia: John Wiley & Sons.

Determinants of Mobile Tourism: An Emerging Market Perspective
59
Davis, F. D. (1989). Perceived Usefulness, Perceived Ease of Use, and User
Acceptance of Information System. MIS Quarterly, 13(3), 319-340.
Doney, P. M., & Cannon, J. P. (1997). An Examination of the Nature of Trust in
Buyer-Seller Relationship. Journal of Marketing, 61(2), 35-51.
Eckhardt, A., Laumer, S., & Weitzel, T. (2009). Who influences whom?
Analyzing workplace referents' social influence on its adoption and non-
adoption. Journal of Information Technology 24(1), 11-24.
Emad, A., Pearson, J. M., & Setterstrom, A. J. (2010). Internet Banking and
Customers' Acceptance in Jordan: The Unified Model's Perspective.
Communications of the Association for Information Systems , 26(23), 493-
524.
Eriksson, O. (2002). Location Based Destination Information for the Mobile
Tourist. Information and Communication Technologies in Tourism, 255-
264.
Fishbein, M., & Ajzen, I. (1975). Belief, Attitude, Intention and Behaviour: An
Introduction to Theory and Research. Reading, MA: Addison-Wesley.
Floh, A., & Treiblmaier, Η. (2006). What Keeps the e-banking Customer Loyal?
A Multigroup Analysis of the Moderating Role of Consumer
Characteristics on E-loyalty in the Financial Service Industry. Journal of
Electronic Commerce Research, 7(2), 97-109.
Fort, S. (2013). Advantages & disadvantages of mobile commerce. Retrieved
January 14, 2014, from http://www.slideshare.net/SteveFort/advantages-
disadvantages-of-mobile-commerce
Forsythe, S., Liu, C., Shannon, D., & Gardner, L. C. (2006). Development of a
Scale to Measure the Perceived Benefits and Risks of Online Shopping.
Journal Of Interactive Marketing, 20(2), 55-75.

Determinants of Mobile Tourism: An Emerging Market Perspective
60
Gavalas, D., & Kenteris, M. (2011). A web-based pervasive recommendation
system for mobile tourist guides. Personal and Ubiquitous
Computing, 15(7), 759-770.
Gefen, D., Karahanna, E., & Straub, D. W. (2003). Trust and TAM in Online
Shopping: An Integrated Model. MIS Quarterly , 27(1), 51-90.
George, D., & Mallery, P. (2003). SPSS for Windows step by step: A simple guide
and reference. 11.0 update (4th
ed.). Boston: Allyn & Bacon.
Ghosh, A. Κ., & Swaminatha, Τ. M. (2001). Software Security and Privacy Risks
in Mobile e-commerce. Communications of the ACM, 44(2), 51-57.
Given, L. M. (2008). The SAGE Encyclopedia of Qualitative Research Methods.
SAGE Publications.
Goh, D. H., Ang, R. P., Lee, C. S., & Lee, C. K. (2010). Determining services for
the mobile tourist. Journal of Computer Information Systems, 51(1), 31.
Gu, J. C., Lee, S. C., & Suh, Y. H. (2009). Determinants of Behavioral Intention
to Mobile Banking. Expert Systems with Applications, 36, 11605-11616.
Hair, J. F., Bush, R. P., & Ortinau, D. J. (2003). Marketing Research: Within a
Changing Information Environment (2nd
ed.). London: McGraw-Hill.
Hagger, M. S., Chatzisarantis, N. L. D., & Biddle, S. J. H. (2002). A meta-analytic
review of the theories of reasoned action and Planned Behavior in physical
activity: An examination of predictive validity and the contribution of
additional variables. Journal of Sport and Exercise Psychology, 24(1), 3–
32.
Hansen, T., Jensen, J. M., & Solgaard, H. S. (2004). Predicting online grocery
buying intention: A comparison of the theory of reasoned action and the
theory of planned behaviour. International Journal of Information
Management, 24(6), 539-550.
Haque, A. (2004). Mobile Commerce: Customer Perception and It's Prospect on
Business Operation in Malaysia. The Journal of American Academy of
Business, 259.

Determinants of Mobile Tourism: An Emerging Market Perspective
61
Hu, J., & Liu, X. (2013). An influence study on adopting will of tourism mobile
E-commerce by the perceived risk and trust. I - Business, 5(1), 39-42.
Huei, P. V. (2004). The study on the acceptance of wireless computing devices
among consumers in Penang. Unpublished MBA thesis, Nottingham Trent
University.
Im, H., & Ha, Y. (2012). Who are the users of mobile coupons? A profile of US
consumers. Journal of Research in Interactive Marketing, 6(3), 215 – 232.
Im, I., Kim, Y. B., & Han, H. J. (2008). The effects of perceived risk and
technology type on users' acceptance of technologies. Information &
Management , 45(1), 1-9.
Jarvenppa, S. L., & Tractinsky, N. (1999). Consumer Trust in an Internet Store: A
Cross-Cultural Validation. Journal of Computer Mediated
Communication, 5(2).
Joppe, M. (2000). The Research Process. Retrieved February 27, 2014, from
http://www.ryerson.ca/~mjoppe/rp.htm
Kannan, P., Chang, A., & Whinston, A. (2001). Wireless Commerce: Marketing
Issues and Possibilities. Proceedings of the 34th Hawaii International
Conference on System Sciences.
Kazi, A. K., & Mannan, M. A. (2013). Factors affecting adoption of mobile
banking in Pakistan: Empirical Evidence. International Journal of Research
in Business and Social Science, 2(3), 54-61.
Kenteris, M., Gavalas, D., & Economou, D. (2009). An innovative mobile
electronic tourist guide application. Personal and Ubiquitous
Computing, 13(2), 103-118.
Khalifa, M., & Cheng, S. (2002). Adoption of mobile commerce: role of exposure.
Proceedings of the 35th Annual Hawaii International Conference on
System Sciences, IEEE Computer Society Press, New York, NY.

Determinants of Mobile Tourism: An Emerging Market Perspective
62
Khalifa, M., & Shen K. N. (2008). Drivers for transactional B2C M-commerce
Adoption: Extended theory of Planned Behavior. Journal of Computer
Information Systems, 48(3), 111.
Kim, D. Y., Park, J., & Morrison, A. M. (2008). A Model of Traveller Acceptance
of Mobile Technology. International Journal of Tourism Research , 10(5),
393-407.
Lavrakas, P. J. (2008). Encyclopedia of Survey Research Methods. SAGE
Pulications.
Lee, E. J., Lee, J., & Eastwood, D. (2003). A two-step estimation of consumer
adoption of technology-based service innovations. The Journal of
Consumer Affairs, 37(2), 256-282.
Lee, J. K., & Mills, J. E. (2010). Exploring Tourist Satisfaction with Mobile
Experience Technology. International Management Review, 6(1), 91-93.
Lee, J. H., Kim, S. W., & Song, C. H. . (2010). The Effects of Trust and Perceived
Risk on Users' Acceptance of ICT Services. KAIST Business School
Working Paper Series No. 2010-007.
Lee, T. M. (2005). The impact of perceptions of interactivity on customer trust
and transaction intention in mobile commerce. Journal of Electronic
Commerce , 6(3), 165-180.
Leong, L. Y., Hew, T. S., Tan, G. W. H., & Ooi, K. B. (2013). Predicting the
determinants of NFC-enabled mobile credit card acceptance: A neural
networks approach. Expert Systems with Applications , 40(14), 5604-5620.
Levine, J. H., & Roos, T. B. (1996). Introduction to Data Analysis: The Rules of
Evidence. Retrieved March 16, 2014, from
http://www.dartmouth.edu/~mss/docs/Volumes_1-2.pdf
Likert, R. (1932). A Technique for the Measurement of Attitudes. Archives of
Psychology, 140, 1-55.

Determinants of Mobile Tourism: An Emerging Market Perspective
63
Lin, H. H. & Wang, Y. S. (2005). Predicting consumer intention to use mobile
commerce in Taiwan. Proceedings of the International Conferences on
Mobile Business (ICMB’05), 406-412.
Liu, C., & Arnet, K. P. (2002). Raising a Red Flag on Global WWW Privacy
Policies. Journal of Computer Information Systems , 43(1), 117-127.
Lu, H. P., & Su, P. Y. J. (2009). Factors affecting purchase intention on mobile
shopping web sites. Internet Research, 19(4), 442-458.
Lu, J., Yu, C. S., & Yao, J. (2003). Technology Acceptance Model for Wireless
Internet. Journal of Internet Research , 13(2), 206-222.
Lu, J., Yu, C. S., & Liu, C. (2005). Facilitating Conditions, Wireless Trust and
Adoption Intention. Journal of Computer Information Systems , 46(1), 17-
24.
Lu, J., Liu, C., Yu, C. S., & Ku, C. Y. (2004). Wireless Trust: Conceptual and
Operational Definition. International Journal of Mobile Communications ,
2(1), 38-50.
Luarn, P. & Lin, H. H. (2005). Toward an understanding of the behavioral
intention to use mobile banking. Computer in Human Behaviour, 21(6),
873-891.
Luo, X., Li, H., Zhang, J., & Shim, J. P. (2010). Examining multi-dimensional
trust and multi-faceted risk in initial acceptance of emerging technologies:
An empirical study of mobile banking services. Decision Support Systems,
49(2), 222-234.
Malaysian Communications and Multimedia Commission. (2010). C&M Selected
Facts and Figures, Q4 2010. Cyberjaya: MCMC.
Malaysian Communications and Multimedia Commission. (2010). Hand Phone
Users Survey 2010. Cyberjaya: MCMC.

Determinants of Mobile Tourism: An Emerging Market Perspective
64
Malaysia Communications and Multimedia Commission. (2013).
Communications and Multimedia: Pocket Book of Statistics, Q4 2013.
Cyberjaya: MCMC.
Malaysia is 10th most visited country. (2013, August 6). The Star Online.
Retrieved January 14, 2014,
http://www.thestar.com.my/News/Nation/2013/08/06/Malaysia-is-10th-
most-visited-country.aspx/
Malhotra, N. K. (2004). Marketing research: An applied orientation (4th
ed.).
Prentice Hall.
Malhotra, N. K. & Peterson, M. (2006). Basic Marketing Research: A Decision
Making Approach. Pearson/Prentice Hall.
Malhotra, N., & Birks, D. (2007). Marketing Research: An Applied Approach (3rd
ed.). Pearson.
Malhotra, N. K. (2010). Marketing Research: An applied orientation (6th
ed.).
New Jersey: Pearson.
Malik, A., Kumra, R., & Srivastava, V. (2013). Determinants of consumer
acceptance of M-commerce. South Asian Journal of Management, 20(2),
102-126.
Martin, H. S., & Herrero, A. (2012). Influence of the User’s Psychological Factors
on the Online Purchase Intention in Rural Tourism: Integrating
Innovativeness to the UTAUT Framework. Tourism Management , 33(2),
341-350.
McCrindle, M. (2006). New Generations at work: Attracting, Recruiting,
Retaining and Training. McCrindle research. Retrieved March 18, 2014,
from
http://books.google.com.my/books?id=ONdoBshH8IMC&lpg=PA4&ots=
UcF9s-0clA&lr&pg=PA4#v=onepage&q&f=false
Mobile Commerce Research - Part 01 What Are Malaysians Buying? (2012,
August 14). Mobile88.com. Retrieved March 19, 2014, from
http://www.mobile88.com/news/read.asp?file=/2012/8/14/2012081411520
0

Determinants of Mobile Tourism: An Emerging Market Perspective
65
Mobile Marketing Association. (2013). Retrieved March 19, 2014, from
http://www.slideshare.net/vservmobi/mobile-internetconsumermalaysia-
28400200
Min, Q., Ji, S., & Qu, G. (2008). Mobile Commerce User Acceptance Study in
China: A Revised UTAUT Model. Tsinghua Science & Technology ,
13(3), 257-264.
Min, Q., Ji, S., & Qu, G. (2008). Mobile Commerce User Acceptance Study in
China: A Revised UTAUT Model. Tsinghua Science & Technology ,
13(3), 257-264.
Ndubisi, N. O., & Jantan, M. (2003). Evaluating IS usage in Malaysian small and
medium-sized firms using the technology acceptance model. Logistics
Information Management, 16(6), 440-450.
Nikhil. (2009). Processing of data--editing, coding, classification and tabulation.
Retrieved Febuary 27, 2014, from http://mass-communication
tutorials.blogspot.com/2009/11/processing-of-data-editing-coding.html
Oppenheim, A. N. (1992). Questionnaire design, interviewing and attitude
measurement. London: St Martins Press.
Park, J. K., Yang, S. J., & Lehto, X. (2007). Adoption of Mobile Technologies For
Chinese Consumers. Journal of Electronic Commerce Research , 8(3),
197-206.
Pavlou, P. A. (2003). Consumer Acceptance of Electronic Commerce: Integrating
Trust and Risk with the Technology Acceptance Model. International
Journal of Electronic Commerce , 7(3), 101-134.
Rahm, E., & Hong, H. D. (2000). Data Cleaning: Problems and Current
Approaches. IEEE Data Eng. Bull., 23(4), 3-11.
Ramayah, T., & Suki, N. M. (2006). Intention to use mobile PC among MBA

Determinants of Mobile Tourism: An Emerging Market Perspective
66
students: implications for technology integration in the learning
curriculum. UNITAR e- Journal, 1(2), 1-10.
Rasinger, J., Fuchs, M., & Hopken, W. (2007). Information Search with Mobile
Tourist Guides: A Survey of Usage Intention. Journal of Information
Technology & Tourism , 9(3), 177-194.
Ratnasingam, P. G. (2005). The Role of facilitating conditions and institutional
trust in electronic marketplaces. Journal of Electronics Commerce in
Organizations, 3(3), 1-14.
Riebeck, M., Stark, A., Modsching, M., & Kawalek, J. (2008). Studying the User
Acceptance of a Mobile Information System for Tourists in the Field.
Journal of Information Technology & Tourism , 10(3), 189-199.
Rogers, E. M. (1995). Lessons for guidelines from the diffusion of innovations.
The Joint Commission journal on quality improvement, 21(7), 324.
Rogers, E. M. (2003). Diffusion of preventive innovations. Addictive behaviors,
27(6), 989-993.
Rogers, E. M., & Singhal, A. (1996). An Integrated Approach to Communication.
Diffusion of Innovations.
Sauro, J. (2010). Should You Use 5 Or 7 Point Scales?. Retrieved Febuary 25,
2014, from https://www.measuringusability.com/blog/scale-points.php
Shapiro, G. (2008). Sample design. In P. Lavrakas (Ed.), Encyclopedia of survey
research methods. (pp. 777-778). Thousand Oaks, CA: SAGE Publications,
Inc.doi
http://dx.doi.org.ezp01.library.qut.edu.au/10.4135/9781412963947.n503

Determinants of Mobile Tourism: An Emerging Market Perspective
67
Shin, D. H. (2009). Towards an Understanding of the Consumer Acceptance of
Mobile Wallet. Computers in Human Behavior , 25(6), 1343-1354.
Siau, K., & Shen, Z. (2003). Building customer trust in mobile commerce.
Communications of the ACM , 46(4), 91-94.
Singh, S., Srivastava, V., &Srivastava, R. K., (2010).Customer acceptance of
mobile banking: A conceptual framework. SIES Journal of Management,
7(1), 55-64.
Stevens, S. (2012). Types of Data & Measurement Scales: Nominal, Ordinal,
Interval and Ratio. Retrieved March 16, 2014, from
http://www.mymarketresearchmethods.com/types-of-data-nominal-
ordinal-interval-ratio/
Sutanonpaiboon, J., & Pearson, A. M. (2006). E-commerce Adoption: Perceptions
of Managers/Owners of Small and Medium-Sized Enterprises (SMEs) in
Thailand. Journal of Internet Commerce , 5(3), 53-82.
Szajna, B. (1996). Empirical Evaluation of the Revised Technology Acceptance
Model. Management Science, 42(1), 85-92.
Tai, Y. C. K. (2013). Will Stock Investors Use Mobile Stock Trading? A Benefit-
Risk Assessment Based on a Modified UTAUT Model. Journal of
Electronic Commerce Research, 14(1), 67-84.
Tan, G., & Ooi, K. (2013). Mobile Tourism The Hidden Jewel of the Tourism
Industry? Technology Innovation and Industrial Management.
Tan, G., Ooi, K., Chong, S., Hew, T. (2013). NFC mobile credit card: The next
frontier of mobile payment? Telematics and Informatics, 31(2), 292-307.
Tan, M., & Teo, T. S. H. (2000). Factors influencing the adoption of Internet
banking. Journal of the Association for Information Systems, 1(5), 1-44.

Determinants of Mobile Tourism: An Emerging Market Perspective
68
Taylor, S., & Todd, P. A. (1995). Understanding Information Technology Usage:
A test of competing Models. Information Systems Research , 6(2), 144-
176.
Teo, T. S. H., & Pok, S. H. (2003). Adoption of WAP-Enabled Mobile Phones
Among Internet Users. Omega, 31( 6), 483 - 498.
Thompson, K. E., Haziris, N., & Alekos, P. J. (1994). Attitudes and food choice
behaviour. British Food Journal, 96(11), 9–13.
Toh, T. W., Marthandan, G., Chong, A. Y. L., Ooi, K. B., & Arumugam, S.
(2009). What Drives Malaysian M-commerce Adoption? An Empirical
Analysis. Industrial Management & Data Systems, 109(3), 370-388.
Tourism sector set to become major contributor. (2012, November 20). New
Straits Times. Retrieved September 28, 2013, from
http://www.nst.com.my/latest/tourism-sector-set-to-become-major-
contributor-1.173991
Tourist Arrivals & Receipts to Malaysia. (2013). Tourism Malaysia. Retrieved
January 14, 2014, from
http://corporate.tourism.gov.my/research.asp?page=facts_figures
Trochim, W. M. (2006). Research Methods Knowledge Base. Retrieved February
27, 2014, from http://csi.ufs.ac.za/resres/files/Trochim.pdf
Varshney, U. (2003). Issues, requirements and support for location-intensive
mobile commerce applications. International Journal of Mobile
Communications, 1(3), 247-263.
Varshney, U., & Vetter, R. (2001). A Framework for the Emerging Mobile
Commerce Application. Proceedings of the 34th Hawaii International
Conference on System Sciences, Los Alamitos, CA: IEEE Comp Society
Press.

Determinants of Mobile Tourism: An Emerging Market Perspective
69
Venkatesh, V., & Morris M. G. (2000). Why Don't Men Ever Stop to Ask for
Directions? Gender, Social Influence, and Their Role in Technology
Acceptance and Usage Behavior. MIS Quarterly, 24(1), 115-139.
Venkatesh, V., Speier, C., & Morris, M. G. (2002). User acceptance enablers in
individual decision making about technology: Toward an integrated
model. DecisionSciences, 33(2), 297-316
Venkatesh, V., Morris, M. G., Davis, G. B., & Davis, F. D. (2003). User
Acceptance of Information Technology: Toward a Unified View. MIS
Quarterly , 27(3), 425-478.
Venkatesh, V., & Zhang, X. (2010). Unified Theory of Acceptance and Use of
Technology: U.S. Vs. China. Journal of Global Information Technology
Management , 13(1), 5-27.
Venkatesh, V., Thong, J. Y. L., & Xu, X. (2012). Consumer acceptance and use of
information technology: Extending the Unified Theory of Acceptance and
Use of Technology. MIS Quarterly, 36(1), 157-178.
Wallace, L. G., & Sheetz, S. D. (2014). The Adoption of Software Measures: A
Technology Acceptance Model (TAM) Perspective. Information &
Management, (51)2, 249-259.
Wang, H., Liao, C., & Yang, L. (2013). What affects mobile application use? The
roles of consumption values. International Journal of Marketing
Studies, 5(2), 11-22.
Wang, H. Y., & Wang, S. H. (2010). User Acceptance of Mobile Internet Based
on the Unified Theory of Acceptance and Use of Technology:
Investigating the Determinants and Gender Differences. Social Behavior
and Personality , 38(3), 415-426.
Wang, Y. S., Wu, M. C., & Wang, H. Y. (2009). Investigating the Determinants
and Age and Gender Differences in the Acceptance of Mobile Learning.
British Journal of Educational Technology , 40(1), 92-118.

Determinants of Mobile Tourism: An Emerging Market Perspective
70
Warkentin, M., Gefen, D., Pavlou, P. A., & Rose, G. M. (2002). Encouraging
Citizen Adoption of e-Government by Building Trust. Electronic Markets ,
12(3).
What is the purpose of questionnaires? (2013). Retrieved February 25, 2014, from
http://www.economicsnetwork.ac.uk/handbook/questionnaires/13
Winter, G. (2000). A Comparative Discussion of the Notion of ‘Validity’ in
Qualitative and Quantitative Research. The Qualitative Report, 4(3&4).
Wong, C. C., & Hiew, P. L. (2005). Factors Influencing the Adoption of Mobile
Entertainment: Empirical evidence from a Malaysian Survey. IEEE
Computer Society, 682-685.
Wong, C.H., Lee, H.S., Lim, Y.H., Chua, B.H., Tan, G.W.H., (2012). Predicting
the consumers’ intention to adopt mobile-shopping: an emerging market
perspective. International Journal of Network and Mobile Technologies,
3(3), 24–39.
Wu, I. L. (2003). Understanding senior management’s behavior in promoting the
strategic role of IT in process reengineering: use of the theory of reasoned
action. Information & Management, 41(1), 1-11.
Yang, K. (2010). Determinants of US Consumer Mobile Shopping Services
Adoption: Implications for Designing Mobile Shopping Services. Journal
of Consumer Marketing, 27(3), 262-270.
Yu, C. S. (2012). Factors Affecting Individuals to Adopt Mobile Banking:
Empirical Evidence From The UTAUT Model. Journal of Electronic
Commerce Research, 13(2), 104-121.
Zhou, T. (2011). Examining the critical success factors of mobile website
adoption. Online Information Review, 35(4), 636–652.
Zikmund, W. (2003). Essentials of Marketing Research. USA: Thompson South-
Western.

Determinants of Mobile Tourism: An Emerging Market Perspective
71
APPENDICES
Appendix 1.1: MCMC’s Handphone Users Survey 2012

Determinants of Mobile Tourism: An Emerging Market Perspective
72
Appendix 1.2: MCMC Report on Mobile Penetration Rate in each State
Appendix 1.3: MCMC Report on Mobile Apps Downloaded

Determinants of Mobile Tourism: An Emerging Market Perspective
73
Appendix 3.1: Questionnaire
Determinants of Mobile Tourism: An Emerging Market
Perspective Survey Questionnaire
The purpose of this survey is pertaining to factors that influence the adoption of mobile tourism in
Malaysia. Please answer all the questions to the best of your knowledge. There are no wrong
responses to any of these statements. All responses are completely confidential.
Thank you for your participation.
Instructions:
1. There are two (2) sections in this questionnaire. Please answer ALL questions in ALL
sections.
2. The contents of the questionnaire will be kept strictly confidential.
3. Completion of this form will take you approximately 10 to 15 minutes.
Section A: Demographic Profile In this section, we are interested in your background in brief. Please tick your answer and your answer will
be kept strictly confidential.
QA1: Gender: Female Male
QA2: Age:
Below 20 Years Old 21-25 Years Old
26-30 Years Old
31-35 Years Old
36-40 Years Old
Above 40 Years Old
QA3: Marital status: Single
Married
QA4: Highest Level of academic qualification: No College Degree
Diploma/Advanced Diploma
Bachelor Degree/ Professional Qualification
Postgraduates
QA5: Respondent Industry:
Banking Financial Institution
IT Related Tourism
Manufacturing Retail
Telecommunications Other
Education
QA6: Do you have Internet (3G, 4G, and Wifi) access on your mobile device? (Mobile phone, PDA, smart phone or a combination device)
Yes No QA7: Do you have a credit card/debit card?

Determinants of Mobile Tourism: An Emerging Market Perspective
74
Yes No
QA8: In the past one year, how many times did you shop using your mobile device? 0 1 – 10 11 – 20
21 –30 Above 30 QA9: Do you own the following products: Mobile phone
Personal digital assistant (PDA) Smart Phone
QA10: Monthly income: Less than RM1000
RM1001 – RM2000 RM2001 – RM3000 RM3001 – RM4000 RM4001 – RM5000 Above RM5001
QA11: I shop using mobile devices mainly: At home
At work At school In a bank In a library In a friend’s place In another place Other
Section B: Determinants of Mobile Tourism: An Emerging Market Perspective
This section is seeking your opinion regarding the factors that influence your intention to adopt
mobile tourism. Respondents are asked to indicate the extent to which they agreed or disagreed
with each statement using 7 Likert scale [(1) = strongly disagree; (2) = disagree; (3) = slightly
disagree; (4) = neutral; (5) = slightly agree; (6) = agree; (7) = strongly agree] response
framework.
Please circle one number per line to indicate the extent to which you agree or disagree with the
following statements and tick the related answer for Question 3.
No Questions
Stro
ngl
y
Dis
agr
ee
Dis
agr
ee
Slig
htl
y
Dis
agr
ee
Ne
utr
al
Slig
htl
y A
gre
e
Agr
ee
Stro
ngl
y A
gre
e
B1 Performance Expectancy (PE)
PE1 I find mobile tourism useful in my daily life. 1 2 3 4 5 6 7
PE2 Using mobile tourism helps me accomplish tasks more quickly. 1 2 3 4 5 6 7
PE3 Using mobile tourism increases my productivity. 1 2 3 4 5 6 7
No Questions
Stro
ngl
y
Dis
agr
ee
Dis
agr
ee
Slig
htl
y
Dis
agr
ee
Ne
utr
al
Slig
htl
y A
gre
e
Agr
ee
Stro
ngl
y A
gre
e
B2 Effort Expectancy (EE)
EE1 Learning how to use mobile tourism does not require a lot of my mental effort. 1 2 3 4 5 6 7
EE2 I find mobile tourism easy to use. 1 2 3 4 5 6 7
EE3 Learning to use mobile tourism features is easy for me. 1 2 3 4 5 6 7

Determinants of Mobile Tourism: An Emerging Market Perspective
75
EE4 My interaction with mobile tourism is clear and understandable. 1 2 3 4 5 6 7
No Questions
Stro
ngl
y
dis
agre
e
Dis
agr
ee
Slig
htl
y
dis
agre
e
Ne
utr
al
Slig
htl
y a
gre
e
Agr
ee
Stro
ngl
y ag
ree
B3 Facilitating Conditions (FC)
FC1 I have the resources necessary to use mobile tourism. 1 2 3 4 5 6 7
FC2 I have the knowledge necessary to use mobile tourism. 1 2 3 4 5 6 7
FC3 Mobile tourism is compatible with other technologies I use. 1 2 3 4 5 6 7
FC4 I can get help from others when I face difficulties using mobile tourism. 1 2 3 4 5 6 7
No Questions
Stro
ngl
y
Dis
agr
ee
Dis
agr
ee
Slig
htl
y
Dis
agr
ee
Ne
utr
al
Slig
htl
y A
gre
e
Agr
ee
Stro
ngl
y A
gre
e
B4 Social Influence (SI)
SI1 People who are important to me think that I should use mobile tourism. 1 2 3 4 5 6 7
SI2 People who influence my behaviour think that I should use mobile tourism. 1 2 3 4 5 6 7
SI3 People whose opinions that I value prefer that I use mobile tourism. 1 2 3 4 5 6 7
SI4 Mass media (e.g TV, newspaper, radio) will influence me to use mobile tourism. 1 2 3 4 5 6 7
No Questions
Stro
ngl
y
Dis
agr
ee
Dis
agr
ee
Slig
htl
y
Dis
agr
ee
Ne
utr
al
Slig
htl
y A
gre
e
Agr
ee
Stro
ngl
y A
gre
e
B5 Wireless Trust (WT)
WT1 I will adopt mobile tourism if it is from trusted service providers. 1 2 3 4 5 6 7
WT2 I believed that my personal information will be kept confidential while using mobile tourism. 1 2 3 4 5 6 7
WT3 I believed that mobile tourism able to provide reliable services. 1 2 3 4 5 6 7
No Questions
Stro
ngl
y
Dis
agr
ee
Dis
agr
ee
Slig
htl
y
Dis
agr
ee
Ne
utr
al
Slig
htl
y A
gre
e
Agr
ee
Stro
ngl
y A
gre
e
B6 Perceived Risk (PR)
PR1 I would feel secure providing sensitive information while using mobile tourism. 1 2 3 4 5 6 7
PR2 I would worry the information that I provided will be 1 2 3 4 5 6 7

Determinants of Mobile Tourism: An Emerging Market Perspective
76
accessed by unauthorized parties like hackers.
PR4 Mobile tourism able to provide accurate, relevant and up-to-date information. 1 2 3 4 5 6 7
No Questions
Stro
ngl
y
Dis
agr
ee
Dis
agr
ee
Slig
htl
y
Dis
agr
ee
Ne
utr
al
Slig
htl
y A
gre
e
Agr
ee
Stro
ngl
y A
gre
e
B7 Behavioural Intention (BI)
BI1 I intend to continue using mobile tourism in the future. 1 2 3 4 5 6 7
BI2 I will always try to use mobile tourism in my daily life. 1 2 3 4 5 6 7
BI3 I plan to continue to use mobile tourism frequently. 1 2 3 4 5 6 7
BI4 I aim to use mobile tourism instead of traditional ones. 1 2 3 4 5 6 7
Thank you for your time and cooperation.
-The End-

Determinants of Mobile Tourism: An Emerging Market Perspective
77
Appendix 4.1 Demographic Analysis

Determinants of Mobile Tourism: An Emerging Market Perspective
78

Determinants of Mobile Tourism: An Emerging Market Perspective
79

Determinants of Mobile Tourism: An Emerging Market Perspective
80

Determinants of Mobile Tourism: An Emerging Market Perspective
81

Determinants of Mobile Tourism: An Emerging Market Perspective
82

Determinants of Mobile Tourism: An Emerging Market Perspective
83

Determinants of Mobile Tourism: An Emerging Market Perspective
84
Appendix 4.2: Internal Reliability Test
Internal Consistency Reliability
The CORR Procedure
7
Variables:
mean_IV1 mean_IV2 mean_IV3 mean_IV4 mean_IV5 mean_IV6
mean_DV
Simple Statistics
Variable N Mean Std Dev Sum Minimum Maximum Label
mean_IV1 450 4.85259 1.31756 2184 1.66667 7.00000 Performance Expectancy
mean_IV2 450 5.09278 1.33080 2292 1.00000 7.00000 Effort Expectancy
mean_IV3 450 4.94278 1.31578 2224 1.00000 7.00000 Facilitating Condition
mean_IV4 450 4.68333 1.37134 2108 1.00000 7.00000 Social Influence
mean_IV5 450 4.84370 1.34755 2180 1.33333 6.66667 Wireless Trust
mean_IV6 450 3.26667 1.24145 1470 1.00000 7.00000 Perceived Risk
mean_DV 450 4.93889 1.46303 2223 1.00000 7.00000 Behavioral Intention
Cronbach Coefficient Alpha
Variables Alpha
Raw 0.821368
Standardized 0.807543
Cronbach Coefficient Alpha with Deleted Variable
Deleted Variable
Raw Variables Standardized Variables
Label Correlation
with Total Alpha Correlation
with Total Alpha
mean_IV1 0.803180 0.756095 0.799121 0.734191 Performance Expectancy
mean_IV2 0.831213 0.750484 0.826755 0.728720 Effort Expectancy
mean_IV3 0.844337 0.748685 0.838034 0.726470 Facilitating Condition
mean_IV4 0.774706 0.759621 0.771449 0.739611 Social Influence
mean_IV5 0.769409 0.761264 0.767488 0.740383 Wireless Trust
mean_IV6 -.603597 0.943831 -.602976 0.944114 Perceived Risk
mean_DV 0.824777 0.747300 0.819948 0.730073 Behavioral Intention
Pearson Correlation Coefficients, N = 450 Prob > |r| under H0: Rho=0
mean_IV
1 mean_IV
2 mean_IV
3 mean_IV
4 mean_IV
5 mean_IV
6 mean_D
V
mean_IV1
Performance Expectancy
1.00000
0.76507
<.0001
0.75834
<.0001
0.65515
<.0001
0.72612
<.0001
-0.52434
<.0001
0.76144
<.0001
mean_IV2
Effort Expectancy
0.76507
<.0001
1.00000
0.87653
<.0001
0.70420
<.0001
0.66663
<.0001
-0.57165
<.0001
0.79071
<.0001
mean_IV3
Facilitating Condition
0.75834
<.0001
0.87653
<.0001
1.00000
0.76709
<.0001
0.67314
<.0001
-0.61283
<.0001
0.80552
<.0001
mean_IV4
Social Influence
0.65515
<.0001
0.70420
<.0001
0.76709
<.0001
1.00000
0.65059
<.0001
-0.46616
<.0001
0.73992
<.0001
mean_IV5
Wireless
0.72612
<.0001
0.66663
<.0001
0.67314
<.0001
0.65059
<.0001
1.00000
-0.40711
<.0001
0.72830
<.0001

Determinants of Mobile Tourism: An Emerging Market Perspective
85
Trust
mean_IV6
Perceived Risk
-0.52434
<.0001
-0.57165
<.0001
-0.61283
<.0001
-0.46616
<.0001
-0.40711
<.0001
1.00000
-0.61638
<.0001
mean_DV
Behavioral Intention
0.76144
<.0001
0.79071
<.0001
0.80552
<.0001
0.73992
<.0001
0.72830
<.0001
-0.61638
<.0001
1.00000

Determinants of Mobile Tourism: An Emerging Market Perspective
86
Appendix 4.3: Pearson’s Correlation Test and Multiple Regression Test
The REG Procedure
Model: Linear_Regression_Model
Dependent Variable: mean_DV Behavioral Intention
Number of Observations Read 832
Number of Observations Used 450
Number of Observations with Missing Values 382
Analysis of Variance
Source DF Sum of
Squares Mean
Square F Value Pr > F
Model 6 740.31746 123.38624 247.61 <.0001
Error 443 220.75198 0.49831
Corrected Total 449 961.06944
Root MSE 0.70591 R-Square 0.7703
Dependent Mean 4.93889 Adj R-Sq 0.7672
CoeffVar 14.29293
Parameter Estimates
Variable Label DF Parameter
Estimate Standard
Error t Value Pr > |t| Standardized
Estimate
Intercept Intercept 1 0.98143 0.25729 3.81 0.0002 0
mean_IV1
Performance
Expectancy 1 0.16306 0.04521 3.61 0.0003 0.14684
mean_IV2
Effort
Expectancy 1 0.19717 0.05523 3.57 0.0004 0.17935
mean_IV3
Facilitating
Condition 1 0.15724 0.06163 2.55 0.0111 0.14141
mean_IV4 Social Influence 1 0.20133 0.03957 5.09 <.0001 0.18871
mean_IV5 Wireless Trust 1 0.23086 0.03863 5.98 <.0001 0.21264
mean_IV6 Perceived Risk 1 -0.20701 0.03434 -6.03 <.0001 -0.17566

Determinants of Mobile Tourism: An Emerging Market Perspective
87
The REG Procedure
Dependent Variable: mean_DV Behavioral Intention

Determinants of Mobile Tourism: An Emerging Market Perspective
88

Determinants of Mobile Tourism: An Emerging Market Perspective
89

Determinants of Mobile Tourism: An Emerging Market Perspective
90

Determinants of Mobile Tourism: An Emerging Market Perspective
91
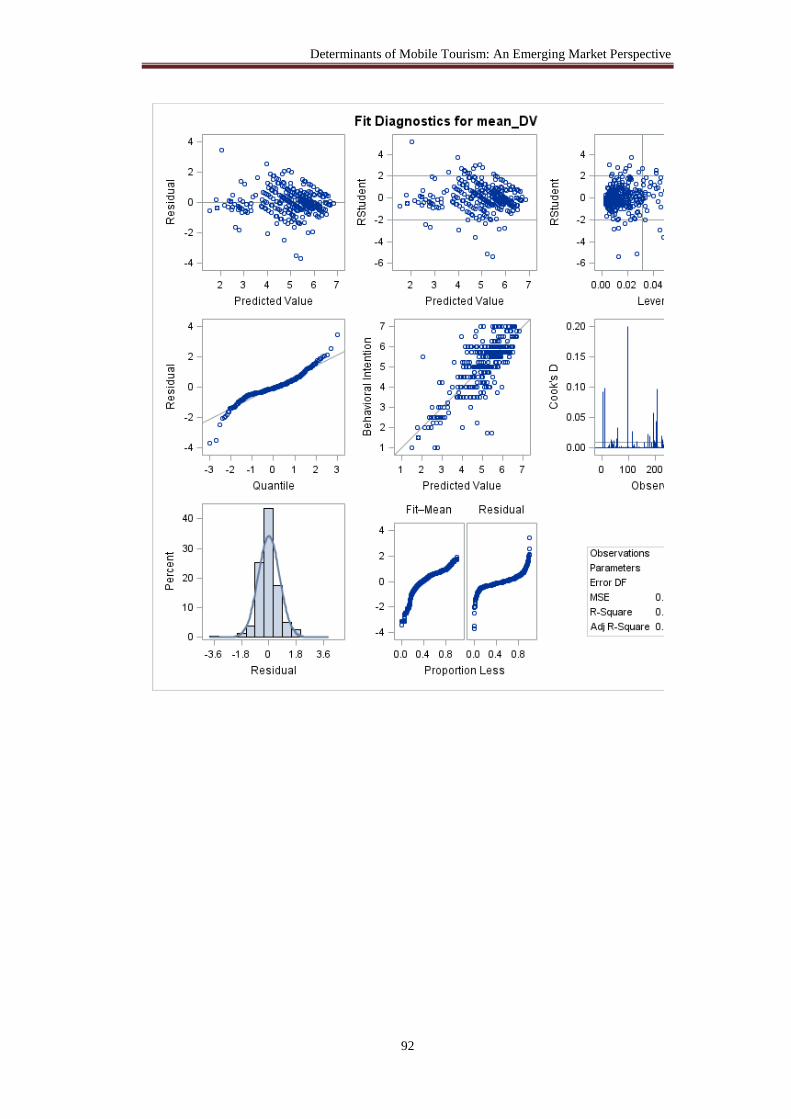
Determinants of Mobile Tourism: An Emerging Market Perspective
92
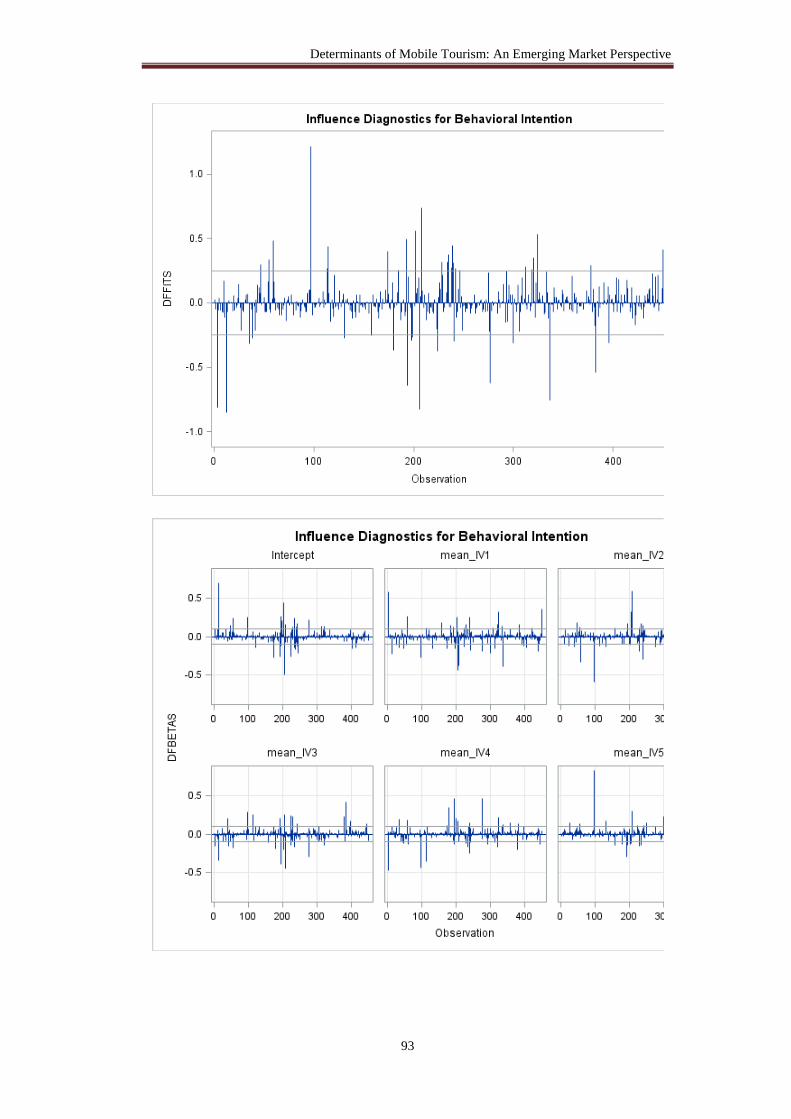
Determinants of Mobile Tourism: An Emerging Market Perspective
93

Determinants of Mobile Tourism: An Emerging Market Perspective
94