Determinants of Job Satisfaction across the EU-15: A - RePub
23
TI 2011-043/3 Tinbergen Institute Discussion Paper Determinants of Job Satisfaction across the EU-15: A Comparison of Self-Employed and Paid Employees José María Millán A Jolanda Hessels B,C Roy Thurik B,C Rafael Aguado A A Department of Economics, University of Huelva, Spain; B EIM Business and Policy Research, the Netherlands; C Erasmus School of Economics, Erasmus University Rotterdam, and Tinbergen Institute, the Netherlands.
Transcript of Determinants of Job Satisfaction across the EU-15: A - RePub

TI 2011-043/3 Tinbergen Institute Discussion Paper
Determinants of Job Satisfaction across the EU-15: A Comparison of Self-Employed and Paid Employees
José María MillánA
Jolanda HesselsB,C
Roy ThurikB,C
Rafael AguadoA
A Department of Economics, University of Huelva, Spain; B EIM Business and Policy Research, the Netherlands; C Erasmus School of Economics, Erasmus University Rotterdam, and Tinbergen Institute, the Netherlands.

Tinbergen Institute is the graduate school and research institute in economics of Erasmus University Rotterdam, the University of Amsterdam and VU University Amsterdam. More TI discussion papers can be downloaded at http://www.tinbergen.nl Tinbergen Institute has two locations: Tinbergen Institute Amsterdam Gustav Mahlerplein 117 1082 MS Amsterdam The Netherlands Tel.: +31(0)20 525 1600 Tinbergen Institute Rotterdam Burg. Oudlaan 50 3062 PA Rotterdam The Netherlands Tel.: +31(0)10 408 8900 Fax: +31(0)10 408 9031
Duisenberg school of finance is a collaboration of the Dutch financial sector and universities, with the ambition to support innovative research and offer top quality academic education in core areas of finance.
DSF research papers can be downloaded at: http://www.dsf.nl/ Duisenberg school of finance Gustav Mahlerplein 117 1082 MS Amsterdam The Netherlands Tel.: +31(0)20 525 8579

1
Determinants of job satisfaction across the EU-15: A comparison of self-employed and paid employees
José María Millán A, Jolanda Hessels B, C,
Roy Thurik B, C, Rafael Aguado A
A Department of Economics, University of Huelva, Spain
B EIM Business and Policy Research, The Netherlands
C Erasmus School of Economics, Erasmus University Rotterdam, The Netherlands
Abstract: Job satisfaction of self-employed and paid-employed workers is analyzed using the European Community Household Panel for the EU-15 covering the years 1994-2001. We distinguish between two types of job satisfaction, i.e. job satisfaction in terms of type of work and job satisfaction in terms of job security. Findings from our generalized ordered logit regressions indicate that self-employed individuals as compared to paid employees are more likely to be satisfied with their present jobs in terms of type of work and less likely to be satisfied in terms of job security. The findings also provide many insights into the determinants of the two types of job satisfaction for both the self-employed and paid employees. Version: January 2011
Keywords: entrepreneurship, self-employment, job satisfaction, Europe
JEL-classification: J24, J28, L26, O52
Document: Millan_Hessels_Thurik_Aguado_INBAM_v14.doc
Save date: 2/21/2011 5:04
Correspondence: Jolanda Hessels, [email protected]
Acknowledgement: The paper has been written in the framework of the research program SCALES carried out by EIM Business and Policy Research and financed by the Dutch Ministry of Economic Affairs, Agriculture and Innovation. This work has also benefited from financial support by the Spanish Ministry of Education (Programa Nacional de Movilidad de Recursos Humanos, Plan Nacional de I+D+i 2008-2011).

2
1. INTRODUCTION Entrepreneurship as an occupational choice has been widely investigated. The choice between entrepreneurship (i.e., self-employment) and wage-employment is found to be influenced by a broad range of factors including demographic factors, educational attainment, labor market, (expected) financial and (expected) non-financial benefits (Grilo and Thurik, 2008; Parker, 2009). Recent studies emphasize that job satisfaction may be an important determinant of the choice between self- and wage-employment (Taylor, 1996; Blanchflower, 2000, 2004). A different body of research has identified various positive effects of job satisfaction on individual and organizational performance. For example, that there are quantifiable positive links between job satisfaction and organizational effectiveness (Ostroff, 1992; Koys, 2001), better individual performance (Sousa-Poza and Sousa-Poza, 2000), employee turnover (Ryan, Schmitt and Johnson, 1996), customer satisfaction (Roger, Clow and Kash, 1994; Ryan, Schmitt and Johnson, 1996; Brown and Lam, 2008), achievement orientation (Lusch and Serpkenci, 1990) and lower absenteeism (Vroom, 1964). Thus, job satisfaction is not only a determining factor of occupational choice, but may also contribute to improving a firm’s competitiveness, productivity and growth potential. This makes it important to gain insight into the determinants of job satisfaction. This is not a new line of research. For many years labor economists have been interested in the determinants of job satisfaction (Clark, 1996; Hamermesh, 1977; Freeman, 1978; Borjas, 1979; Blanchflower and Oswald, 1998; Meng, 1990; Clark and Oswald, 1994) and several other studies have focused on job satisfaction in relation to self-employment (Blanchflower and Oswald, 1998; Blanchflower, 2000; Hundley, 2001; Benz and Frey, 2004, 2008; Noorderhaven, Thurik, Wennekers and Van Stel, 2004). A consistent finding is that the self-employed tend to have higher levels of job satisfaction than employees. Studies comparing job satisfaction between self-employed and paid-employed suffer from two shortcomings. First, like most studies explaining job satisfaction, they have failed to take account of the fact that job satisfaction is a heterogeneous phenomenon. Self-reported job satisfaction may reflect satisfaction with both financial and non-financial benefits and different people can mean different things when they evaluate the extent of satisfaction with their job (Muñoz de Bustillo-Llorente and Fernández-Macías, 2005; Bianchi, 2008). For example, if one states one is satisfied with one’s job, this may reflect satisfaction with the contents of the work or with the number of hours required to do the job or with both aspects. While some individuals may place a high or low value on some specific job-related aspects, which may influence their overall assessment of job satisfaction, for others it will comprise an evaluation of several different aspects. Therefore it is difficult to assess what is actually measured when asking individuals to evaluate overall satisfaction with their jobs. Consequently there is a lack of understanding of what job satisfaction means or refers to and how, ultimately, it can be influenced by employers and policy makers. In the present study we take an initial step in overcoming this problem by making a distinction between two types of job satisfaction, i.e. job satisfaction with the type of work and job satisfaction with job security. Second, studies comparing job satisfaction between self-employed and paid-employed lack wide empirical coverage. In the present study we use survey data of 15 European country for the 1994-2001 period and a large range of explanatory variables. We first compare self-reported levels of job satisfaction in terms of type of work and job security among self-employed individuals and paid employees. Since autonomy and independence are common motives for becoming self-employed, one would expect that the self-employed have more freedom in determining the type of work they do and are therefore more likely than employees to be satisfied with their jobs as far as the type of work is concerned. However, with respect to job security, self-employment can be considered more risky than paid-employment, as the risk of business failure is higher than the risk of unemployment. Furthermore, self-employment tends to be associated with lower levels of social security protection. Therefore it can be expected that self-employed individuals are less satisfied than paid employees in terms of satisfaction with their present jobs in terms of job security.

3
Next, we investigate the many determinants of job satisfaction in terms of the type of work and job security both for the self-employed and employees. This allows us to determine whether determinants of the two types of job satisfaction differ between the self-employed and paid employees. The literature background is dealt with in section two. In this section we also develop a number of hypotheses. Section three provides a description of our unique European dataset, the European Community Household Panel, covering the EU-15 countries for the period 1994-2001, the variables and the methodology. Results are presented in section four. Section five concludes and provides some further discussions.
2. RELATED LITERATURE For the purpose of the present study occupational choice refers to the choice to engage in self-employment or wage-employment. Many factors affect an individual’s decision to become self-employed (Grilo and Thurik, 2008; Parker, 2009). Next to demographic factors, educational attainment and labor market experience, they involve financial considerations such as expected earnings or income, income variability and expected profits as well as non-financial considerations such as autonomy, prestige and job satisfaction (Acemoglu, 1995; Van Praag, 1999). Verheul, Wennekers, Audretsch and Thurik (2002) view occupational choice decisions as being made on the basis of an assessment of the potential risks and rewards of both employment options. Individuals compare both the (expected) financial and non-financial risks and rewards of the alternatives. In their assessment, individuals take into account environmental factors (opportunities and opportunity costs) as well as their individual characteristics (means, skills and preferences). Work may provide both economic and non-economic utility (Benz and Frey, 2008). Overall, self-employment is associated with lower levels of economic utility than wage employment (Hamilton, 2000; Van Praag and Versloot, 2007). The income of the self-employed also tends to be more variable than the income of paid employees (Van Praag and Versloot, 2007). This leads to the idea that the self-employed are able to obtain greater non-financial benefits as compared to the wage-employed such as greater independence or satisfaction (Van Praag and Versloot, 2007; Bianchi, 2008). One indicator of non-financial utility that has received considerable attention in previous studies is job satisfaction. Job satisfaction broadly refers to the degree to which people like their work and is determined based on self-reported information. Economists tend to avoid data based on subjective feelings like job satisfaction. There are several reasons, however, why it may be important to analyze this subjective aspect. It is often argued, people who are satisfied with their work perform better (Sousa-Poza and Sousa-Poza, 2000). Previous studies suggest both a direct as well as an indirect link between job satisfaction and organizational performance. For example, there is evidence of positive indirect linkages of satisfaction with organizational effectiveness (Ostroff, 1992; Koys, 2001) and employee turnover (Ryan, Schmit and Johnson, 1996). Indirect linkages of satisfaction with performance are, for example, suggested through a direct positive relationship between job satisfaction and customer satisfaction (Rogers, Clow and Kash, 1994; Ryan, Schmit and Johnson, 1996; Brown and Lam, 2008); a positive link of satisfaction with achievement orientation (Lusch and Serpkenci, 1990); and through the observation that low satisfaction leads to higher absenteeism (Vroom, 1964), job separations and quits (Akerlof, Rose and Yellen, 1988; Clark, Georgellis and Sanfey, 1998; Clark, 2001). Thus job satisfaction can be considered an important factor in improving a firm’s competitiveness. Against this background we have witnessed an increased interest of economists in subjective aspects of well-being at work (Sousa-Poza and Sousa-Poza, 2000). Previous studies on job satisfaction have focused on analyzing various aspects in relation to employees (Clark, 1996, 1997; Clark and Oswald, 1996; Sousa-Poza and Sousa-Poza, 2000). Furthermore, several studies have included the self-employed in the analysis of job satisfaction. A consistent finding is that the self-employed have higher levels of job satisfaction than employees (Blanchflower and Oswald, 1998; Blanchflower, 2000; Blanchflower, Oswald and Stutzer, 2001; Parasuraman and Simmers, 2001; Benz and Frey, 2004, 2008; Bradley and Roberts, 2004). In other words, individuals

4
who are self-employed tend to be more satisfied with their jobs than individuals who work as employees. This is attributed in large part to the strong perception of independence of the self-employed (Hyytinen and Ruuskanen, 2006). It has been emphasized that job satisfaction is an important determinant of the choice between self- and wage-employment (Taylor, 1996; Blanchflower 2000, 2004) and a strong predictor of self-employment exits (Georgellis, Sessions and Tsitsianis, 2007). Job dissatisfaction has also been found to be a factor that pushes employees into self-employment, because individuals who are dissatisfied with their jobs are more likely to seek alternatives to being paid-employees (Brockhaus, 1980). The fact that job satisfaction is a heterogeneous phenomenon should be taken into account: It may assess satisfaction with both financial and non-financial benefits and different people can mean different things when they evaluate the extent of satisfaction with their job. Previous studies have generally failed to consider such a heterogeneous aspect of job satisfaction. In this paper we take the heterogeneity of job satisfaction into account by distinguishing between two types of job satisfaction: job satisfaction with the type of work and job satisfaction with job security. While previous studies usually do not take the heterogeneity of job satisfaction into account, some studies have considered different job aspects such as (satisfaction with) job security and type of work as determinants of overall job satisfaction in comparing the self-employed with employees (Taylor, 1996; Green and Tsitsianis, 2005; Benz and Frey, 2008). Such work-related aspects are found to contribute to overall job satisfaction of workers (Green and Tsitsianis, 2005; Benz and Frey, 2008). Also, it is observed that people who place high value on job security prefer paid-employment over self-employment, while the reverse is true for people who are attracted to a certain occupation by the type of work (Taylor, 1996). However, these studies provide no insight into determinants of different types of job satisfaction. We are familiar with one study that analyzes some determinants of several types of job satisfaction among employees (Origo and Pagani, 2009), but this study does not include the self-employed in the analysis. Hence it is not possible to compare the two groups of workers. Taking all this into account, the current study will compare self-reported levels of job satisfaction in terms of type of work and job security among the self-employed and paid employees. Since autonomy and independence are common motives for becoming self-employed, one would expect that the self-employed have more freedom in determining the type of work. This leads to our first hypothesis: Hypothesis 1: The self-employed are more satisfied than paid employees with their present job in
terms of type of work. However, job security can be expected to be lower for the self-employed as compared to employees. The self-employed tend to have lower social security or employment protection (European Commission, 2004). Also, for self-employed individuals the risk of failure is quite high, in particular in the start-up phase. Approximately 50 to 60 percent of new business start-ups survive the first three years of activity (Eurostat, 2004). The risk of business failure is much higher than the risk of becoming unemployed. Therefore, our second hypothesis is: Hypothesis 2: The self-employed are less satisfied than paid employees with their present job in terms
of job security The main objective of this paper is to test the validity of these hypotheses. In addition, we explore whether the two types of job satisfaction have different determinants comparing the self-employed and employees. We will not make an a priori list of additional hypotheses given the large number of determinants we investigate.

5
3. DATA, VARIABLES AND METHODOLOGY We use data from the European Community Household Panel (ECHP) covering the period 1994-2001.1 The ECHP is a standardized multi-purpose annual longitudinal survey carried out at the level of the EU-15.2 It was designed and coordinated by the Statistical Office of the European Communities (Eurostat).The target population of the ECHP consists of people living in private households throughout the national territory of each country. The definition of household is based on the standard criteria of “sharing the same dwelling” and “common living arrangements”. Individuals in the sample who move or join a new household are followed up at their new location. Lastly, the survey also covers all persons cohabiting with any of the original sample persons in the same household. These rules are followed to reflect the demographic changes in the population and to maintain the panels’ cross-sectional representativeness of the population.3 Each year all members of the selected households in the participating countries are interviewed about issues relating to demographics, labor market characteristics, income and living conditions. The same questionnaire is used in all countries, which makes the information directly comparable. The first wave of data collection was held in 1994. We have information on 60,500 nationally representative households, i.e. approximately 130,000 individuals aged 16 years and older, for the entire period 1994-2001. To investigate whether the self-employed are more satisfied or less satisfied with their job in terms of type of work and job security and to investigate determinants of the two types of job satisfaction among the self-employed and employees, we use ordered logit models. To avoid violation of the proportional odds assumption (also called parallel regressions assumption, or parallel lines assumption) we apply generalized ordered logit models.4 Within this framework, an individual’s self-reported job satisfaction (sati) is interpreted as an ordinal indicator of a latent wellbeing variable (WBi), which is unobservable. Our dependent variables are job satisfaction in terms of type of work and job satisfaction in terms of job security. These variables range from 1 to 6 and equal 1 for individuals who are not satisfied with their present job and 6 for those being fully satisfied with their job. The dependent variable has been reclassified into three values for job satisfaction: (1) dissatisfied, (2) neither dissatisfied nor satisfied, (3) satisfied.5 The relationship between self-reported job satisfaction (sati) and the latent variable (WBi) is given by
11 ii WBifsat
212 ii WBifsat
ii WBifsat 23
where 1 and 2 are the thresholds of the variable WBi that divide its range into separate intervals associated with the different levels of job satisfaction. The generalized ordered logit model can be written as
1 ECHP data are used with the permission of Eurostat (contract ECHP/2006/09 with the Universidad de Huelva). 2 Information concerning job satisfaction for Sweden was not collected in any way. 3 See Peracchi (2002) for a review of the organization of the survey, and a discussion of the issues a researcher may face
when using these data. 4 Different tests of the proportional-odds assumption (whether the coefficients are equal across categories) have been
performed for all our estimations (global test of whether any variable violates the parallel lines assumption). All these tests provided evidence that the parallel regression assumption was violated and, as a consequence, demonstrate the need to apply generalized ordered logit models. See Williams (2006) for a complete description of the methodology.
5 There are two reasons for doing this: first, in most cases, there are only few observations in the low satisfaction scales. A second reason for recoding is that we assume that there is quite a bit of “noise” in detailed scales. This can be illustrated using the following - much-cited - example: people usually know if they are tall or short; they may, however, have difficulties in classifying themselves as very short or extremely short.

6
211
,j,)Xexp(
)Xexp()X(gjsatPr
jij
jijji
where the vector Xi represents individual and firm-specific characteristics and economic conditions;
j is the associated vector of coefficients to be estimated6; and ·g is specified as the logistic
cumulative distribution function. It can be determined that the probabilities that sati will take on each of the values 1, 2 and 3 is equal to
)X(gsatPr ii 111 )X(g)X(gsatPr iii 212
)X(gsatPr ii 23
In the analyses we include a large number of individual-specific independent variables such as demographic indicators (e.g. gender, age), level of education, job status, years of employment experience, hours of work per week, previous spell(s) of unemployment and level of earnings. For comparability purposes, incomes are corrected by purchasing power parities (comparability across countries) and harmonized consumer price indexes are used (comparability across time). Furthermore, we control for firm-specific indicators such as firm size and sector of industry. Harmonized national unemployment rates from the OECD are also included in an attempt to capture the state of the European economy in the period under study.7 For the purpose of this study, the estimation strategy will first be to explore the determinants of job satisfaction on the full sample of workers, while including a self-employed dummy taking the value 1 for those being self-employed and taking the value 0 for those being wage employed. This allows us to test whether there are significant differences on reported job satisfaction levels between the self-employed and the paid-employed. In addition, to explore whether the determinants of job satisfaction differ for the self-employed and employees, separate estimations are conducted for both groups of workers. See the Appendix for a full description of the variables used. Since the ECHP tracks the same individuals from 1994 to 2001, standard errors are adjusted for intra-individual correlation in order to control for the possible existence of unobserved heterogeneity. The individuals in our dataset are asked about their main activity status (paid-employment, self-employment, unpaid work in a family enterprise, education or training, unemployment or inactivity). From this self-reported information we construct our dataset by including men and women aged 18 to 65 working either part-time or full-time in any business sector either as paid-employees or self-employed.8 Workers in the public sector are excluded from our analysis for comparability purposes between paid and self-employed individual.9 After filtering, the final sample used for estimation contains 225,019 observations (62,652 individuals) with 59,604 (26.5 percent) observations referring to self-employment. Table 1 below presents some descriptive information about our sample.
6 The formulas for the parallel lines model and generalized ordered logit model are the same, except that in the parallel lines
model the Betas (but not the Alphas) are the same for all values of j. 7 Variable definitions are reported in the Appendix. 8 Individuals are forced to choose only one main occupation, either working for an employer in paid employment, or working
as a self-employed. Since no information is collected about secondary activities, we cannot identify whether some individuals combine both self- and paid-employment. When running our estimations, however, the exclusion of part-time workers (who might combine both activities) does not affect our results in any significant way. Therefore, our results seem to be robust to the presence of these special cases.
9 We exclude workers in the public sector from the analysis because determinants of occupational choice and job satisfaction among public sector workers deviate from those of private sector workers. This is related to several factors such as a relatively lower workload for public sector workers and a motivation to serve the community (Francois, 2000; Glazer, 2004; Besley and Ghatak, 2005; Prendergast, 2007; Delfgaauw and Dur, 2008, 2009).

7
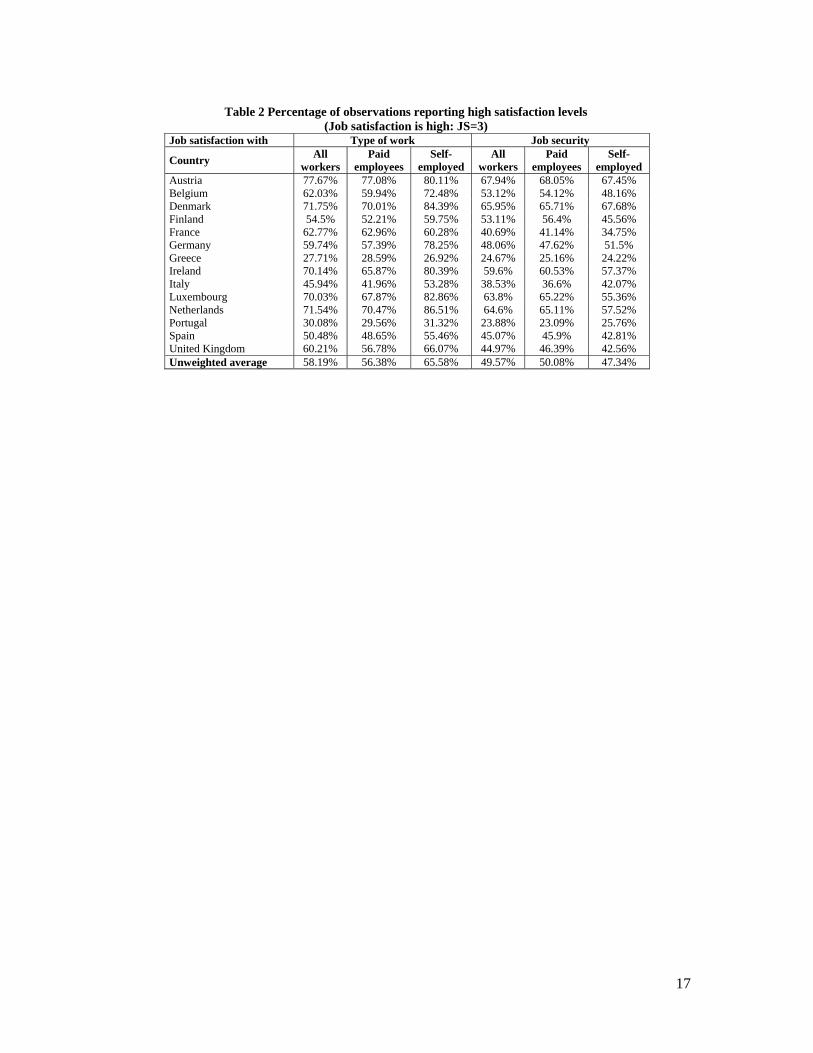
--- Table 1 --- Table 1 reveals that participation of females in the labor market is still rather low, especially with respect to participation in self-employment. It can also be observed that self-employed individuals are on average 7 years older than their paid-employee counterparts. Furthermore, paid-employees have received higher levels of education than self-employed individuals. Concerning business sectors, our descriptive results show how self-employment is the natural employment status in the agricultural industries. Finally, on average, self-employed individuals work 10 hours longer, earn €1,900 less and present more unequal incomes (22.01 against 9.46 in terms of standard deviation for annual earnings) as compared to paid-employees. Reported levels of job satisfaction among self-employed and paid-employed individuals are presented in table 2. --- Table 2 --- Table 2 shows that on average self-employed individuals report higher levels of satisfaction with the type of work and lower levels of satisfaction with job security than their paid-employee counterparts. These figures, however, as illustrated in Table 2, do not hold for some countries. In France and Greece, for example, the percentage of respondents that report high job satisfaction with regard to the type of work is lower for the self-employed as compared to the paid-employed. Also it can be seen that self-employed individuals in Denmark, Germany, Italy and Portugal report having a high level of satisfaction with respect to job security more often than paid employees.
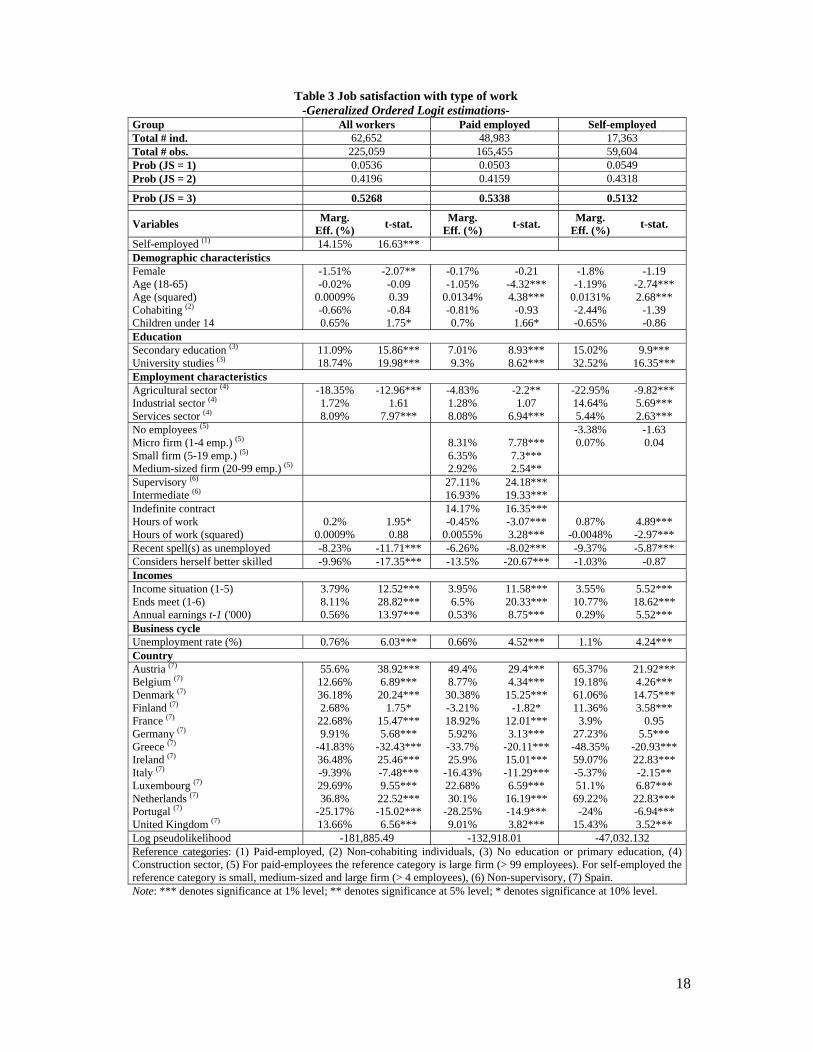
4. RESULTS This section presents the main results of the empirical analyses. Our results are not directly comparable to previous literature for two reasons. First, the existing literature (which includes self-employment in the analysis) is scarce. Second, and more importantly, previous results refer to a global measure of job satisfaction which is not directly comparable with our two different measures capturing separate aspects of job satisfaction (type of work and job security), as discussed above in sections 1 and 2. For this reason we will simply describe our results and will not make a comparison with previous results in this section. We will present our results as follows. First, the results for the estimates of the probability of being satisfied with a present job in terms of the type of work for all workers (both self-employed and employees) as well as for self-employed individuals and employees separately will be presented in table 3 and discussed in subsection 4.1. Subsequently, subsection 4.2 discusses the results of predicted probabilities for both groups of workers using satisfaction with a present job in terms of job security as the dependent variable. The results for these estimates are presented in table 4. In a three-column format, both table 3 and table 4 present results for all workers (both self-employed and employees) in the first column and for paid-employed and self-employed individuals separately (respectively in the second and third columns). At the top of each column, the number of individuals and observations involved in the estimations are reported. Then, for each possible level of job satisfaction (1 = dissatisfied, 2 = neither dissatisfied nor satisfied, 3 = satisfied), predicted probabilities of job satisfaction for the sample means are shown. Below, for clarity of presentation and discussion of the results, only the effects of the explanatory variables on the probability that individuals are satisfied with their job (job satisfaction equals 3) are presented in terms of marginal effects (and not coefficients). These marginal effects are expressed in relative terms (with respect to the predicted probabilities for the sample means). Finally, t-statistics associated with marginal effects are also reported in each column.

8
4.1 Satisfaction with present job in terms of type of work The first column in table 3 presents results for satisfaction with the present job in terms of the type of work as the dependent variable including all workers (both self-employed and employees). In accordance with hypothesis 1, the self-employment dummy reveals that the self-employed are more satisfied with their jobs in terms of type of work than employees. To be precise, we observe a 14% increase of the probability of being satisfied with the type of work in case of being self-employed. The magnitude of this marginal effect justifies a separate analysis for self-employed individuals and employees, which is presented in the second and third columns of table 3. --- Table 3 --- With respect to demographic characteristics, a number of factors such as gender, cohabitation status and the number of children under 14, do not matter for determining job satisfaction for either the paid-employed or the self-employed. Furthermore, the findings indicate that for both groups of workers the relationship between age and the probability of being satisfied seems to be non-linear, showing a U-shaped pattern which reaches the lower probability at the age of 40 for employees and at the age of 46 for the self-employed. Regarding education, the findings indicate that education matters among both groups of workers in the sense that those who received secondary schooling or university education are more likely to be satisfied with the type of work as compared to those who received only primary education or no schooling at all. This effect is especially relevant in the case of self-employed individuals. For self-employed individuals with a university education, the predicted probability of being satisfied with the type of work increases by approximately 33%, while the increase amounts to only 9% for employees. Several employment characteristics are considered in the estimation. For both groups of workers and in comparison to individuals working in other industries, those working in agriculture are less likely to be satisfied with the type of work. This effect is stronger for self-employed individuals than for employees. Regarding firm size, we find that those employees working in micro, small and medium-sized firms are more likely to be satisfied with the type of work than those working in large firms (> 99 employees). For self-employed individuals, however, being a self-employed individual without employees marginally reduces the likelihood of being satisfied, compared with those who hire employees. Furthermore, employees having a supervisory or an intermediate job status (as compared to having a non-supervisory role) are more likely to be satisfied. Also, employees with indefinite contracts are more likely to be satisfied in terms of type of work. Employees working longer hours display a negative (non-linear) association with satisfaction with the type of work. Conversely, however, those self-employed individuals working longer hours are more likely to be satisfied with their type of work. With respect to a recent unemployment (after 1989) experience, it appears that such past experience seems to decrease satisfaction with the type of work for all workers (both employees and the self-employed). Furthermore, those employees who think they have the skills or qualifications to do a more demanding job than they currently do are less likely to be satisfied with the type of work. The same does not hold true, however, for self-employed individuals. We also explored the impact of several income characteristics on job satisfaction. For both employees and the self-employed, having higher relatively earnings compared to last year, coming from households that more easily make ends meet and having higher work incomes increases the likelihood of being satisfied with the type of work. Regarding the impact of the business cycle, it can be seen that when countries have higher unemployment rates, both employees and self-employed individuals are more likely to be satisfied with the type of work they do. Finally, we also included country dummies. There are hardly any differences between the results for employees and the self-employed. In general, it can be observed that workers from Austria, Denmark, The Netherlands, Ireland and Luxembourg are more likely to report high levels of satisfaction with the
9
type of work than workers from other countries within the EU-15. The reverse is true for workers from Greece, Portugal and Italy. Looking at the magnitude of the marginal effects, it appears that (apart from the country dummies) being self-employed, having finished university studies and secondary education and being active in the services sector are factors of greatest importance for increasing job satisfaction with the type of work, while working in the agricultural sector, recent unemployment spells and perception of better skills have the strongest effect in terms of decreasing satisfaction with the type of work. 4.2 Satisfaction with present job in terms of job security As explained above, we not only focus on job satisfaction in terms of type of work, but also on satisfaction in terms of job security. Table 4 displays the results for satisfaction with the present job in terms of job security as the dependent variable. In line with our second hypothesis, we find that the self-employed are less likely to be satisfied with their present job in terms of job security than paid employees. Our results show that for self-employed individuals, the probability of being satisfied with job security decreases by 9%, which supports the need to run separate analyses for the self-employed and employees. The discussion of these independent estimations is reported below. --- Table 4 --- Regarding demographic characteristics, females (both the self-employed and employees) are significantly less likely to be satisfied in terms of job security than men. Also both middle-aged employees and the self-employed are less likely to be satisfied in terms of job security, reaching the lower probability of being satisfied at the age of 43. Cohabiting is positively related to satisfaction in terms of job security for paid-employees, while it does not seem to have an impact on satisfaction with job security for self-employed individuals. The findings also illustrate that for both the self-employed and employees, the number of children under 14 does not seem to be related to satisfaction in terms of job security. Educational attainment does not matter in determining job satisfaction with the type of work for the self-employed. However, we find that those employees with university studies (as compared to those who received only primary education or no schooling) are less likely to be satisfied in terms of job security. Regarding employment characteristics, workers in the construction sector are less likely to be satisfied with their jobs in terms of job security as compared to workers in any other industry. Furthermore, those employees working in small firms (5-19 employees) are more likely to be satisfied in terms of job security than those in firms of different size. Additionally, self-employed individuals with no employees (own-account workers) and self-employed individuals of firms with less than four employees are less likely to be satisfied in terms of job security than self-employed individuals of larger firms. Also, both having a supervisory and having an intermediate job status (as compared to having a non-supervisory job position) increases the probability of being satisfied in terms of job security for employees. Having an indefinite contract is the strongest predictor of satisfaction with job security for employees. The probability of being satisfied with job security increases by approximately 64% for paid-employees with an indefinite contract. Employees who work longer hours are less likely to be satisfied, while for the self-employed working longer hours is positively associated with satisfaction with job security. Furthermore, those who feel that they have the skills or qualifications to do a more demanding job than they currently do are less likely to be satisfied in terms of job security. The same applies to those who have been recently unemployed. Regarding income, higher relative earnings, a household of making ends meet as well as individual work income are positively related to job security. This is true for both employees and self-employed individuals.

10
With regard to the impact of the business cycle, it appears that a country’s unemployment rate has a negative association with job satisfaction in terms of job security. Finally, with respect to the existence of country-specific effects, again only minor differences are detected between the paid-employed and the self-employed. Overall, we find that workers in Austria, Spain, Ireland, Denmark and Finland are more likely to be satisfied with their jobs in terms of job security than workers from other countries within the EU-15. The reverse is true for workers from Portugal, Greece, France, Germany, the UK, Belgium and Luxembourg. When looking at the marginal effects, it appears that (apart from some strong country-specific effects) individuals working outside of the construction sector and those employees with an indefinite contract are more likely to be satisfied. Furthermore, ease of making ends meet appears to be a relatively strong determinant for increasing satisfaction in terms of job security. Conversely, those who experienced recent spells of unemployment and those self-employed individuals with no employees are less likely to be satisfied.
5. CONCLUSION AND DISCUSSION We investigate whether self-employed individuals display different levels of job satisfaction than employees using a large European survey. Whereas previous studies have mainly dealt with job satisfaction as a homogeneous phenomenon, we distinguish between two types of job satisfaction, i.e. job satisfaction in terms of type of work and job satisfaction in terms of job security. In line with our expectations, we find that the self-employed are more satisfied than paid employees with the type of work and less satisfied with their jobs in terms of job security. These findings suggest that perceptions of the type of work may positively influence the choice individuals have to engage in self-employment, whereas perceptions about job security potentially hinder entry into self-employment. Overall, these findings illustrate that to understand what job satisfaction means, it is important to distinguish between several aspects of job satisfaction. When comparing determinants of job satisfaction among the self-employed and employees using generalized ordered logic regressions we come to an interesting set of conclusions. Our estimations, for example, show that for both employees and the self-employed, education is a determining factor for having a high level of satisfaction with the type of work. More specifically, those who received secondary schooling or university education are more likely to have a high level of satisfaction concerning the type of work they do as compared to those who received no schooling at all. Education, however, seems to play a less important role in determining satisfaction in terms of job security, for self-employed individuals in particular this variable has no impact. Thus, it seems that, while a high level of education may increase one’s opportunities for finding an interesting job in terms of type of work, opportunities for finding a job with high levels of perceived job security cannot be influenced so much by education. The extent of job security is more likely to be determined by other factors such as institutional systems. With respect to industry effects, we find that workers (both self-employed and wage employees) in all industries are more likely than those working in construction to be satisfied with their job in terms of job security. With respect to satisfaction in terms of type of work, workers in the agricultural industries have a lower likelihood to report high satisfaction levels. Thus, workers perceive construction as a particularly unfavorable industry when it comes to job security, and the agricultural sector seems to be especially unpleasant regarding the type of work. Looking at firm size, our results show some interesting differences between the self-employed and paid-employed. Employees who work in micro, small, and medium-sized firms are more likely to be satisfied with the type of work than those working in larger firms. This may imply that employees in smaller firms have more freedom in determining the type of work they do than those in larger firms. For the self-employed, however, the size of the firm increases the likelihood of being satisfied with both type of work and job security. This possibly indicates that self-employed individuals associate a

11
higher number of employees with better survival and growth prospects of the business, which in turn positively affects their perception of type of work and job security. We detect interesting differences between self-employed individuals and paid employees regarding working hours. For both types of job satisfaction, it is found that when paid-employed individuals work longer hours they are less likely to be satisfied, while for self-employed individuals working longer hours is associated with higher levels of job satisfaction. Possibly working longer hours is more of a free choice for the self-employed than for employees and results in positive returns or benefits for the self-employed. It is found that paid employees who have a supervisory or an intermediate job status (as opposed to having a non-supervisory job status) are more likely to be satisfied with their jobs in terms of type of work and job security. This is not surprising as people with supervisory roles are likely to have more freedom in determining the type of work they (and others) do and also have more stable or established positions within firms. A consistent finding among both the self-employed and employees is that those who have experienced recent spells of unemployment tend to be less satisfied with their jobs both in terms of type of work and job security. Possibly these individuals have more limited choices for finding satisfying jobs and are also more aware of the risks of losing one’s job. Furthermore, this negative effect of previous spells of unemployment is particularly strong in the case of satisfaction with job security for self-employed individuals. Many countries and regions have policy initiatives to encourage the unemployed to enter into self-employment (Shutt and Sutherland, 2003; Kluve and Card, 2007). Our findings suggest that individuals who become self-employed after a recent unemployment experience may be insecure about their ability to keep their job or about chances of survival.10 We consistently find that individuals (both the self-employed and employees) from households for which it is easy to make ends meet and in higher levels of work income report higher levels of job satisfaction in terms of type of work and job security. Thus, an individual’s financial position is associated with the evaluation of one’s current job in terms of type of work and job security: people with better financial positions are more satisfied with their jobs. With respect to the impact of the business cycle, a country’s unemployment rate relates positively to job satisfaction in terms of type of work, while it relates negatively to satisfaction in terms of job security. The first finding may reflect that, in case of high unemployment rates, people are simply happy not to be unemployed and therefore report higher levels of satisfaction with the type of work they do. The latter finding implies that, when unemployment rates are higher, job conditions may worsen and people may also be more aware of the risk of losing their job and hence report lower levels of satisfaction with their job in terms of job security. We acknowledge several limitations of our study. For example, we rely on self-reported measures of job satisfaction derived from answers to subjective questions that may be perceived differently by people in different countries (Lévy-Garboua and Montmarquette, 2004; Kristensen and Johansson, 2008). Blanchflower and Freeman (1994) stress that people in one country may “scale” responses differently than those in another. For instance, Americans may be relatively optimistic, with an “everything will work out” mentality that leads people with the same true satisfaction on some objective scale to respond more positively to a “Are you satisfied with your job?” question than the British who tend to be more reserved. Furthermore, the current analysis does not allow us to isolate directions of causality. Lastly, we only focus on entrepreneurship in terms of self-employment and do
10 Previous research reports that those entrepreneurs with previous unemployment experience are less likely to survive as
entrepreneurs (Van Praag, 2003; Millan, Congregado and Roman, 2011). Similarly, other studies indicate that push entrepreneurs are less successful, both in terms of venture success (sales per employee) and personal income than pull entrepreneurs (Amit and Muller, 1995).

12
not distinguish between several engagement levels of the entrepreneurial process (Grilo and Thurik, 2008; Van der Zwan, Thurik and Grilo, 2010). We would like to highlight a number of avenues for future research. It is interesting to explore whether or not higher levels of job satisfaction are associated with higher levels of economic utility over time. It could also be interesting to disentangle more aspects of job satisfaction than the current study takes into account. One could think of satisfaction with the present job in terms of earnings or in terms of working conditions/environment. Furthermore, future research could help to establish whether different aspects of job satisfaction affect the occupational choice between self-employment and paid-employment. Previous studies have provided evidence of job dissatisfaction as a reason for new venture creation (Hisrich and Brush, 1986; Brockhaus, 1980; Cromie and Hayes, 1991). Finally, it is interesting to consider the influence of various labor market institutional factors such as employment protection legislation, unionism and active labor market policies on several types of job satisfaction.

13
REFERENCES
Akerlof, G.A., Rose, A.K., and Yellen, J.L. (1988) Job switching and job satisfaction in the U.S. labor market, Brookings Papers on Economic Activity 2, 495–582;
Acemoglu, D. (1995) Reward Structures and the Allocation of Talent, European Economic Review 39(1), 17-33;
Amit, R. and Muller, E. (1995) “Push” and “pull” entrepreneurship, Journal of Small Business and Entrepreneurship 12 (4), 64-80;
Benz, M. and Frey, B.S. (2004) Being independent raises happiness at work, Swedish Economic Policy Review 11, 95-134;
Benz, M. and Frey, B.S. (2008) Being independent is a great thing: subjective evaluations of self-employment and hierarchy, Economica 75(298), 362-383;
Besley, T. and Ghatak, M. (2005) Competition and incentives with motivated agents, American Economic Review 95(3), 616-636;
Bianchi, M. (2008) Financial development, entrepreneurship and job satisfaction, working paper no 2008 –59 PARIS School of Economics;
Blanchflower, D.G. (2000) Self-employment in OECD countries, Labour Economics 7, 471-505; Blanchflower, D.G. (2004) Self-employment: more may not be better, Swedish Economic Policy
Review, 11(2), 15-74; Blanchflower, D.G. and Freeman, R.B. (1994) Did the Thatcher reforms change British labour market
performance?, in R. Barrell (Ed.), The UK Labour Market. Comparative Aspects and Institutional Developments. Cambridge Univ. Press, Cambridge, England;
Blanchflower, D.G. and Oswald, A.J. (1998) What makes an entrepreneur? Journal of Labor Economics 16(1), 26‐60;
Blanchflower, D.G. and Oswald, A.J. (1999) Well-being, insecurity and the decline of American job satisfaction, working paper, Dartmouth College, Hanover, NH;
Blanchflower, D.G., Oswald, A.J. and Stutzer, A. (2001) Latent entrepreneurship across nations, European Economic Review 45(4-6), 680-691;
Borjas, G.J. (1979) Job satisfaction, wages and unions, Journal of Human Resources 14, 21–40; Bradley, D.E. and Roberts, J.A. (2004) Self-employment and job satisfaction: Investigating the role of
self-efficacy, depression and seniority, Journal of Small Business Management 42(1), 37-58; Brockhaus, R.H. (1980) The effect of job dissatisfaction on the decision to start a business, Journal of
Small Business Management 18, 37-43; Brown, S. P. and Lam, S. K. (2008) A meta-analysis of relationships linking employee satisfaction to
customer responses, Journal of Retailing 84(3), 243–255; Clark, A.E. (1996) Job satisfaction in Britain, British Journal of Industrial Relations 34(2), 189–217; Clark, A.E. (1997). Job satisfaction and gender: Why are women so happy at work? Labour
Economics, 4(4), 341-372; Clark, A.E. (2001) What really matters in a job? Hedonic measurement using quit data, Labour
Economics 8, 223–242; Clark, A.E., Georgellis, Y. and Sanfey, P. (1998) Job satisfaction, wage changes and quits: Evidence
from Germany, Research in Labor Economics 17, 95–121; Clark, A.E. and Oswald, A.J. (1994) Unhappiness and unemployment, Economic Journal 104, 648–
659; Clark, A.E. and Oswald, A.J. (1996) Satisfaction and comparison income, Journal of Public
Economics 61(3), 359-381; Cromie, S. and Hayes, J. (1991) Business ownership as a means of overcoming job dissatisfaction,
Personnel Review 20, 19-24; Delfgaauw, J. and Dur, R. (2008) Incentives and Workers Motivation in the Public Sector, Economic
Journal 118, 171-191; Delfgaauw, J. and Dur, R. (2009) From public monopsony to competitive market: more efficiency but
higher prices, Oxford Economic Papers 61(3), 586-602; European Commission. (2004) Second Career. Overcoming the Obstacles Faced by Dependent
Employees Who Want to Become Self-Employed and/or Start their own Business, European Commission, Brussels;
14
Eurostat. (2004) Business Demography in Europe. Results for 10 Member States and Norway, Eurostat, Luxembourg;
Francois, P. (2000) Public service motivation as an argument for government provision, Journal of Public Economics 78(3), 275-299;
Prendergast, C. (2007) The motivation and bias of bureaucrats, American Economic Review, vol. 97(1), pp. 180-196;
Freeman, R.B. (1978) Job satisfaction as an economic variable, American Economic Review 68, 135–141;
Georgellis, Y., Sessions, J.G. and Tsitsianis, N. (2007) Pecuniary and non-pecuniary aspects of self-employment survival, Quarterly Review of Economics and Finance 47(1), 94-112;
Glazer, A. (2004) Motivating devoted workers, International Journal of Industrial Organization 22(3), 427-440;
Green, F. and Tsisianis, N. (2005) An investigation of national trends in job satisfaction in Britain and Germany, British Journal of Industrial Relations 43(3), 401-429;
Grilo, I. and Thurik, A.R. (2008) Determinants of entrepreneurial engagement levels in Europe and the US, Industrial and Corporate Change 17(6), 1113-1145;
Hamermesh, D.S. (1977) Economic aspects of job satisfaction, in O. Ashenfelter and W. Oates (Eds.), Essays in Labor Market Analysis. Wiley, New York;
Hamilton, B.H. (2000) Does entrepreneurship pay? An empirical analysis of the returns to self-employment, Journal of Political Economy 108(3), 604-631;
Hisrich, R.D. and Brush, C. (1986) Characteristics of the minority entrepreneur, Journal of Small Business Management 24, 1-8;
Hundley, G. (2001) Why and when are the self-employed more satisfied with their work? Industrial Relations 40(2), 293-316;
Hyytinen, A. and Ruuskanen, O-P. (2006) What makes an entrepreneur independent? Evidence from time use survey, discussion papers no. 1029 The research institute of the Finnish Economy;
Kluve, J. and Card, D. (Eds.), (2007). Active labor market policies in Europe: performance and perspectives. Springer Verlag, Berlin Heidelberg, 2007;
Kristensen, N. and Johansson, E. (2008) New evidence on cross-country differences in job satisfaction using anchoring vignettes, Labour Economics 15, 96-117;
Koys, D.J. (2001) The effects of employee satisfaction, organizational citizenship behavior, and turnover on organizational effectiveness: a unit-level, longitudinal study, Personnel Psychology 54 (1), 101-114;
Lévy-Garboua, L. and Montmarquette, C. (2004) Reported job satisfaction: what does it mean? Journal of Socio-Economics 33, 135-151;
Lévy-Garboua, L., Montmarquette, C. and Simonnet, V. (2007) Job satisfaction and quits, Labour Economics 14, 251-268;
Lusch, R.F. and Serpkenci, R.R. (1990) Personal differences, job tension, job outcomes, and store, Journal of Marketing 54(1), 85-101;
Meng, R. (1990) The relationship between unions and job satisfaction, Applied Economics 22, 1635–1648;
Millán, J.M., Congregado, E. and Román, C. (2011) Determinants of self-employment survival in Europe. Small Business Economics (forthcoming). doi: 10.1007/s11187-010-9260-0;
Muñoz de Bustillo Llorente, R. and Fernández Macías, E. (2005) Job satisfaction as an indicator of the quality of work, The Journal of Socio-Economics 34, 656-673;
Noorderhaven, N., Thurik, A.R., Wennekers, A.R.M. and Van Stel, A.J. (2004) The role of dissatisfaction and per capita income in explaining self-employment across 15 European countries, Entrepreneurship Theory and Practice 28(5), 447-466;
Origo, F. and Pagini, L. (2009) Flexicurity and job satisfaction in Europe: The importance of perceived and actual job satisfaction for well being at work, Labour Economics 16, 547-555;
Ostroff, C. (1992) The relationship between satisfaction, attitudes, and performance: an organizational level analysis, Journal of Applied Psychology 77(6), 963-974;
Parasuraman, S. and Simmers, C.A. (2001) Type of employment, work-family conflict and well-being: A comparative study, Journal of Organizational Behavior 22(5), 551-568;

15
Parker, S.C. (2009) The Economics of Entrepreneurship. Cambridge University Press, Cambridge, UK;
Peracchi, F. (2002). The European Community Household Panel: a review, Empirical Economics, 27, 63-90;
Rogers, J.D., Clow, K.E. and Kash, T.J. (1994) Increasing job satisfaction of service personnel, Journal of Service Management, 8(1), 14-26;
Ryan A.M, Schmit M.J and Johnson R. (1996) Attitudes and effectiveness: examining relations at an organizational level, Personnel Psychology 49(4), 853-882;
Shutt, J. and Sutherland, J. (2003) Encouraging the transition into self-employment, Regional Studies 37(1), 97-103;
Sousa-Poza, A. and Sousa-Poza, A. (2000) Well-being at work: a cross-national analysis of the levels and determinants of job satisfaction, Journal of Socio-Economics 29(6), 517-538;
Taylor, M.P. (1996) Earnings, independence or unemployment: Why become self-employed? Oxford Bulletin of Economics and Statistics 58(2), 253-266;
Van der Zwan, P. Thurik, A.R. and Grilo, I. (2010) The entrepreneurial ladder and its determinants, Applied Economics 42(17), 2183-2191.
Van Praag, C.M. (1999) Some classic views on entrepreneurship, De Economist 147(3), 311-335; Van Praag, C.M. (2003) Business survival and success of young small business owners. Small
Business Economics, 21, 1-17; Van Praag, C.M. and Versloot, P.H. (2007) What is the value of entrepreneurship? A review of recent
research, Small Business Economics 29, 351-382; Verheul, I., Wennekers, A.R.M., Audretsch, D.B. and Thurik, A.R. (2002) An Eclectic Theory of
Entrepreneurship, in: D.B. Audretsch, A.R. Thurik, I. Verheul and A.R.M. Wennekers (Eds), Entrepreneurship: Determinants and Policy in a European-US Comparison. Kluwer Academic Publishers, Boston/ Dordrecht, 11-81;
Vroom, V. (1964) Work and Motivation. Wiley, New York, US; Williams, R. (2006) Generalized ordered logit/partial proportional odds models for ordinal dependent
variables, Stata Journal 6(1), 58-82.

16
TABLES
Table 1. Descriptive statistics Group All workers Paid employees Self-employed Number of observations 225,059 165,455 59,604 Number of individuals 62,652 48,983 17,363 Job Satisfaction with type of work JS with type of work = 1 7.49% 7.14% 8.46% JS with type of work = 2 40.17% 39.97% 40.75% JS with type of work = 3 52.34% 52.89% 50.79% Job Satisfaction with job security JS with job security = 1 13.43% 12.67% 15.54% JS with job security = 2 41.87% 40.73% 45.04% JS with job security = 3 44.70% 46.61% 39.42% Demographic characteristics Female 34.89% 37.6% 27.39% Age (18-65) 39.05 (11.25) 37.23 (10.78) 44.09 (10.99) Cohabiting (2) 73.45% 70.54% 81.52% Children under 14 0.62 (0.9) 0.61 (0.89) 0.63 (0.93) Education No education or primary education 49.25% 46.34% 57.35% Secondary education 35.07% 37.51% 28.3% University studies 15.68% 16.16% 14.35% Employment characteristics Agricultural sector 10.17% 3.2% 29.5% Industrial sector 26.86% 32.64% 10.8% Construction sector 11.02% 11.12% 10.76% Services sector 51.95% 53.03% 48.94% No employees 52.51% Micro firm (1-4 employees) 17.57% 35.96% Small firm (5-19 employees) 42.01% 10.2% Medium-sized firm (20-99 employees)
10.41% 0.59%
Large firm (> 99 employees) 30.01% 0.74% Hours of work 42.63 (11.88) 39.89 (8.92) 50.26 (15.27) Supervisory 10.76% Intermediate 14.45% Non-supervisory 74.79% Indefinite contract 82.8% Recent spell(s) as unemployed 35.23% 40.26% 21.28% Considers herself better skilled 50.69% 53.79% 42.1% Incomes Income situation (1-5) 2.95 (0.86) 3 (0.86) 2.82 (0.84) Ends meet (1-6) 3.44 (1.21) 3.49 (1.21) 3.29 (1.18) Annual earnings t-1 ('000) 12.2 (13.96) 12.69 (9.46) 10.82 (22.01) Country Austria 6.88% 7.54% 5.02% Belgium 3.83% 4.34% 2.41% Denmark 4.61% 5.51% 2.11% Finland 4.63% 4.38% 5.31% France 5.94% 7.5% 1.58% Germany 3.54% 4.27% 1.51% Greece 10.53% 6.77% 20.98% Ireland 5.75% 5.52% 6.38% Italy 14.44% 12.73% 19.19% Luxembourg 0.86% 1% 0.47% Netherlands 8.57% 10.88% 2.16% Portugal 14.17% 13.59% 15.78% Spain 14.58% 14.52% 14.76% United Kingdom 1.67% 1.43% 2.33% Note: standard deviations for continuous explanatory variables in parentheses
17
Table 2 Percentage of observations reporting high satisfaction levels
(Job satisfaction is high: JS=3) Job satisfaction with Type of work Job security
Country All
workers Paid
employees Self-
employed All
workers Paid
employees Self-
employed Austria 77.67% 77.08% 80.11% 67.94% 68.05% 67.45% Belgium 62.03% 59.94% 72.48% 53.12% 54.12% 48.16% Denmark 71.75% 70.01% 84.39% 65.95% 65.71% 67.68% Finland 54.5% 52.21% 59.75% 53.11% 56.4% 45.56% France 62.77% 62.96% 60.28% 40.69% 41.14% 34.75% Germany 59.74% 57.39% 78.25% 48.06% 47.62% 51.5% Greece 27.71% 28.59% 26.92% 24.67% 25.16% 24.22% Ireland 70.14% 65.87% 80.39% 59.6% 60.53% 57.37% Italy 45.94% 41.96% 53.28% 38.53% 36.6% 42.07% Luxembourg 70.03% 67.87% 82.86% 63.8% 65.22% 55.36% Netherlands 71.54% 70.47% 86.51% 64.6% 65.11% 57.52% Portugal 30.08% 29.56% 31.32% 23.88% 23.09% 25.76% Spain 50.48% 48.65% 55.46% 45.07% 45.9% 42.81% United Kingdom 60.21% 56.78% 66.07% 44.97% 46.39% 42.56% Unweighted average 58.19% 56.38% 65.58% 49.57% 50.08% 47.34%
18
Table 3 Job satisfaction with type of work -Generalized Ordered Logit estimations-
Group All workers Paid employed Self-employed Total # ind. 62,652 48,983 17,363 Total # obs. 225,059 165,455 59,604 Prob (JS = 1) 0.0536 0.0503 0.0549 Prob (JS = 2) 0.4196 0.4159 0.4318
Prob (JS = 3) 0.5268 0.5338 0.5132
Variables Marg.
Eff. (%) t-stat.
Marg. Eff. (%)
t-stat. Marg.
Eff. (%) t-stat.
Self-employed (1) 14.15% 16.63*** Demographic characteristics Female -1.51% -2.07** -0.17% -0.21 -1.8% -1.19 Age (18-65) -0.02% -0.09 -1.05% -4.32*** -1.19% -2.74*** Age (squared) 0.0009% 0.39 0.0134% 4.38*** 0.0131% 2.68*** Cohabiting (2) -0.66% -0.84 -0.81% -0.93 -2.44% -1.39 Children under 14 0.65% 1.75* 0.7% 1.66* -0.65% -0.86 Education Secondary education (3) 11.09% 15.86*** 7.01% 8.93*** 15.02% 9.9*** University studies (3) 18.74% 19.98*** 9.3% 8.62*** 32.52% 16.35*** Employment characteristics Agricultural sector (4) -18.35% -12.96*** -4.83% -2.2** -22.95% -9.82*** Industrial sector (4) 1.72% 1.61 1.28% 1.07 14.64% 5.69*** Services sector (4) 8.09% 7.97*** 8.08% 6.94*** 5.44% 2.63*** No employees (5) -3.38% -1.63 Micro firm (1-4 emp.) (5) 8.31% 7.78*** 0.07% 0.04 Small firm (5-19 emp.) (5) 6.35% 7.3*** Medium-sized firm (20-99 emp.) (5) 2.92% 2.54** Supervisory (6) 27.11% 24.18*** Intermediate (6) 16.93% 19.33*** Indefinite contract 14.17% 16.35*** Hours of work 0.2% 1.95* -0.45% -3.07*** 0.87% 4.89*** Hours of work (squared) 0.0009% 0.88 0.0055% 3.28*** -0.0048% -2.97*** Recent spell(s) as unemployed -8.23% -11.71*** -6.26% -8.02*** -9.37% -5.87*** Considers herself better skilled -9.96% -17.35*** -13.5% -20.67*** -1.03% -0.87 Incomes Income situation (1-5) 3.79% 12.52*** 3.95% 11.58*** 3.55% 5.52*** Ends meet (1-6) 8.11% 28.82*** 6.5% 20.33*** 10.77% 18.62*** Annual earnings t-1 ('000) 0.56% 13.97*** 0.53% 8.75*** 0.29% 5.52*** Business cycle Unemployment rate (%) 0.76% 6.03*** 0.66% 4.52*** 1.1% 4.24*** Country Austria (7) 55.6% 38.92*** 49.4% 29.4*** 65.37% 21.92*** Belgium (7) 12.66% 6.89*** 8.77% 4.34*** 19.18% 4.26*** Denmark (7) 36.18% 20.24*** 30.38% 15.25*** 61.06% 14.75*** Finland (7) 2.68% 1.75* -3.21% -1.82* 11.36% 3.58*** France (7) 22.68% 15.47*** 18.92% 12.01*** 3.9% 0.95 Germany (7) 9.91% 5.68*** 5.92% 3.13*** 27.23% 5.5*** Greece (7) -41.83% -32.43*** -33.7% -20.11*** -48.35% -20.93*** Ireland (7) 36.48% 25.46*** 25.9% 15.01*** 59.07% 22.83*** Italy (7) -9.39% -7.48*** -16.43% -11.29*** -5.37% -2.15** Luxembourg (7) 29.69% 9.55*** 22.68% 6.59*** 51.1% 6.87*** Netherlands (7) 36.8% 22.52*** 30.1% 16.19*** 69.22% 22.83*** Portugal (7) -25.17% -15.02*** -28.25% -14.9*** -24% -6.94*** United Kingdom (7) 13.66% 6.56*** 9.01% 3.82*** 15.43% 3.52*** Log pseudolikelihood -181,885.49 -132,918.01 -47,032.132 Reference categories: (1) Paid-employed, (2) Non-cohabiting individuals, (3) No education or primary education, (4) Construction sector, (5) For paid-employees the reference category is large firm (> 99 employees). For self-employed the reference category is small, medium-sized and large firm (> 4 employees), (6) Non-supervisory, (7) Spain. Note: *** denotes significance at 1% level; ** denotes significance at 5% level; * denotes significance at 10% level.

19
Table 4 Job satisfaction with job security -Generalized Ordered Logit estimations-
Group All workers Paid employed Self-employed Total # ind. 62,652 48,983 17,363 Total # obs. 225,059 165,455 59,604 Prob (JS = 1) 0.1087 0.922 0.1278 Prob (JS = 2) 0.4516 0.4546 0.4922
Prob (JS = 3) 0.4397 0.4532 0.38
Variables Marg.
Eff. (%) t-stat.
Marg. Eff. (%)
t-stat. Marg.
Eff. (%) t-stat.
Self-employed (1) -9.02% -9.1*** Demographic characteristics Female 6.46% 7.38*** 6.39% 6.42*** 8.16% 4.5*** Age (18-65) -2.16% -9.13*** -4.45% -15.48*** -3.11% -5.89*** Age (squared) 0.0263% 9.14*** 0.0525% 14.57*** 0.0354% 5.99*** Cohabiting (2) 2.89% 3.25*** 1.95% 1.85* 0.01% 0.01 Children under 14 0.5% 1.19 0.41% 0.85 0.21% 0.24 Education Secondary education (3) 1.84% 2.28** -1.41% -1.57 -2.11% -1.16 University studies (3) 0.45% 0.4 -5.6% -4.62*** -0.97% -0.39 Employment characteristics Agricultural sector (4) 15.54% 8.78*** 13.7% 5.01*** 29.03% 10.34*** Industrial sector (4) 13.08% 9.76*** 5.73% 4.03*** 24.16% 7.64*** Services sector (4) 19.48% 15.48*** 15.46% 11.66*** 19.64% 7.78*** No employees (5) -20.62% -8.19*** Micro firm (1-4 emp.) (5) 0.96% 0.77 -7.35% -2.98*** Small firm (5-19 emp.) (5) 2.63% 2.7*** Medium-sized firm (20-99 emp.) (5) 1.05% 0.78 Supervisory (6) 20.87% 14.64*** Intermediate (6) 18.58% 17.35*** Indefinite contract 64.42% 75.18*** Hours of work 0.4% 3.29*** -1.04% -5.86*** 1.14% 5.2*** Hours of work (squared) -0.0002% -0.15 0.0115% 5.71*** -0.0046% -2.31** Recent spell(s) as unemployed -22.71% -28.2*** -14.23% -15.69*** -22.79% -12.79*** Considers herself better skilled -3.56% -5.25*** -3.61% -4.66*** -6.08% -4.48*** Incomes Income situation (1-5) 6.66% 18.6*** 6.34% 15.58*** 9.98% 12.14*** Ends meet (1-6) 11.72% 35.11*** 7.92% 20.78*** 19.49% 27.29*** Annual earnings t-1 ('000) 0.87% 16.57*** 0.71% 10.1*** 0.35% 5.65*** Business cycle Unemployment rate (%) -1.8% -12.13*** -1.9% -10.97*** -1.02% -3.19*** Country Austria (7) 25.76% 10.76*** 2.06% 0.78 42.91% 7.02*** Belgium (7) -10.86% -5.09*** -26% -11.83*** -15.47% -3*** Denmark (7) 15.2% 6.06*** -4.38% -1.66* 44.71% 5.71*** Finland (7) 3.27% 1.89* -6.53% -3.32*** -5.66% -1.57 France (7) -25.73% -15.7*** -43.84% -28.38*** -30.24% -6.19*** Germany (7) -25.14% -13.16*** -39.13% -20.57*** -15.12% -2.7*** Greece (7) -50.3% -38.71*** -55.07% -36.31*** -47.73% -18.5*** Ireland (7) 11.89% 6.19*** -2.92% -1.35 17.14% 4.14*** Italy (7) -25.83% -18.95*** -47.2% -35.73*** -11.94% -4.09*** Luxembourg (7) -9.27% -2.39** -23.38% -5.86*** -25.37% -2.85*** Netherlands (7) 1.89% 0.84 -15.4% -6.49*** 9.79% 1.5 Portugal (7) -60.56% -40.16*** -74.22% -49.79*** -50.39% -14.93*** United Kingdom (7) -22.26% -9.85*** -37.74% -15.98*** -15.85% -3.33*** Log pseudolikelihood -203,212.58 -142,042.81 -54,810.576 Reference categories: (1) Paid-employed, (2) Non-cohabiting individuals, (3) No education or primary education, (4) Construction sector, (5) For paid-employees the reference category is large firm (> 99 employees). For self-employed the reference category is small, medium-sized and large firm (> 4 employees), (6) Non-supervisory, (7) Spain. Note: *** denotes significance at 1% level; ** denotes significance at 5% level; * denotes significance at 10% level.
20
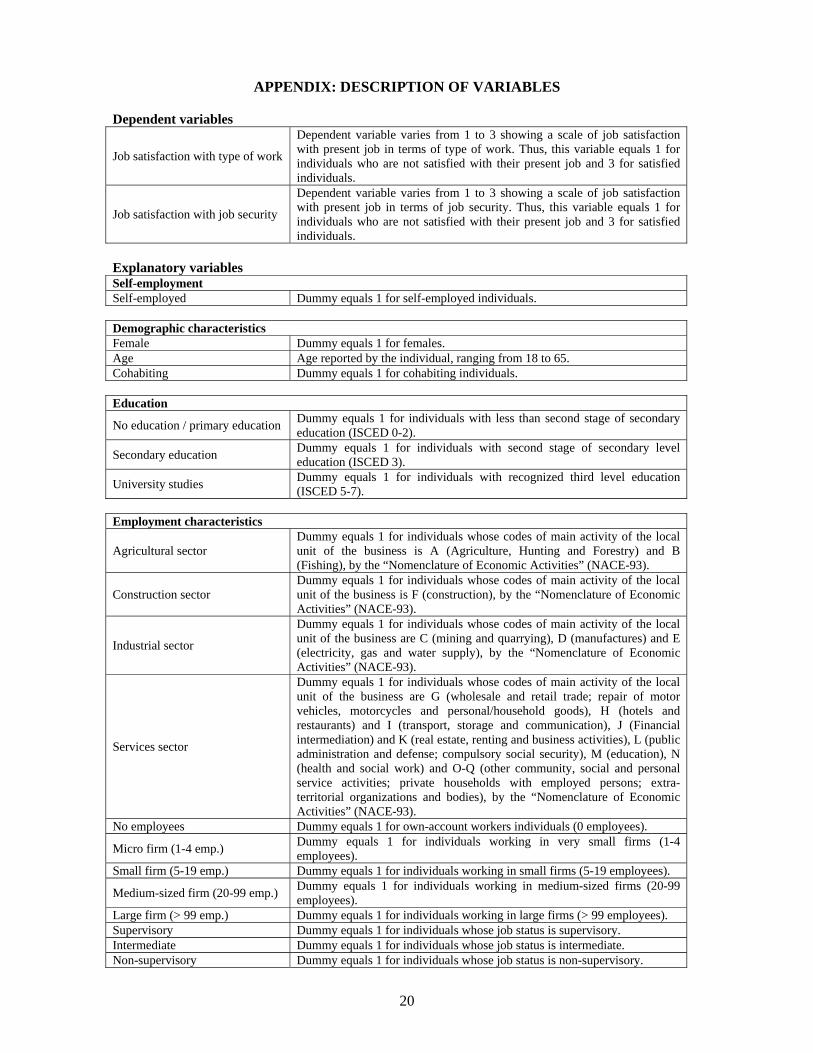
APPENDIX: DESCRIPTION OF VARIABLES Dependent variables
Job satisfaction with type of work
Dependent variable varies from 1 to 3 showing a scale of job satisfaction with present job in terms of type of work. Thus, this variable equals 1 for individuals who are not satisfied with their present job and 3 for satisfied individuals.
Job satisfaction with job security
Dependent variable varies from 1 to 3 showing a scale of job satisfaction with present job in terms of job security. Thus, this variable equals 1 for individuals who are not satisfied with their present job and 3 for satisfied individuals.
Explanatory variables Self-employment Self-employed Dummy equals 1 for self-employed individuals. Demographic characteristics Female Dummy equals 1 for females. Age Age reported by the individual, ranging from 18 to 65. Cohabiting Dummy equals 1 for cohabiting individuals. Education
No education / primary education Dummy equals 1 for individuals with less than second stage of secondary education (ISCED 0-2).
Secondary education Dummy equals 1 for individuals with second stage of secondary level education (ISCED 3).
University studies Dummy equals 1 for individuals with recognized third level education (ISCED 5-7).
Employment characteristics
Agricultural sector Dummy equals 1 for individuals whose codes of main activity of the local unit of the business is A (Agriculture, Hunting and Forestry) and B (Fishing), by the “Nomenclature of Economic Activities” (NACE-93).
Construction sector Dummy equals 1 for individuals whose codes of main activity of the local unit of the business is F (construction), by the “Nomenclature of Economic Activities” (NACE-93).
Industrial sector
Dummy equals 1 for individuals whose codes of main activity of the local unit of the business are C (mining and quarrying), D (manufactures) and E (electricity, gas and water supply), by the “Nomenclature of Economic Activities” (NACE-93).
Services sector
Dummy equals 1 for individuals whose codes of main activity of the local unit of the business are G (wholesale and retail trade; repair of motor vehicles, motorcycles and personal/household goods), H (hotels and restaurants) and I (transport, storage and communication), J (Financial intermediation) and K (real estate, renting and business activities), L (public administration and defense; compulsory social security), M (education), N (health and social work) and O-Q (other community, social and personal service activities; private households with employed persons; extra-territorial organizations and bodies), by the “Nomenclature of Economic Activities” (NACE-93).
No employees Dummy equals 1 for own-account workers individuals (0 employees).
Micro firm (1-4 emp.) Dummy equals 1 for individuals working in very small firms (1-4 employees).
Small firm (5-19 emp.) Dummy equals 1 for individuals working in small firms (5-19 employees).
Medium-sized firm (20-99 emp.) Dummy equals 1 for individuals working in medium-sized firms (20-99 employees).
Large firm (> 99 emp.) Dummy equals 1 for individuals working in large firms (> 99 employees). Supervisory Dummy equals 1 for individuals whose job status is supervisory. Intermediate Dummy equals 1 for individuals whose job status is intermediate. Non-supervisory Dummy equals 1 for individuals whose job status is non-supervisory.

21
Hours of work Hours of work per week. Indefinite contract Dummy equals 1 for workers with indefinite contract.
Recent spell(s) as unemployed Dummy equals 1 for individuals with previous spell(s) as unemployed after 1989.
Considers herself better skilled Dummy equals 1 for individuals who feel they have the skills or qualifications to do a more demanding job than the one they have.
Incomes
Income situation
Variable varies from 1 to 5 showing a scale of income situation compared to last year. Thus, this variable equals 1 for households with relative income situation clearly deteriorated and 5 for households with relative income situation clearly improved.
Ends meet Variable varies from 1 to 6 showing a scale of ability to make ends meet. Thus, this variable equals 1 for households with great difficulty in making ends meet, and 6 for households that very easily make ends meet.
Annual earnings t-1 (‘000)
Net work incomes, either from paid-employment or self-employment, earned during period t-1, converted to thousands of average euros of 1996, having been corrected by Harmonized Consumer Price Index. Furthermore, these incomes are corrected by Purchasing Power Parity (across countries).
Business cycle Unemployment rate Harmonized annual unemployment rate (source: OCDE). Country dummies Dummies equal 1 for individuals living in the named country, and 0 otherwise. The following countries are included: Austria, Belgium, Denmark, Finland, France, Germany, Greece, Ireland, Italy, Luxembourg, Netherlands, Portugal, Spain and United Kingdom.