Determinants of Global Maternal and Neonatal Morbidity and ...
155
Determinants of Global Maternal and Neonatal Morbidity and Mortality Citation Boundy, Ellen O'Neal. 2015. Determinants of Global Maternal and Neonatal Morbidity and Mortality. Doctoral dissertation, Harvard T.H. Chan School of Public Health. Permanent link http://nrs.harvard.edu/urn-3:HUL.InstRepos:16121139 Terms of Use This article was downloaded from Harvard University’s DASH repository, and is made available under the terms and conditions applicable to Other Posted Material, as set forth at http:// nrs.harvard.edu/urn-3:HUL.InstRepos:dash.current.terms-of-use#LAA Share Your Story The Harvard community has made this article openly available. Please share how this access benefits you. Submit a story . Accessibility
Transcript of Determinants of Global Maternal and Neonatal Morbidity and ...

Determinants of Global Maternal and Neonatal Morbidity and Mortality
CitationBoundy, Ellen O'Neal. 2015. Determinants of Global Maternal and Neonatal Morbidity and Mortality. Doctoral dissertation, Harvard T.H. Chan School of Public Health.
Permanent linkhttp://nrs.harvard.edu/urn-3:HUL.InstRepos:16121139
Terms of UseThis article was downloaded from Harvard University’s DASH repository, and is made available under the terms and conditions applicable to Other Posted Material, as set forth at http://nrs.harvard.edu/urn-3:HUL.InstRepos:dash.current.terms-of-use#LAA
Share Your StoryThe Harvard community has made this article openly available.Please share how this access benefits you. Submit a story .
Accessibility

DETERMINANTS OF GLOBAL MATERNAL AND NEONATAL MORBIDITY AND
MORTALITY
ELLEN O’NEAL BOUNDY
A Dissertation Submitted to the Faculty of
The Harvard T.H. Chan School of Public Health
in Partial Fulfillment of the Requirements
for the Degree of Doctor of Science
in the Department of Epidemiology
Harvard University
Boston, Massachusetts.
May 2015

Dissertation Advisor: Dr. Stacey A. Missmer Ellen O’Neal Boundy
Determinants of Global Maternal and Neonatal Morbidity and Mortality
Abstract
In 2013, approximately 289,000 women died from pregnancy-related causes and 2.8 million
newborns died within the first 28 days of life. The vast majority of these deaths occur in resource-limited
settings. This work examines risk and protective factors for the development of several perinatal
complications that put mothers and their infants at risk for adverse health outcomes. We explored
determinants of preeclampsia and gestational hypertension among women in Dar es Salaam, Tanzania.
We also examined the effects of pregnancy spacing intervals on perinatal outcomes in that group of
women. We used log binomial regression to obtain risk ratios and 95% confidence intervals for the
development of the adverse pregnancy outcomes of interest. We also looked at the efficacy of an
intervention aimed at improving neonatal outcomes by conducting a systematic review and meta-analysis
of the effects of kangaroo mother care on neonatal morbidity and mortality.
We found that nulliparity, history of hypertension, urinary tract infection, low calcium intake,
history of preeclampsia, and history of preterm birth were associated with an increased risk of developing
preeclampsia among women in Dar es Salaam. Risk factors for gestational hypertension included a
history of diabetes, elevated blood pressure at study enrollment, increased mid-upper arm circumference,
high hematocrit, low mean corpuscular volume, a history of miscarriage or stillbirth, and older age at first
pregnancy. Twin gestation and increased body mass index were risk factors for both types of hypertensive
disorders of pregnancy among women in Tanzania. After a live birth, inter-pregnancy intervals less than
six months were associated with an increased the risk of having a low birth weight baby in the next
pregnancy; while after a stillbirth, short inter-pregnancy intervals were associated with increased risk of
stillbirth and perinatal death. Providing kangaroo mother care to infants after birth was associated with
ii

decreased neonatal morbidity and mortality and increased likelihood of exclusive breastfeeding when
compared to conventional care.
These findings can help identify women and infants at increased risk for developing pregnancy-
related complications and contribute to informing development of evidence-based maternal, newborn, and
family planning programs and policies.
iii

Table of Contents
Page
Title Page…………………………………………………………………………………………………i
Abstract…………………………………………………………………………………………………..ii
Table of Contents………………………………………………………………………………………..iv
List of Figures……………………………………………………………………………………………vi
List of Tables…………………………………………………………………………………………...viii
Acknowledgments………………………………………………………………………………………..x
Body of Dissertation
Paper One: Risk factors for hypertensive disorders of pregnancy among HIV-negative Tanzanian
women: a prospective study………………………………………………………………………………1
Abstract…………………………………………………………………………………….………2
Background…………………………………………………………………………………..…….3
Methods……………………………………………………………………………………….…...5
Results……………………………………………………………………………………………..9
Discussion………………………………………………………………………………………...18
References………………………………………………………………………………………..23
Paper Two: Inter-pregnancy interval and perinatal outcomes among women in Dar es Salaam,
Tanzania………………………………………………………………………………………………….26
Abstract…………………………………………………………………………………………...27
Background……………………………………………………………………………………….28
Methods…………………………………………………………………………………………..30
Results…………………………………………………………………………………………....34
Discussion………………………………………………………………………………………...42
References………………………………………………………………………………………...45
iv

Table of Contents (Continued)
Paper Three: Kangaroo mother care and neonatal outcomes: a systematic review and meta-
analysis……………………………………………………………………………………………………48
Abstract…………………………………………………………………………………………...49
Background……………………………………………………………………………………….50
Methods………………………………………………………………………………………..….52
Results…………………………………………………………………………………………….55
Discussion………………………………………………………………………………………...71
References………………………………………………………………………………………..74
Supplementary Materials………………………………………………………………………………..88
Supplementary Figures (Paper Three)……………………………………………………………88
Supplementary Tables (Paper Three)……………………………………………………………102
v

List of Figures
Paper Three: Kangaroo mother care and neonatal outcomes: a systematic review and meta-analysis
Figure 3.1 Flow diagram for identification of included studies………………………………….56
Figure 3.2 Forest plot for the effect of KMC compared to conventional care on mortality at latest
follow-up time, grouped by follow-up time……………………………………………………...65
Supplementary Figure 3.1 Forest plot for effect of KMC compared to conventional care on
mortality at latest follow-up time, stratified by skin-to-skin contact initiation criteria…...……...88
Supplementary Figure 3.2 Forest plot for effect of KMC compared to conventional care on
mortality at latest follow-up time, stratified by skin-to-skin contact duration promoted, hours per
day……….......................................................................................................................................89
Supplementary Figure 3.3 Forest plot for effect of KMC compared to conventional care on
exclusive breastfeeding at hospital discharge or 40-41 weeks post-menstrual age………………90
Supplementary Figure 3.4 Forest plot for effect of KMC compared to conventional care on
infection, stratified by infection type……………………………………………………………..91
Supplementary Figure 3.5 Forest plot for effect of KMC compared to conventional care on
mean heart rate, beats per minute………………………………………………………………...92
Supplementary Figure 3.6 Forest plot for effect of KMC compared to conventional care on
mean respiratory rate, breaths per minute………………………………………………………..93
Supplementary Figure 3.7 Forest plot for effect of KMC compared to conventional care on
mean oxygen saturation, percent…………………………………………………………………94
Supplementary Figure 3.8 Forest plot for effect of KMC compared to conventional care on
mean temperature, degrees Celsius……………………………………………………………….95
Supplementary Figure 3.9 Forest plot for effect of KMC compared to conventional care on
mean length of hospital stay, days………………………………………………………………..96
Supplementary Figure 3.10 Forest plot for effect of KMC compared to conventional care on
standardized mean weight gain…………………………………………………………………...97
vi

List of Figures (Continued)
Supplementary Figure 3.11 Forest plot for effect of KMC compared to conventional care on
standardized mean pain score…………………………………………………………………….98
Supplementary Figure 3.12 Risk of bias summary – randomized control trials………….…….99
Supplementary Figure 3.13 Risk of bias summary – observational studies……………….….100
Supplementary Figure 3.14 Funnel plot for effect of KMC compared to conventional care on
mortality at latest follow-up time………………………………………………………………..101
vii

List of Tables
Paper One: Risk factors for hypertensive disorders of pregnancy among HIV-negative Tanzanian
women: a prospective study
Table 1.1 Characteristics of study participants…………………………………………………..10
Table 1.2 Risk factors for preeclampsia………………………………………………………….13
Table 1.3 Risk factors for gestational hypertension……………………………………………...16
Paper Two: Inter-pregnancy interval and perinatal outcome among women in Dar es Salaam,
Tanzania
Table 2.1 Characteristics of participants at study enrollment, by last pregnancy outcome……...35
Table 2.2 Inter-pregnancy interval and perinatal outcomes among women with a live birth last
pregnancy………………………………………………………………………………..……….36
Table 2.3. Inter-pregnancy interval and perinatal outcomes among women with a stillbirth last
pregnancy………………………………………………………………………………..……….39
Paper Three: Kangaroo mother care and neonatal outcomes: a systematic review and meta-analysis
Table 3.1 Characteristics of included studies…………………………………………………….57
Table 3.2 Relative risk (RR) and 95% confidence interval (CI) for the effect of KMC compared
to conventional care on dichotomous neonatal outcomes………………………………………..60
Table 3.3 Mean difference (MD) and 95% confidence interval (CI) for the effect of KMC
compared to conventional care on continuous neonatal outcomes………………………………62
Supplementary Table 3.1 Subgroup analysis and meta-regression for the effect of KMC
compared to conventional care on mortality at latest follow-up………………………………..102
Supplementary Table 3.2 Subgroup analysis and meta-regression for the effect of KMC
compared to conventional care on exclusive breastfeeding during hospital stay or at 40-41weeks
post-menstrual age……………………………………………………………………………...105
viii

List of Tables (Continued)
Supplementary Table 3.3 Subgroup analysis and meta-regression for the effect of KMC
compared to conventional care on infection…………………………………………………….108
Supplementary Table 3.4 Subgroup analysis and meta-regression for the effect of KMC
compared to conventional care on heart rate, beats per minute…………………………………110
Supplementary Table 3.5 Subgroup analysis and meta-regression for the effect of KMC
compared to conventional care on respiratory rate, breaths per minute………………………...112
Supplementary Table 3.6 Subgroup analysis and meta-regression for the effect of KMC
compared to conventional care on oxygen saturation, percent………………………………….114
Supplementary Table 3.7 Subgroup analysis and meta-regression for the effect of KMC
compared to conventional care on temperature, degrees Celsius……………………………….117
Supplementary Table 3.8 Subgroup analysis and meta-regression for the effect of KMC
compared to conventional care on length of hospital stay, days………………………………..120
Supplementary Table 3.9 Subgroup analysis and meta-regression for the effect of KMC
compared to conventional care on weight gain, standardized mean difference………………....123
Supplementary Table 3.10 Subgroup analysis and meta-regression for the effect of KMC
compared to conventional care on pain score, standardized mean difference…………………..126
Supplementary Table 3.11 Risk of bias for randomized control trials………………………...128
Supplementary Table 3.12 Risk of bias for observational studies…………………………….130
Supplementary Table 3.13 Studies included in kangaroo mother care systematic review and
meta-analysis ……………………………………………………………………………………132
ix

Acknowledgments
I would like to express my appreciation and gratitude to my advisor, Dr. Stacey A. Missmer, for the
mentorship and support she has given me all the way from my acceptance into the doctoral program in
epidemiology through the completion of this degree. I would also like to thank my committee members,
Drs. Wafaie W. Fawzi, Ellice Lieberman, and Donna Spiegelman for their insightful and pragmatic
guidance in the development of this dissertation. Dr. Fawzi, your expertise in conducting global health
research and translation of those findings to impact the public’s health is inspiring. I appreciate you
kindly welcoming me into your research group. Dr. Lieberman, I have long admired your work in
maternal and child health and feel fortunate for the opportunity to work with you on these projects and
benefit from your perspective as a fellow clinician turned researcher. Dr. Spiegelman, learning from your
wealth of knowledge in statistical and epidemiologic methods has been instrumental to my development
into an epidemiologist, and I will carry those tools with me long into my career.
In addition, I would like to thank my other co-authors, especially Dr. Grace Chan, whose collaboration on
the meta-analysis paper was invaluable. I would also like to thank my nurse-midwife colleagues at Mount
Auburn Hospital for their encouragement and flexibility which enabled me to continue my clinical work
while pursuing this degree.
Very special thanks go out my family and friends, each of whom has cheered me on in their own way and
helped me keep perspective and a sense of humor throughout this process. In particular I want to thank
my parents who have supported me through every crazy idea, twist, and turn I’ve had in my career and
life paths. Finally, I want to express my deep appreciation for my husband, Chris, who I met during the
first year of my doctoral program and who has been by my side supporting and encouraging me each and
every step of the way since.
x

Title
Risk factors for hypertensive disorders of pregnancy among HIV-negative Tanzanian women: a
prospective study
Authors
Ellen Boundy,1 Donna Spiegelman,
1,2 Ellice Lieberman,
1,4 Stacey A. Missmer,
1,5 Willy Urassa,
6 Fadhlun
M. Alwy,7 Wafaie Fawzi
1,3,8
1Department of Epidemiology, Harvard T.H. Chan School of Public Health, Boston, Massachusetts, USA
2Department of Biostatistics, Harvard T.H. Chan School of Public Health, Boston, Massachusetts, USA
3Department of Nutrition, Harvard T.H. Chan School of Public Health, Boston, Massachusetts, USA
4Department of Pediatric Newborn Medicine, Brigham and Women’s Hospital, Boston, Massachusetts,
US
5Department of Obstetrics, Gynecology, and Reproductive Biology, Brigham and Women’s Hospital and
Harvard Medical School, Boston, Massachusetts, USA
6Department of Microbiology and Immunology, Muhimbili University of Health and Allied Sciences, Dar
es Salaam, Tanzania
7Department of Obstetrics and Gynecology, Muhimbili University of Health and Allied Sciences, Dar es
Salaam, Tanzania
8Department of Global Health and Population, Harvard T.H. Chan School of Public Health, Boston,
Massachusetts, USA
1

Abstract
Objective: Identify risk factors for hypertensive disorders of pregnancy among Tanzanian women
Design: Prospective cohort study
Setting: Dar es Salaam, Tanzania, 2001-2004
Population: 8311 pregnant HIV-negative women enrolled at 12-27 weeks gestational age
Methods: Multivariable relative risk regression models to examine risk factors for preeclampsia and
gestational hypertension.
Outcome Measures: Risk ratios (RR) and 95% confidence intervals (CI) for preeclampsia and
gestational hypertension, compared to women without any hypertensive disorder of pregnancy
Results: Hypertensive disorders were identified in 7.2% of pregnancies. Twin gestation and increased
body mass index were risk factors for both hypertensive disorders. Factors specific to preeclampsia
included nulliparity (RR 1.71; 95% CI 1.03, 2.85), history of hypertension (RR 2.19; 95% CI 1.11, 4.31),
urinary tract infection (RR3.11; 95% CI 1.12, 8.65), low calcium intake (trend test p-value = 0.01),
history of preeclampsia (RR 6.20; 95% CI 2.08, 18.49), and history of preterm birth (RR 2.60; 95% CI
1.03, 6.56). For gestational hypertension alone, risk factors included history of diabetes (RR 5.64; 95% CI
1.26, 25.11), blood pressure ≥ 120/80 at enrollment (RR 1.78; 95% CI 1.23, 2.58), increased mid-upper
arm circumference (trend test p-value = 0.02), high hematocrit (trend test p-value = 0.03), low mean
corpuscular volume (trend test p-value = 0.02), history of miscarriage or stillbirth (RR 1.58; 95% CI 1.07,
2.33), and older age at first pregnancy (trend test p-value = 0.03).
Conclusion: In settings similar to Tanzania, these characteristics may warrant closer antenatal
surveillance. Interventions related to nutrition and diabetes screening should also be considered.
2

Background
Hypertension during pregnancy affects approximately 10% of all pregnant women and has a significant
impact on maternal and neonatal morbidity and mortality in the short and long term.1-3
A 2006 systematic
review of the causes of maternal mortality by the World Health Organization found that hypertensive
disorders are responsible for 2-43% of maternal deaths across countries, and 9.1% of pregnancy-related
deaths in Africa.4 Hypertensive disorders of pregnancy include preeclampsia and gestational hypertension,
or elevated blood pressure before 20 weeks gestation with or without proteinuria, respectively.5 Eclampsia
is defined as onset of seizures in a woman with preeclampsia.5 Preeclampsia alone accounts for 50-
60,000 maternal deaths per year worldwide.6 A recent review of global estimates of preeclampsia and
eclampsia examined 78 datasets and found overall incidence estimates of 4.6% and 1.4% respectively,
with wide variation by region.7 They included seven studies from Africa, with estimates for preeclampsia
incidence of 5.6% and eclampsia incidence of 2.9%.7
The pathophysiological mechanisms of these disorders are not fully understood, and debate persists on
whether gestational hypertension and preeclampsia are two distinct diseases, or one underlying disorder
of progressively increasing severity from mild gestational hypertension to eclampsia.2 Villar et al.
explored risk factors for preeclampsia and gestational hypertension in a large cohort of pregnant women
from Argentina, Cuba, Saudi Arabia, and Thailand in the WHO Antenatal Care Trial in 2006.2 They
found that these hypertensive disorders shared several risk factors including diabetes, renal diseases,
cardiac diseases, previous preeclampsia, urinary tract infections, increased maternal age, twin pregnancy,
and obesity.2 Other risk factors were relevant for only one disease and not the other, including previous
large for gestational age birth, antepartum hemorrhage, and reproductive tract infection increasing the risk
of gestational hypertension, and primiparity increasing risk for preeclampsia. A task force on
hypertension in pregnancy convened by the American College of Obstetrics and Gynecology in 2013
similarly described risk factors for preeclampsia that included primiparity, previous preeclamptic
3

pregnancy, chronic hypertension, renal disease, thrombophilia, multi-fetal pregnancy, in vitro
fertilization, family history of preeclampsia, diabetes, obesity, lupus, and maternal age over 40 years.5
African American race is also known to increase risk for hypertension in pregnancy, but research on this
topic in sub-Saharan African settings has been limited to date.8 The objective of this study was to examine
the incidence and potential risk factors for gestational hypertension and preeclampsia in a cohort of HIV-
seronegative pregnant women in Dar es Salaam, Tanzania.
4

Methods
Study Design and Population
We examined hypertension during pregnancy in data from a double-blind randomized trial of daily
multivitamin versus placebo use during pregnancy among 8428 women attending antenatal clinics in Dar
es Salaam, Tanzania between August 2001 and July 2004.9 Participants in the randomized trial were
between 12 and 27 weeks gestational age at enrollment based on their last menstrual period, tested
antibody negative for human immunodeficiency virus (HIV) at entry, and planned to continue residing in
Dar es Salaam for one year after delivery. All women were given iron and folic acid supplementation at
monthly visits during pregnancy and malaria prophylaxis with sulfadoxine-pyrimethamine (Fansidar) at
20 and 30 weeks gestational age. All participants provided written informed consent. The study was
approved by the institutional review boards at Muhimbili University of Health and Allied Sciences in Dar
es Salaam and at the Harvard School of Public Health in Boston.
Measurements
All women completed a baseline questionnaire that included their socio-demographic characteristics,
medical, and obstetric history. A physician performed a clinical exam, and the woman’s height and
weight were taken by a nurse. Women were scheduled for monthly visits until 32 weeks gestation, then
every two weeks until 36 weeks gestation, then weekly until delivery. Questionnaires were administered
to evaluate interim medical problems, and blood pressure was measured by a nurse at each antenatal visit.
If blood pressure was elevated, the woman’s urine was to be evaluated by laboratory analysis for the
presence of protein to as a sign of preeclampsia or gestational hypertension. Dietary history was obtained
with twenty-four hour diet recall questionnaires administered monthly until 36 weeks gestational age.
Women who missed antenatal appointments were visited at home when possible. Full-time research
midwives attended to the women at delivery and recorded information related to the labor and birth,
which was added to the study database.
5

Preeclampsia was defined as systolic blood pressure greater than or equal to 140mm Hg or diastolic blood
pressure greater than or equal to 90mm Hg with proteinuria of 1+ confirmed by laboratory urinalysis after
20 weeks gestation through 48 hours postpartum. Women with eclampsia, defined as seizures or coma in
addition to preeclampsia, were also included in the case definition of preeclampsia. Gestational
hypertension was defined as a systolic blood pressure greater than or equal to 140mm Hg or diastolic
blood pressure greater than or equal to 90mm Hg with negative or trace proteinuria on laboratory
urinalysis after 20 weeks gestation through 48 hours postpartum. Physician-diagnosed cases of
preeclampsia and gestational hypertension based on blood pressure and urine protein measurement were
also included in the case definitions. Women without a urine protein lab test or a physician diagnosis of a
hypertensive disorder of pregnancy were excluded from the risk factor analysis.
A variety of potential risk factors for preeclampsia and gestational hypertension were explored in this
study. Assessments at the enrollment visit were used for all the variables explored, unless otherwise
noted. These included self-reported socio-demographic variables of maternal age, marital status, literacy,
education level of the mother and partner, household size, woman having some income of her own, and
household food expenditure per person per day. We also looked at Filmer-Pritchett score, a linear index
that incorporates asset ownership and household characteristics and can be used as a proxy for long-term
household-level wealth.10
We examined several medical and anthropomorphic factors measured at the
enrollment visit, including body mass index (BMI), mid-upper arm circumference (MUAC), hemoglobin,
hematocrit, platelet count, mean corpuscular volume (MCV), and blood pressure. Randomization to daily
multivitamin use, self-reported alcohol use, personal and family history of hypertension and diabetes,
urinary tract infection (UTI) at enrollment, and malaria infection during the current pregnancy but before
any hypertension diagnosis were also examined. Calcium intake was explored using the mean intake
across 24 hour diet recall questionnaires completed during pregnancy, with nutrient levels calculated
using Tanzania Food Composition Tables.11
6

Obstetric and gynecologic factors examined included parity, twin gestation, and history of miscarriage or
stillbirth. Vaginal bleeding, nausea and vomiting, and itchy vaginal discharge during the current
pregnancy were also assessed at the enrollment visit, Age at first pregnancy, time since last pregnancy,
history of preeclampsia, low birth weight (LBW) baby less than 2500g at birth, preterm delivery at less
than 37 weeks gestation, and Cesarean section in any previous pregnancy were explored as risk factors
among the 4510 multiparous women in the study. Parity was explored for both outcomes as both a
dichotomous variable, and as an ordinal variable of parity 0, 1, or 2 or more. The results for women with
2 or more previous births were very similar to women with just 1 previous delivery, so parity was
collapsed into a dichotomous variable comparing nulliparous to multiparous women in all analyses.
To examine incident cases of hypertension during pregnancy in the current study, 117 women with
systolic blood pressure greater than or equal to 140mm Hg or diastolic blood pressure greater than or
equal to 90mm Hg at their enrollment visit, who did not have a urine protein sent or have a subsequent
physician diagnosis of preeclampsia or gestational hypertension were excluded from this analysis as
likely cases of chronic hypertension. The remaining 8311 women who were normotensive at enrollment
were included in the subsequent analyses.
Data analysis
Each potential risk factor for preeclampsia and gestational hypertension was assessed individually in a
univariable log-binomial regression model to obtain risk ratios and 95% confidence intervals.12
Women
without any type of hypertensive disorder of pregnancy were used as the comparison group in all
analyses. Those variables that were associated with preeclampsia or gestational hypertension at the p-
value <0.20 level of significance were then included in multivariable-adjusted models. Poisson regression
was used for the multivariable models since the multivariable log-binomial models did not converge.12,13
All multivariable models were adjusted for year, district of residence, gestational age at enrollment, and
maternal age as confounders defined a priori. Due to high collinearity between BMI and MUAC,
7

additional multivariable-adjusted models were run entering these variables separately from each other to
obtain their effects. The same was done for hemoglobin and hematocrit. Covariates that remained
significant at the p-value <0.05 level in the multivariable models were considered independent risk factors
for the respective hypertensive disorder of pregnancy.
The indicator method was used to address incomplete covariate information.14
Continuous variables were
categorized at pre-determined cut points to increase interpretability. Calcium intake was divided into
quartiles with the highest quartile of intake used as the reference group. Effect estimates for calcium were
adjusted for mean total energy intake as a continuous variable across 24 hour recall questionnaires.15
Wald
tests for linear trend were calculated for continuous variables using the median value in each category.
Wald tests were also calculated for dichotomous variables. All statistical analyses were performed using
SAS software 9.3 (SAS Institute, Inc., www.sas.com, Cary, North Carolina).
8

Results
Baseline characteristics of the study population are shown in Table 1.1. The mean age of the study
participants was 25.1 years (SD 5.1), and the mean gestational age at enrollment to the study was 21.3
weeks (SD 3.5). More than half (56%) of women were multiparous, 2% had twin pregnancies, 88% were
married or cohabiting with a partner, and 88% were literate.
Of the 8311 women included in our study, 602 (7%) developed some form of hypertension during
pregnancy after 20 weeks gestational age. Of those, 138 (2%) were confirmed as preeclampsia meeting
the case definition and 136 (2%) women were confirmed cases of gestational hypertension. 328 women
(4%) met the hypertension criteria with systolic blood pressure greater than or equal to 140mm Hg or
diastolic blood pressure greater than or equal to 90mm Hg, but did not have a urine sample analyzed in
the lab, so we were unable to distinguish them as cases of preeclampsia versus gestational hypertension,
so they were excluded from the risk factor analyses. Of the 138 women with preeclampsia, 45(33%)
developed eclampsia, and 16 of those women presented with seizures as the first identified symptom of
the disease.
Results for the associations between the potential risk factors explored and preeclampsia are shown in
Table 1.2, reported as risk ratios and 95% confidence intervals. In the multivariable-adjusted model, BMI
greater than 22 at enrollment, history of hypertension, urinary tract infection, calcium intake in the bottom
three quartiles, and nulliparity were found to be important independent risk factors for preeclampsia (p
<0.05). Women with twin pregnancies had an almost 5-fold increased risk of developing preeclampsia
(RR 4.95; 95% CI 2.64, 9.29).
Factors related to previous pregnancy complications were also examined in a separate multivariable
analysis of the 4510 multiparous women. History of preeclampsia, low birth weight, preterm birth, and
Cesarean section were all associated with current pregnancy risk of preeclampsia in univariable analyses.
9

Table 1.1. Characteristics of study participants (N=8311)
Characteristic^
n*(%)
Socio-demographic
Age, years
< 20
20 - < 25
25 - < 30
≥ 30
1335 (16)
3305 (40)
2230 (27)
1399 (17)
Marital status
Married or cohabiting
Not married or cohabiting
7281 (88)
967 (12)
Illiterate 1020 (12)
Education, years
0 – 4
5 – 7
8 – 11
≥ 12
947 (12)
5499 (67)
1396 (17)
432 (5)
Spouse education, years
0 – 4
5 – 7
8 – 11
≥ 12
413 (6)
4284 (59)
1696 (23)
884 (12)
Household size, people
1 – 2
3 – 4
≥ 5
2819 (34)
3088 (37)
2379 (29)
Woman has some income of her own 2239 (27)
Filmer-Pritchett wealth score < median 3951 (48)
Food expenditure/person/day ≤ 500 Tanzanian Shillings
# 3009 (40)
Anthropomorphic/Clinical
Body mass index, kg/m2
< 22
22 - < 25
25 - < 30
≥ 30
1953 (27)
2553 (35)
2116 (29)
670 (9)
Mid-upper arm circumference, cm
< 22
22 - < 26
26 - < 28
≥ 28
340 (4)
3481 (43)
1960 (24)
2414 (30)
Hemoglobin, g/dl
< 8.5
8.5 - < 11.0
≥ 11.0
863 (12)
3961 (56)
2320 (33)
10

Table 1.1 (Continued)
Characteristic^
n*(%)
Hematocrit, %
< 30
30 - < 33
≥ 33
2295 (32)
2138 (30)
2721 (38)
Platelet count per たL
< 150
≥ 150
375 (5)
6773 (95)
Mean corpuscular volume, fL
< 85
85 - < 100
≥ 100
3743 (52)
3248 (45)
166 (2)
Randomized to daily multivitamin 4133 (50)
Calcium intake during pregnancy, mg/day
< 174
174 - < 362
362 - < 709
≥ 709
1905 (25)
1906 (25)
1906 (25)
1906 (25)
Alcohol use this pregnancy 1038 (13)
Urinary tract infection 99 (1)
Malaria infection during pregnancy 134 (2)
SBP ≥ 120mm Hg or DBP ≥ 80mm Hg 1925 (24)
History of hypertension 299 (4)
History of diabetes 10 (0)
Family history of hypertension 1787 (22)
Family history of diabetes 768 (9)
Obstetric/Gynecologic
Parity
Nulliparous
Multiparous
3759 (46)
4510 (55)
Twin pregnancy 158 (2)
Vaginal bleeding this pregnancy 366 (4)
Nausea/vomiting this pregnancy 3322 (40)
Itchy vaginal discharge this pregnancy 983 (12)
History miscarriage or stillbirth 1437 (17)
Age at first pregnancy, years**
< 20
20 - <30
≥ 30
2352 (55)
1902 (44)
27 (1)
Time since last pregnancy, years**
< 1
1 - < 2
2 - < 3
3 - < 10
≥ 10
290 (7)
474 (12)
813 (20)
2411 (58)
148 (4)
History of preeclampsia**
62 (1)
11

Table 1.1 (Continued)
Characteristic^
n*(%)
History of low birth weight baby < 2.5kg**
434 (19)
History of preterm birth < 37 weeks**
213 (10)
History of Cesarean section**
218 (5) ^
All characteristics assessed at study enrollment, unless otherwise noted
* May not sum to 8311 due to incomplete covariate data
** Among multiparous women only (n=4510) ^
Equivalent to approximately 0.50 US dollars in 2004
12

Table 1.2. Risk factors for preeclampsia (n/N = 138/7847)
Characteristic^
n/N
Univariable Multivariable+
RR [95% CI] p RR [95% CI] p
Socio-demographic
Age, years
< 20
20 - < 25
25 - < 30
≥ 30
29/1280
55/3134
29/2114
24/1281
1.00 [REF]
0.77 [0.50, 1.21]
0.61 [0.36, 1.01]
0.83 [0.48, 1.41]
0.37
1.00 [REF]
0.69 [0.42, 1.14]
0.65 [0.34, 1.24]
1.09 [0.53, 2.24]
0.65
Marital status
Married or cohabiting
Not married or cohabiting
121/6879
15/910
1.00 [REF]
0.94 [0.55, 1.60]
0.81
Illiterate 13/953 0.75 [0.42, 1.32] 0.32
Education, years
0 - 4
5 - 7
8 - 11
≥ 12
9/894
92/5205
32/1316
4/399
1.00 [REF]
1.76 [0.89, 3.47]
2.42 [1.16, 5.04]
1.00 [ 0.31, 3.21]
0.08
1.00 [REF]
1.41 [0.68, 2.94]
1.91 [0.85, 4.29]
0.93 [0.27, 3.23]
0.23
Spouse education, years
0 - 4
5 - 7
8 - 11
≥ 12
7/386
72/4052
29/1597
18/838
1.00 [REF]
0.98 [0.45, 2.11]
1.00 [0.44, 2.27]
1.18 [0.50, 2.81]
0.65
Household size, people
1 - 2
3 - 4
≥ 5
58/2674
47/2918
32/2232
1.00 [REF]
0.74 [0.51, 1.09]
0.66 [0.43, 1.01]
0.05
1.00 [REF]
0.94 [0.59, 1.48]
0.75 [0.46, 1.25]
0.28
Woman has income of her own 32/2118 0.82 [0.55, 1.22] 0.33
Wealth score < median 72/3763 1.19 [0.85, 1.66] 0.30
Food expenditure/person/day ≤ 500 Tanzanian Shillings
50/2845 0.96 [0.67, 1.36] 0.80
Anthropomorphic/Clinical
Body mass index, kg/m2*
< 22
22 - < 25
25 - < 30
≥ 30
18/1884
55/2446
31/1982
15/573
1.00 [REF]
2.35 [1.39, 3.99]
1.64 [0.92, 2.92]
2.74 [1.39, 5.40]
0.04
1.00 [REF]
2.27 [1.33, 3.87]
1.60 [0.89, 2.89]
2.75 [1.36, 5.58]
0.04
Mid-upper arm circumference, cm*
< 22
22 - < 26
26 - < 28
≥ 28
3/329
57/3351
30/1860
48/2201
1.00 [REF]
1.87 [0.59, 5.92]
1.77 [0.54, 5.76]
2.39 [0.75, 7.63]
0.09
1.00 [REF]
1.97 [0.61, 6.29]
1.90 [0.58, 6.24]
2.52 [0.78, 8.17]
0.18
Hemoglobin
< 8.5
8.5 - <11
≥ 11
14/824
57/3756
39/2164
0.94 [0.51, 1.73]
0.84 [0.56, 1.26]
1.00 [REF]
0.72
Hematocrit, %
< 30
30 - < 33
≥ 33
35/2196
32/2018
43/2541
0.94 [0.61, 1.47]
0.94 [0.60, 1.48]
1.00 [REF]
0.79
Platelet count < 150 per たL 7/350 1.24 [0.58, 2.65] 0.57
13

Table 1.2 (Continued)
Characteristic^
n/N
Univariable Multivariable+
RR [95% CI] p RR [95% CI] p
Mean corpuscular volume, fL
< 85
85 - < 100
≥ 100
57/3540
49/3055
4/163
1.00 [0.69, 1.47]
1.00 [REF]
1.53 [0.56, 4.19]
0.70
Randomized to daily multivitamin 75/3889 1.20 [0.86, 1.67] 0.29
Calcium intake during pregnancy,
mg/day
< 174
174 - < 362
362 - < 709
≥ 709
41/1802
31/1795
33/1793
17/1798
2.66 [1.49, 4.78]
1.97 [1.08, 3.58]
2.05 [1.14, 3.70]
1.00 [REF]
<0.01
2.27 [1.22, 4.25]
1.92 [1.03, 3.59]
1.81 [0.97, 3.39]
1.00 [REF]
0.01
Alcohol use 20/975 1.19 [0.74, 1.90] 0.47
Urinary tract infection 4/95 2.45 [0.93, 6.50] 0.07 3.11 [1.12, 8.65] 0.03
Malaria infection during pregnancy 20/752 1.59 [1.00, 2.55] 0.05 1.64 [0.98, 2.72] 0.06
SBP ≥120mm Hg or DBP ≥80mm Hg 37/1719 1.28 [0.88, 1.85] 0.20
History of hypertension 12/276 2.60 [1.46, 4.64] <0.01 2.19 [1.11, 4.31] 0.02
Family history of hypertension 31/1666 1.06 [0.72, 1.58] 0.76
Family history of diabetes 14/722 1.10 [0.64, 1.91] 0.73
Obstetric/Gynecologic
Nulliparous
79/3574 1.61 [1.15, 2.26] 0.01 1.71 [1.03, 2.85]
0.04
Twin pregnancy 11/141 4.73 [2.62, 8.57] <0.01 4.95 [2.64, 9.29] <0.01
Vaginal bleeding 2/344 0.32 [0.08, 1.28] 0.11 0.15 [0.02, 1.09] 0.06
Nausea/vomiting 52/3133 0.90 [0.64, 1.27] 0.56
Itchy vaginal discharge 25/930 1.64 [1.07, 2.51] 0.02 1.51 [0.94, 2.41] 0.09
History miscarriage or stillbirth 32/1335 1.48 [1.00, 2.19] 0.05 1.36 [0.87, 2.12]
0.18
Age at first pregnancy ≥ 20 years# 28/1806 1.32 [0.78, 2.24] 0.31
Time since last pregnancy, years#
< 1
1 - < 2
2 - < 3
3 - < 10
≥ 10
5/276
6/442
7/773
33/2264
1/133
1.24 [0.49, 3.16]
0.93 [0.39, 2.21]
0.62 [0.28, 1.40]
1.00 [REF]
0.52 [0.07, 3.74]
0.82
History of preeclampsia#
4/53 5.82 [2.19, 15.48] <0.01 6.20 [2.08, 18.49] <0.01
History of LBW baby < 2.5kg #&
10/403 2.32 [1.09, 4.94] 0.03 2.08 [0.92, 4.69]
0.08
History of preterm birth < 37 weeks #&
6/204 2.53 [1.04, 6.16] 0.04 2.60 [1.03, 6.56]
0.04
History of Cesarean section#&
8/202 3.36 [1.60, 7.06] <0.01 1.95 [0.82, 4.66]
0.13 ^All characteristics were assessed at study enrollment, unless otherwise noted
+ Adjusted for year, district, gestational age at entry, maternal age, education, household size, BMI,
MUAC, mean calcium and energy intake this pregnancy, urinary tract infection at entry, malaria during
pregnancy, history hypertension, nulliparity, twins, vaginal bleeding this pregnancy, itchy vaginal
discharge this pregnancy, history miscarriage or stillbirth
* BMI and MUAC entered separately in multivariable model # Among multiparous women only
& Multivariable model additionally adjusted for history of preeclampsia
14

History of preeclampsia remained the strongest independent risk factor for current preeclampsia in the
multivariable model (RR 6.20; 95% CI 2.08, 18.49). After adjusting for preeclampsia history, history of
LBW and Cesarean section were no longer significantly independently associated with risk of
preeclampsia, but women with a history of preterm delivery remained at more than double the risk (RR
2.60; 95% CI 1.03, 6.56).
Results for the gestational hypertension outcome are shown in Table 1.3. Increasing BMI, increasing
MUAC, MCV less than 85 fL, blood pressure greater than 120/80 at enrollment, history of diabetes, twin
pregnancy, and history of miscarriage or stillbirth all significantly increased the risk of developing
gestational hypertension in the multivariable-adjusted model. Decreasing hematocrit appeared to be
associated with a lower risk of gestational hypertension, particularly a hematocrit less than 30%. Among
multiparous women, the only pregnancy history variable that appeared important for development of
gestational hypertension was age at first pregnancy. Women whose first pregnancy was at age 30 or older
had a 5 times higher independent risk of developing gestational hypertension compared to those less than
20 years old.
There were only 10 women in this study who reported having a personal history of any type of diabetes.
Although the confidence interval is wide with so few women exposed, diabetes history was still found to
be related to gestational hypertension (RR 5.64; 95% CI 1.26, 25.11). None of these 10 women developed
preeclampsia.
15

Table 1.3. Risk factors for gestational hypertension (n/N = 136/7845)
Characteristic^
n/N
Univariable Multivariable+
RR [95% CI] p RR [95% CI] p
Socio-demographic
Age, years
< 20
20 - <25
25 - < 30
≥ 30
19/1270
49/3128
40/2125
28/1285
1.00 [REF]
1.05 [0.62, 1.77]
1.26 [0.73, 2.16]
1.46 [0.82, 2.59]
0.11
1.00 [REF]
0.95 [0.53, 1.64]
0.95 [0.48, 1.69]
0.96 [0.43, 1.69]
0.94
Marital status
Married or cohabiting
Not married or cohabiting
115/6873
21/916
1.00 [REF]
1.37 [0.87, 2.17]
0.18
1.00 [REF]
1.69 [0.77, 3.70]
0.19
Illiterate 21/961 1.30 [0.82, 2.06] 0.26
Education, years
0 - 4
5 – 7
8 - 11
≥ 12
13/898
86/5199
27/1311
10/405
1.00 [REF]
1.14 [0.64, 2.04]
1.42 [0.74, 2.74]
1.71 [0.75, 3.86]
0.15
1.00 [REF]
0.98 [0.54, 1.78]
1.11 [0.55, 2.24]
1.31 [0.53, 3.26]
0.60
Spouse education, years
0 - 4
5 – 7
8 - 11
≥ 12
10/389
67/4047
32/1600
11/831
1.00 [REF]
0.64 [0.33, 1.24]
0.78 [0.39, 1.57]
0.51 [0.22, 1.20]
0.41
1.00 [REF]
0.81 [0.38, 1.70]
0.77 [0.35, 1.70]
0.46 [0.18, 1.21]
0.30
Household size, people
1 - 2
3 - 4
≥ 5
40/2656
54/2925
41/2241
1.00 [REF]
1.23 [0.82, 1.84]
1.21 [0.79, 1.87]
0.37
Has some of her own income 34/2120 0.90 [0.61, 1.32] 0.58
Wealth score < median 61/3752 0.88 [0.63, 1.23] 0.45
Food expenditure/person/day ≤ 500 Tanzanian Shillings
56/2851 1.20 [0.85, 1.70] 0.30
Anthropomorphic/Clinical
Body mass index, kg/m2*
< 22
22 - <25
25 - < 30
≥ 30
21/1887
32/2423
43/1994
29/587
1.00 [REF]
1.19 [0.69, 2.05]
1.94 [1.15, 3.25]
4.44 [2.55, 7.72]
<0.01
1.00 [REF]
1.08 [0.62, 1.88]
1.59 [0.93, 2.71]
2.91 [1.59, 5.32]
<0.01
Mid-upper arm circumference, cm*
< 22
22 - <26
26 - <28
≥ 28
4/330
40/3334
28/1858
63/2216
1.00 [REF]
0.99 [0.36, 2.75]
1.24 [0.44, 3.52]
2.35 [0.86, 6.40]
<0.01
1.00 [REF]
0.88 [0.31, 2.47]
1.00 [0.35, 2.87]
1.47 [0.53, 4.13]
0.02
Hemoglobin**
< 8.5
8.5 - < 11
≥ 11
9/819
61/3760
42/2167
0.57 [0.28, 1.16]
0.84 [0.57, 1.24]
1.00 [REF]
0.11
0.57 [0.27, 1.24]
0.87 [0.57, 1.34]
1.00 [REF]
0.10
Hematocrit, %**
< 30
30 - < 33
≥ 33
22/2183
37/2023
53/2551
0.49 [0.30, 0.79]
0.88 [0.58, 1.33]
1.00 [REF]
<0.01
0.55 [0.32, 0.94]
0.92 [0.59, 1.43]
1.00 [REF]
0.03
Platelet count < 150 per たL 4/347 0.68 [0.25, 1.84] 0.45
16

Table 1.3 (Continued)
Characteristic^
n/N
Univariable Multivariable+
RR [95% CI] p RR [95% CI] p
Mean corpuscular volume, fL
< 85
85 - < 100
≥ 100
66/3549
45/3051
1/160
1.26 [0.87, 1.84]
1.00 [REF]
0.42 [0.06, 3.05]
0.12
1.51 [1.01, 2.27]
1.00 [REF]
0.42 [0.06, 3.16]
0.02
Randomized to daily multivitamin 73/3887 1.17 [0.83, 1.63] 0.37
Calcium intake during pregnancy,
mg/day
< 174
174 - < 362
362 - < 709
≥ 709
28/1789
33/1797
37/1797
30/1811
1.05 [0.61, 1.78]
1.19 [0.72, 1.97]
1.31 [0.81, 2.13]
1.00 [REF]
0.64
Alcohol use 17/972 1.01 [0.61, 1.68] 0.96
Malaria infection during pregnancy 7/739 0.52 [0.24, 1.11] 0.09 0.49 [0.22, 1.10] 0.08
SBP ≥120mm Hg or DBP ≥80mm Hg 47/1729 1.87 [1.31, 2.65] <0.01 1.78 [1.23, 2.58] <0.01
History of hypertension 11/275 2.41 [1.32, 4.41] <0.01 1.49 [0.76, 2.93] 0.24
History of diabetes 2/10 11.61 [3.32, 40.57] <0.01 5.64 [1.26, 25.11] 0.02
Family history of hypertension 43/1678 1.68 [1.18, 2.40] <0.01 1.27 [0.86, 1.85] 0.23
Family history of diabetes 16/724 1.31 [0.78, 2.19] 0.31
Obstetric/Gynecologic
Nulliparous 55/3550 0.81 [0.58, 1.14] 0.24
Twin pregnancy 8/138 3.49 [1.74, 6.99] <0.01 2.94 [1.42, 6.07] <0.01
Vaginal bleeding 6/348 0.99 [0.44, 2.23] 0.98
Nausea/vomiting 63/3144 1.30 [0.93, 1.82] 0.13 1.09 [0.77, 1.54] 0.64
Itchy vaginal discharge 20/925 1.29 [0.81, 2.07] 0.28
History miscarriage or stillbirth 37/1340 1.81 [1.24, 2.62] <0.01 1.58 [1.07, 2.33] 0.02
Age at first pregnancy, years #&
0.01 0.03
< 20
20 - < 30
≥ 30
35/2221
39/1794
2/25
1.00 [REF]
1.38 [0.88, 2.17]
5.08 [1.29, 19.96]
1.00 [REF]
1.42 [0.85, 2.38]
5.43 [1.12, 26.30]
Time since last pregnancy, years#
< 1
1 - < 2
2 - < 3
3 - < 10
≥ 10
3/274
11/447
15/781
42/2273
1/133
0.59 [0.18, 1.90]
1.33 [0.69, 2.57]
1.04 [0.58, 1.86]
1.00 [REF]
0.41 [0.06, 2.93]
0.53
History of preeclampsia#
2/51 2.07 [0.53, 8.23] 0.30
History of LBW baby < 2.5 kg# 8/401 1.19 [0.55, 2.57] 0.66
History of preterm birth < 37 weeks# 1/199 0.27 [0.04, 1.98] 0.20
History of Cesarean section#&
7/201 1.91 [0.89, 4.11] 0.10 1.35 [0.60, 3.05]
0.47 ^All characteristics were assessed at study enrollment, unless otherwise noted
+ Adjusted for year, district, gestational age at entry, maternal age, marital status, education, spouse education,
BMI, MUAC, hemoglobin, hematocrit, MCV, malaria during pregnancy, baseline BP ≥120/80, history
hypertension, history diabetes, family history hypertension, twins, nausea/vomiting during pregnancy, history
miscarriage or stillbirth
* BMI and MUAC entered separately in multivariable model
** Hemoglobin and hematocrit entered separately in multivariable model # Among multiparous women only
& Multivariable model additionally adjusted for age at first pregnancy and history of Cesarean section
17

Discussion
Main findings
We identified incident hypertensive disorders in 7.2% of pregnancies in this population of HIV
seronegative women in Dar es Salaam, with 1.7% confirmed cases of preeclampsia, 1.6% confirmed
gestational hypertension cases, and 3.9% hypertension of unknown origin. Even in this group of women
involved in a randomized control trial with close follow-up, 11.8% of the preeclampsia cases presented
with seizures as their first identified symptom of the disease. Work in other developing countries
estimated hypertension during pregnancy in 9.2% of women; 2.2% with preeclampsia and 7% gestational
hypertension.2 It is possible that our estimates are slightly lower than these because we excluded women
with hypertension at enrollment; including these women gives a similar estimate for prevalence of all
types of hypertension in pregnancy of 8.5%. In a randomized trial of multivitamin use in pregnancy
among HIV-infected women in the same catchment area in Dar es Salaam, the incidence of any type of
hypertension was similar at 8.9%.16
Some risk factors appeared to be shared between preeclampsia and
gestational hypertension, while others were related to only one disorder.
Strengths and limitations
The strength of this study is that it involved a large number of pregnant women with data on a wide
variety of risk factors collected in a standardized and detailed fashion throughout their participation in a
randomized clinical trial. It also adds to the limited body of evidence available on hypertension during
pregnancy among women in sub-Saharan Africa.
The main limitation to our study was that we had a substantial number of women with hypertension
during pregnancy whose type could not be confirmed, as urine protein laboratory results were not
available. The baseline characteristics of these women appeared to be similar to those in the gestational
hypertension cases group, but we cannot be sure which type of hypertension they had without urine
protein confirmation. Another limitation was that most women were enrolled in the study about half-way
18

through pregnancy. Without blood pressure measurements from before pregnancy or prior to 20 weeks
gestation in many women, it is difficult to distinguish those women with underlying chronic hypertension
from those with hypertensive disorders of pregnancy. We attempted to address with this by excluding
women with blood pressure greater than or equal to 140mm Hg systolic or 90mm Hg diastolic at their
first visit. The cases we have identified may still include some women who have unidentified chronic
hypertension with a super-imposed hypertensive disorder of pregnancy, which could affect the magnitude
of the associations observed, but this is unlikely to change the risk factors identified.
Interpretation
Twin pregnancy and body mass index greater than 22 kg/m2 at enrollment were found to be risk factors
for both preeclampsia and gestational hypertension. Many of the factors associated with gestational
hypertension are similar to risk factors for chronic hypertension outside of pregnancy, while those
specific to preeclampsia include several pregnancy-related factors, supporting the idea that these may be
two distinct disease processes.
Nulliparity, self-reported history of hypertension prior to pregnancy, and urinary tract infection during
pregnancy were associated with an increased risk of developing preeclampsia alone. The relationship with
UTI supports the theory of a pathway to preeclampsia where infection may play a role in its development
by increasing acute utero-placental atherosis, as well as in its progression by amplifying the maternal
systemic inflammatory response.20
Malaria infection and itchy vaginal discharge during pregnancy, which
may be an indicator of genital urinary tract infection, were also associated with increased risk of
preeclampsia. Although they did not remain statistically significant in the adjusted model, these
relationships lend further support to an infectious pathway to preeclampsia development. This association
with malaria has also been found in a few other small studies in sub-Saharan Africa.17-19
It is particularly
notable here since this population of women was given prophylaxis with sulfadoxine-pyrimethamine
(Fansidar).
19

Although multivitamin supplementation was not associated with either preeclampsia or gestational
hypertension, women with calcium intake below 709 mg per day were at 1.8 to 2.3 times higher risk for
developing preeclampsia after adjusting for mean daily caloric intake as well as all other variables in the
adjusted model (trend test p-value = 0.01). This is consistent with other studies that have found an inverse
relationship between calcium supplementation and preeclampsia among populations with low calcium
intake, where supplementation was found to decrease the risk of preeclampsia by half.21
History of preeclampsia and previous preterm birth were strong predictors of increased risk of
preeclampsia development in the current pregnancy. Adverse prior pregnancy outcomes may act to
increase risk of preeclampsia either through a direct mechanism or due to other common causes that
increase risk of a variety of complications in pregnancy. For example, preeclampsia in a previous
pregnancy may having lingering effects on a woman’s blood vessels, liver, or uterus that are triggered
again in subsequent pregnancies, or both cases may be a result of underlying factors that increase
women’s risk for preeclampsia in all pregnancies. History of preterm birth remained significantly
associated with preeclampsia after adjustment for history of preeclampsia. It is possible that some of this
relationship may be explained by residual confounding by other risk factors in previous pregnancies that
were not assessed in the current study.
Risk factors specific to gestational hypertension included mid-upper arm circumference of 28cm or
higher, mean corpuscular volume less than 85fL, history of diabetes, SBP of 120mm Hg or higher or DBP
80mm Hg or higher at enrollment, and history of miscarriage or stillbirth. Women with a hematocrit less
than 30% were at decreased risk compared to women with hematocrit of 33% of higher. Unfortunately,
we were unable to distinguish between women who had a history of miscarriage verses stillbirth. This
factor was also associated with preeclampsia, but did not remain statistically significant in the adjusted
model (RR 1.36; 95% CI 0.87, 2.12). These findings may support a hypothesis of an underlying factor
20

affecting implantation and placental function that could increase risk for both pregnancy loss and
hypertensive disorders.5
Conclusion
Despite the significant impact of hypertensive disorders of pregnancy on maternal and child health, their
pathogenesis and sequelae are not fully understood. There is a particular lack of published evidence in
this area from sub-Saharan Africa. Our study in Dar es Salaam found that hypertensive disorders of
pregnancy affect approximately 7% of women in this population. The World Health Organization
guidelines for antenatal care recommend at least four visits during pregnancy, with increased surveillance
for women at risk for adverse outcomes.22
Women with the risk factors identified in this study may be
good candidates for closer antenatal surveillance of blood pressure, urine protein, and fetal growth so the
development of hypertension during pregnancy can be identified as early as possible and delivery at the
appropriate facility level coordinated. The BMI, MUAC, and calcium findings support interventions
aimed at diet and lifestyle modifications to help decrease risk of hypertension. There is a need for the
implementation of gestational diabetes screening and further research into the impact of diabetes on
pregnancy outcomes in resource-limited settings. More investigation into the effects of infections during
pregnancy and potential screening or preventative strategies is also warranted.
21

Acknowledgements
The authors thank the mothers who participated in the study, the field research teams, including nurses,
midwives, supervisors, and laboratory personnel, and the administrative staff who made this study
possible. We also thank Ellen Hertzmark of Harvard T.H. Chan School of Public Health for her work on
the dataset and input into the analysis for this study.
Disclosure of interests
Authors do not have any conflicts of interest to disclose.
Contribution to authorship: EB, WF, DS, EL, SM, WU, FA
EB and WF conceived of the study concept. WF, WU, and FA were part of the research team that
conducted the original randomized trial in which the women in the current study participated. EB, WF,
DS, EL, and SM made substantial contributions to the design, analysis, and interpretation of the data. EB
performed the analyses and drafted the manuscript. WF, DS, EL, SM, WU, and FA contributed to the
revisions of the manuscript.
Details of ethics approval
The study was approved by the institutional review boards at Muhimbili University of Health and Allied
Sciences in Dar es Salaam and at Harvard School of Public Health in Boston.
Funding
Study supported by a grant from the National Institute of Child Health and Human Development (NICHD
R01 37701). EB received research funding support from Training Grant T32HD060454 in Reproductive,
Perinatal, and Pediatric Epidemiology from the National Institute of Child Health and Human
Development, National Institutes of Health and MCHB Training Grant T76MC00001 from the Maternal
and Child Health Bureau.
22

References
1. Trends in maternal mortality 1990-2008: Estimates developed by WHO, UNICEF, UNFPA and the
World Bank. 2010. World Health Organization. 29 Nov 2012
http://www.who.int/maternal_child_adolescent/epidemiology/maternal/en/index.html
2. Villar J, Carroli G, Wojdyla D, Abalos E, Giordano D, Ba'aqeel H, et al. World Health Organization
Antenatal Care Trial Research Group. Preeclampsia, gestational hypertension and intrauterine growth
restriction, related or independent conditions? Am J Obstet Gynecol. 2006 Apr;194(4):921-31.
3. WHO recommendations for prevention and treatment of pre-eclampsia and eclampsia. World Health
Organization, Dept. of Reproductive Health and Research, Dept. of Maternal, Newborn, Child and
Adolescent Health, Dept. of Nutrition for Health and Development. 2011.
4. Khan KS, Wojdyla D, Say L, Gülmezoglu AM, Van Look PF. WHO analysis of causes of maternal
death: a systematic review. Lancet. 2006 Apr 1;367(9516):1066-74.
5. Hypertension in Pregnancy: Report of the ACOG Task Force on Hypertension in Pregnancy. The
American College of Obstetricians and Gynecologists 2013.
6. World Health Organization. The world health report 2005: Make every mother and child count.
Geneva; WHO 2005. Available at http;//www.who.int/whr/2005/whr2005_en.pdf.
7. Abalos E, Cuesta C, Grosso AL, Chou D, Say L. Global and regional estimates of preeclampsia and
eclampsia: a systematic review. Eur J Obstet Gynecol Reprod Biol. 2013 Aug;170(1):1-7.
8. ACOG Committee on Obstetric Practice. ACOG practice bulletin. Diagnosis and management of
preeclampsia and eclampsia. No. 33, January 2002. American College of Obstetricians and
Gynecologists. Obstet Gynecol. 2002;99:159-67.
9. Fawzi WW, Msamanga GI, Urassa W, Hertzmark E, Petraro P, Willett WC, et al. Vitamins and
perinatal outcomes among HIV-negative women in Tanzania. N Engl J Med. 2007 Apr 5;356(14), 1423-
1431.
10. Filmer, D, & Pritchett, LH. 2001. Estimating wealth effects without expenditure data – or tears: an
application to educational enrollments in states of India. Demography 38(1): 115-132.
23

11. Lukmanji Z, Hertzmark E, Mlingi N, Assey V, Ndossi G, Fawzi W. Tanzania Food Composition
Tables. Muhimbili University of Health and Allied Sciences (MUHAS), Dar es Salaam, Tanzania,
Tanzania Food and Nutrition Centre (TFNC), Dar es Salaam, Tanzania, Harvard School of Public Health,
Boston, USA. Nov 2008. http://www.hsph.harvard.edu/wp-content/uploads/sites/30/2012/10/tanzania-
food-composition-tables.pdf
12. Spiegelman D, Hertzmark E. Easy SAS calculations for risk or prevalence ratios and differences:
Invited editorial note. Am J Epidemiol. 2005;162:199-200.
13. Maldonado G, Greenland S. Simulation study of confounder-selection strategies. Am J
Epidemiol.1993;138: 923–936.
14. Miettinen OS. Theoretical Epidemiology: Principles of Occurrence Research in Medicine. 1985.
15. Willett WC, Howe GR, Kushi LH. Adjustment for total energy intake in epidemiologic studies. Am J
Clin Nutr. 1997;65(suppl):1220S–1228S.
16. Merchant, AT, Msamanga, G, Villamor, E, Saathoff, E, O’Brien, M, Hertzmark, E, et al. Multivitamin
supplementation of HIV-positive women during pregnancy reduces hypertension. Journal of nutrition.
135, no7. 2005; 1776-1781.
17. Muehlenbachs A, Mutabingwa TK, Edmonds S, Fried M, Duffy PE. Hypertension and maternal-fetal
conflict during placental malaria. PLoS Med. Nov 2006; 3(11): e446.
18. Sartelet H, Rogier C, Milko-Sartelet I, Angel G, Michel G: Malaria-associated pre-eclampsia in
Senegal.
19. Adam I, Elhassan EM, Mohmmed AA, Salih MM, Elbashir MI. Malaria and pre-eclampsia in an area
with unstable malaria transmission in Central Sudan. Malar J. 2011;10:258.
http://dx.doi.org/10.1186/1475-2875-10-258.
20. Conde-Agudelo A, Villar J, Lindheimer M. Maternal infection and risk of preeclampsia: Systematic
review and meta-analysis. Am J Obstet Gynecol.2008 Jan;198(1):7-22.
24

21. Hofmeyr GJ, Lawrie TA, Atallah AN, Duley L. Calcium supplementation during pregnancy for
preventing hypertensive disorders and related problems. Cochrane Data-base of Systematic Reviews
2011, Issue 2. Art. No.: CD001059.
22. World Health Organization. Standards for maternal and neonatal care, developed by the Department
of Making Pregnancy Safer; WHO 2006.
http://www.who.int/reproductivehealth/publications/maternal_perinatal_health/effective_antenatal_care.p
df.
25

Title
Inter-pregnancy interval and perinatal outcomes among women in Dar es Salaam, Tanzania
Authors
Ellen O. Boundy,1 Ellice Lieberman,
1,2,3 Stacey A. Missmer,
1,4 Donna Spiegelman,
1,5,6 Wafaie W.
Fawzi1,6,7
1 Department of Epidemiology, Harvard T.H. Chan School of Public Health, Boston, Massachusetts, USA
2Department of Pediatric Newborn Medicine, Brigham and Women’s Hospital, Boston, Massachusetts,
USA
3Department of Social and Behavioral Sciences, Harvard T.H. Chan School of Public Health, Boston,
Massachusetts, USA
4Department of Obstetrics, Gynecology, and Reproductive Biology, Brigham and Women’s Hospital and
Harvard Medical School, Boston, Massachusetts, USA
5 Department of Biostatistics, Harvard T.H. Chan School of Public Health, Boston, Massachusetts, USA
6Department of Nutrition, Harvard T.H. Chan School of Public Health, Boston, Massachusetts, USA
7Department of Global Health and Population, Harvard T.H. Chan School of Public Health, Boston,
Massachusetts, USA
Funding
Study supported by a grant from the National Institute of Child Health and Human Development (NICHD
R01 37701). EB received research funding support from Training Grant T32HD060454 in Reproductive,
Perinatal, and Pediatric Epidemiology from the National Institute of Child Health and Human
Development, National Institutes of Health and MCHB Training Grant T76MC00001 from the Maternal
and Child Health Bureau.
26

Abstract
Background: Short and long inter-pregnancy intervals have been associated with adverse perinatal
outcomes. Research on the effects of pregnancy spacing has been limited in sub-Saharan Africa.
Methods: We examined the effect of inter-pregnancy interval on perinatal outcomes in a cohort of 3973
women in Dar es Salaam, Tanzania between 2001 and 2004. Inter-pregnancy interval was defined as time
from the end of the previous pregnancy until the last menstrual period of the current pregnancy. An
interval of 24 to less than 36 months was used at the reference group based on World Health Organization
recommendations for pregnancy spacing.1 Outcomes included preterm birth, small for gestational age,
low birth weight, stillbirth, perinatal death, and maternal anemia. We used log binomial regression to
obtain risk ratios and 95% confidence intervals. Results were stratified by last pregnancy outcome of live
birth or stillbirth.
Results: Following a live birth (n=3732), inter-pregnancy intervals less than six months increased the risk
of a low-birth weight infant more than 4-fold (RR 4.63; 95% CI 1.78, 12.03) compared to intervals 24 to
less than 36 months. Following a stillbirth (n=241), shorter intervals were associated with increased risk
of stillbirth and perinatal death in the subsequent pregnancy (trend test p-values <0.05). A non-
statistically significant increase in risk of small for gestational age was also noted for pregnancy intervals
less than 12 months after a live birth. We did not find significant evidence for adverse effects of inter-
pregnancy intervals longer than 60 months.
Conclusion: Family planning counseling should include information on the increased risks of adverse
birth outcomes with short inter-pregnancy intervals. Women who are present to antenatal care following a
short spacing interval should also be considered at higher risk for these perinatal complications.
27

Background
Both short and long time intervals between pregnancies have been associated with adverse outcomes for
mothers and infants.1, 2
A 2006 meta-analysis of 67 studies on birth spacing and perinatal outcomes found
that inter-pregnancy intervals less than 18 months and longer than 59 months were associated with
increased risk of preterm birth, low birth weight, and small for gestational age, compared to 18 to 23
month intervals.2 Shorter inter-pregnancy intervals have also been associated with increased risk of
stillbirth, neonatal death, and child under-nutrition.3-6
The literature on the effects of pregnancy spacing
on maternal outcomes is sparse, but there is some evidence of increased risk of preeclampsia with longer
intervals, and mixed findings on the impact of varied intervals on maternal anemia.6, 7
Several biologic mechanisms have been proposed to explain the association between short pregnancy
spacing and adverse birth outcomes including maternal nutritional depletion, cervical insufficiency,
vertical transmission of infections, suboptimal lactation, sibling competition and infectious disease
transmission, and abnormal remodeling of endometrial blood vessels.8 One proposed mechanism for the
effect of long inter-pregnancy intervals on adverse outcomes is that during pregnancy, a mother may
develop physiological changes that support fetal growth, such as increased uterine blood flow, and after
delivery those adaptations decline over time.9
The World Health Organization recommends that couples wait at least 24 months after a live birth before
attempting the next pregnancy to reduce the risk of adverse maternal and neonatal health outcomes.1
Studies on this topic using longitudinal data with adequate control for confounding among populations in
sub-Saharan Africa have been limited. The data available from Tanzania indicate that a significant
proportion of births do not meet the World Health Organization’s recommended guidelines for pregnancy
spacing.10, 11
According to the 2010 Demographic and Health Survey, which assesses pregnancy spacing
using the time from one birth until the next birth, 16% of all women in Tanzania and 11% of those living
in urban areas had birth intervals less than 24 months.12
There is also limited evidence available
28

examining potential differences in the effect of pregnancy spacing on perinatal outcomes following a
stillbirth compared to a live birth.1
The objective of this study is to examine the relationship between different inter-pregnancy intervals and
perinatal outcomes, including small for gestational age, low birth weight, preterm birth, stillbirth,
perinatal death, and maternal anemia in a cohort of multiparous women in Dar es Salaam, Tanzania.
29

Methods
Study design/population
We examined pregnancy spacing and perinatal outcomes using data from a double-blind randomized trial
of daily multivitamin versus placebo use during pregnancy among 8428 women in Dar es Salaam,
Tanzania between August 2001 and July 2004.13
Participants were between 12 and 27 weeks gestational
age at enrollment, tested antibody negative for human immunodeficiency virus, and planned to continue
residing in Dar es Salaam for one year after delivery. All women were given daily iron and folic acid
supplementation and malaria prophylaxis with sulfadoxine-pyrimethamine at 20 and 30 weeks gestational
age. All participants provided written informed consent. The study was approved by the institutional
review boards at Muhimbili University of Health and Allied Sciences in Dar es Salaam and at the Harvard
School of Public Health in Boston.
From that study population, we included all multiparous women with singleton pregnancies whose last
pregnancy resulted in a live or stillbirth (n=4436). We then excluded women with missing data for the
date of their previous pregnancy outcome (n=439) or last menstrual period prior to the current pregnancy
(n=0) from the analysis. We also excluded women whose previous pregnancy outcome was unknown
(n=24).
Data collection/measurements
A background questionnaire was administered to all women at study enrollment between 12 and 27 weeks
gestation, which included questions on socio-demographic characteristics, medical and obstetric history,
and last menstrual period as reported by the participant. For women with an uncertain last menstrual
period date, irregular menstrual cycles, last bleeding smaller than usual, or oral contraceptive use in the
preceding three months, an ultrasound of the fetal biparietal diameter was performed. When there was a
discrepancy of 10 or more days with the last menstrual period dating, the ultrasound estimation of
gestational age was used.14
Women were also asked whether the outcome of their most recent pregnancy
30

was a live birth, stillbirth, or miscarriage/abortion, and what date that pregnancy ended. The exposure of
interest, inter-pregnancy interval, was calculated as the number of days from the end of the previous
pregnancy until the first day of the last menstrual period of the current pregnancy.
Women were seen at monthly visits to the antenatal clinic during their pregnancies. Research midwives
attended to the women at delivery and recorded information related to the labor, birth, and neonatal
outcomes, including birth weight. Women and their babies were then seen in the clinic at six weeks
postpartum and at monthly intervals thereafter until the end of the first year of life.
The birth-related outcomes of interest were small for gestational age (SGA) infant, low birth weight
(LBW) infant, preterm birth, stillbirth, perinatal death. We also examined maternal anemia at study
enrollment as an outcome. SGA was defined as birth weight less than tenth percentile for gestational age
according to the INTERGROWTH-21st Project growth standards.
15 LBW was defined as less than 2500
grams. Preterm birth was defined as less than 37 weeks gestational age. Stillbirth was defined as delivery
of a baby born at or after 28 weeks gestation without any evidence of life, such as breathing or a
heartbeat, at birth. Perinatal death was defined as all stillbirths plus any neonatal deaths within the first 28
days of life. Maternal anemia was defined as hemoglobin less than 8.5 grams per deciliter (g/dL) at study
enrollment.
Covariates considered a priori as potential confounders of the relationship between inter-pregnancy
interval and the perinatal outcomes of interest were assessed at the enrollment visit, including maternal
age, parity, education, marital status, household wealth, preterm birth in a previous pregnancy, and
maternal age at first pregnancy. Wealth was assessed using the Filmer-Pritchett score, a linear index that
incorporates asset ownership and household characteristics as a proxy for long-term household-level
wealth.16
31

Data analysis
We examined the relationship between inter-pregnancy interval and perinatal outcomes among women
whose most recent pregnancy resulted in a live birth and those whose last pregnancy resulted in a
stillbirth separately. To be able to examine short and long intervals between pregnancies, the exposure
was categorized as less than 6 months, 6 to less than 12 months, 12 to less than 24 months, 24 to less than
36 months, 36 to less than 60 months, and 60 months or longer. Twenty-four to less than 36 months was
used as the reference group since two or more years is the World Health Organization-recommended
spacing between pregnancies.1 We used log-binomial regression models to obtain univariable and
multivariable-adjusted risk ratios (RR) and 95% confidence intervals (CI) for the relationship between
pregnancy interval and each perinatal outcome.17
Poisson regression with robust variance was used in the
adjusted models when the log-binomial model did not converge.17
We examined the SGA and LBW
outcomes among term pregnancies of at least 37 weeks gestation. We examined the other outcomes,
preterm birth, stillbirth, perinatal death, and maternal anemia, among all women in our study population.
All multivariable models were adjusted for the confounders defined a priori. Continuous variables were
categorized at pre-determined cut points to increase interpretability. Parity was categorized as one, two,
and three or more previous births. Maternal age at enrollment in years was categorized as less than 20, 20
to less than 25, 25 to less than 30, and 30 or higher. Education in years was categorized as 0 to 4, 5 to 7, 8
to 11, and 12 or more. Marital status was dichotomized as either married/cohabiting or not partnered.
History of preterm birth was a dichotomous variable for whether any of a woman’s prior pregnancies
resulted in a preterm birth. Body mass index at enrollment, categorized as less than 22, 22 to less than 25,
25 to less than 30, and 30 kg/m2 or higher, and randomization to multivitamin use during pregnancy were
also included in the multi-variable models due to their associations with the outcomes.13, 18
Additionally,
gestational age at enrollment in weeks was included as a continuous variable in the adjusted model for the
maternal anemia outcome.
32

The indicator method was used to address incomplete covariate information.19
Wald tests for linear trend
were performed using the median pregnancy interval value in each exposure category. We explored the
possibility of a non-linear relationship between inter-pregnancy interval and each birth outcome non-
parametrically with restricted cubic splines.20
Tests for non-linearity used the likelihood ratio test,
comparing the model with only the linear term to the model with the linear and the cubic spline terms. We
also examined potential effect modification by parity, age at first pregnancy, and anemia at study
enrollment using likelihood ratio tests. All statistical analyses were performed using SAS software 9.3
(SAS Institute, Inc., www.sas.com, Cary, North Carolina).
33

Results
Our analysis includes 3973 multiparous women with singleton pregnancies and a live or stillbirth last
pregnancy; 3732 (93.9%) following a live birth and 241 (6.1%) following a stillbirth. Characteristics of
the included participants, stratified by last pregnancy outcome, are presented in Table 2.1.
Among women with a live birth last pregnancy (n=3732)
The mean age of women with a live birth last pregnancy was 27.5 years and their mean gestational age at
enrollment was 21.6 weeks. Approximately half (n=1922, 52%) had one previous birth. The majority of
women were married or cohabiting (n=3540, 95%) and had less than eight years of education (n=3053,
82%). About half of women had their first pregnancy before age 20, and 10% had a history of preterm
birth. Sixty women (2%) had an inter-pregnancy interval of less than 6 months, 81 (2%) between 6 and
less than 12 months, 385 (10%) between 12 and less than 24 months, 753 (20%) between 24 and less than
36 months, 1298 (35%) between 36 and less than 60 months, and 1155 (31%) 60 months or longer.
Among term births, women with inter-pregnancy intervals less than 12 months appeared to be at
increased risk of SGA compared to women with intervals 24 to less than 36 months, but this effect was
not statistically significant (adjusted RR 1.54; 95% CI 0.70, 3.39 for intervals < 6 months; RR 1.49; 95%
CI 0.73, 3.01 for intervals 6 - < 12 months) (Table 2.2). Also among term pregnancies, women with inter-
pregnancy intervals less than six months were at 4.6 times higher risk (adjusted 95% CI 1.78, 12.03) of
having a LBW baby than women with intervals between 24 and less than 36 months. Among women with
intervals 6 to less than 12 months long and those greater than 36 months, the risk of LBW also appeared
increased, but the effect was not statistically significant.
34

Table 2.1. Characteristics of participants at study enrollment (n=3973), by last pregnancy outcome
Characteristic
Previous live birth (n=3732)+
Previous stillbirth (n=241)+
n (%) or mean (SD)
Age, years
< 20 106 (2.9) 26 (10.8)
20 - < 25 1174 (31.6) 102 (42.3)
25 - < 30 1440 (38.7) 67 (27.8)
≥ 30 998 (26.8) 46 (19.1)
Parity
1 1922 (51.7) 149 (61.8)
2 1023 (27.5) 50 (20.8)
≥ 3 772 (20.8) 42 (17.4)
Gestational age, weeks 21.6 (3.5) 20.9 (3.5)
Marital status
Married/cohabiting 3540 (95.4) 225 (93.8)
Not partnered 170 (4.6) 15 (6.3)
Education, years
0 – 4 506 (13.6) 44 (18.3)
5 – 7 2547 (68.4) 154 (63.9)
8 – 11 526 (14.1) 37 (15.4)
≥ 12 143 (3.8) 6 (2.5)
Filmer-Pritchett wealth score
< median 1862 (50.1) 131 (54.4)
≥ median 1855 (49.9) 110 (45.6)
Body mass index, kg/m2
< 22 742 (22.9) 54 (25.4)
22 - < 25 1058 (32.7) 65 (30.5)
25 - < 30 1039 (32.1) 63 (29.6)
≥ 30 398 (12.3) 31 (14.6)
Randomized to multivitamins
Yes 1844 (49.5) 127 (52.9)
No 1878 (50.5) 113 (47.1)
Age at first pregnancy, years
< 20 1957 (54.4) 126 (53.4)
≥ 20 1641 (45.6) 110 (46.6)
History of preterm birth
Yes 194 (10.1) 29 (22.1)
No 1720 (89.9) 102 (77.9)
Pregnancy interval, months
0 - < 6 60 (1.6) 38 (15.8)
6 - < 12 81 (2.2) 31 (12.9)
12 - < 24 385 (10.3) 57 (23.7)
24 - < 36 753 (20.2) 39 (16.2)
36 - < 60 1298 (34.8) 40 (16.6)
≥ 60 1155 (31.0) 36 (14.9) +
Numbers may not total to 3732 and 241 due to incomplete covariate information
35

Table 2.2. Inter-pregnancy interval and perinatal outcomes among women with a live birth last
pregnancy (n=3732)
Inter-pregnancy
interval, months
n/N (%)
Univariable RR
[95%CI]
p*
Multivariable RR
[95%CI]+
p*
Small for gestational age (<10th percentile) among term births (≥37 weeks), n/N = 322/2877 = 11.2%
0.79 0.91
< 6 7/44 (15.9) 1.56 [0.76, 3.21] 1.54 [0.70, 3.39]
6 - < 12 9/62 (14.5) 1.42 [0.74, 2.73] 1.49 [0.73, 3.01]
12 - < 24 27/269 (10.0) 0.98 [0.64, 1.52] 0.99 [0.63, 1.57]
24 - < 36 58/569 (10.2) 1.00 [REF] 1.00 [REF]
36 - < 60 119/991 (12.0) 1.18 [0.88, 1.58] 1.20 [0.87, 1.64]
≥ 60 102/942 (10.8) 1.06 [0.78, 1.44] 1.09 [0.77, 1.53]
Low birth weight (<2500 g) among term births (≥37 weeks), n/N = 113/2988 = 3.8%
0.69 0.62
< 6 6/47 (12.8) 4.69 [1.93, 11.42] 4.63 [1.78, 12.03]
6 - < 12 3/66 (4.6) 1.67 [0.50, 5.58] 1.85 [0.53, 6.39]
12 - < 24 7/283 (2.5) 0.91 [0.38, 2.18] 0.90 [0.37, 2.18]
24 - < 36 16/588 (2.7) 1.00 [REF] 1.00 [REF]
36 - < 60 41/1022 (4.0) 1.47 [0.83, 2.60] 1.38 [0.77, 2.48]
≥ 60 40/982 (4.1) 1.50 [0.85, 2.65] 1.22 [0.67, 2.25]
Preterm birth (<37 weeks), n/N = 605/3592 = 16.8%
<0.01 0.01
< 6 10/59 (15.3) 0.97 [0.54, 1.75] 0.99 [0.52, 1.89]
6 - < 12 12/77 (15.6) 0.89 [0.52, 1.54] 0.88 [0.48, 1.59]
12 - < 24 89/368 (24.2) 1.39 [1.09, 1.77] 1.38 [1.05, 1.81]
24 - < 36 126/723 (17.4) 1.00 [REF] 1.00 [REF]
36 - < 60 223/1254 (17.8) 1.02 [0.84, 1.24] 1.04 [0.84, 1.30]
≥ 60 145/1111 (13.1) 0.75 [0.60, 0.93] 0.81 [0.63, 1.04]
Stillbirth (≥28 weeks gestation), n/N = 96/3688 = 2.6%
0.74 0.68
< 6 1/60 (2.5) 0.69 [0.09, 5.05] 0.62 [0.08, 4.69]
6 - < 12 2/79 (2.5) 1.04 [0.25, 4.41] 1.08 [0.25, 4.67]
12 - < 24 13/381 (3.4) 1.40 [0.70, 2.84] 1.35 [0.66, 2.77]
24 - < 36 18/741 (2.4) 1.00 [REF] 1.00 [REF]
36 - < 60 29/1283 (2.3) 0.93 [0.52, 1.66] 0.91 [0.50, 1.65]
≥ 60 33/1144 (2.9) 1.19 [0.67, 2.09] 0.96 [0.52, 1.78]
Perinatal death (stillbirth ≥28 weeks gestation or neonatal death ≤28 days old), n/N = 156/3732 = 4.2%
0.18 0.92
< 6 2/60 (3.3) 0.84 [0.20, 3.42] 0.81 [0.19, 3.39]
6 - < 12 2/81 (2.5) 0.62 [0.15, 2.55] 0.66 [0.16, 2.76]
12 - < 24 14/385 (3.6) 0.91 [0.49, 1.70] 0.87 [0.46, 1.64]
24 - < 36 30/753 (4.0) 1.00 [REF] 1.00 [REF]
36 - < 60 53/1298 (4.1) 1.02 [0.66, 1.59] 0.96 [0.61, 1.51]
≥ 60 55/1155 (4.8) 1.20 [0.77, 1.85] 0.93 [0.58, 1.50]
36

Table 2.2 (Continued)
Inter-pregnancy
interval, months
n/N (%)
Univariable RR
[95%CI]
p*
Multivariable RR
[95%CI]+
p*
Maternal anemia at study enrollment (hemoglobin <8.5 g/dL), n/N = 373/3222 = 11.6%
0.27 0.89
< 6 2/52 (3.9) 0.30 [0.08, 1.18] 0.31 [0.08, 1.25]
6 - < 12 10/75 (13.3) 1.04 [0.56, 1.91] 1.03 [0.53, 1.99]
12 - < 24 41/333 (12.3) 0.96 [0.68, 1.36] 0.93 [0.64, 1.36]
24 - < 36 84/655 (12.8) 1.00 [REF] 1.00 [REF]
36 - < 60 132/1110 (11.9) 0.93 [0.72, 1.20] 1.00 [0.76, 1.31]
≥ 60 104/997 (10.4) 0.81 [0.62, 1.07] 0.90 [0.66, 1.22]
* p-value for test of trend
+ Adjusted for maternal age (<20, 20 - <25, 25 - <30, ≥30 years), parity (1, 2, ≥3), marital status (married/cohabiting or not partnered), education (0-4, 5-7, 8-11, ≥12 years), wealth score (< or ≥ median), body mass index at enrollment (<22, 22 - <25, 25 - <30, ≥30 kg/m2
), randomization to multivitamin use,
age at first pregnancy (<20 or ≥20 years), and history of preterm birth
++ Additionally adjusted for gestational age at enrollment (weeks)
37

Inter-pregnancy intervals of 12 to less than 24 months were associated with an increased risk of preterm
birth, compared to 24 to less than 36 month intervals (adjusted RR 1.38; 95% CI 1.05, 1.81). We did not
find a significantly increased risk of preterm birth, however, for intervals shorter than 18 months or longer
than 36 months. Inter-pregnancy interval was not a significant independent risk factor for stillbirth or
perinatal death among women with a live birth in their last pregnancy.
Among women with a stillbirth last pregnancy (n=241)
The distribution of participant characteristics at study enrollment among women with a stillbirth last
pregnancy was similar to that of women with a previous live birth in terms of gestational age, marital
status, education, body mass index, and age at first pregnancy (Table 2.1). Participants with a stillbirth
last pregnancy tended to be younger, primiparous, have a history of a preterm birth, and have shorter
inter-pregnancy intervals than women whose previous pregnancy was a live birth. Among women with a
previous stillbirth, 38 (16%) had an inter-pregnancy interval of less than 6 months, 31 (13%) between 6
and less than 12 months, 57 (24%) between 12 and less than 24 months, 39 (16%) between 24 and less
than 36 months, 40 (17%) between 36 and less than 60 months, and 36 (15%) 60 months or greater.
The likelihood of SGA, LBW, stillbirth, and perinatal death were all higher among women with a
stillbirth last pregnancy than those who had a live birth (Tables 2.2 and 2.3). The risk of preterm birth and
maternal anemia were similar.
Among women with a stillbirth last pregnancy, inter-pregnancy interval did not significantly affect the
risk of SGA or LBW among term births (Table 2.3). Compared to 24 to less than 36 months, women with
intervals less than 24 months and those 36 months or greater appeared to be at higher risk of preterm
birth, but these associations were not statistically significant. Women with shorter inter-pregnancy
intervals were at increased risk of both stillbirth (trend test p-value = 0.03) and perinatal death (trend test
p-value < 0.01).
38

Table 2.3. Inter-pregnancy interval and perinatal outcomes among women with a stillbirth last
pregnancy (n=241)
Inter-pregnancy
interval, months
n/N (%)
Univariable RR
[95%CI]
p*
Multivariable RR
[95%CI]+
p*
Small for gestational age (<10th percentile) among term births (≥37 weeks), n/N = 26/175 = 14.9%
0.68 0.92
< 6 6/26 (23.1) 1.05 [0.40, 2.75] 0.84 [0.25, 2.81]
6 - < 12 0/22 (0) - -
12 - < 24 8/35 (22.9) 1.04 [0.43, 2.55] 1.07 [0.35, 3.32]
24 - < 36 7/32 (21.9) 1.00 [REF] 1.00 [REF]
36 - < 60 3/32 (9.4) 0.43 [0.12, 1.51] 0.39 [0.09, 1.71]
≥ 60 2/28 (7.1) 0.33 [0.07, 1.45] 0.40 [0.07, 2.27]
Low birth weight (<2500 g) among term births (≥37 weeks), n/N = 16/185 = 8.7%
0.59 0.60
< 6 2/29 (6.9) 0.55 [0.11, 2.79] 0.41 [0.05, 3.63]
6 - < 12 0/24 (0) - -
12 - < 24 8/40 (20.0) 1.60 [0.53, 4.84] 1.87 [0.48, 7.36]
24 - < 36 4/32 (12.5) 1.00 [REF] 1.00 [REF]
36 - < 60 1/32 (3.1) 0.25 [0.03, 2.12] 0.25 [0.02, 3.27]
≥ 60 1/28 (3.6) 0.29 [0.03, 2.41] 0.40 [0.03, 5.16]
Preterm birth (<37 weeks), n/N = 36/222 = 16.2%
0.87 0.84
< 6 4/32 (12.5) 1.19 [0.32, 4.37] 1.44 [0.34, 6.03]
6 - < 12 4/27 (14.8) 1.41 [0.39, 5.14] 1.28 [0.31, 5.30]
12 - < 24 13/52 (25.0) 2.38 [0.84, 6.72] 2.51 [0.76, 8.26]
24 - < 36 4/38 (10.5) 1.00 [REF] 1.00 [REF]
36 - < 60 5/38 (13.2) 1.25 [0.36, 4.30] 1.30 [0.32, 5.25]
≥ 60 6/35 (17.1) 1.63 [0.50, 5.29] 1.69 [0.43, 6.74]
Stillbirth (≥28 weeks gestation), n/N = 11/233 = 4.7%
0.03 0.03
< 6 4/36 (11.1) 4.33 [0.51, 36.98] 7.81 [0.50, 122.70]
6 - < 12 2/29 (6.9) 2.69 [0.26, 28.25] 0.66 [0.03, 16.40]
12 - < 24 4/56 (7.1) 2.79 [0.32, 23.98] 0.90 [0.05, 17.37]
24 - < 36 1/39 (2.6) 1.00 [REF] 1.00 [REF]
36 - < 60 0/38 (0) - -
≥ 60 0/35 (0) - -
Perinatal death (stillbirth ≥28 weeks gestation or neonatal death ≤28 days old), n/N = 20/241 = 8.3%
0.01 <0.01
< 6 7/38 (18.4) 2.39 [0.67, 8.58] 3.01 [0.66, 13.78]
6 - < 12 3/31 (9.7) 1.26 [0.27, 5.81] 1.43 [0.24, 8.31]
12 - < 24 6/57 (10.5) 1.37 [0.36, 5.15] 1.36 [0.29, 6.46]
24 - < 36 3/39 (7.7) 1.00 [REF] 1.00 [REF]
36 - < 60 1/40 (2.5) 0.33 [0.04, 2.99] 0.28 [0.02, 3.21]
≥ 60 0/36 (0) - -
39

Table 2.3 (Continued)
Inter-pregnancy
interval, months
n/N (%)
Univariable RR
[95%CI]
p*
Multivariable RR
[95%CI]+
p*
Maternal anemia at study enrollment (hemoglobin <8.5 g/dL), n/N = 22/207 = 10.6%
0.40 0.90
< 6 3/33 (9.1) 0.80 [0.19, 3.29] 1.06 [0.15, 7.45]
6 - < 12 3/27 (11.1) 0.97 [0.24, 3.98] 1.23 [0.22, 6.99]
12 - < 24 7/46 (15.2) 1.33 [0.42, 4.19] 2.91 [0.67, 12.65]
24 - < 36 4/35 (11.4) 1.00 [REF] 1.00 [REF]
36 - < 60 3/34 (8.8) 0.77 [0.19, 3.20] 0.69 [0.11, 4.34]
≥ 60 2/32 (6.3) 0.55 [0.11, 2.79] 2.32 [0.27, 19.92]
* p-value for test of trend
+ Adjusted for maternal age (<20, 20 - <25, 25 - <30, ≥30 years), parity (1, 2, ≥3), marital status (married/cohabiting or not partnered), education (0-4, 5-7, 8-11, ≥12 years), wealth score (< or ≥ median), body mass index at enrollment (<22, 22 - <25, 25 - <30, ≥30 kg/m2
), randomization to multivitamin use,
age at first pregnancy (<20 or ≥20 years), and history of preterm birth
++ Additionally adjusted for gestational age at enrollment (weeks)
40

In the multivariable-adjusted models, women with intervals less than six months were over seven times as
likely to have a stillbirth and three times more likely to have a perinatal death than women with 24 to less
than 36 month intervals, although these relationships were not statistically significant. Following either a
live birth or stillbirth, we did not find an association between inter-pregnancy interval and maternal
anemia at study enrollment (hemoglobin < 8.5 g/dL). We also examined this relationship using an anemia
definition of hemoglobin less than 11.0 g/dL, and again did not find an association.
Evaluation of non-linear relationships and effect modification
In restricted cubic spline analyses, we did not find evidence of a non-linear relationship between inter-
pregnancy interval and any of the outcomes of interest, among women with either a live birth or stillbirth
in their last pregnancy (test for curvature p-values ≥ 0.05). We also did not find evidence of effect
modification of the relationship between inter-pregnancy interval and any of the perinatal outcomes by
parity, age at first pregnancy, or anemia at enrollment (likelihood ratio p-values ≥ 0.05). Women excluded
from the analysis due to missing data for inter-pregnancy interval or previous pregnancy outcome had
similar baseline characteristics to women included, except that those excluded tended to be slightly older
and have higher parity (data not shown).
41

Discussion
In our study population of 3973 women with a prior live or stillbirth, 16% (n=652) had inter-pregnancy
intervals shorter than the World Health Organization’s recommended 24 month period. Similar to
previous studies, we found that following a live birth, a short inter-pregnancy interval of less than six
months significantly increased the risk of having a LBW infant, compared to 24 to less than 36 month
intervals. We did not find significant evidence of increased risk of SGA or preterm birth with shorter
intervals, as previously noted in other studies and meta-analysis.2 This could be due to inadequate power
to detect the associations or that the effects of pregnancy spacing vary across populations.
Following a stillbirth, we found that the shorter the inter-pregnancy interval, the higher the risk of
stillbirth and perinatal death in the subsequent pregnancy. There is little evidence examining this
relationship following a stillbirth for comparison to our findings, but the data available also suggest
similar associations between short intervals and increased risk of adverse fetal and neonatal outcomes.21-24
The number of cases in each exposure group was small for some outcomes, so it is possible that we did
not have adequate statistical power to detect significant effects between some exposure levels and the
more rare outcomes.
Using splines, we did not find evidence of a significant non-linear relationship between inter-pregnancy
interval and any of the perinatal outcomes examined. We did note, however, that following a live birth,
short and long inter-pregnancy intervals were associated with increased risk of LBW, and following a
stillbirth, short and long intervals appeared to increase risk of preterm birth compared to the reference
group, although these associations were not statistically significant. We did not find increases in risk of
other adverse perinatal outcomes with longer intervals of five years or more as noted in some previous
studies.
42
The association between short inter-pregnancy interval and LBW may support a mechanism of maternal
nutritional depletion adversely affecting growth of the fetus in utero. It is possible that we did not see a
similar relationship following a stillbirth because those pregnancies would have been shorter on average
and women would not have had an infant to breastfeed; thus their nutritional reserves may not have been
as depleted. After a stillbirth, the association between shorter pregnancy spacing and increased risk of
stillbirth and perinatal death may support hypotheses of vertical disease transmission or abnormal
remodeling of endometrial blood vessels affecting placentation as biologic mechanisms. We did not find a
relationship between pregnancy spacing and maternal anemia at study enrollment, indicating that
women’s bodies may be able to re-build their hemoglobin stores relatively quickly after delivery.
We calculated length of inter-pregnancy interval using maternal self-report of pregnancy dating, which
may not have been accurately recalled. This is likely minimized since women who were unsure of their
last menstrual period dating underwent ultrasound dating confirmation. The dates used to calculate
pregnancy interval were obtained at the enrollment visit, prior to the outcomes’ occurrence, so any
misclassification of the exposure would likely be non-differential. Ten percent of women were excluded
for missing data. The baseline characteristics of these women and those included in the analysis were
similar, so their exclusion is unlikely to significantly bias our results.
Unfortunately we did not have information about breastfeeding practices between pregnancies or a
detailed history of each of a woman’s previous pregnancies, so we could not adjust for these factors in our
analysis. We believe we have addressed many of the major known confounders of the relationship
between inter-pregnancy interval and perinatal outcomes, but it is possible that residual confounding by
these and other factors remains.
Our analysis is one of a small number of studies examining the effects of pregnancy spacing on perinatal
outcomes among women in sub-Saharan Africa. We were able to examine various adverse pregnancy
43

outcomes using data collected in a standardized, detailed manner for a randomized trial. We prospectively
ascertained the exposure and were able to adjust for many important confounding factors. We were also
able to examine the relationship between pregnancy spacing and perinatal outcomes taking into account
the outcome of the pregnancy that began the interval, which has seldom been done in previous studies.
Our results may be generalizable to women in urban settings in developing countries similar to Dar es
Salaam. It is possible the relationship between pregnancy spacing and perinatal outcomes varies across
populations with differing breastfeeding practices, nutritional intake, and by prevalence of other factors
associated with adverse pregnancy outcomes.
Conclusion
In our population of multiparous women in Dar es Salaam, Tanzania, short inter-pregnancy intervals were
associated with increased risk of low birth weight following a live birth, and increased risk of stillbirth
and perinatal death following a stillbirth. Information about these risks should be provided during family
planning counseling. Women with short pregnancy spacing may warrant increased antenatal surveillance
in their subsequent pregnancy. Public health programs and policies related to reproductive health should
facilitate optimal pregnancy spacing through dissemination of information on the impact of pregnancy
spacing and provision of access to effective methods of contraception and family planning services.
44

References
1. World Health Organization. Report of a WHO technical consultation on birth spacing. Geneva;
2007.
2. Conde-Agudelo A, Rosas-Bermudez A, Kafury-Goeta AC. Birth spacing and risk of adverse
perinatal outcomes: a meta-analysis. Jama. 2006; 295(15): 1809-23.
3. Stephansson O, Dickman PW, Cnattingius S. The influence of interpregnancy interval on the
subsequent risk of stillbirth and early neonatal death. Obstetrics and gynecology. 2003; 102(1): 101-8.
4. Smith GC, Pell JP, Dobbie R. Interpregnancy interval and risk of preterm birth and neonatal
death: retrospective cohort study. BMJ. 2003; 327(7410): 313.
5. Rutstein SO. Effects of preceding birth intervals on neonatal, infant and under-five years
mortality and nutritional status in developing countries: evidence from the demographic and health
surveys. International journal of gynaecology and obstetrics: the official organ of the International
Federation of Gynaecology and Obstetrics. 2005; 89 Suppl 1: S7-24.
6. Dewey KG, Cohen RJ. Does birth spacing affect maternal or child nutritional status? A
systematic literature review. Maternal & child nutrition. 2007; 3(3): 151-73.
7. Conde-Agudelo A, Rosas-Bermudez A, Kafury-Goeta AC. Effects of birth spacing on maternal
health: a systematic review. American journal of obstetrics and gynecology. 2007; 196(4): 297-308.
8. Conde-Agudelo A, Rosas-Bermudez A, Castano F, Norton MH. Effects of birth spacing on
maternal, perinatal, infant, and child health: a systematic review of causal mechanisms. Studies in family
planning. 2012; 43(2): 93-114.
9. Zhu BP, Rolfs RT, Nangle BE, Horan JM. Effect of the interval between pregnancies on perinatal
outcomes. The New England journal of medicine. 1999; 340(8): 589-94.
10. Exavery A, Mrema S, Shamte A, Bietsch K, Mosha D, Mbaruku G, et al. Levels and correlates of
non-adherence to WHO recommended inter-birth intervals in Rufiji, Tanzania. BMC pregnancy and
childbirth. 2012; 12: 152.
45

11. Muganyizi PS, Mageta D. Does the use of modern family planning promote healthy timing and
spacing of pregnancy in Dar es Salaam? Reproductive health. 2013; 10: 65.
12. National Bureau of Statistics (NBS) [Tanzania] and ICF Macro. Tanzania Demographic and
Health Survey 2010. Dar es Salaam, Tanzania; 2011.
13. Fawzi WW, Msamanga GI, Urassa W, Hertzmark E, Petraro P, Willett WC, et al. Vitamins and
perinatal outcomes among HIV-negative women in Tanzania. The New England journal of medicine.
2007; 356(14): 1423-31.
14. American College of Obstetricians and Gynecologists. Method for estimating due date.
Committee Opinion No. 611. Obstetrics and gynecology. 2014; 124: 863-6.
15. Villar J, Cheikh Ismail L, Victora CG, Ohuma EO, Bertino E, Altman DG, et al. International
standards for newborn weight, length, and head circumference by gestational age and sex: the Newborn
Cross-Sectional Study of the INTERGROWTH-21st Project. Lancet. 2014; 384(9946): 857-68.
16. Filmer D, Pritchett LH. Estimating wealth effects without expenditure data--or tears: an
application to educational enrollments in states of India. Demography. 2001; 38(1): 115-32.
17. Spiegelman D, Hertzmark E. Easy SAS calculations for risk or prevalence ratios and differences.
American journal of epidemiology. 2005; 162(3): 199-200.
18. Institute of Medicine. Nutrition during pregnancy. Washington: National Academy of Sciences;
1990.
19. Miettinen OS. Theoretical Epidemiology: Principles of Occurrence Research in Medicine; 1985.
20. Durrleman S, Simon R. Flexible regression models with cubic splines. Statistics in medicine.
1989; 8(5): 551-61.
21. DaVanzo J, Hale L, Razzaque A, Rahman M. The effects of pregnancy spacing on infant and
child mortality in Matlab, Bangladesh: how they vary by the type of pregnancy outcome that began the
interval. Population studies. 2008; 62(2): 131-54.
22. Black M, Shetty A, Bhattacharya S. Obstetric outcomes subsequent to intrauterine death in the
first pregnancy. BJOG : an international journal of obstetrics and gynaecology. 2008; 115(2): 269-74.
46

23. Zhu BP. Effect of interpregnancy interval on birth outcomes: findings from three recent US
studies. International journal of gynaecology and obstetrics: the official organ of the International
Federation of Gynaecology and Obstetrics. 2005; 89 Suppl 1: S25-33.
24. Nabukera SK, Wingate MS, Kirby RS, Owen J, Swaminathan S, Alexander GR, et al.
Interpregnancy interval and subsequent perinatal outcomes among women delaying initiation of
childbearing. The journal of obstetrics and gynaecology research. 2008; 34(6): 941-7.
47
Title
Kangaroo mother care and neonatal outcomes: a systematic review and meta-analysis
Authors
Ellen O. Boundy,1 Roya Dastjerdi,
2 Donna Spiegelman,
1,2,3 Wafaie W. Fawzi,
1,2,4 Stacey A. Missmer,
1,5
Ellice Lieberman,1,6,7
Sandhya Kajeepeta,1 Stephen Wall,
8 Grace J. Chan
2,8,9
1Department of Epidemiology, Harvard T.H. Chan School of Public Health, Boston, Massachusetts, USA
2Department of Global Health and Population, Harvard School of Public Health, Boston, Massachusetts,
USA
3Department of Biostatistics, Harvard T.H. Chan School of Public Health, Boston, Massachusetts, USA
4Department of Nutrition, Harvard T.H. Chan School of Public Health, Boston, Massachusetts, USA
5Department of Obstetrics, Gynecology, and Reproductive Biology, Brigham and Women’s Hospital and
Harvard Medical School, Boston, Massachusetts, USA
6Department of Pediatric Newborn Medicine, Brigham and Women’s Hospital, Boston, Massachusetts,
USA
7Department of Social and Behavioral Sciences, Harvard School of Public Health, Boston,
Massachusetts, USA
8Save the Children, Washington, D.C., USA
9Department of Medicine, Boston Children’s Hospital, Boston, Massachusetts, USA
Funding
Bill and Melinda Gates Foundation. EB received research funding support from Training Grant
T32HD060454 in Reproductive, Perinatal, and Pediatric Epidemiology from the National Institute of
Child Health and Human Development, National Institutes of Health and MCHB Training Grant
T76MC00001 from the Maternal and Child Health Bureau.
48

Abstract
Background: Kangaroo mother care (KMC) is an intervention aimed at preventing deaths among preterm
and low birth weight (LBW) newborns. Previous reviews on the effects of KMC have not included
observational studies, normal birth weight infants, or physiologic parameter outcomes.
Methods: We conducted a systematic review and meta-analysis of randomized trials and observational
studies of KMC and neonatal outcomes through April 2014. Random effects estimates of relative risk
(RR) and 95% confidence intervals (CI) were calculated for dichotomous outcomes, and mean difference
(MD) and 95% CI for continuous outcomes.
Findings: 1035 studies were screened; 124 of which met criteria for inclusion. Compared to conventional
care, KMC was associated with 36% lower mortality among LBW newborns (<2000 g) (RR 0·64; 95%
CI 0·46-0·89), but did not have a significant effect among infants of all birth weights. KMC decreased
risk of neonatal sepsis (RR 0·53, 95% CI 0·34-0·83), hypothermia (RR 0·22; 95% CI 0·12-0·41),
hypoglycemia (RR 0·12; 95% CI 0·05-0·32), and hospital readmission (RR 0·42; 95% CI 0·23-0·76).
KMC increased likelihood of exclusive breastfeeding at hospital discharge (RR 1·50; 95% CI 1·26-1·78).
Newborns receiving KMC had lower mean respiratory rate and pain measures, and higher oxygen
saturation, temperature, and head circumference growth.
Interpretation: Among newborns who survived to receive KMC, KMC was associated with decreased
mortality and morbidity and increased exclusive breastfeeding. Interventions to scale up KMC
implementation are warranted.
49

Background
An estimated four million babies die each year during their first four weeks of life.1 While important
progress has been made toward Millennium Development Goal 4 to reduce mortality in children under 5,
less improvement has been made in the neonatal period.2 Preterm birth is the leading cause of global
neonatal mortality, responsible for over one million deaths each year.1, 3
Additionally, LBW infants are at
higher risk of neonatal mortality and morbidity, inhibited growth and development, and chronic disease.4
Health technologies like incubators can be used to improve outcomes in high-risk infants; however such
equipment is not widely available in low- and middle-income countries where 99% of all neonatal deaths
occur.1 Effective and low-cost alternative methods of neonatal care are needed to mitigate this high
disease burden.
In 1978, Dr. Edgar Rey Sanabria introduced kangaroo mother care (KMC) in Bogotá, Colombia as an
alternative to incubators for LBW infants when such resources were unavailable.5 The World Health
Organization defines KMC with four main components: early, continuous, and prolonged skin-to-skin
contact (SSC) between the newborn and mother, exclusive breastfeeding when possible, early discharge
from the health facility, and close follow-up at home.6 It is postulated that KMC improves neonatal
outcomes by maintaining the newborn’s temperature and other vital sign parameters through SSC.5 The
infant also benefits from the positive effects of breastfeeding. These mechanisms are thought to improve
outcomes in all newborns, but may be especially beneficial in preterm infants.
Several meta-analyses have been published summarizing evidence related to the efficacy of KMC. Lawn
et al. reported a reduced the risk of mortality and severe morbidity among preterm infants receiving
KMC.7 Among LBW infants in randomized control trials (RCTs), KMC has also been found to decrease
the risk of mortality, nosocomial infections, hypothermia, and length of hospital stay.8 Two Cochrane
Database reviews examined the evidence on SSC alone.9, 10
Moore et al. found that SSC improved
50

breastfeeding and cardio-respiratory stability, and decreased infant crying.9 Johnston et al. reported
improved responses to procedural pain among infants in SSC.10
While these meta-analyses have provided important information on the effectiveness of KMC, they are
limited to specific outcome measures, exposure measures, study designs, and newborn populations. An
inclusive review of the literature on KMC is needed to give a more complete understanding of its benefits
and drawbacks. This systematic review and meta-analysis aims to provide a comprehensive summary of
observational studies and randomized controlled trials on KMC and neonatal outcomes.
51

Methods
Search strategy and selection criteria
The literature search for this review included original reports, direct queries of authors of published
papers, and program reports with no limitation on year of publication. Studies were included if they
reported an association between KMC and any neonatal outcome. We defined KMC as SSC between a
caregiver and newborn, often also involving exclusive or nearly exclusive breastfeeding and early
discharge from the hospital. We excluded studies with non-human subjects, less than 10 participants, non-
primary data collection or analysis, no report of a quantitative effect measure, no comparison group, and
no neonatal outcome measure. We did not restrict to a specific gestational age or birth weight of
newborns receiving KMC.
Studies were identified through searches of the electronic databases PubMed, Embase, Web of Science,
Scopus, AIM, LILACS, IMEMR, IMSEAR, and WPRIM using the search terms ‘kangaroo mother care,’
‘kangaroo care,’ and ‘skin to skin care’ through April 24, 2014. We also conducted hand-searches of the
reference lists of published systematic reviews. To search the “grey literature” for unpublished studies, we
explored programmatic reports and requested data from programs implementing KMC.
Data abstraction and synthesis
All abstracts were screened by two independent reviewers. When eligibility for inclusion was unclear
from the abstract, two reviewers conducted full-text screens. Two reviewers then abstracted data from the
full-text of all articles meeting the inclusion criteria. At each stage, reviewers compared results to ensure
agreement. In the case of disagreement, a third party acted as tiebreaker. Data from articles in English,
Spanish, and Portuguese were abstracted by two fluent speakers. For articles in less common languages, a
single native speaker or online translation software was used for data abstraction. If an article was missing
key information, we contacted authors by email to request data or clarification.
52

We collected information on study design, setting, participant characteristics, components and description
of KMC and comparison groups, follow-up time, outcomes, assessment of bias, and measures of
association. We collected exposure data on the components of KMC, clinical stabilization criteria for
starting KMC, and duration of SSC promoted and practiced. Raw data and relative risk or mean
difference effect estimates with 95% confidence intervals were extracted.
Study quality
Two independent reviewers assessed the methodological quality of included studies in five domains:
selection bias, information bias, detection bias, attrition bias, and other bias.11
For observational studies,
an additional domain for confounding was assessed. Each domain was categorized as high, low, or
unclear risk of bias. We then created an overall assessment of bias for each study. For RCTs, if both
selection and information bias were low risk, the overall risk of bias was considered low. If either domain
was high risk, the overall risk of bias was designated as high. For observational studies, if selection bias,
information bias, and confounding were all low risk, the overall risk of bias was considered low. If any of
those three domains was high risk, the overall risk was considered high. Otherwise, the overall risk of bias
was considered unclear.
Statistical analysis
We used the random effects estimator to assess the effect of KMC compared to conventional care on each
neonatal outcome.12
For dichotomous outcomes, we report summary estimates as relative risks (RR) and
95% confidence intervals (CI). For studies which did not report a RR, we calculated the RR and standard
error from the raw data if available. We excluded studies with zero cells from the summary estimates. For
continuous outcomes, we report summary estimates as mean differences (MD) and 95% CI. When
outcomes were reported using different units or scales across studies, the standardized mean difference
(SMD) was calculated.11
When available, estimates adjusted for confounding were used rather than crude
estimates. We performed sensitivity analyses by restricting to RCTs and adjusted RR estimates for
53

dichotomous outcomes, and restricting to RCTs and randomized crossover studies for continuous
outcomes.
To assess between-study heterogeneity, we report the I2 statistic and the p-value for the Q statistic.
12-14
The I2 statistic quantifies the amount of variation in the effect estimate attributable to between-study
heterogeneity, reported as a percentage. A higher I2 indicates more heterogeneity in the effect across
studies. We conducted subgroup analyses and meta-regression for outcomes with data from at least 10
studies. We explored the effect of KMC on neonatal outcomes in the following pre-determined
subgroups: year, study type, sample size, location, country-level economy,15
country-level neonatal
mortality in 2013,16
infant gestational age and weight at birth, KMC components, SSC initiation criteria
and duration, and study quality classification. In the meta-regression analyses, we report the residual I2,
indicating the amount of remaining heterogeneity in the effect estimate after adjusting for a given
characteristic. The indicator method was used for missing covariate information in meta-regression
analyses.17
We assessed publication bias by visual inspection of funnel plots of effect size and standard error for
asymmetry and by Begg’s rank correlation and Egger’s linear regression tests.18, 19 All meta-analyses were
conducted using STATA statistical software (version 13·1), and risk of bias figures were created using
RevMan software (version 5·3).
Role of the funding source
Financial support was provided by a grant from the Bill and Melinda Gates Foundation. The funders had
no role in study design, data collection and analysis, decision to publish, or preparation of the manuscript.
54

Results
Our search identified 2515 records (Figure 3.1). We then identified 29 additional records related to KMC
through crosscheck of reference lists from previous reviews, personal communication with an author,20
and programmatic reports. After 1006 duplicate records were removed, 1035 underwent initial abstract
screening. Of those, 527 did not meet inclusion criteria. Full-text articles for the remaining 508 records
were then assessed for inclusion. Of those, 384 did not meet inclusion criteria. This review and meta-
analysis includes 124 studies that reported an association between KMC and at least one neonatal
outcome. One hundred eleven of the included studies (90%) were in English, seven (6%) in Portuguese,
four (3%) in Spanish, and two (2%) in Farsi. We emailed eight authors to obtain additional data or
clarification,21-28
and received a response with data from two.22, 23
A description of each study included in
this review is in Supplementary Table 3.13 and risk of bias classification for each study is presented in
Supplementary Tables 3.11 and 3.12.
Study characteristics
Characteristics of the 124 included studies are presented in Table 3.1. One hundred ten studies (89%)
were published between 2000 and 2014. Seventy-six studies (61%) had less than 100 study participants.
Fifty-five studies (44%) were RCTs, 8 (6%) were randomized crossover trials, and the remaining 61
studies (49%) were observational or non-randomized intervention studies. The vast majority (n=113,
94%) were conducted in middle or high income countries. One hundred eighteen studies (98%) took place
in health facilities, and 3 (2%) were community or population-based.
Among articles reporting gestational age data, the majority (n=61, 68%) were among preterm infants less
than 37 weeks gestation at birth, 17 (19%) were of full-term infants defined as 35 to 37 weeks or greater,
and 12 (13%) were of infants of all gestational ages.
55

Figure 3.1 Flow diagram for identification of included studies
56

Table 3.1. Characteristics of included studies (n=124)
Characteristic Number of studies, n (%)
Year of publication
1988 - 1999 14 (11)
2000 - 2009 58 (47)
2010 - 2014 52 (42)
Sample size
< 50 43 (35)
50 - < 100 33 (27)
100 - < 200 21 (17)
≥ 200 27 (22)
Study type
Randomized control trial 55 (44)
Cohort 17 (14)
Pre-post 23 (19)
Intervention trial (non-randomized) 8 (6)
Randomized crossover 8 (6)
Crossover (non-randomized) 3 (2)
Case-control 2 (2)
Chart review 5 (4)
Facilities evaluation 2 (2)
Interview/survey 1 (1)
Region (World Health Organization)
Africa 11 (9)
Americas 50 (41)
Eastern Mediterranean 11 (9)
Europe 19 (16)
Southeast Asia 20 (17)
Western Pacific 9 (7)
Multiple 1 (1)
Country-level economy (World Bank)
Low income 7 (6)
Middle income 65 (54)
High income 48 (40)
Multiple 1 (1)
Country-level neonatal mortality ratio,
deaths/1000 live births
< 5 52 (43)
5 - < 15 36 (30)
15 - < 30 29 (24)
≥ 30 4 (3)
Setting
Urban 92 (90)
Rural 4 (4)
Mixed 6 (6)
Facility type
NICU or step-down unit 51 (42)
Health facility 67 (55)
Community or population based 3 (2)
57

Table 3.1 (Continued)
Characteristic Number of studies, n (%)
Gestational age at birth
Preterm < 37weeks 34 (38)
Very preterm < 34 weeks 27 (30)
Full-term ≥ 35 – 37 weeks 17 (19)
All gestational ages 11 (12)
Comparison: preterm vs full term 1 (1)
Birth weight
Low birth weight ≤ 2500 g 47 (58)
Very low birth weight ≤ 1500 g 15 (19)
Normal birth weight ≥ 2500 g 9 (11)
All birth weights 10 (12)
KMC components
SSC only 71 (68)
SSC + EBF 14 (13)
SSC + EBF + DC 1 (1)
SSC + EBF + DC + FU 4 (4)
SSC + DC 1 (1)
SSC + DC + FU 7 (7)
SSC + EBF + FU 7 (7)
SSC initiation time
Immediately after birth 7 (8)
After stability criteria met 41 (48)
After other criteria met 27 (31)
For a painful procedure 11 (13)
SSC duration promoted, hours/day
< 2 38 (48)
2 – < 4 14 (18)
4 – < 9 6 (8)
9 – < 12 0
12 – < 22 1(1)
≥ 22 20 (25)
Number of days of SSC promoted
1 - 5 47 (75)
6 - < 30 9 (14)
≥ 30 2 (3)
Dependent on hospital stay 5 (8)
NICU: neonatal intensive care unit, g: grams, KMC: kangaroo mother care, SSC: skin-to-skin
contact, EBF: exclusive breastfeeding, DC: early discharge, FU: follow-up after discharge
58

Among articles reporting gestational age data, the majority (n=61, 68%) were among preterm infants less
than 37 weeks gestation at birth, 17 (19%) were of full-term infants defined as 35 to 37 weeks or greater,
and 12 (13%) were of infants of all gestational ages. Similarly, forty-seven studies (58%) were among
LBW infants (≤ 2500 g), an additional 15 (19%) were of very LBW infants (≤ 1500 g), nine (11%) were
in normal weight infants, and 10 (12%) were among infants of all birth weights. Forty-three studies (35%)
did not specify the birth weight of infants in their study and 34 (27%) did not specify gestational age.
Most studies (n=71, 68%) defined KMC as SSC only. Fourteen studies (13%) defined KMC as SSC plus
promotion of exclusive breastfeeding. Twenty studies’ (19%) KMC definition included an early discharge
or outpatient follow-up component. Nineteen studies (15%) did not describe the components of their
KMC intervention. SSC was initiated immediately after birth in 7 studies (8%), while 41 (48%) had
stability criteria to be met before SSC initiation, and 27 (31%) had some other non-stability related
criteria. Eleven studies (14%) looking at pain-related outcomes had mothers start SSC around the time of
a painful infant procedure. Fifty-two studies (66%) promoted less than 4 hours of SSC per day, 20 (25%)
promoted at least 22 hours per day, and few studies (n=7, 9%) had a SSC duration between 4 and 21
hours per day. Thirty-eight studies (31%) did not specify when SSC was initiated, and 45 studies (36%)
did not report the daily duration of SSC mothers were instructed to practice. Information on duration of
SSC actually practiced, as opposed to promoted or instructed, was only available in 16 studies (13%).
Meta-analysis
Results for summary RR estimates for the effect of KMC compared to conventional care on dichotomous
outcomes are reported in Table 3.2, and estimates of MD measures for continuous outcomes are reported
in Table 3.3. We present the results by outcome type: mortality, breastfeeding, infection, heart rate,
respiration and oxygenation, temperature, hypoglycemia and cortisol levels, hospital stay, growth, pain,
and other outcomes.
59

Table 3.2. Relative risk (RR) and 95% confidence interval (CI) for the effect of KMC compared to conventional care on dichotomous
neonatal outcomes
Outcome
All studies RCT and adjusted observational studies
n
RR [95%CI]^
p-
value
Test for
heterogeneity
(p-value)
I2, %
*
n
RR [95%CI]^
p
Test for
heterogeneity
(p-value)
I2, %
*
Mortality
Latest follow-up29,
30, 44-48, 81, 103-110
16 0·77 [0·60, 0·99] 0·05 <0·01 67 12 0·95 [0·73, 1·23] 0·69 0·13 32
≤ 45 days29, 30, 44, 45,
47, 99, 103-108
11 0·79 [0·57, 1·10] 0·17 <0·01 77 7 1·16 [0·91, 1·47] 0·23 0·29 18
3 – 12 months29, 30,
46, 48, 109, 110
7 0·59 [0·43, 0·82] <0·01 0·63 0 6 0·67 [0·47, 0·96] 0·03 0·88 0
LBW < 2000g29, 30,
44-48, 81, 103-107, 109, 110
15 0·64 [0·46, 0·89] 0·01 <0·01 72 11 0·86 [0·59, 1·24] 0·41 0·10 38
All birth weights103,
108
2 1·04 [0·82, 1·33] 0·73 0·83 0 1 1·06 [0·80, 1·41] 0·70 - -
Exclusive breastfeeding
Discharge or 40-
41weeks PMA33, 36,
37, 46, 58, 101, 103, 111-116
13 1·50 [1·26, 1·78] <0·01 <0·01 93 8 1·25 [1·10, 1·42] <0·01 <0·01 59
1-4 months old33, 36,
38, 111, 115, 117-119
8 1·39 [1·11, 1·74] 0·01 0·02 60 6 1·53 [1·08, 2·18] 0·02 <0·01 71
Other
Infection44, 47, 48, 99,
101, 102, 105, 106, 111, 113,
120, 121
12 0·67 [0·43, 1·05] 0·08 <0·01 60 10 0·60 [0·36, 1·01] 0·05 <0·01 65
Sepsis44, 47, 99, 101, 102,
105, 106, 111
8 0.53 [0·34, 0·83] 0·01 0·23 25 7 0·44 [0·29, 0·66] <0·01 0·49 0
NEC45, 47, 111
3 0·96 [0·45, 2·04] 0·92 0·45 0 3 0·96 [0·45, 2·04] 0·92 0·45 0
Hypothermia20, 34, 44,
47, 100, 102, 105, 111, 122
9 0.22 [0·12, 0·41] <0·01 <0·01 71 7 0·28 [0·15, 0·53] <0·01 0·01 65
Hyperthermia44, 102,
105
3 0·77 [0·59, 1·01] 0·06 0·88 0 3 0·77 [0·59, 1·01] 0·06 0·88 0
60

Table 3.2 (Continued)
Outcome
All studies RCT and adjusted observational studies
n
RR [95%CI]^
p-
value
Test for
heterogeneity
(p-value)
I2, %
*
n
RR [95%CI]^
p-
value
Test for
heterogeneity
(p-value)
I2, %
*
Apnea44, 47, 99, 100, 105,
111
6 0·39 [0·13, 1·14] 0·09 0·12 42 6 0·39 [0·13, 1·14] 0·09 0·12 42
Hypoglycemia44, 99
2 0·12 [0·05, 0·32] <0·01 0·53 0 2 0·12 [0·05, 0·32] <0·01 0·53 0
Readmission48, 117
2 0·42 [0·23, 0·76] <0·01 1·00 0 1 0·42 [0·14, 1·29] 0·13 - -
KMC: kangaroo mother care, PMA: post-menstrual age, NEC: necrotizing enterocolitis
^ Random effects estimates
* I-squared: variation in risk ratio or mean difference attributable to heterogeneity
61

Table 3.3. Mean difference (MD) and 95% confidence interval (CI) for the effect of KMC compared to conventional care on continuous
neonatal outcomes
Outcome
All studies RCT and randomized crossover studies
n
MD [95% CI]^
p-
value
Test for
heterogeneity
(p-value)
I2,
%*
n
MD [95% CI]^
p-
value
Test for
heterogeneity
(p-value)
I2,
%*
Vital signs
Heart rate, beats/min22,
50, 51, 53, 71, 82, 111, 123-130
15 -0·41 [-2·25, 1·42] 0·66 0·03 46 2 0·04 [-1·60, 1·68] 0·96 0·60 0
Respiratory rate,
breaths/ min50, 51, 71, 105,
111, 123, 125-130
12 -3·17 [-5·15, -1·19] <0·01 <0·01 75 3 -5·49 [-8·80,-2·18] <0·01 <0·01 88
Oxygen saturation, %50,
51, 53, 71, 105, 111, 123, 125-131
14 0·90 [0·35, 1·45] <0·01 <0·01 92 4 1·28 [0·39, 2·17] 0·01 <0·01 86
Temperature, degrees
C50, 51, 53, 72, 111, 122-125, 127-
129, 132, 133
14 0·24 [0·15, 0·33] <0·01 <0·01 82 3 0·24 [0·04, 0·44] 0·02 <0·01 91
Breastfeeding initiation
time, SMD35, 44, 105, 134
4 -1·07 [-2·30, 0·17] 0·09 <0·01 97 4 -1·07 [-2·30, 0·17] 0·09 <0·01 97
Growth
Weight change, g46, 98,
100, 106, 135
5 3·29 [-4·95, 11·52] 0·43 0·02 67 2 8·30 [1·16, 15·43] 0·02 0·31 3
Weight change, g/day44,
47, 101, 136, 137
5 2·58 [-0·51, 5·67] 0·10 <0·01 81 4 3·04 [-1·35, 7·43] 0·18 <0·01 84
Weight change,
g/kg/day45, 136
2 -0·84 [-3·39, 1·70] 0·52 0·02 81 0 - - - -
Weight change, SMD44-
47, 98, 100, 101, 106, 135-137 11 0·16 [-0·08, 0·40] 0·21 <0·01 81 6 0·33 [-0·05, 0·70] 0·09 <0·01 83
Length change,
cm/week44, 100
2 0·15 [-0·09, 0·39] 0·21 0·03 79 2 0·15 [-0·09, 0·39] 0·21 0·03 79
Length change, SMD44,
47, 100 3 0·24 [-0·02, 0·49] 0·07 0·26 25 3 0·24 [-0·02, 0·49] 0·07 0·26 25
Head circumference
change, cm/week44, 100,
101
3 0·19 [0·01, 0·37] 0·04 <0·01 89 3 0·19 [0·01, 0·37] 0·04 <0·01 89
62

Table 3.3 (Continued)
Outcome
All studies RCT and randomized crossover studies
n
MD [95% CI]^
p-
value
Test for
heterogeneity
(p-value)
I2,
%*
n
MD [95% CI]^
p-
value
Test for
heterogeneity
(p-value)
I2,
%*
Head circumference
change, SMD44, 47, 100, 101
4 0·61 [0·20, 1·02] <0·01 <0·01 77 4 0·61 [0·20, 1·02] <0·01 <0·01 77
Pain
Pain score, SMD22, 138-
146 10 -0·63 [-1·09, -0·16] 0·01 <0·01 89 8 -0·75 [-1·28, -0·22] 0·01 <0·01 89
Premature Infant Pain
Profile score, 0-2122, 140-
142, 144-146
7 -0·83 [-1·53, -0·13]
0·02 <0·01 88 5 -0·98 [-1·83, -0·13] 0·02 <0·01 91
Neonatal Infant Pain
Scale score, 0-722, 139, 143
3
-1·14 [-2·34, 0·05] 0·06 <0·01 85
2 -1·21 [-2·88, 0·45] 0·15 <0·01 91
Neonatal Facial Coding
System score, 0-10138,
139
2 -1·40 [-3·08, 0·28] 0·10 <0·01 91 2 -1·40 [-3·08, 0·28] 0·10 <0·01 91
Crying duration after
painful stimulus, sec84,
147, 148
3 -11·30[-19·79,-2·80] 0·01 0·80 0 3 -11·30[-19·79,-2·80] 0·01 0·80 0
Heart rate during
painful stimulus,
beats/min131, 138, 149
3 -7·46 [-12·98, -1·93] 0·01 0·25 29 3 -7·46 [-12·98, -1·93] 0·01 0·25 29
Heart rate after painful
stimulus, beats/min131,
138, 140, 149
4 -4·00 [-8·93, 0·93] 0·11 <0·01 87 3 -7·52 [-8·47, -6·58] <0·01 0·54 0
Other
Length of hospital stay,
days44, 45, 58, 98, 100, 105, 106,
114, 136, 137, 150, 151
12 -0·68 [-2·11, 0·75] 0·35 <0·01 95 5 -0·38 [-2·99, 2·23] 0·78 <0·01 91
Cortisol, SMD22, 72, 144
3 -0·44 [-0·94, 0·06] 0·08 0·12 54 2 -0·58 [-0·88, -0·29] <0·01 0·33 0
Min: minute, C: Celsius, SMD: standardized mean difference, g: grams, kg: kilograms, cm: centimeters
^ Random effects mean difference; * I-squared: variation in risk ratio or mean difference attributable to heterogeneity
63

64
Mortality
The RR of mortality assessed at each study’s latest follow-up time was 0·77 (n=16; 95% CI 0·60, 0·99); with
I2=67%, indicating moderate heterogeneity across studies (Figure 3.2). Eleven studies reported mortality during the
first 45 days of life, finding a non-significant decrease in mortality (RR 0·79; 95% CI 0·57, 1·10; I2=77%), while
seven studies reporting mortality up to 3, 6, or 12 months of age showed 41% lower mortality in the KMC groups
compared to controls (RR 0·59; 95% CI 0·43, 0·82; I2=0%) (Table 3.2). Two studies contributed mortality
estimates at both early and later follow-up times.29, 30
Among LBW newborns weighing less than 2000 g, KMC decreased mortality at latest follow-up time by 36%
(n=15; RR 0·64; 95% CI 0·46, 0·89; I2=72%). In the two studies including infants of all birth weights, KMC did
not significantly affect mortality (RR 1·04; 95% CI 0·82, 1·33). Results of the other subgroup analyses of study
characteristics and KMC components for mortality at latest follow-up are shown in Supplementary Table 3.1. We
did not find important differences in the effect of KMC on mortality by study location or country-level economy or
background neonatal mortality rate. The two studies whose KMC intervention included SSC, exclusive
breastfeeding, early discharge, and close follow-up showed a stronger protective effect of KMC against mortality
(RR 0·43; 95% CI 0·19, 0·98) than studies using other definitions of KMC. Similarly, when mothers were
encouraged to provide SSC plus at least one other KMC component, KMC was protective against mortality (n=9;
RR 0·65; 95% CI 0·48, 0·89), while studies where KMC was defined as SSC alone did not (n=5; RR 0·71; 95% CI
0·33, 1·52). There was no difference in the mortality outcome among studies which included promotion of
exclusive breastfeeding in their KMC definition compared to those who did not.
Studies instructing mothers to start SSC after stability criteria was met showed a similarly protective effect against
mortality (n=9, RR 0·57; 95% CI 0·34, 0·97) as those which started SSC immediately (n=3, RR 0·51; 95% CI 0·33,
0·78) (Supplementary Figure 3.1). The 11 studies promoting at least 22 hours of SSC per day showed a protective
effect of KMC (RR 0.64; 95% CI 0.44, 0.92) on mortality, while there was no effect in the one study promoting a
duration of 4 to 8 hours per day or the four studies which did not define SSC duration. (Supplementary Figure 3.2).

65
Figure 3.2. Forest plot for effect of KMC compared to conventional care on mortality at latest follow-up
time, grouped by follow-up time
.
.
Overall (I-squared = 67.4%, p = 0.000)
<= 45 days
McMaster
Lamy Filho
Sloan
Kadam
Rojas
Charpak
Cattaneo
3-12 months
Blay
Suman
Lincetto
Author
Pattinson
Worku
Ahmed
Whitelaw
Charpak
Sloan
2000
2008
2008
2005
2003
1994
1998
2009
2008
2000
year
2006
2005
2011
1988
2001
1994
0.77 (0.60, 0.99)
0.17 (0.07, 0.44)
1.99 (0.20, 19.75)
1.06 (0.80, 1.41)
1.02 (0.07, 15.80)
1.64 (0.16, 17.13)
0.54 (0.22, 1.32)
0.91 (0.19, 4.43)
1.36 (1.11, 1.66)
0.20 (0.02, 1.68)
0.34 (0.16, 0.72)
RR (95% CI)
0.81 (0.72, 0.91)
0.59 (0.34, 1.03)
1.00 (0.63, 1.60)
1.03 (0.15, 6.91)
0.57 (0.22, 1.50)
0.97 (0.45, 2.09)
100.00
4.95
1.14
13.50
0.82
1.09
5.37
2.22
14.71
1.31
6.72
Weight
15.66
9.09
10.46
1.60
4.83
6.53
%
<1500g
500-1749g
All BW
<1800g
<=1500g
<2000g
1000-1999g
1000-2000g
<2000g
<=1800g
Birth_Weight
1000-1999g
<2000g
All BW
<1500g
<2000g
<2000g
0.77 (0.60, 0.99)
0.17 (0.07, 0.44)
1.99 (0.20, 19.75)
1.06 (0.80, 1.41)
1.02 (0.07, 15.80)
1.64 (0.16, 17.13)
0.54 (0.22, 1.32)
0.91 (0.19, 4.43)
1.36 (1.11, 1.66)
0.20 (0.02, 1.68)
0.34 (0.16, 0.72)
RR (95% CI)
0.81 (0.72, 0.91)
0.59 (0.34, 1.03)
1.00 (0.63, 1.60)
1.03 (0.15, 6.91)
0.57 (0.22, 1.50)
0.97 (0.45, 2.09)
100.00
4.95
1.14
13.50
0.82
1.09
5.37
2.22
14.71
1.31
6.72
Weight
15.66
9.09
10.46
1.60
4.83
6.53
%
KMC decreases mortality risk KMC increases mortality risk
1.1 1 10

66
Breastfeeding
KMC increased the likelihood of exclusive breastfeeding at hospital discharge or 40-41 weeks post-menstrual age
by 50% (n=13; RR 1·50; 95% CI 1·26, 1·78; I2=93%) (Supplementary Figure 3.3). Among these studies, KMC
increased the likelihood of exclusive breastfeeding across nearly all subgroups of study, infant, and KMC
characteristics (Supplementary Table 3.2). Studies that encouraged exclusive breastfeeding as part of the KMC
intervention showed a 10% stronger effect (n=7; RR 1·46; 95% CI 1·17, 1·82) than the studies that did not have
this KMC component (n=4; RR 1·36; 95% CI 1·11, 1·66).
In studies which examined exclusive breastfeeding at longer follow-up times of one to four months, KMC increased
its likelihood by 39% (n=8; RR 1·39; 95% CI 1·11, 1·74; I2=60%) (Table 3.2). KMC did not have a significant
impact on the standardized mean difference in time to breastfeeding initiation (n=4; SMD -1·07; 95% CI -2·30,
0·17; I2=97%) (Table 3.3). Several studies looked at other feeding outcomes that were too heterogeneous to
combine into a summary estimate.31-38
Infection
Risk of infection during study follow-up was not statistically different between the KMC and control groups (n=12;
RR 0·67; 95% CI 0·43, 1·05; I2=60%) (Table 3.2). When stratified by infection type, KMC was associated with a
47% decrease in risk of sepsis (n=8; RR 0·53; 95% CI 0·34, 0·83; I2=25%), but did not have an effect on
methicillin-resistant staph aureus or other severe infections (n=4; RR 1·00; 95% CI 0·40, 2·46; I2=77%)
(Supplementary Figure 3.4). Similarly, KMC did not have a significant effect on risk of necrotizing enterocolitis
(n=3; RR 0·96; 95% CI 0·45, 2·04) (Table 3.2). All the studies that examined sepsis and necrotizing enterocolitis
were among infants less than 2250 g at birth.
Among RCTs, KMC decreased risk of infection by 49% (n=9; RR 0·51; 95% CI 0·32, 0·81; I2=54%)
(Supplementary Table 3.3). The nine studies that had stability criteria before initiating SSC showed a protective

67
effect of KMC against infection (RR 0·50; 95% CI 0·33-0·77), while the two studies that had other non-stability
related criteria before initiation did not show an effect (RR 1·00; 95% CI 0·69-1·45).
Vital signs
Heart rate
KMC did not have a significant effect on mean heart rate (n=15; MD 0·41 beats per minute; 95% CI -2·25, 1·42;
I2=46%) (Supplementary Figure 3.5). No statistical or clinically significant differences were noted by subgroup
analysis of study, infant, or KMC characteristics (Supplementary Table 3.4).
Respiration/oxygenation
Compared to conventional care, KMC did not significantly reduce the risk of apnea in six studies of LBW infants
less than 2000 g (RR 0·39; 95% CI 0·13, 1·14; I2=42%) (Table 3.2). Newborns receiving KMC had a respiratory
rate three breaths per minute slower than controls (n=12; MD -3·17; 95% CI -5·15, -1·19; I2=75%) (Supplementary
Figure 3.6). KMC was also associated with 0.9% higher oxygen saturation (n=14; MD 0·90; 95% CI 0·35, 1·45;
I2=92%) (Supplementary Figure 3.7). In subgroup analyses, KMC was consistently associated with lower
respiratory rate and higher oxygen saturation (Supplementary Tables 3.5 and 3.6).
Temperature
KMC was associated with a 78% decrease in hypothermia risk (n=9; RR 0·22; 95% CI 0·12, 0·41; I2=71%) (Table
3.2). KMC also lowered the risk of hyperthermia by 23% (n=3; RR 0·77; 95% CI 0·59, 1·01; I2=0%). The mean
body temperature of infants receiving KMC was 0·24 degrees Celsius higher than in controls (n=14; 95% CI 0·15,
0·33; I2=82%) (Supplementary Figure 3.8), and this effect was similar across subgroups of study, infant, and KMC
characteristics (Supplementary Table 3.7).

68
Hypoglycemia and cortisol levels
KMC was strongly protective against hypoglycemia in the two studies reporting this outcome among LBW babies
(RR 0·12; 95% CI 0·05, 0·32) (Table 3.2). Standardized mean cortisol levels were not different between KMC and
conventional care groups (n=3; SMD -0·44; 95% CI -0·94, 0·06) (Table 3.3).
Hospital stay
KMC decreased the likelihood of hospital readmission by 58% in two studies (95% CI 0·23, 0·76) (Table 3.2).
Length of hospital stay in days did not differ between the KMC and control groups (n=12; MD -0·68; 95% CI -
2·11, 0·75; I2=95%) (Supplementary Figure 3.9). Among these, one study had early discharge as part of their KMC
intervention, and they did not report a significant difference in length of stay (MD -3·20; 95% CI -7·51, 1·11)
(Supplementary Table 3.8). One study reported mean length of hospital and neonatal intensive care unit stays
stratified by birth weight <1201 g, 1201-1500 g, 1501-1800 g, and 1800-2000 g, and found shorter hospital stays in
the KMC group compared to controls among babies less than 1500g, and in length of neonatal intensive care unit
stay among babies 1201-1500g.39
Growth
Various infant growth outcomes were examined across studies, including weight, length, and head circumference
measures. We looked at the effect of KMC on different measures of weight gain individually and by combining
them using the SMD (Table 3.3, Supplementary Figure 3.10). We did not find a significant association between
KMC and the SMD in weight gain or body length growth. In three studies of infants less than 2000 g at birth, those
receiving KMC had head circumference growth 0·19 cm per week higher than controls (95% CI 0·01, 0·37;
I2=89%). Among the 11 studies used to estimate the SMD in weight gain, there were no important differences in the
effect of KMC by subgroups of study, infant, or KMC characteristics (Supplementary Table 3.9). One additional
study examined the risk of being malnourished, overweight, and obese at five to six years old and found no
difference between the KMC and control groups.40

69
Pain
Several studies examined pain-related outcomes, including crying, heart rate, and pain scores during and after
painful procedures (Table 3.3). Seven studies used the Premature Infant Pain Profile scale, which has seven
domains and a total score range from 0-21.41
On average, infants given SSC during a painful procedure scored 0·83
points lower on this pain scale than controls (95% CI -1·53, -0·13; I2=88%). Studies using the Neonatal Infant Pain
Scale42
(n=3) and the Neonatal Facial Coding System43
(n=2) showed non-significant decreases in pain among
infants receiving SSC during painful procedures compared to controls. When pain scores were combined across
scales using the SMD, a decrease in pain score was again noted in babies receiving SSC compared to conventional
care (SMD -0·63; 95% CI -1·09, -0·16; I2=89%) (Supplementary Figure 3.11). This effect was similar across
subgroups (Supplementary Table 3.10).
After a painful stimulus, infants in SSC cried on average 11 seconds less than control group infants (n=3; MD -
11·30; 95% CI -19·79, -2·80; I2=0%) (Table 3.3). Three studies looked at infant heart rate during painful stimulus
as a proxy pain measure, and mean heart rate was 7 beats per minute slower in the SSC groups than controls (MD -
7·46; 95% CI -12·98, -1·93; I2=29%).
Other outcomes
A variety of other neonatal outcomes were reported in a single study or in different ways across studies that could
not be combined into a summary measure. Those outcomes related to illness included retinopathy, broncho-
pulmonary dysplasia, regurgitation, respiratory tract disease, diarrhea, and intraventricular hemorrhage.44-48
Other
outcomes included hyperbilirubinemia, blood pressure, stratum corneum hydration, oxygen requirement, carbon
dioxide production, LF/HF ratio, thyroid measures, water loss, home observation of the environment, stabilization
of cardio-pulmonary system, time in incubator, and cost of care, among others.28, 49-68
Several studies also examined
the effect of KMC on neuro-cognitive outcomes. These data were reported across different scales and endpoints at
different ages and thus could not be combined into summary measures. They included assessments of behavior,
mental and psychomotor development, reflexes, temperament, brain maturation, and sleep measures.34, 69-88

70
Estimates that were presented only as medians rather than means with standard deviation, only as odds ratios
without raw data, or where with zero cells were excluded from summary measures.62, 86, 89-102
Risk of bias
After evaluating each of the five domains of bias in the 55 RCTs, we classified 25 (45%) as having overall low risk
of bias, 14 (25%) as high, and 16 (29%) unclear (Supplementary Figure 3.12). The observational studies were
assessed using the same five bias domains as for RCTs plus a domain for confounding. Among these 69 studies,
overall risk of bias was considered low in 29 (42%), high in 24 (35%), and unclear in 16 (23%) (Supplementary
Figure 3.13). When restricted to studies with low overall risk of bias, the protective effects of KMC on mortality,
exclusive breastfeeding, and infection were stronger than results obtained using all studies (Supplementary Tables
1 – 3). Effect estimates for continuous outcomes did not materially change when restricted to studies with low
overall risk of bias (Supplementary Tables 3.4 – 3.10).
Publication bias
We assessed publication and small study bias for the mortality at latest follow-up time, exclusive breastfeeding at
hospital discharge, and infection outcomes. No significant evidence of publication bias was noted for the mortality
outcome by either Begg’s (p=0:89) or Egger’s (p=0:36) tests or by visual inspection of the funnel plot
(Supplementary Figure 3.14). Similarly, no evidence of publication bias was found for exclusive breastfeeding
(Begg’s p=0:25; Egger’s p=0:12) or infection (Begg’s p=0:45; Egger’s p=0:75).

71
Discussion
Kangaroo mother care is associated with decreased mortality among newborns who survive to receive KMC, when
compared to conventional care, particularly among low birth weight infants. KMC also increases the likelihood of
exclusive breastfeeding up to four months of age and decreases risk of sepsis, hypothermia, hypoglycemia, and
hospital readmission in newborns. Additionally, infants receiving KMC have improved vital signs, greater head
circumference growth, and lower pain responses when experiencing painful stimuli.
We found a similar magnitude in reduction of mortality risk among LBW babies exposed to KMC as that found in
prior reviews among LBW and preterm babies.7, 8
We did not find a significant difference in mortality for KMC
compared to controls in the two studies that included babies of all birth weights. We noted a similar protective
effect of KMC against sepsis and hypothermia as previously described.8 Some studies have found decreased length
of hospital stay among babies receiving KMC, while we did not find a significant difference.8 This could be due to
differences in study inclusion criteria and infant characteristics. Our results showing an increased likelihood of
exclusive breastfeeding among babies receiving KMC were similar to previous reviews.8, 9
Like Johnson et al., we
found decreased infant pain scores using the PIPP scale.10
We found an increase in head circumference growth, but
no difference in length or weight gain, with most measurements taken across the hospital stay period. Conde-
Agudelo et al. reported an increase in growth parameters for KMC-exposed babies compared to controls at latest
follow-up, but similarly to our results, no important differences in growth measured at discharge or 40-41 weeks
post-menstrual age.8
The positive effects on respiratory, oxygenation, glycemic, and temperature-related parameters support the
hypothesis that KMC can improve physiologic regulation in the neonate. Maintenance of these parameters could
also decrease susceptibility to infection. Lower pain parameters among infants receiving KMC indicates that it may
be beneficial for LBW and preterm infants who experience numerous blood draws and injections over the course of
their hospital stay.

72
How much of the effect of KMC is through SSC compared to other components of the intervention remains
unclear. In many settings, KMC also includes additional teaching and support for new parents from providers and
community health workers, which could provide additional benefits. Given the sparsity of details on KMC
characteristics, we were unable to fully analyze the individual KMC components’ effects. We were not able to
adequately examine the dose-response relationship between duration of SSC and neonatal outcomes because there
were few studies with KMC duration between four and 22 hours per day. The effects of KMC may be confounded
with breastfeeding as a component of KMC. We attempted to explore this by looking at subgroups of studies that
encouraged exclusive breastfeeding as a part of their KMC intervention compared to those which did not. We did
not see a consistent difference in effect in those comparisons, which may be related to a lack of data available on
breastfeeding.
To summarize all the evidence available to date on KMC and neonatal outcomes, our meta-analysis included both
randomized trials and observational studies, and did not limit the gestational age or birth weight of newborns
included. This allowed us to look at as many studies as possible for each outcome and perform sensitivity analyses.
We were able to assess the effect of KMC on normal weight and term babies albeit with limited data. We collected
information on study design, newborn characteristics, and KMC components to look for potential differences in the
effect of KMC in subgroups and meta-regression analyses. We also examined several outcomes that have not been
included in previous reviews. To obtain summary estimates, we defined our exposure as any form of KMC and our
comparison group as any type of conventional care that did not include KMC or SSC. There was heterogeneity in
the definition and components of KMC and conventional care across studies. We attempted to address this
limitation by looking at subgroup analyses by KMC components, duration, and initiation time.
Conclusion
Kangaroo mother care is protective against a variety of morbidities and mortality and improves physiologic
parameters in the neonate. This relatively low cost intervention has the potential to prevent many of the short and
long-term complications associated with preterm birth, and may also provide benefits to full-term newborns.

73
Further research is needed to help determine the ideal duration and components of KMC that provide the most
benefit. Additional studies among full term, normal birth weight babies, newborns delivered by Cesarean section,
and KMC provided by caregivers other than the mother are also needed to determine the effectiveness of KMC in
these populations. Understanding the barriers and facilitators to successful implementation of KMC would also help
provide guidance for clinicians and policy-makers focused on improving maternal and newborn health.

74
References
1. Lawn JE, Cousens S, Zupan J, Lancet Neonatal Survival Steering T. 4 million neonatal deaths: when?
Where? Why? Lancet. 2005; 365(9462): 891-900.
2. Bryce J, Black RE, Victora CG. Millennium Development Goals 4 and 5: progress and challenges. BMC
medicine. 2013; 11: 225.
3. World Health Organization. Preterm birth fact sheet No 363. 2014 [cited December 17, 2014]; Available
from: http://www.who.int/mediacentre/factsheets/fs363/en/
4. United Nations Children's Fund and World Health Organization. Low birthweight: country, regional and
global estimates. New York: UNICEF; 2004.
5. Charpak N, Ruiz JG, Zupan J, Cattaneo A, Figueroa Z, Tessier R, et al. Kangaroo Mother Care: 25 years
after. Acta Paediatr. 2005; 94(5): 514-22.
6. Kangaroo mother care: a practical guide. Geneva: World Health Organization; 2003.
7. Lawn JE, Mwansa-Kambafwile J, Horta BL, Barros FC, Cousens S. Kangaroo mother care' to prevent
neonatal deaths due to preterm birth complications. International journal of epidemiology. 2010; 39(SUPPL. 1):
i144-i54.
8. Conde-Agudelo A, Diaz-Rossello JL. Kangaroo mother care to reduce morbidity and mortality in low
birthweight infants. Cochrane Database Syst Rev. 2014; 4: CD002771.
9. Moore ER, Anderson GC, Bergman N, Dowswell T. Early skin-to-skin contact for mothers and their
healthy newborn infants. Cochrane Database Syst Rev. 2012; 5: CD003519.
10. Johnston CC-Y, M.; Fernandes, A.; Inglis, D.; Streiner, D.; Zee, R. Skin-to-skin care for procedural pain in
neonates. Cochrane Database Syst Rev. 2014; 1: CD008435.
11. Collaboration TC. Cochrane Handbook for Systematic Reviews of Interventions. March 2011 ed; 2011.
12. DerSimonian R, Laird N. Meta-analysis in clinical trials. Control Clin Trials. 1986; 7(3): 177-88.
13. Higgins JP, Thompson SG. Quantifying heterogeneity in a meta-analysis. Stat Med. 2002; 21(11): 1539-58.

75
14. Higgins JP, Thompson SG, Deeks JJ, Altman DG. Measuring inconsistency in meta-analyses. BMJ. 2003;
327(7414): 557-60.
15. World Bank. Data: Country and lending groups. 2014. Available from:
http://data.worldbank.org/about/country-and-lending-groups
16. UN Inter-agency Group for Childhood Mortality Estimation (UNICEF, WHO, World Bank, UN DESA
Population Division). Data: Mortality rate, neonatal (per 1000 live births). 2014. Available from:
http://data.worldbank.org/indicator/SH.DYN.NMRT
17. Miettinen O. Theoretical Epidemiology: Principles of Occurrence Research in Medicine. New York: John
Wiley & Sons; 1985.
18. Egger M, Davey Smith G, Schneider M, Minder C. Bias in meta-analysis detected by a simple, graphical
test. BMJ. 1997; 315(7109): 629-34.
19. Begg CB, Mazumdar M. Operating characteristics of a rank correlation test for publication bias.
Biometrics. 1994; 50(4): 1088-101.
20. Nimbalkar SM PV, Nimbalkar AS, Sethi A, Phatak A. Effect of early skin-to-skin contact following normal
delivery on incidence of hypothermia in neonates more than 1800g: a randomized control trial. 2014.
21. Gray L, Watt L, Blass EM. Skin-to-skin contact is analgesic in healthy newboms. Pediatrics. 2000; 105(1
II): 110-1.
22. Morelius E, Theodorsson E, Nelson N. Salivary cortisol and mood and pain profiles during skin-to-skin
care for an unselected group of mothers and infants in neonatal intensive care. Pediatrics. 2005; 116(5): 1105-13.
23. Bigelow A, Power M, MacLellan-Peters J, Alex M, McDonald C. Effect of Mother/Infant Skin-to-Skin
Contact on Postpartum Depressive Symptoms and Maternal Physiological Stress. Jognn-Journal of Obstetric
Gynecologic and Neonatal Nursing. 2012; 41(3): 369-82.
24. Ludington-Hoe SM, Hosseini R, Torowicz DL. Skin-to-skin contact (Kangaroo Care) analgesia for preterm
infant heel stick. AACN Clin Issues. 2005; 16(3): 373-87.
25. Ferber SG, Makhoul IR. Neurobehavioural assessment of skin-to-skin effects on reaction to pain in preterm
infants: a randomized, controlled within-subject trial. Acta Paediatr. 2008; 97(2): 171-6.

76
26. Campbell-Yeo MJ, C.; Benoit, B.; Latimer, M.; Vincer, M.; Walker, C. D.; Streiner, D.; Inglis, D.; Caddell,
K. Trial of repeated analgesia with Kangaroo Mother Care (TRAKC Trial). BMC Pediatr. 2013; 13: 182.
27. van Zanten HA, Havenaar AJ, Stigt HJH, Ligthart PAH, Walther FJ. The kangaroo method is safe for
premature infants under 30 weeks of gestation during ventilatory support. Journal of Neonatal Nursing. 2007;
13(5): 186-90.
28. Ludington-Hoe SM, Swinth JY. Kangaroo mother care during phototherapy: effect on bilirubin profile.
Neonatal network : NN. 2001; 20(5): 41-8.
29. Charpak N, Ruiz-Pelaez JG, Figueroa de CZ, Charpak Y. A randomized, controlled trial of kangaroo
mother care: results of follow-up at 1 year of corrected age. Pediatrics. 2001; 108(5): 1072-9.
30. Lincetto O, Nazir AI, Cattaneo A. Kangaroo mother care with limited resources. J Trop Pediatr. 2000;
46(5): 293-5.
31. Bier JAB, Ferguson AE, Morales Y, Liebling JA, Archer D, Oh W, et al. Comparison of skin-to-skin
contact with standard contact in low-birth-weight infants who are breast-fed. Archives of Pediatrics & Adolescent
Medicine. 1996; 150(12): 1265-9.
32. Furman L, Minich N, Hack M. Correlates of lactation in mothers of very low birth weight infants.
Pediatrics. 2002; 109(4): e57.
33. Thukral A, Sankar MJ, Agarwal R, Gupta N, Deorari AK, Paul VK. Early skin-to-skin contact and breast-
feeding behavior in term neonates: A randomized controlled trial. Neonatology. 2012; 102(2): 114-9.
34. Mohammed El-Nagger NS, Abed El-Azim H, Mahmoud Zaki Hassan S. Effect of kangaroo mother care on
premature infants' physiological, behavioral and psychosocial outcomes in Ain Shams maternity and Gynecological
Hospital, Cairo, Egypt. Life Science Journal. 2013; 10(1): 703-16.
35. Mahmood I, Jamal M, Khan N. Effect of mother-infant early skin-to-skin contact on breastfeeding status: a
randomized controlled trial. J Coll Physicians Surg Pak. 2011; 21(10): 601-5.
36. Marin Gabriel MA, Llana Martin I, Lopez Escobar A, Fernandez Villalba E, Romero Blanco I, Touza Pol
P. Randomized controlled trial of early skin-to-skin contact: effects on the mother and the newborn. Acta Paediatr.
2010; 99(11): 1630-4.

77
37. Heidarzadeh M, Hosseini MB, Ershadmanesh M, Tabari MG, Khazaee S. The Effect of Kangaroo Mother
Care (KMC) on Breast Feeding at the Time of NICU Discharge. Iranian Red Crescent Medical Journal. 2013; 15:
302-6.
38. Carfoot S, Williamson PR, Dickson R. The value of a pilot study in breast-feeding research. Midwifery.
2004; 20(2): 188-93.
39. Tessier R, Cristo M, Velez S, Giron M, de Calume ZF, Ruiz-Palaez JG, et al. Kangaroo mother care and
the bonding hypothesis. Pediatrics. 1998; 102(2): e17.
40. Acosta Díaz R, Brito Miliáns L, Miliáns Uriarte RD, Morera Betancourt O. Método piel a piel. Repercusión
sobre el desarrollo físico-intelectual a la edad preescolar
Kangaroo mother care method. Impact on the physical and intellectual development at preschool age. Rev Cubana
Pediatr. 2003; 75(3).
41. Stevens B, Johnston C, Petryshen P, Taddio A. Premature Infant Pain Profile: development and initial
validation. Clin J Pain. 1996; 12(1): 13-22.
42. Lawrence J, Alcock D, McGrath P, Kay J, MacMurray SB, Dulberg C. The development of a tool to assess
neonatal pain. Neonatal network : NN. 1993; 12(6): 59-66.
43. Grunau RV, Craig KD. Pain expression in neonates: facial action and cry. Pain. 1987; 28(3): 395-410.
44. Suman RP, Udani R, Nanavati R. Kangaroo mother care for low birth weight infants: a randomized
controlled trial. Indian Pediatr. 2008; 45(1): 17-23.
45. Lamy Filho F, Da Silva AAM, Lamy ZC, Gomes MASM, Moreira MEL, Lima GMS, et al. Evaluation of
the neonatal outcomes of the kangaroo mother method in Brazil. Jornal de Pediatria. 2008; 84(5): 428-35.
46. Cattaneo A, Davanzo R, Worku B, Surjono A, Echeverria M, Bedri A, et al. Kangaroo mother care for low
birthweight infants: a randomized controlled trial in different settings. Acta Paediatr. 1998; 87(9): 976-85.
47. Rojas MA, Kaplan M, Quevedo M, Sherwonit E, Foster L, Ehrenkranz RA, et al. Somatic growth of
preterm infants during skin-to-skin care versus traditional holding: a randomized, controlled trial. J Dev Behav
Pediatr. 2003; 24(3): 163-8.

78
48. Sloan NL CL, Rojas EP, Stern C. Kangaroo mother method: randomised controlled trial of an alternative
method of care for stabilised low-birthweight infants. Lancet. 1994; 8925.
49. Abouelfettoh A, Ludington-Hoe SM, Burant CJ, Visscher MO. Effect of skin-to-skin contact on preterm
infant skin barrier function and hospital-acquired infection. J Clin Med Res. 2011; 3(1): 36-46.
50. Lee J, Bang KS. The Effects of Kangaroo Care on Maternal Self-esteem and Premature Infants'
Physiological Stability. Korean Journal of Women Health Nursing. 2011; 17(5): 454-62.
51. Maastrup R, Greisen G. Extremely preterm infants tolerate skin-to-skin contact during the first weeks of
life. Acta Paediatrica. 2010; 99(8): 1145-9.
52. Tessier R, Charpak N, Giron M, Cristo M, de Calume ZF, Ruiz-Pelaez JG. Kangaroo Mother Care, home
environment and father involvement in the first year of life: a randomized controlled study. Acta Paediatr. 2009;
98(9): 1444-50.
53. Bauer J, Sontheimer D, Fischer C, Linderkamp O. Metabolic rate and energy balance in very low birth
weight infants during kangaroo holding by their mothers and fathers. J Pediatr. 1996; 129(4): 608-11.
54. Bergman NJ, Linley LL, Fawcus SR. Randomized controlled trial of skin-to-skin contact from birth versus
conventional incubator for physiological stabilization in 1200- to 2199-gram newborns. Acta Paediatrica. 2004;
93(6): 779-85.
55. Azevedo VM, Xavier CC, Gontijo Fde O. Safety of Kangaroo Mother Care in intubated neonates under
1500 g. J Trop Pediatr. 2012; 58(1): 38-42.
56. Carbasse AK, S.; Hausser, M.; Langlet, C.; Escande, B.; Donato, L.; Astruc, D.; Kuhn, P. Safety and
Effectiveness of Skin-to-Skin Contact in the NICU to Support Neurodevelopment in Vulnerable Preterm Infants.
Journal of Perinatal & Neonatal Nursing. 2013; 27: 255-62.
57. Entringer AP, Gomes M, Pinto M, Caetano R, Magluta C, Lamy ZC. Cost analysis of hospital care for
newborns at risk: comparison of an Intermediate Neonatal Care Unit and a Kangaroo Unit. Cadernos de saude
publica. 2013; 29(6): 1205-16.
58. Wahlberg V, Affonso DD, Persson B. A retrospective, comparative study using the kangaroo method as a
complement to the standard incubator care. European Journal of Public Health. 1992; 2(1): 34-7.

79
59. Christensson K. Randomised study of skin-to-skin versus incubator care for rewarming low-risk
hypothermic neonates. Lancet. 1998.
60. Cong X, Cusson RM, Walsh S, Hussain N, Ludington-Hoe SM, Zhang D. Effects of skin-to-skin contact on
autonomic pain responses in preterm infants. J Pain. 2012; 13(7): 636-45.
61. Dageville C, Pignol J, De Smet S. Very early neonatal apparent life-threatening events and sudden
unexpected deaths: Incidence and risk factors. Acta Paediatrica, International Journal of Paediatrics. 2008; 97(7):
866-9.
62. Karlsson V, Heinemann AB, Sjors G, Nykvist KH, Agren J. Early skin-to-skin care in extremely preterm
infants: thermal balance and care environment. J Pediatr. 2012; 161(3): 422-6.
63. Mitchell AJ YC, Williams K, Hall RW. Effects of daily kangaroo care on cardiorespiratory parameters in
preterm infants. Journal of Neonatal-Perinatal Medicine. 2013; 3.
64. Nimbalkar SM, Tandon R, Chaudhary NS. Reduced duration of cpap in preterm babies receiving kangaroo
care within an hour of birth - Randomized trial. Archives of Disease in Childhood. 2012; 97: A512.
65. Samra NM, El Taweel A, Cadwell K. The effect of kangaroo mother care on the duration of phototherapy
of infants re-admitted for neonatal jaundice. J Matern Fetal Neonatal Med. 2012; 25(8): 1354-7.
66. Vesel L, Ten Asbroek AH, Manu A, Soremekun S, Tawiah Agyemang C, Okyere E, et al. Promoting skin-
to-skin care for low birthweight babies: findings from the Ghana Newhints cluster-randomised trial. Tropical
medicine & international health : TM & IH. 2013; 18(8): 952-61.
67. Weller A, Rozin A, Goldstein A, Charpak N, Ruiz-Pelaez JG, Figueroa de Calume Z, et al. Longitudinal
assessment of pituitary-thyroid axis and adrenal function in preterm infants raised by 'kangaroo mother care'. Horm
Res. 2002; 57(1-2): 22-6.
68. Anderson GC, Chiu SH, Dombrowski MA, Swinth JY, Albert JM, Wada N. Mother-newborn contact in a
randomized trial of kangaroo (skin-to-skin) care. J Obstet Gynecol Neonatal Nurs. 2003; 32(5): 604-11.
69. Ohgi S, Fukuda M, Moriuchi H, Kusumoto T, Akiyama T, Nugent JK, et al. Comparison of kangaroo care
and standard care: behavioral organization, development, and temperament in healthy, low-birth-weight infants
through 1 year. Journal of perinatology : official journal of the California Perinatal Association. 2002; 22(5): 374-9.

80
70. Kaffashi F, Scher MS, Ludington-Hoe SM, Loparo KA. An analysis of the kangaroo care intervention
using neonatal EEG complexity: a preliminary study. Clin Neurophysiol. 2013; 124(2): 238-46.
71. Messmer PR, Rodriguez S, Adams J, Wells-Gentry J, Washburn K, Zabaleta I, et al. Effect of kangaroo
care on sleep time for neonates. Pediatr Nurs. 1997; 23(4): 408-14.
72. Keshavarz M, Haghighi NB. Effects of kangaroo contact on some physiological parameters in term
neonates and pain score in mothers with cesarean section. Koomesh. 2010; 11(2): 91-9.
73. Constantinou JC, Adamson-Macedo EN, Stevenson DK, Mirmiran M, Fleisher BE. Effects of skin-to-skin
holding on general movements of preterm infants. Clinical Pediatrics. 1999; 38(8): 467-71.
74. Saeidi R, Tafazoli M, Robatsangi MG. Kangaroo mother care for infantile colic: A randomized clinical
trial. Tehran University Medical Journal. 2010; 67(12): 870-5.
75. Tessier R, Cristo MB, Velez S, Giron M, Nadeau L, Figueroa de Calume Z, et al. Kangaroo Mother Care:
A method for protecting high-risk low-birth-weight and premature infants against developmental delay. Infant
Behavior and Development. 2003; 26(3): 384-97.
76. Neu M, Robinson J. Maternal Holding of Preterm Infants During the Early Weeks After Birth and Dyad
Interaction at Six Months. Jognn-Journal of Obstetric Gynecologic and Neonatal Nursing. 2010; 39(4): 401-14.
77. Scher MS, Ludington-Hoe S, Kaffashi F, Johnson MW, Holditch-Davis D, Loparo KA. Neurophysiologic
assessment of brain maturation after an 8-week trial of skin-to-skin contact on preterm infants. Clinical
Neurophysiology. 2009; 120(10): 1812-8.
78. Morgan BE, Horn AR, Bergman NJ. Should Neonates Sleep Alone? Biological Psychiatry. 2011; 70(9):
817-25.
79. Neu MR, J.; Schmiege, S. J. Influence of holding practice on preterm infant development. MCN The
American Journal of Maternal/Child Nursing. 2013; 38: 136-43.
80. Bera AG, J.; Singh, A. K.; Hazra, A.; Mukherjee, S.; Mukherjee, R. Effect of kangaroo mother care on
growth and development of low birthweight babies up to 12 months of age: A controlled clinical trial. Acta
Paediatrica, International Journal of Paediatrics. 2014.

81
81. Whitelaw A HG, Sleath K, Acolet D, Richards M. Skin to skin contact for very low birthweight infants and
their mothers. Archives of Disease in Childhood. 1988; 11.
82. Feldman R, Eidelman AI. Skin-to-skin contact (Kangaroo Care) accelerates autonomic and
neurobehavioural maturation in preterm infants. Dev Med Child Neurol. 2003; 45(4): 274-81.
83. Miles R CF, Glover V, Stevenson J, Modi N. A controlled trial of skin-to-skin contact in extremely preterm
infants. Early Human Development. 2006; 7.
84. Kashaninia Z, Sajedi F, Rahgozar M, Noghabi FA. The effect of Kangaroo Care on behavioral responses to
pain of an intramuscular injection in neonates. J Spec Pediatr Nurs. 2008; 13(4): 275-80.
85. Acosta Díaz R, Piña Borrego CE, Acosta González LR, López Fernández L. Método piel a piel. Evaluación
del neurocomportamiento hasta el año de edad corregida
Kangaroo mother care method. Evaluation of the neurodevelopment at first year of corrected age. Rev Cubana
Pediatr. 2003; 75(3).
86. Azevedo VMGO, David RB, Xavier CC. Kangaroo mother care in preterm newborns on artificial
ventilation: An evaluation of behavior patterns. Cuidado mãe canguru em recém-nascidospré-termo sob suporte
ventilatório: Avaliação dos estados comportamentais. 2011; 11(2): 133-8.
87. Andrade ISNd, Guedes ZCF. Sucção do recém-nascido prematuro: comparação do método mãe-canguru
com os cuidados tradicionais
Suckling of the premature newborn child: comparison between the kangaroo mother method with traditional care.
Rev bras sa£de matern infant. 2005; 5(1): 61-9.
88. Schneider C, Charpak N, Ruiz-Pelaez JG, Tessier R. Cerebral motor function in very premature-at-birth
adolescents: a brain stimulation exploration of kangaroo mother care effects. Acta Paediatr. 2012; 101(10): 1045-
53.
89. Kambarami RA, Chidede O, Kowo DT. Kangaroo care versus incubator care in the management of well
preterm infants - A pilot study. Annals of Tropical Paediatrics. 1998; 18(2): 81-6.
90. Almeida CM, Almeida AFN, Forti EMP. Effects of kangaroo mother care on the vital signs of low-weight
preterm newborns. Revista Brasileira De Fisioterapia. 2007; 11(1): 1-5.

82
91. Almeida H, Venancio SI, Sanches MT, Onuki D. The impact of kangaroo care on exclusive breastfeeding
in low birth weight newborns. J Pediatr (Rio J). 2010; 86(3): 250-3.
92. Bohnhorst B, Heyne T, Peter CS, Poets CF. Skin-to-skin (kangaroo) care, respiratory control, and
thermoregulation. J Pediatr. 2001; 138(2): 193-7.
93. Lyngstad LT, Tadberg BS, Storm H, Ekeberg BL, Moen A. Does skin-to-skin contact reduce stress during
diaper change in preterm infants? Early Human Development. 2014; 90: 169-72.
94. Priya JJ. Kangaroo care for low birth weight babies. Nurs J India. 2004; 95(9): 209-12.
95. Saeidi R, Asnaashari Z, Amirnejad M, Esmaeili H, Robatsangi MG. Use of "kangaroo care" to alleviate the
intensity of vaccination pain in newborns. Iran J Pediatr. 2011; 21(1): 99-102.
96. Singh A, Yadav A, Singh A. Utilization of postnatal care for newborns and its association with neonatal
mortality in India: an analytical appraisal. BMC Pregnancy Childbirth. 2012; 12: 33.
97. Toma TS, Venâncio SI, Andretto DDA. Maternal perception of low birth weight babies before and
following the implementation of the Kangaroo Mother Care in a public hospital, in the city of São Paulo, Brazil.
Percepção das mães sobre o cuidado do bebê de baixo peso antes e após implantação do Método Mãe-Canguru em
hospital público da cidade de São Paulo, Brasil. 2007; 7(3): 297-307.
98. Broughton EI, Gomez I, Sanchez N, Vindell C. The cost-savings of implementing kangaroo mother care in
Nicaragua. Rev Panam Salud Publica. 2013; 34: 176-82.
99. Ghavane S, Murki S, Subramanian S, Gaddam P, Kandraju H, Thumalla S. Kangaroo Mother Care in
Kangaroo ward for improving the growth and breastfeeding outcomes when reaching term gestational age in very
low birth weight infants. Acta Paediatr. 2012; 101(12): e545-9.
100. Acharya N, Singh RR, Bhatta NK, Poudel P. Randomized control trial of Kangaroo Mother Care in low
birth weight babies at a tertiary level hospital. Journal of Nepal Paediatric Society. 2014; 34: 18-23.
101. Boo NY, Jamli FM. Short duration of skin-to-skin contact: Effects on growth and breastfeeding. Journal of
Paediatrics and Child Health. 2007; 43(12): 831-6.

83
102. Eka Pratiwi IGAP, Soetjiningsih, I Made Kardana. Effect of kangaroo method on the risk of hypothermia
and duration of birth weight regain in low brith weight infants: A randomized control trial. Paeditrica Indonesia.
2009: 253-8.
103. Ahmed S, Mitra SN, Chowdhury AM, Camacho LL, Winikoff B, Sloan NL. Community Kangaroo Mother
Care: implementation and potential for neonatal survival and health in very low-income settings. Journal of
perinatology : official journal of the California Perinatal Association. 2011; 31(5): 361-7.
104. Blay S. Ghana KMC Study Results. 2009 [cited; Available from:
105. Kadam S, Binoy S, Kanbur W, Mondkar JA, Fernandez A. Feasibility of kangaroo mother care in Mumbai.
Indian J Pediatr. 2005; 72(1): 35-8.
106. McMaster P, Haina T, Vince JD. Kangaroo care in Port Moresby, Papua New Guinea. Trop Doct. 2000;
30(3): 136-8.
107. Pattinson RC, Bergh AM, Malan AF, Prinsloo R. Does kangaroo mother care save lives? J Trop Pediatr.
2006; 52(6): 438-41.
108. Sloan NL, Ahmed S, Mitra SN, Choudhury N, Chowdhury M, Rob U, et al. Community-based kangaroo
mother care to prevent neonatal and infant mortality: a randomized, controlled cluster trial. Pediatrics. 2008;
121(5): e1047-59.
109. Charpak N R-PJ, Charpak Y. Rey-Martinez. Kangaroo Mother Program: an alternative way of caring for
low birth weight infants? One year mortality in a two cohort study. Pediatrics. 1994; 6.
110. Worku B, Kassie A. Kangaroo mother care: a randomized controlled trial on effectiveness of early
kangaroo mother care for the low birthweight infants in Addis Ababa, Ethiopia. J Trop Pediatr. 2005; 51(2): 93-7.
111. Ali SM SJ, Sharma R, Alam S. Kangaroo mother care as compared to conventional care for low birth
weight babies. Dicle Medical Journal. 2009.
112. Bramson L LJ, Moore E, Montgomery S, Neish C, Bahjri K, Melcher CL. Effect of early skin-to-skin
mother--infant contact during the first 3 hours following birth on exclusive breastfeeding during the maternity
hospital stay. J Hum Lact 2010 May;26(2):130-7 doi: 101177/0890334409355779 Epub 2010 Jan 28. 2010.

84
113. Charpak N, Ruiz-Pelaez JG, Figueroa De C Z, Charpak Y. Kangaroo mother versus traditional care for
newborn infants (less-than or equal to)2000 grams: A randomized, controlled trial. Pediatrics. 1997; 100(4): 682-8.
114. Gregson S, Blacker J. Kangaroo care in pre-term or low birth weight babies in a postnatal ward. British
Journal of Midwifery. 2011; 19(9): 568-77.
115. Hake-Brooks SJ, Anderson GC. Kangaroo care and breastfeeding of mother-preterm infant dyads 0-18
months: a randomized, controlled trial. Neonatal network : NN. 2008; 27(3): 151-9.
116. Niela-Vilen HA, A.; Salantera, S.; Lehtonen, L.; Tammela, O.; Salmelin, R.; Latva, R. Early physical
contact between a mother and her NICU-infant in two university hospitals in Finland. Midwifery. 2013; 29: 1321-
30.
117. Acosta Díaz R, Vara Cuesta OL, Fuentes Guerra JM, Iglesias Castro D, Piloña Ruiz S. Método piel a piel.
Evaluación clínica-humoral durante el primer año de edad corregida
Kangaroo mother care method. Clinical and humoral assessment during the first year of corrected age. Rev Cubana
Pediatr. 2003; 75(3).
118. Ramanathan K, Paul VK, Deorari AK, Taneja U, George G. Kangaroo Mother Care in very low birth
weight infants. Indian J Pediatr. 2001; 68(11): 1019-23.
119. Suzuki S. Effect of early skin-to-skin contact on breast-feeding. Journal of Obstetrics and Gynaecology.
2013; 33: 695-6.
120. Park HK, Choi BS, Lee SJ, Son IA, Seol IJ, Lee HJ. Practical application of kangaroo mother care in
preterm infants: clinical characteristics and safety of kangaroo mother care. Journal of Perinatal Medicine. 2014;
42: 239-45.
121. Sakaki H, Nishioka M, Kanda K, Takahashi Y. An investigation of the risk factors for infection with
methicillin-resistant Staphylococcus aureus among patients in a neonatal intensive care unit. Am J Infect Control.
2009; 37(7): 580-6.
122. Ibe OE, Austin T, Sullivan K, Fabanwo O, Disu E, Costello AM. A comparison of kangaroo mother care
and conventional incubator care for thermal regulation of infants < 2000 g in Nigeria using continuous ambulatory
temperature monitoring. Ann Trop Paediatr. 2004; 24(3): 245-51.

85
123. Begum EA, Bonno M, Ohtani N, Yamashita S, Tanaka S, Yamamoto H, et al. Cerebral oxygenation
responses during kangaroo care in low birth weight infants. BMC Pediatr. 2008; 8: 51.
124. Bergstrom A, Okong P, Ransjo-Arvidson AB. Immediate maternal thermal response to skin-to-skin care of
newborn. Acta Paediatr. 2007; 96(5): 655-8.
125. Boju SL, Gopi Krishna M, Uppala R, Chodavarapu P, Chodavarapu R. Short spell kangaroo mother care
and its differential physiological influence in subgroups of preterm babies. J Trop Pediatr. 2012; 58(3): 189-93.
126. Collados-Gomez L, Aragones-Corral B, Contreras-Olivares I, Garcia-Feced E, Vila-Piqueras ME.
[Assessing the impact of kangaroo care on preterm infant stress]. Enferm Clin. 2011; 21(2): 69-74.
127. Legault M GC. Comparison of kangaroo and traditional methods of removing preterm infants from
incubators. Journal of Obstetric, Gynecologic and Neonatal Nursing. 1995.
128. Ludington-Hoe SM, Anderson GC, Swinth JY, Thompson C, Hadeed AJ. Randomized controlled trial of
kangaroo care: cardiorespiratory and thermal effects on healthy preterm infants. Neonatal network : NN. 2004;
23(3): 39-48.
129. Miltersteiner AR, Miltersteiner DR, Rech VV, Molle LD. Respostas fisiológicas da Posição Mãe-Canguru
em bebês pré-termos, de baixo peso e ventilando espontaneamente
Physiological responses of the Kangaroo Mother Position in low birth weight, spontaneous ventilating premature
babies. Rev bras sa£de matern infant. 2003; 3(4): 447-55.
130. Tenório EAM, Mota GC, Gutierres SB, Ferreira ERdS, Medeiros AdA, Tavares CAE, et al. Avaliação dos
parâmetros fisiológicos em recém-nascidos pré-termos de baixo peso antes e após a aplicação do método mãe-
canguru. Evaluation of physiological parameters in preterm newborns with low weight before and after application
of the kangaroo mother care. Fisioter Bras. 2010; 11(1): 44-8.
131. Sajedi F, Kashaninia Z, Rahgozar M, Noghabi FA. The effect of Kangaroo Care on physiologic responses
to pain of an intramuscular injection in neonates. Iranian Journal of Pediatrics. 2007; 17(4): 339-44.
132. Heimann K, Jergus K, Abbas AK, Heussen N, Leonhardt S, Orlikowsky T. Infrared thermography for
detailed registration of thermoregulation in premature infants. J Perinat Med. 2013: 1-8.

86
133. Ludington-Hoe SM, Nguyen N, Swinth JY, Satyshur RD. Kangaroo care compared to incubators in
maintaining body warmth in preterm infants. Biol Res Nurs. 2000; 2(1): 60-73.
134. Aghdas K, Talat K, Sepideh B. Effect of immediate and continuous mother-infant skin-to-skin contact on
breastfeeding self-efficacy of primiparous women: A randomised control trial. Women and Birth. 2014; 27: 37-40.
135. Ahn HY, Lee J, Shin HJ. Kangaroo care on premature infant growth and maternal attachment and post-
partum depression in South Korea. J Trop Pediatr. 2010; 56(5): 342-4.
136. Rodrigues MAG, Cano MAT. Estudo do ganho de peso e duração da internação do recém-nascido pré-
termo de baixo peso com a utilização do método canguru. Trial gain of weight and hospital length stay of the low
birth weight preterm infant in assistance for kangaroo mother care. Rev eletr“nica enferm. 2009; 8(2): 185-91.
137. Roberts KL, Paynter C, McEwan B. A comparison of kangaroo mother care and conventional cuddling
care. Neonatal network : NN. 2000; 19(4): 31-5.
138. Castral TC, Warnock F, Leite AM, Haas VJ, Scochi CGS. The effects of skin-to-skin contact during acute
pain in preterm newborns. European Journal of Pain. 2008; 12(4): 464-71.
139. Chermont AG, Falcao LFM, Silva E, Balda RDX, Guinsburg R. Skin-to-Skin Contact and/or Oral 25%
Dextrose for Procedural Pain Relief for Term Newborn Infants. Pediatrics. 2009; 124(6): E1101-E7.
140. Chidambaram AG, Manjula S, Adhisivam B, Vishnu Bhat B. Effect of Kangaroo mother care in reducing
pain due to heel prick among preterm neonates: a crossover trial. J Matern Fetal Neonatal Med. 2013.
141. Freire NB, Garcia JB, Lamy ZC. Evaluation of analgesic effect of skin-to-skin contact compared to oral
glucose in preterm neonates. Pain. 2008; 139(1): 28-33.
142. Johnston CC, Filion F, Campbell-Yeo M, Goulet C, Bell L, McNaughton K, et al. Kangaroo mother care
diminishes pain from heel lance in very preterm neonates: a crossover trial. BMC Pediatr. 2008; 8: 13.
143. Marin Gabriel MA, Lopez Escobar A, Galan Redondo M, Fernandez Moreno I, del Cerro Garcia R, Llana
Martin I, et al. [Evaluation of pain in a neonatal intensive care unit during endocrine-metabolic tests]. An Pediatr
(Barc). 2008; 69(4): 316-21.
144. Mitchell AJ, Yates CC, Williams DK, Chang JY, Hall RW. Does daily kangaroo care provide sustained
pain and stress relief in preterm infants? Journal of Neonatal-Perinatal Medicine. 2013; 6(1): 45-52.

87
145. Nanavati RN, Balan R, Kabra NS. Effect of Kangaroo Mother Care Expressed Breast Milk Administration
on Pain Associated with Removal of Adhesive Tapes in Very Low Birth Weight Neonates: A Randomized
Controlled Trial. Indian Pediatr. 2013.
146. Nimbalkar SM, Chaudhary NS, Gadhavi KV, Phatak A. Kangaroo Mother Care in reducing pain in preterm
neonates on heel prick. Indian J Pediatr. 2013; 80(1): 6-10.
147. Kostandy RR, Ludington-Hoe SM, Cong X, Abouelfettoh A, Bronson C, Stankus A, et al. Kangaroo Care
(skin contact) reduces crying response to pain in preterm neonates: pilot results. Pain Manag Nurs. 2008; 9(2): 55-
65.
148. Saeedi R, Asnaashri Z, Amirinejad M, Esmaili H. effect of kangaroo care method on the pain intensity of
vaccination in newborns. Journal of Sabzevar School of Medical Sciences. 2011; 13(4): 172-7.
149. Cong X, Ludington-Hoe SM, McCain G, Fu P. Kangaroo Care modifies preterm infant heart rate variability
in response to heel stick pain: pilot study. Early Hum Dev. 2009; 85(9): 561-7.
150. Gathwala G, Singh B, Balhara B. KMC facilitates mother baby attachment in low birth weight infants.
Indian J Pediatr. 2008; 75(1): 43-7.
151. Tuoni C, Scaramuzzo RT, Ghirri P, Boldrini A, Bartalena L. Kangaroo Mother Care: four years of
experience in very low birth weight and preterm infants. Minerva Pediatr. 2012; 64(4): 377-83.

88
Supplementary Materials
Supplementary Figure 3.1. Forest plot for effect of KMC compared to conventional care on mortality at
latest follow-up time, stratified by skin-to-skin contact initiation criteria
.
.
.
Overall (I-squared = 67.4%, p = 0.000)
Suman
Sloan
Pattinson
Lincetto
Worku
0=immediately, regardless of stability
Kadam
-99=missing
McMaster
Cattaneo
Charpak
Charpak
Ahmed
Author
Subtotal (I-squared = 30.1%, p = 0.178)
Subtotal (I-squared = 0.0%, p = 0.384)
Subtotal (I-squared = 84.9%, p = 0.000)
Rojas
Whitelaw
Sloan
Blay
Lamy Filho
1=after stability criteria were met
2008
2008
2006
2000
2005
2005
2000
1998
1994
2001
2011
year
2003
1988
1994
2009
2008
0.77 (0.60, 0.99)
0.20 (0.02, 1.68)
1.06 (0.80, 1.41)
0.81 (0.72, 0.91)
0.34 (0.16, 0.72)
0.59 (0.34, 1.03)
1.02 (0.07, 15.80)
0.17 (0.07, 0.44)
0.91 (0.19, 4.43)
0.54 (0.22, 1.32)
0.57 (0.22, 1.50)
1.00 (0.63, 1.60)
RR (95% CI)
0.57 (0.34, 0.97)
0.51 (0.33, 0.78)
1.04 (0.77, 1.39)
1.64 (0.16, 17.13)
1.03 (0.15, 6.91)
0.97 (0.45, 2.09)
1.36 (1.11, 1.66)
1.99 (0.20, 19.75)
100.00
1.31
13.50
15.66
6.72
9.09
%
0.82
4.95
2.22
5.37
4.83
10.46
Weight
27.63
18.03
54.33
1.09
1.60
6.53
14.71
1.14
KMC decreases mortality risk KMC increases mortality risk
1.1 1 10

89
Supplementary Figure 3.2. Forest plot for effect of KMC compared to conventional care on mortality at
latest follow-up time, stratified by skin-to-skin contact duration promoted, hours per day
.
.
.
Overall (I-squared = 67.4%, p = 0.000)
Charpak
Pattinson
Lincetto
22+hrs
Cattaneo
Subtotal (I-squared = 59.5%, p = 0.006)
Kadam
Ahmed
Author
Whitelaw
Sloan
Worku
Blay
Subtotal (I-squared = 84.3%, p = 0.000)
4-<9hrs
Lamy Filho
McMaster
Rojas
Charpak
Missing
Suman
Subtotal (I-squared = .%, p = .)
Sloan
2001
2006
2000
1998
2005
2011
year
1988
2008
2005
2009
2008
2000
2003
1994
2008
1994
0.77 (0.60, 0.99)
0.57 (0.22, 1.50)
0.81 (0.72, 0.91)
0.34 (0.16, 0.72)
0.91 (0.19, 4.43)
0.64 (0.44, 0.92)
1.02 (0.07, 15.80)
1.00 (0.63, 1.60)
RR (95% CI)
1.03 (0.15, 6.91)
1.06 (0.80, 1.41)
0.59 (0.34, 1.03)
1.36 (1.11, 1.66)
1.04 (0.66, 1.64)
1.99 (0.20, 19.75)
0.17 (0.07, 0.44)
1.64 (0.16, 17.13)
0.54 (0.22, 1.32)
0.20 (0.02, 1.68)
1.64 (0.16, 17.13)
0.97 (0.45, 2.09)
100.00
4.83
15.66
6.72
2.22
66.12
0.82
10.46
%
Weight
1.60
13.50
9.09
14.71
32.79
1.14
4.95
1.09
5.37
1.31
1.09
6.53
KMC decreases mortality risk KMC increases mortality risk
1.1 1 10

90
Supplementary Figure 3.3. Forest plot for effect of KMC compared to conventional care on likelihood of
exclusive breastfeeding at hospital discharge or 40-41 weeks post-menstrual age
Overall (I-squared = 93.2%, p = 0.000)
Marin Gabriel
Ali
Author
Thukral
Cattaneo
Hake-Brooks
Ahmed
Boo
Bramson
Niela-Vilen
Charpak
Gregson
Wahlberg
Heidarzadeh
2010
2009
year
2012
1998
2008
2011
2007
2010
2013
1997
2011
1992
2013
1.50 (1.26, 1.78)
1.21 (1.05, 1.39)
1.16 (0.99, 1.36)
RR (95% CI)
2.50 (1.43, 4.38)
1.25 (1.10, 1.42)
1.08 (0.73, 1.60)
1.88 (1.74, 2.03)
2.05 (1.01, 4.18)
2.05 (1.95, 2.16)
3.08 (1.12, 8.47)
1.02 (0.86, 1.20)
1.31 (1.06, 1.61)
1.80 (1.20, 2.70)
1.73 (1.29, 2.32)
100.00
9.67
9.51
Weight
4.95
9.78
6.76
%
10.13
3.76
10.23
2.28
9.43
8.99
6.57
7.94
KMC reduces early EBF KMC increases early EBF
1.1 1 10

91
Supplementary Figure 3.4. Forest plot for effect of KMC compared to conventional care on infection,
stratified by infection type
.
.
Overall (I-squared = 59.6%, p = 0.004)
Kadam
Rojas
Suman
Sakaki
Ghavane
MRSA or other severe infection
Boo
McMaster
Subtotal (I-squared = 77.0%, p = 0.005)
Sloan
Eka Pratiwi
Author
Charpak
Subtotal (I-squared = 24.7%, p = 0.232)
Ali
Sepsis
Park
2005
2003
2008
2009
2012
2007
2000
1994
2009
year
1997
2009
2014
0.67 (0.43, 1.05)
0.77 (0.29, 2.04)
0.51 (0.19, 1.38)
0.27 (0.09, 0.79)
3.82 (1.11, 13.14)
0.97 (0.14, 6.70)
1.94 (0.18, 20.86)
1.16 (0.48, 2.81)
1.00 (0.40, 2.46)
0.30 (0.14, 0.67)
0.31 (0.13, 0.72)
RR (95% CI)
1.00 (0.69, 1.46)
0.53 (0.34, 0.83)
0.30 (0.10, 0.86)
1.27 (0.30, 5.46)
100.00
9.11
%
8.94
8.37
7.20
4.00
2.89
9.85
38.17
10.62
10.23
Weight
14.43
61.83
8.44
5.91
KMC decreases risk of infection KMC increases risk of infection
1.1 1 10

92
Supplementary Figure 3.5. Forest plot for effect of KMC compared to conventional care on mean heart rate,
beats per minute
Overall (I-squared = 45.7%, p = 0.027)
Bauer (1996)
Messmer (1997)
Ali (2009)
Morelius (2005)
Collados-Gomez (2011)
Tenório (2010)
ID
Boju (2012)
Lee (2011)
Feldman (2003)
Legault (1995)
Miltersteiner (2003)
Bergstrom (2007)
Ludington-Hoe (2004)
Begum (2008)
Maastrup (2010)
Study
-0.41 (-2.25, 1.42)
3.00 (-1.62, 7.62)
0.20 (-6.81, 7.21)
0.20 (-1.54, 1.94)
-7.00 (-14.74, 0.74)
-6.67 (-11.62, -1.72)
-3.78 (-10.19, 2.63)
WMD (95% CI)
-2.80 (-5.32, -0.28)
-1.64 (-8.28, 5.00)
3.77 (-11.80, 19.34)
-1.20 (-6.06, 3.66)
8.39 (1.73, 15.05)
1.53 (-7.57, 10.63)
4.95 (-2.50, 12.40)
1.00 (-4.26, 6.26)
1.00 (-6.44, 8.44)
100.00
8.45
4.98
15.59
4.29
7.82
5.64
Weight
13.52
5.38
1.29
7.98
5.36
3.32
4.55
7.28
4.56
%
KMC decreases heart rate, bpm KMC increases heart rate, bpm
0-10 0 10

93
Supplementary Figure 3.6. Forest plot for effect of KMC compared to conventional care on mean
respiratory rate, breaths per minute
Overall (I-squared = 75.1%, p = 0.000)
Study
Ali (2009)
Ludington-Hoe (2004)
Maastrup (2010)
Legault (1995)
Kadam (2005)
Lee (2011)
Boju (2012)
Tenório (2010)
Begum (2008)
Collados-Gomez (2011)
ID
Miltersteiner (2003)
Messmer (1997)
-3.17 (-5.15, -1.19)
-8.40 (-10.01, -6.79)
-2.71 (-9.62, 4.20)
1.00 (-3.44, 5.44)
-2.30 (-7.05, 2.45)
-4.50 (-5.79, -3.21)
-7.82 (-12.03, -3.61)
-2.99 (-5.87, -0.11)
-3.76 (-7.81, 0.29)
0.30 (-5.53, 6.13)
-1.14 (-4.71, 2.43)
WMD (95% CI)
0.96 (-3.92, 5.84)
-0.69 (-9.16, 7.78)
100.00
%
12.34
5.10
8.02
7.58
12.71
8.37
10.46
8.60
6.21
9.35
Weight
7.40
3.89
KMC decreases resp rate, breaths/min KMC increases resp rate, breaths/min
0-10 0 10

94
Supplementary Figure 3.7. Forest plot for effect of KMC compared to conventional care on mean oxygen
saturation, percent
Overall (I-squared = 92.1%, p = 0.000)
Maastrup (2010)
Bauer (1996)
Kadam (2005)
Sajedi (2007)
Study
Tenório (2010)
Ludington-Hoe (2004)
Collados-Gomez (2011)
ID
Begum (2008)
Legault (1995)
Boju (2012)
Ali (2009)
Lee (2011)
Messmer (1997)
Miltersteiner (2003)
0.90 (0.35, 1.45)
0.00 (-1.77, 1.77)
1.00 (0.16, 1.84)
0.90 (0.52, 1.28)
2.80 (1.91, 3.69)
2.38 (1.04, 3.72)
-1.88 (-3.73, -0.03)
0.01 (0.00, 0.02)
WMD (95% CI)
-0.50 (-1.55, 0.55)
-0.10 (-1.10, 0.90)
1.09 (0.66, 1.52)
1.50 (0.93, 2.07)
3.00 (1.90, 4.10)
0.00 (-1.88, 1.88)
1.04 (0.19, 1.89)
100.00
4.78
7.76
9.03
7.56
%
6.05
4.57
9.44
Weight
7.04
7.19
8.93
8.58
6.85
4.51
7.72
KMC decreases O2 saturation, % KMC increases O2 saturation, %
0-5 0 5

95
Supplementary Figure 3.8. Forest plot for effect of KMC compared to conventional care on mean
temperature, degrees Celsius
Overall (I-squared = 81.5%, p = 0.000)
Keshavarz (2010)
Maastrup (2010)
Bergstrom (2007)
Ludington-Hoe (2000)
Legault (1995)
Bauer (1996)
Heimann (2013)
Begum (2008)
Ibe (2004)
Study
ID
Lee (2011)
Ali (2009)
Boju (2012)
Miltersteiner (2003)
Ludington-Hoe (2004)
0.24 (0.15, 0.33)
0.20 (0.06, 0.34)
0.00 (-0.18, 0.18)
0.20 (0.09, 0.31)
-0.07 (-0.32, 0.18)
0.10 (-0.03, 0.23)
0.70 (-0.19, 1.59)
-0.58 (-1.30, 0.14)
0.30 (0.12, 0.48)
0.50 (0.39, 0.61)
WMD (95% CI)
0.26 (0.17, 0.35)
0.40 (0.34, 0.46)
0.43 (0.25, 0.62)
0.16 (-0.03, 0.35)
0.34 (0.08, 0.60)
100.00
8.55
7.57
9.32
5.94
8.90
1.00
1.44
7.68
9.33
%
Weight
9.59
10.20
7.47
7.24
5.77
KMC decreases temperature,degC KMC increases temperature,degC
0-2 0 2

96
Supplementary Figure 3.9. Forest plot for effect of KMC compared to conventional care on mean length of
hospital stay, days
Overall (I-squared = 94.8%, p = 0.000)
Broughton (2013)
Acharya (2014)
Suman (2008)
ID
McMaster (2000)
Wahlberg (1992)
Rodrigues (2009)
Roberts (2000)
Gregson (2011)
Kadam (2005)
Gathwala (2008)
Lamy Filho (2008)
Tuoni (2012)
Study
-0.68 (-2.11, 0.75)
-3.20 (-7.51, 1.11)
2.99 (0.62, 5.36)
-0.08 (-1.73, 1.57)
WMD (95% CI)
7.00 (2.24, 11.76)
-7.80 (-16.45, 0.85)
1.10 (-2.71, 4.91)
2.00 (-14.95, 18.95)
-0.68 (-0.79, -0.57)
-0.80 (-2.65, 1.05)
-3.24 (-3.63, -2.85)
-5.20 (-6.79, -3.61)
13.71 (3.30, 24.12)
100.00
6.28
10.47
12.31
Weight
5.58
2.30
7.18
0.68
14.71
11.81
14.56
12.45
1.67
%
KMC decreases LOS, days KMC increases LOS, days
0-10 0 10

97
Supplementary Figure 3.10. Forest plot for effect of KMC compared to conventional care on standardized
mean weight gain
Overall (I-squared = 81.6%, p = 0.000)
Broughton (2013)
Cattaneo (1998)
Suman (2008)
Study
Roberts (2000)
Rodrigues (2009)
Boo (2007)
Ahn (2010)
Acharya (2014)
Lamy Filho (2008)
Rojas (2003)
ID
McMaster (2000)
0.16 (-0.08, 0.40)
-0.17 (-0.56, 0.23)
-0.08 (-0.31, 0.15)
0.91 (0.57, 1.25)
-0.15 (-0.87, 0.57)
0.16 (-0.20, 0.52)
0.08 (-0.27, 0.43)
0.19 (-0.69, 1.07)
0.68 (0.33, 1.04)
-0.20 (-0.33, -0.07)
0.40 (-0.13, 0.92)
SMD (95% CI)
-0.05 (-0.44, 0.34)
100.00
9.34
11.22
10.00
%
5.91
9.80
9.91
4.68
9.79
12.07
7.83
Weight
9.45
KMC decreases weight gain KMC increases weight gain
0-2 0 2

98
Supplementary Figure 3.11. Forest plot for effect of KMC compared to conventional care on standardized
mean pain score
Overall (I-squared = 88.9%, p = 0.000)
Johnston (2008)
Castral (2008)
Morelius (2005)
Chermont (2009)
Study
Marin Gabriel (2008)
Nanavati (2013)
Nimbalkar (2013)
Chidambaram (2013)
Freire (2008)
Mitchell (2013)
ID
-0.63 (-1.09, -0.16)
-1.69 (-2.28, -1.11)
-0.26 (-0.77, 0.25)
0.31 (-0.37, 0.98)
-1.56 (-1.81, -1.31)
-0.17 (-0.70, 0.37)
-0.14 (-0.70, 0.41)
-1.26 (-1.90, -0.62)
-0.53 (-0.93, -0.13)
-0.10 (-0.59, 0.39)
-0.78 (-1.44, -0.12)
SMD (95% CI)
100.00
9.75
10.13
9.28
11.19
%
10.02
9.92
9.48
10.65
10.24
9.36
Weight
KMC decreases pain score KMC increases pain score
0-5 0 5

99
Supplementary Figure 3.12. Risk of bias summary for randomized control trials (n=55)

100
Supplementary Figure 3.13. Risk of bias summary for observational studies (n=69)

101
Supplementary Figure 3.14. Funnel plot for effect of KMC compared to conventional care on
mortality at latest follow-up time
0.5
11
.5
5 10 15RR of mortality at latest follow-up
Funnel plot with pseudo 95% confidence limits

102
Supplementary Table 3.1. Subgroup analysis and meta-regression for the effect of KMC compared to
conventional care on mortality at latest follow-up
Subgroup
n
Subgroup analysis Univariable meta-regression
RR [95%CI]^
p
Test for
heterogeneity
(p)
I2, %
*
Test for
heterogeneity by
covariate (p)
Residual
I2, %
**
All studies 16 0·77 [0·60, 0·99] 0·05 <0·01 67 - -
Confounding adjustment 0·19 57
Adjusted/RCT 12 0·95 [0·73, 1·23] 0·69 0·13 32
Crude 4 0·54 [0·31, 0·96] 0·04 <0·01 81
Follow-up time 0·22 64
≤ 45 days post birth 9 0·89 [0·64, 1·22] 0·46 <0·01 77
3-12 month follow-up 7 0·59 [0·43, 0·82] <0·01 0·63 0
Study type <0·01 51
RCT 9 0·91 [0·73, 1·14] 0·40 0·59 0
Cohort 3 0·90 [0·60, 1·35] 0·61 0·39 0
Facilities evaluation 2 0·26 [0·13, 0·50] <0·01 0·26 21
Chart review 2 1·04 [0·63, 1·73] 0·87 <0·01 95
Study size 0·04 27
< 50 1 0·34 [0·16, 0·72] <0·01 - -
50 - < 100 4 0·81 [0·72, 0·91] <0·01 0·93 0
100 - < 200 2 0·34 [0·10, 1·14] 0·08 0·03 80
≥ 200 9 1·05 [0·83, 1·31] 0·70 0·19 28
Year 0·79 71
1988 - 1999 4 0·79 [0·47, 1·34] 0·38 0·78 0
2000 - 2009 11 0·72 [0·52, 1·00] 0·05 <0·01 78
2010 - 2014 1 1·00 [0·63, 1·60] 1·00 - -
WHO region 0·31 69
Africa 4 0·77 [0·50, 1·18] 0·23 <0·01 89
Americas 5 0·76 [0·47, 1·23] 0·26 0·67 0
Europe 1 1·03 [0·15, 6·91] 0·98 - -
Southeast Asia 4 1·02 [0·80, 1·30] 0·86 0·51 0
Western Pacific 1 0·17 [0·07, 0·44] <0·01 - -
Multiple 1 0·91 [0·19, 4·43] 0·91 - -
Economy -World Bank 0·92 74
Low 4 0·74 [0·48, 1·16] 0·19 0·02 70
Middle 9 0·73 [0·49, 1·08] 0·11 <0·01 78
High 2 1·24 [0·28, 5·43] 0·78 0·76 0
Mixed 1 0·91 [0·19, 4·43] 0·91 - -
Country-level NMR,
deaths/1000 live births
0·49 69
< 5 2 1·24 [0·28, 5·43] 0·78 0·76 0
5 - < 15 4 0·74 [0·45, 1·20] 0·22 0·58 0
15 - < 30 9 0·82 [0·61, 1·12] 0·21 <0·01 78
≥ 30 1 0·34 [0·16, 0·72] 0·01 - -

103
Supplementary Table 3.1 (Continued)
Subgroup
n
Subgroup analysis Univariable meta-regression
RR [95%CI]^
p
Test for
heterogeneity
(p)
I2, %
*
Test for
heterogeneity by
covariate (p)
Residual
I2, %
**
Setting 0·05 25
Urban 10 0·54 [0·37, 0·80] <0·01 0·20 26
Rural 1 1·06 [0·80, 1·41] 0·69 - -
Mixed 3 0·82 [0·73, 0·92] <0·01 0·69 0
Missing 2 0·71 [0·12, 4·20] 0·70 0·08 68
Facility type 0·84 73
Health facility 12 0·73 [0·54, 0·99] 0·04 <0·01 75
NICU/step-down 2 0·49 [0·10, 2·42] 0·38 0·26 21
Community 1 1·00 [0·63,1·60] 1·00 - -
Missing 1 0·97 [0·45, 2·09] 0·94 - -
Gestational age 0·44 70
Very preterm <34 weeks 1 1·64 [0·16, 17·13] 0·68 - -
All gestational ages 2 1·04 [0·82, 1·33] 0·73 0·83 0
Missing 13 0·67 [0·48, 0·94] 0·02 <0·01 73
Birth weight 0·19 65
LBW < 2500g 11 0·76 [0·55, 1·04] 0·09 <0·01 69
Very LBW < 1500g 3 0·50 [0·11, 2·33] 0·38 0·08 60
All BW 2 1·04 [0·82, 1·33] 0·73 0·83 0
KMC components 0·83 73
SSC 5 0·71 [0·33, 1·52] 0·38 0·01 70
SSC /EBF 3 0·64 [0·38, 1·10] 0·11 0·57 0
SSC /EBF/DC/FU 2 0·43 [0·19, 0·98] 0·04 0·27 18
SSC /DC/FU 2 0·55 [0·29, 1·07] 0·08 0·94 0
SSC /EBF/FU 2 0·63 [0·15, 2·63] 0·53 0·15 52
Undefined KMC 2 1·04 [0·63, 1·73] 0·87 <0·01 95
SSC duration promoted,
hours/day
0·31 70
4 - < 9 1 1·64 [0·16, 17·13] 0·68 - -
≥ 22 11 0·64 [0·44, 0·92] 0·02 0·01 60
Undefined 4 1·04 [0·66, 1·64] 0·87 <0·01 84
SSC as KMC component 0·42 68
SSC only 5 0·71 [0·33, 1·52] 0·38 0·01 70
SSC+ other components 9 0·65 [0·48, 0·89] 0·01 0·36 9
Undefined KMC 2 1·04 [0·63, 1·73] 0·87 <0·01 95
EBF as KMC component 0·47 70
EBF component 7 0·66 [0·42, 1·01] 0·06 0·21 29
No EBF component 7 0·66 [0·39, 1·14] 0·14 0·02 61
Undefined KMC 2 1·04 [0·63, 1·73] 0·87 <0·01 95

104
Supplementary Table 3.1 (Continued)
Subgroup
n
Subgroup analysis Univariable meta-regression
RR [95%CI]^
p
Test for
heterogeneity
(p)
I2, %
*
Test for
heterogeneity by
covariate (p)
Residual
I2, %
**
SSC instructed to start 0·04 61
Immediately 3 0·51 [0·33, 0·78] <0·01 0·38 0
After stability met 9 0·57 [0·34, 0·97] 0·04 0·18 30
Missing 4 1·04 [0·77, 1·39] 0·81 <0·01 85
Risk of bias 0·32 46
Low 5 0·65 [0·44, 0·97] 0·04 0·64 0
High 9 0·72 [0·52, 0·99] 0·04 0·01 63
Unclear 2 1·35 [1·11, 1·65] <0·01 0·62 0
KMC: kangaroo mother care, RCT: randomized control trial, WHO: World Health Organization, NMR: neonatal mortality
rate, NICU: neonatal intensive care unit, LBW: low birth weight, BW: birth weight, SSC: skin-to-skin contact, EBF: exclusive
breastfeeding, DC: early hospital discharge, FU: follow-up after discharge
^ Random effects estimates
* I-squared: variation in risk ratio or mean difference attributable to heterogeneity
** Residual I-squared: percent residual variation due to heterogeneity after adjustment for covariate

105
Supplementary Table 3.2: Subgroup analysis and meta-regression for the effect of KMC compared to
conventional care on exclusive breastfeeding during hospital stay or at 40-41weeks post-menstrual age
Subgroup analysis Univariable meta-regression
Subgroup
n
RR [95%CI]^
p
Test for
heterogeneity
(p)
I2, %
*
Test for
heterogeneity by
covariate (p)
Residual
I2, %
**
All studies 13 1·50 [1·26, 1·78] <0·01 <0·01 93 --
Confounding adjustment 0·03 70
Adjusted/RCT 8 1·25 [1·10, 1·42] <0·01 0·02 59
Crude 5 1·80 [1·57, 2·07] <0·01 <0·01 80
Study type 0·01 67
RCT 7 1·21 [1·07, 1·37] <0·01 0·04 55
Cohort 6 1·80 [1·58, 2·05] <0·01 <0·01 75
Study size 0·61 94
< 50 1 2·50 [1·43, 4·38] <0·01 - -
50 - < 100 2 1·39 [0·84, 2·29] 0·20 0·08 68
100 - < 200 2 1·38 [0·83, 2·31] 0·22 0·13 57
≥ 200 8 1·49 [1·21, 1·83] <0·01 <0·01 95
Year 0·17 86
1988-1999 3 1·24 [0·99, 1·56] 0·07 0·02 75
2000-2009 3 1·19 [0·97,1·47] 0·10 0·28 22
2010-2014 7 1·70 [1·42, 2·03] <0·01 <0·01 91
WHO region 0·91 94
Americas 3 1·33 [0·76, 2·32] 0·32 <0·01 97
Europe 4 1·38 [1·13, 1·70] <0·01 0·10 52
Southeast Asia 3 1·67 [1·11, 2·51] 0·01 <0·01 94
East Mediterranean 1 1·73 [1·29, 2·32] <0·01 - -
Western Pacific 1 2·05 [1·01, 4·18] 0·05 - -
Multiple 1 1·25 [1·10, 1·42] <0·01 - -
Economy – World Bank 0·79 90
Low 1 1·88 [1·74, 2·03] <0·01 - -
Middle 5 1·43 [1·09, 1·88] 0·01 <0·01 78
High 6 1·53 [1·13, 2·07] 0·01 <0·01 93
Mixed 1 1·25 [1·10, 1·42] <0·01 - -
Country-level NMR,
deaths/1000 live births
0·77 92
< 5 7 1·57 [1·18, 2·08] <0·01 <0·01 91
5 - < 15 2 1·31 [0·78, 2·20] 0·31 <0·01 89
15 - < 30 4 1·53 [1·13, 2·08] 0·01 <0·01 94
Setting 0·68 94
Urban 10 1·56 [1·22, 1·99] <0·01 <0·01 94
Mixed 3 1·40 [0·99, 1·99] 0·06 <0·01 94
Facility type 0·23 94
Health facility 9 1·39 [1·09, 1·77] 0·01 <0·01 95
NICU/step-down 3 1·84 [1·42, 2·39] <0·01 0·54 0
Community 1 1·88 [1·74, 2·03] <0·01 - -

106
Supplementary Table 3.2 (Continued)
Subgroup analysis Univariable meta-regression
Subgroup
n
RR [95%CI]^
p
Test for
heterogeneity
(p)
I2, %
*
Test for
heterogeneity by
covariate (p)
Residual
I2, %
**
Gestational age 0·37 87
Preterm < 37 weeks 3 1·51 [1·11, 2·06] 0·01 0·12 54
Full term 3 1·76 [1·14, 2·73] 0·01 <0·01 96
All gestational ages 3 1·69 [1·21, 2·35] <0·01 <0·01 82
Missing 4 1·17 [1·02, 1·34] 0·02 0·11 51
Birth weight 0·20 88
LBW < 2500g 3 1·15 [1·02, 1·29] 0·02 0·16 45
Very LBW < 1500g 1 2·05 [1·01, 4·19] 0·05 - -
All BW 3 1·69 [ 1·21, 2·35] <0·01 <0·01 82
Missing 6 1·63 [1·23, 2·17] <0·01 <0·01 91
KMC components 0·49 85
SSC 4 1·36 [1·11, 1·66] <0·01 0·12 49
SSC /EBF 2 1·53 [0·82, 2·87] 0·18 <0·01 90
SSC /EBF/DC/FU 2 1·14 [0·93, 1·39] 0·20 0·06 73
SSC /EBF/FU 3 1·69 [1·16, 2·46] 0·01 <0·01 94
Undefined 2 1·87 [1·27, 2·75] <0·01 0·28 13
SSC duration promoted,
hours/day
0·61 92
< 2 1 2·05 [1·01, 4·18] 0·05 - -
2 - < 4 4 1·75 [1·24, 2·47] <0·01 <0·01 94
4 - < 9 1 1·16 [0·99, 1·36] 0·06 - -
≥ 22 3 1·35 [0·92, 1·96] 0·12 <0·01 97
Undefined 4 1·43 [1·08, 1·88] 0·01 0·12 48
SSC as KMC component 0·59 93
SSC only 4 1·36 [1·11, 1·66] <0·01 0·12 49
SSC + other components 7 1·46 [1·17, 1·82] <0·01 <0·01 96
Undefined KMC 2 1·87 [1·27, 2·75] <0·01 0·28 13
EBF as KMC component 0·59 93
EBF component 7 1·46 [1·17, 1·82] <0·01 <0·01 96
No EBF component 4 1·36 [1·11, 1·66] <0·01 0·12 49
Undefined KMC 2 1·87 [1·27, 2·75] <0·01 0·28 13
SSC start time 0·96 90
Immediately 2 1·67 [0·85, 3·27] 0·13 0·02 82
After stability met 4 1·33 [1·10, 1·60] <0·01 0·06 61
After other criteria met 3 1·68 [0·92, 3·08] 0·09 <0·01 97
Missing 4 1·51 [1·15, 1·98] <0·01 <0·01 82
Risk of bias 0·18 94
Low 2 2·32 [1·49, 3·60] <0·01 0·67 0
High 6 1·60 [1·29, 1·97] <0·01 <0·01 72
Unclear 5 1·30 [0·94, 1·80] 0·11 <0·01 97

107
Supplementary Table 3.2 (Continued)
KMC: kangaroo mother care, RCT: randomized control trial, WHO: World Health Organization, NMR: neonatal mortality
rate, NICU: neonatal intensive care unit, LBW: low birth weight, BW: birth weight, SSC: skin-to-skin contact, EBF: exclusive
breastfeeding, DC: early hospital discharge, FU: follow-up after discharge
^ Random effects estimates
* I-squared: variation in risk ratio or mean difference attributable to heterogeneity
** Residual I-squared: percent residual variation due to heterogeneity after adjustment for covariate

108
Supplementary Table 3.3. Subgroup analysis and meta-regression for the effect of KMC compared to
conventional care on infection
Subgroup analysis Univariable meta-regression
Subgroup
n
RR [95%CI]^
p
Test for
heterogeneity
(p)
I2,
%*
Test for
heterogeneity by
covariate (p)
Residual
I2, %
**
All studies 12 0·67 [0·43, 1·05] 0·08 <0·01 60 - -
Confounding adjustment 0·30 61
Adjusted/RCT 10 0·60 [0·36, 1·01] 0·05 <0·01 65
Crude 2 1·19 [0·56, 2·53] 0·65 0·92 0
Infection type 0·26 55
Sepsis 8 0·53 [0·34, 0·83] 0·01 0·23 25
MRSA or other severe 4 1·00 [0·40, 2·46] 0·99 0·01 77
Study type 0·12 54
RCT 9 0·51 [0·32, 0·81] <0·01 0·03 54
Cohort 1 3·82 [1·11, 13·14] 0·03 - -
Facilities evaluation 1 1·16 [0·48, 2·81] 0·74 - -
Intervention 1 1·27 [0·30 , 5·46] 0·75 - -
Study size 0·83 66
< 50 1 1·27 [0·30, 5·47] 0·75 - -
50 - < 100 3 0·47 [0·28, 0·81] 0·01 0·38 0
100 - < 200 4 0·75 [0·33, 1·73] 0·50 0·21 33
≥ 200 4 0·72 [0·27, 1·88] 0·50 <0·01 83
Year 0·77 65
1988-1999 2 0·58 [0·18, 1·87] 0·36 0·01 86
2000-2009 8 0·65 [0·35, 1·21] 0·18 0·01 62
2010-2014 2 1·15 [0·36, 3·69] 0·81 0·83 0
WHO region 0·05 36
Americas 3 0·57 [0·25, 1·28] 0·17 0·02 75
Southeast Asia 5 0·40 [0·25, 0·64] <0·01 0·45 0
Western Pacific 4 1·65 [0·89, 3·08] 0·11 0·47 0
Economy – World Bank 0·17 60
Middle 9 0·56 [0·35, 0·91] 0·02 0·02 58
High 3 1·30 [0·38, 4·49] 0·68 0·05 68
Country-level NMR,
deaths/1000 live births
0·29 63
< 5 4 1·36 [0·49, 3·78] 0·56 0·10 53
5 - < 15 3 0·48 [0·19, 1·20] 0·12 <0·01 82
15 - < 30 5 0·58 [0·31, 1·07] 0·08 0·17 38
Setting 0·26 58
Urban 11 0·73 [0·46, 1·15] 0·17 <0·01 58
Missing 1 0·27 [0·09, 0·79] 0·02 - -
Facility type 0·36 58
Health facility 7 0·66 [0·42, 1·02] 0·06 0·09 45
NICU/step-down 4 1·17 [0·30, 4·56] 0·82 0·01 72
Missing 1 0·30 [0·14, 0·67] <0·01 - -

109
Supplementary Table 3.3 (Continued)
Subgroup analysis Univariable meta-regression
Subgroup
n
RR [95%CI]^
p
Test for
heterogeneity
(p)
I2,
%*
Test for
heterogeneity by
covariate (p)
Residual
I2, %
**
Gestational age 0·12 55
Very preterm <34 weeks 2 0·68 [0·30, 1·58] 0·37 0·31 3
All gestational ages 1 3·82 [1·11, 13·14] 0·03 - -
Missing 9 0·56 [0·35, 0·91] 0·02 0·02 58
Birth weight 0·12 56
LBW < 2500g 6 0·45 [0·25, 0·81] 0·01 0·01 69
Very LBW < 1500g 4 0·87 [0·48, 1·59] 0·65 0·58 0
All BW 1 3·82 [1·11, 13·14] 0·03 - -
Missing 1 1·27 [0·30, 5·46] 0·75 - -
KMC components 0·62 58
SSC 6 0·75 [0·34, 1·68] 0·48 <0·01 69
SSC/EBF 2 0·90 [0·40, 2·02] 0·80 0·58 0
SSC/EBF/DC/FU 2 1·00 [0·69, 1·45] 0.99 0·98 0
SSC/EBF/FU 1 0·27 [0·09, 0·79] 0·02 - -
Undefined KMC 1 0·31 [0·13, 0·72] 0·01 - -
SSC duration promoted,
hours/day
0·60 63
< 2 2 1·43 [0·41, 4·94] 0·58 0·77 0
4 - < 9 2 0·40 [0·19, 0·82] 0·01 0·47 0
≥ 22 5 0·62 [0·32, 1·20] 0·16 0·02 66
Undefined 3 0·91 [0·24, 3·53] 0·89 <0·01 82
SSC as KMC component 0·59 59
SSC only 6 0·75 [0·34, 1·68] 0·48 0·01 69
SSC + other components 5 0·79 [0·48, 1·28] 0·34 0·24 27
Undefined KMC 1 0·31 [0·13, 0·72] 0·01 - -
EBF as KMC component 0·59 59
EBF component 5 0·79 [0·48, 1·28] 0·34 0·24 27
No EBF component 6 0·75 [0·34, 1·68] 0·48 <0·01 69
Undefined KMC 1 0·31 [0·13, 0·72] 0·01 - -
SSC instructed to start 0·04 25
After stability met 9 0·50 [0·33, 0·77] <0·01 0·15 33
After other criteria met 2 1·00 [0·69, 1·45] 0·99 0·98 0
Missing 1 3·82 [1·11, 13·14] 0·03 - -
Risk of bias 0·32 51
Low 7 0·47 [0·29, 0·77] <0·01 0·25 23
High 3 1·24 [0·44, 3·53] 0·69 0·05 68
Unclear 2 0·61 [0·19, 1·95] 0·40 0·04 77
KMC: kangaroo mother care, RCT: randomized control trial, WHO: World Health Organization, NMR: neonatal mortality
rate, NICU: neonatal intensive care unit, LBW: low birth weight, BW: birth weight, SSC: skin-to-skin contact, EBF: exclusive
breastfeeding, DC: early hospital discharge, FU: follow-up after discharge
^ Random effects estimates
* I-squared: variation in risk ratio or mean difference attributable to heterogeneity
** Residual I-squared: percent residual variation due to heterogeneity after adjustment for covariate

110
Supplementary Table 3.4. Subgroup analysis and meta-regression for the effect of KMC compared to
conventional care on heart rate, beats per minute
Subgroup analysis Univariable meta-regression
Subgroup
n
MD [95%CI]^
p
Test for
heterogeneity
(p)
I2,
%*
Test for
heterogeneity by
covariate (p)
Residual
I2, %
**
All studies 15 -0·41 [-2·25, 1·42] 0·66 0·03 46 - -
Study type 0·64 50
RCT 1 0·20 [-1·54, 1·94] 0·82 - -
Randomized crossover 1 -1·20 [-6·06, 3·66] 0·63 - -
Pre-post 12 -0·40 [-2·89, 2·09] 0·75 0·01 55
Intervention 1 3·77 [-11·80,
19·34]
0·64 - -
Study size 0·19 31
< 50 10 0·93 [-1·63, 3·49] 0·48 0·14 33
50 - < 100 4 -3·09 [-5·41, -0·77] <0·01 0·34 11
100 - < 200 1 0·20 [-1·54,1·94] 0·82 - -
Year 0·08 26
1988 – 1999 3 0·86 [-2·16, 3·88] 0·58 0·46 0
2000 – 2009 7 1·46 [-1·62, 4·53] 0·35 0·10 44
2010 – 2014 5 -3·13 [-5·08, -1·18] <0·01 0·49 0
WHO region 0·43 46
Americas 4 0·75 [-4·16, 5·65] 0·77 0·06 61
Southeast Asia 2 -1·16 [-4·08, 1·77] 0·44 0·06 73
Europe 4 -3·95 [-8·53, 0·64] 0·09 0·23 31
Western Pacific 1 -1·64 [-8·28, 5·00] 0·63 - -
Africa 1 1·53 [-7·57, 10·63] 0·74 - -
Missing 3 2·63 [-0·51, 5.78] 0·10 0·68 0
Economy – World Bank 0·30 43
Low 1 1·53 [-7·57,10·63] 0·74 - -
Middle 4 -0·12 [-3·58, 3·33] 0·94 0·01 74
High 7 -2·62 [-5·19, -0·06] 0·05 0·38 6
Missing 3 2·63 [-0·51, 5·78] 0·10 0·68 0
Country-level NMR,
deaths/1000 live births
0·69 52
< 5 7 -2·62 [-5·19,-0·06] 0·05 0·38 6
5 - < 15 2 2·27 [-9·66, 14·20] 0·71 0·01 85
15 - < 30 3 -0·94 [-3·38, 1·51] 0·45 0·14 49
Missing 3 2·63 [-0·51, 5·78] 0·10 0·68 0
Setting 0·55 51
Urban 9 -0·90 [-3·77, 1·98] 0·54 0·02 55
Rural 1 -2·80 [-5·32, -0·28] 0·03 - -
Missing 5 1·62 [-1·02, 4·25] 0·23 0·69 0
Facility type 0·63 50
Health facility 5 -0·91 [-2·70, 0·89] 0·32 0·27 23
NICU/step-down 9 -0·27 [-3·74, 3·20] 0·88 0·02 56
Missing 1 3·00 [-1·62, 7·62] 0·20 - -

111
Supplementary Table 3.4 (Continued)
Subgroup analysis Univariable meta-regression
Subgroup
n
MD [95%CI]^
p
Test for
heterogeneity
(p)
I2,
%*
Test for
heterogeneity by
covariate (p)
Residual
I2, %
**
Gestational age 0·81 52
Very preterm <34 weeks 6 -1·22 [-5·23, 2·80] 0·55 0·04 56
Preterm < 37 weeks 7 0·02 [-3·04, 3·07] 0·99 0·04 54
Missing 2 0·25 [-1·47, 1·96] 0·78 0·78 0
Birth weight 0·71 45
LBW < 2500g 8 -0·17 [-2·63, 2·28] 0·89 0·12 39
Very LBW < 1500g 2 2·15 [-1·70, 6·01] 0·27 0·51 0
Non LBW 1 1·53 [-7·57, 10·63] 0·74 - -
Missing 4 -1·77 [-5·85, 2·30] 0·39 0·06 60
KMC components <0·01 0
SSC 10 0·17 [-1·18, 1·52] 0·80 0·76 0
SSC/EBF 2 6·86 [1·90, 11·83] 0·01 0·50 0
Undefined KMC 3 -3·62 [-5·74, -1·50] <0·01 0·39 0
SSC duration promoted,
hours/day
0·56 47
< 2 12 -0·88 [-3·22, 1·47] 0·46 0·03 49
4 - < 9 1 0·20 [-1·54, 1·94] 0·82 - -
Undefined 2 2·97 [-2·29, 8·24] 0·27 0·46 0
SSC as KMC component <0·01 0
SSC only 10 0·17 [-1·18, 1·52] 0·80 0·76 0
SSC + other components 2 6·86 [1·90, 11·83] 0·01 0·50 0
Undefined KMC 3 -3·62 [-5·74, -0·50] <0·01 0·39 0
EBF as KMC component <0·01 0
EBF component 2 6·86 [1·90, 11·83] 0·01 0·50 0
No EBF component 10 0·17 [-1·18, 1·52] 0·80 0·76 0
Undefined KMC 3 -3·62 [-5·74, -1·50] <0·01 0·39 0
SSC start time 0·01 0
After stability met 5 2·01 [-1·29, 5·32] 0·23 0·12 46
After other criteria met 6 1·15 [-1·38, 3·68] 0·37 0·93 0
Missing 4 -3·85 [-5·90, -1·81] <0·01 0·47 0
Risk of bias 0·14 50
Low 10 0·90 [-1·67, 3·47] 0·49 0·06 45
Unclear 5 -2·30 [-5·48, 0·88] 0·16 0·06 57
KMC: kangaroo mother care, RCT: randomized control trial, WHO: World Health Organization, NMR: neonatal mortality
rate, NICU: neonatal intensive care unit, LBW: low birth weight, BW: birth weight, SSC: skin-to-skin contact, EBF: exclusive
breastfeeding, DC: early hospital discharge, FU: follow-up after discharge
^ Random effects estimates
* I-squared: variation in risk ratio or mean difference attributable to heterogeneity
** Residual I-squared: percent residual variation due to heterogeneity after adjustment for covariate

112
Supplementary Table 3.5. Subgroup analysis and meta-regression for the effect of KMC compared to
conventional care on respiratory rate, breaths per minute
Subgroup analysis Univariable meta-regression
Subgroup
n
MD [95%CI]^
p
Test for
heterogeneity
(p)
I2,
%*
Test for
heterogeneity by
covariate (p)
Residual
I2, %
**
All studies 12 -3·17 [-5·15, -1·19] <0·01 <0·01 75 - -
Study type 0·03 44
RCT 2 -6·42 [-10·24, -2·60] <0·01 <0·01 93
Randomized crossover 1 -2·30 [-7·05, 2·45] 0·34 - -
Pre-post or crossover 9 -2·16 [-4·06, -0·26] 0·03 0·13 36
Study size 0·07 61
< 50 7 -2·06 [-4·84, 0·72] 0·15 0·07 49
50 - < 100 4 -3·49 [-4·99, -1·99] <0·01 0·27 24
100 - < 200 1 -8·40 [-10·01, -6·79] <0·01 - -
Year 0·92 95
1988 - 1999 2 -1·91 [-6·06, 2·23] 0·37 0·75 0
2000 - 2009 5 -3·65 [-6·90, -0·40] 0·03 <0·01 85
2010 – 2014 5 -2·94 [-5·51, -0·36] 0·03 0·05 57
WHO region 0·10 67
Americas 4 -1·86 [-4·35, 0·63] 0·14 0·53 0
Southeast Asia 3 -5·43 [-8·50, -2·35] <0·01 <0·01 89
Europe 2 -0·30 [-3·08, 2·48] 0·83 0·46 0
Western Pacific 1 -7·82 [-12·03,-3·61] <0·01 - -
Missing 2 -0·95 [-5·41, 3·50] 0·68 0·51 0
Economy – World Bank 0·38 74
Middle 5 -4·24 [-6·93, -1·56] <0·01 <0·01 84
High 5 -2·37 [-5·59, 0·85] 0·15 0·06 57
Missing 2 -0·95 [-5·41, 3·51] 0·68 0·51 0
County-level NMR,
deaths/1000 live births
0·20 75
< 5 5 -2·37 [-5·59, 0·84] 0·15 0·06 57
5 - < 15 2 -1·60 [-6·21, 3·01] 0·50 0·15 53
15 - < 30 3 -5·43 [-8·50, -2·35] <0·01 <0·01 89
Missing 2 -0·95 [-5·41, 3·51] 0·68 0·51 0
Setting 0·87 82
Urban 7 -3·04 [-5·68, -0·40] 0·02 <0·01 84
Rural 1 -2·99 [-5·87, -0·11] 0·04 - -
Missing 4 -3·33 [-7·63, 0·98] 0·13 0·11 50
Facility type 0·37 94
Health facility 5 -4·49 [-7·08, -1·90] <0·01 <0·01 82
NICU/step-down 7 -1·93 [-4·45, 0·60] 0·14 0·09 45

113
Supplementary Table 3.5 (Continued)
Subgroup analysis Univariable meta-regression
Subgroup
n
MD [95%CI]^
p
Test for
heterogeneity
(p)
I2,
%*
Test for
heterogeneity by
covariate (p)
Residual
I2, %
**
Gestational age 0·02 60
Very preterm <34 weeks 3 -0·19 [-2·70, 2·32] 0·88 0·75 0
Preterm < 37 weeks 7 -3·16 [-5·18, -1·15] <0·01 0·24 25
Missing 2 -6·42 [-10·24, -2·60] <0·01 <0·01 93
Birth weight 0·55 95
LBW < 2500g 7 -4·23 [-6·71, -1·75] <0·01 <0·01 79
Very LBW < 1500g 1 -0·69 [-9·16, 7·78] 0·87 - -
Missing 4 -1·68 [-3·61, 0·24] 0·09 0·50 0
KMC components 0·94 93
SSC 6 -3·46 [-7·42, 0·51] 0·09 <0·01 81
SSC/EBF 3 -2·64 [-6·25, 0·98] 0·15 0·10 57
Undefined KMC 3 -2·61 [-4·57, -0·65] 0·01 0·60 0
SSC duration promoted,
hours/day
0·10 70
< 2 8 -2·56 [-4·43, -0·69] 0·01 0·18 31
4 - < 9 1 -8·40 [-10·01, -6·79] <0·01 - -
Undefined 3 -2·46 [-6·27, 1·34] 0·20 0·06 64
SSC as KMC component 0·94 93
SSC only 6 -3·46 [-7·42, 0·51] 0·09 <0·01 81
SSC + other components 3 -2·64 [-6·25, 0·98] 0·15 0·10 57
Undefined KMC 3 -2·61 [-4·57, -0·65] 0·01 0·60 0
EBF as KMC component 0·94 93
EBF component 3 -2·64 [-6·25, 0·98] 0·15 0·10 57
No EBF component 6 -3·46 [-7·42, 0·51] 0·09 <0·01 81
Undefined KMC 3 -2·61 [-4·57, -0·65] 0·01 0·60 0
SSC start time 0·62 77
After stability met 5 -4·06 [-7·10, -1·01] 0·01 <0·01 83
After other criteria met 4 -2·06 [-6·91, 2·80] 0·41 0·02 69
Missing 3 -2·61 [-4·57, -0·65] 0·01 0·60 0
Risk of bias 0·50 89
Low 8 -2·91 [-4·84, -0·98] <0·01 0·04 54
Unclear 4 -3·63 [-8·45, 1·18] 0·14 <0·01 84
KMC: kangaroo mother care, RCT: randomized control trial, WHO: World Health Organization, NMR: neonatal mortality
rate, NICU: neonatal intensive care unit, LBW: low birth weight, BW: birth weight, SSC: skin-to-skin contact, EBF: exclusive
breastfeeding, DC: early hospital discharge, FU: follow-up after discharge
^ Random effects estimates
* I-squared: variation in risk ratio or mean difference attributable to heterogeneity
** Residual I-squared: percent residual variation due to heterogeneity after adjustment for covariate

114
Supplementary Table 3.6. Subgroup analysis and meta-regression for the effect of KMC compared to
conventional care on oxygen saturation, percent
Subgroup analysis Univariable meta-regression
Subgroup
n
MD [95%CI]^
p
Test for
heterogeneity
(p)
I2,
%*
Test for
heterogeneity by
covariate (p)
Residual
I2, %
**
All studies 14 0·90 [0·35, 1·45] <0·01 <0·01 92 - -
Study type 0·37 89
RCT 3 1·65 [0·72, 2·59] <0·01 <0·01 87
Randomized crossover 1 -0·10 [-1·10, 0·90] 0·85 - -
Pre-post 10 0·72 [0·06, 1·38] 0·03 <0·01 89
Study size 0·29 87
< 50 8 0·74 [-0·24, 1·71] 0·14 <0·01 81
50 - < 100 4 0·51 [-0·17, 1·19] 0·14 <0·01 93
100 - < 200 2 2·10 [0·83, 3·37] <0·01 0·02 83
Year 0·65 89
1988 - 1999 3 0·43 [-0·37, 1·23] 0·29 0·22 34
2000 - 2009 6 0·85 [ 0·02, 1·69] 0·05 <0·01 86
2010 - 2014 5 1·26 [0·23, 2·29] 0·02 <0·01 94
WHO region 0·08 64
Americas 4 0·85 [-0·20, 1·91] 0·11 0·02 68
Southeast Asia 3 1·11 [0·79, 1·43] <0·01 0·23 32
Europe 2 0·01 [0·00, 0·02] 0·05 0·99 0
East Mediterranean 1 2·80 [1·91, 3·70] <0·01 - -
Western Pacific 1 3·00 [1·90, 4·10] <0·01 - -
Missing 3 -0·29 [-1·81, 1·23] 0·71 <0·01 80
Economy – World Bank 0·11 81
Middle 6 1·48 [0·97, 1·98] <0·01 <0·01 74
High 5 0·61 [-0·53, 1·75] 0·30 <0·01 86
Missing 3 -0·29 [-1·81, 1·23] 0·71 <0·01 80
Country-level NMR,
deaths/1000 live births
0·11 78
< 5 5 0·61 [-0·53, 1·75] 0·30 <0·01 86
5 - < 15 3 2·04 [0·86, 3·23] <0·01 0·02 76
15 - < 30 3 1·11 [0·79, 1·43] <0·01 0·23 32
Missing 3 -0·29 [-1·81, 1·23] 0·71 <0·01 80
Setting 0·53 91
Urban 8 1·06 [0·34, 1·78] <0·01 <0·01 91
Rural 1 1·09 [0·66, 1·52] <0·01 - -
Missing 5 0·42 [-1·09, 1·93] 0·58 <0·01 87

115
Supplementary Table 3.6 (Continued)
Subgroup analysis Univariable meta-regression
Subgroup
n
MD [95%CI]^
p
Test for
heterogeneity
(p)
I2,
%*
Test for
heterogeneity by
covariate (p)
Residual
I2, %
**
Facility type 0·45 84
Health facility 6 1·32 [0·68, 1·95] <0·01 <0·01 83
NICU/step-down 7 0·42 [-0·46, 1·30] 0·35 <0·01 84
Missing 1 1·00 [0·16, 1·84] 0·02 - -
Gestational age 0·28 76
Very preterm < 34 weeks 4 0·15 [-0·41, 0·71] 0·59 0·10 52
Preterm < 37 weeks 7 0·93 [0·04, 1·82] 0·04 <0·01 81
Full term 1 2·80 [1·91, 3·70] <0·01 - -
Missing 2 1·16 [0·58, 1·75] <0·01 0·09 66
Birth weight 0·20 84
LBW < 2500g 7 1·13 [0·44, 1·82] <0·01 <0·01 81
Very LBW < 1500g 2 0·83 [0·07, 1·60] 0·03 0·34 0
Non LBW 1 2·80 [1·91, 3·70] <0·01 - -
Missing 4 0·11 [-0·77, 0·99] 0·80 <0·01 89
KMC components 0·68 88
SSC 8 1·05 [0·16, 1·93] 0·02 <0·01 84
SSC/EBF 3 0·42 [-0·64, 1·47] 0·44 0·01 77
Undefined KMC 3 0·98 [-0·08, 2·04] 0·07 <0·01 95
SSC duration promoted,
hours/day
0·38 91
< 2 10 1·07 [0·36, 1·77] <0·01 <0·01 92
4 - < 9 1 1·50 [0·93, 2·07] <0·01 - -
Undefined 3 -0·14 [-1·78, 1·50] 0·10 0·01 78
SSC as KMC component 0·68 88
SSC only 8 1·05 [0·16, 1·93] 0·02 0·01 84
SSC + other components 3 0·42 [-0·64, 1·47] 0·44 0·01 77
Undefined KMC 3 0·98 [-0·08, 2·04] 0·07 0·01 95
EBF as KMC component 0·68 88
EBF component 3 0·42 [-0·64, 1·47] 0·44 0·01 77
No EBF component 8 1·05 [0·16, 1·93] 0·02 <0·01 84
Undefined KMC 3 0·98 [-0·08, 2·04] 0·07 <0·01 95
SSC instructed start time 0·44 87
After stability met 5 0·63 [-0·06, 1·32] 0·08 <0·01 76
After other criteria met 5 0·76 [-0·54, 2·07] 0·25 <0·01 82
For a painful procedure 1 2·80 [1·91, 3·69] <0·01 - -
Missing 3 0·98 [-0·08, 2·04] 0·07 <0·01 95

116
Supplementary Table 3.6 (Continued)
Subgroup analysis Univariable meta-regression
Subgroup
n
MD [95%CI]^
p
Test for
heterogeneity
(p)
I2,
%*
Test for
heterogeneity by
covariate (p)
Residual
I2, %
**
Risk of bias 0·24 82
Low 9 0·93 [0·34, 1·51] <0·01 <0·01 78
High 1 2·80 [1·91, 3·69] <0·01 - -
Unclear 4 0·42 [-0·52, 1·35] 0·38 <0·01 89
KMC: kangaroo mother care, RCT: randomized control trial, WHO: World Health Organization, NMR: neonatal mortality
rate, NICU: neonatal intensive care unit, LBW: low birth weight, BW: birth weight, SSC: skin-to-skin contact, EBF: exclusive
breastfeeding, DC: early hospital discharge, FU: follow-up after discharge
^ Random effects estimates
* I-squared: variation in risk ratio or mean difference attributable to heterogeneity
** Residual I-squared: percent residual variation due to heterogeneity after adjustment for covariate

117
Supplementary Table 3.7. Subgroup analysis and meta-regression for the effect of KMC compared to
conventional care on temperature, degrees Celsius
Subgroup analysis Univariable meta-regression
Subgroup
n
MD [95%CI]^
p
Test for
heterogeneity
(p)
I2,
%*
Test for
heterogeneity by
covariate (p)
Residual
I2, %
**
All studies 14 0·24 [0·15, 0·33] <0·01 <0·01 82 - -
Study type 0·18 68
RCT 2 0·31 [0·12, 0·51] <0·01 0·01 85
Randomized crossover 1 0·10 [-0·03, 0·23] 0·12 - -
Crossover 1 0·50 [0·39, 0·61] <0·01 - -
Pre-post 10 0·20 [0·10, 0·30] <0·01 <0·01 63
Study size 0·82 81
< 50 10 0·21 [0·09, 0·34] <0·01 <0·01 79
50 - < 100 2 0·26 [-0·07, 0·59] 0·12 <0·01 88
100 - < 200 2 0·31 [0·12, 0·51] <0·01 0·01 85
Year 0·72 78
1988 - 1999 2 0·23 [-0·26, 0·72] 0·35 0·19 42
2000 - 2009 7 0·28 [0·17, 0·40] <0·01 <0·01 82
2010 - 2014 5 0·19 [0·03, 0·35] 0·02 <0·01 76
WHO region 0·12 66
Americas 3 0·09 [-0·01, 0·19] 0·08 0·36 3
Southeast Asia 2 0·40 [0·35, 0·46] <0·01 0·72 0
Europe 2 -0·18 [-0·71, 0·35] 0·50 0·13 57
East Mediterranean 1 0·20 [0·06, 0·34] 0·01 - -
Western Pacific 1 0·26 [0·17, 0·35] <0·01 - -
Africa 2 0·35 [0·06, 0·64] 0·02 <0·01 94
Missing 3 0·32 [0·18, 0·47] <0·01 0·68 0
Economy – World Bank 0·09 70
Low 1 0·20 [0·09, 0·31] <0·01 - -
Middle 5 0·35 [0·24, 0·46] <0·01 <0·01 76
High 5 0·06 [-0·09, 0·22] 0·42 <0·01 74
Missing 3 0·32 [0·18, 0·47] <0·01 0·68 0
Country-level NMR,
deaths/1000 live births
0·14 69
< 5 5 0·06 [-0·09, 0·22] 0·42 <0·01 74
5 - < 15 2 0·19 [0·07, 0·30] <0·01 0·74 0
15 - < 30 3 0·34 [0·19, 0·49] <0·01 <0·01 82
≥ 30 1 0·50 [0·39, 0·61] <0·01 - -
Missing 3 0·32 [0·18, 0·47] <0·01 0·68 0
Setting 0·74 84
Urban 8 0·21 [0·08, 0·34] <0·01 <0·01 88
Rural 2 0·19 [-0·31, 0·69] 0·45 <0·01 90
Missing 4 0·28 [0·20, 0·36] <0·01 0·73 0

118
Supplementary Table 3.7 (Continued)
Subgroup analysis Univariable meta-regression
Subgroup
n
MD [95%CI]^
p
Test for
heterogeneity
(p)
I2,
%*
Test for
heterogeneity by
covariate (p)
Residual
I2, %
**
Facility type 0·14 75
Health facility 7 0·32 [0·21, 0·43] <0·01 <0·01 80
NICU/step-down 6 0·14 [0·03, 0·25] 0·02 0·02 62
Missing 1 0·70 [-0·19, 1·59] 0·12 - -
Gestational age 0·49 77
Very preterm < 34 weeks 4 0·11 [-0·20, 0·42] 0·50 0·01 72
Preterm < 37 weeks 6 0·21 [0·09, 0·33] <0·01 0·01 68
Full Term 1 0·20 [0·06, 0·34] 0·01 - -
Missing 3 0·37 [0·22, 0·52] <0·01 <0·01 88
Birth weight 0·86 83
LBW < 2500g 7 0·26 [0·14, 0·38] <0·01 <0·01 86
Very LBW < 1500g 2 0·03 [-1·22, 1·29] 0·96 0·03 79
Non LBW 1 0·20 [0·09, 0·31] <0·01 - -
Missing 4 0·24 [0·05, 0·42] 0·01 0·01 75
KMC components 0·91 83
SSC 10 0·24 [0·13, 0·35] <0·01 <0·01 84
SSC/EBF 3 0·14 [-0·07, 0·36] 0·19 0·09 60
Undefined KMC 1 0·43 [0·25, 0·62] <0·01 - -
SSC duration promoted,
hours/day
0·27 63
< 2 8 0·23 [0·13, 0·32] <0·01 0·02 58
2 - < 4 2 0·09 [-0·17, 0·35] 0·52 0·07 70
4 - < 9 1 0·40 [0·34, 0·46] <0·01 - -
12 - < 22 1 0·50 [0·39, 0·61] <0·01 - -
Undefined 2 0·16 [-0·18, 0·49] 0·36 0·04 77
SSC as KMC component 0·47 82
SSC only 10 0·24 [0·13, 0·35] <0·01 <0·01 84
SSC + other components 3 0·14 [-0·07, 0·36] 0·19 0·09 60
Undefined KMC 1 0·43 [0·25, 0·62] <0·01 - -
EBF as KMC component 0·47 82
EBF component 3 0·14 [-0·07, 0·36] 0·19 0·09 60
No EBF component 10 0·24 [0·13, 0·35] <0·01 <0·01 84
Undefined KMC 1 0·43 [0·25, 0·62] <0·01 - -
SSC start time 0·96 82
After stability met 6 0·29 [0·16, 0·42] <0·01 <0·01 85
After other criteria met 6 0·17 [0·06, 0·29] <0·01 0·02 62
Missing 2 -0·01 [-1·00, 0·98] 0·98 0·01 86

119
Supplementary Table 3.7 (Continued)
Subgroup analysis Univariable meta-regression
Subgroup
n
MD [95%CI]^
p
Test for
heterogeneity
(p)
I2,
%*
Test for
heterogeneity by
covariate (p)
Residual
I2, %
**
Risk of bias 0·35 78
Low 10 0·20 [0·10, 0·30] <0·01 <0·01 63
Unclear 4 0·31 [0·14, 0·47] <0·01 <0·01 90
KMC: kangaroo mother care, RCT: randomized control trial, WHO: World Health Organization, NMR: neonatal mortality
rate, NICU: neonatal intensive care unit, LBW: low birth weight, BW: birth weight, SSC: skin-to-skin contact, EBF: exclusive
breastfeeding, DC: early hospital discharge, FU: follow-up after discharge
^ Random effects estimates
* I-squared: variation in risk ratio or mean difference attributable to heterogeneity
** Residual I-squared: percent residual variation due to heterogeneity after adjustment for covariate

120
Supplementary Table 3.8. Subgroup analysis and meta-regression for the effect of KMC compared to
conventional care on length of hospital stay, days
Subgroup analysis Univariable meta-regression
Subgroup
n
RR [95%CI]^
p
Test for
heterogeneity
(p)
I2,
%*
Test for
heterogeneity
by covariate (p)
Residual
I2, %
**
All studies 12 -0·68 [-2·11, 0·75] 0·35 <0·01 95 - -
Study type 0·98 89
RCT 5 -0·38 [-2·99, 2·23] 0·78 <0·01 91
Other observational 7 -0·32 [-3·28, 2·64] 0·83 <0·01 89
Study type 0·46 90
RCT 5 -0·38 [-2·99, 2·23] 0·78 <0·01 91
Cohort 4 -1·72 [-5·88, 2·45] 0·42 <0·01 93
Chart review 2 -0·93 [-5·13, 3·28] 0·67 0·14 53
Facilities evaluation 1 7·00 [2·24, 11·76] <0·01 - -
Study size 0·68 91
< 50 1 2·00 [-14·95, 8·95] 0·82 - -
50 - < 100 3 -2·19 [-5·09, 0·71] 0·14 0·20 37
100 - < 200 4 1·67 [-3·04, 6·37] 0·49 <0·01 94
≥ 200 4 -1·01 [-3·81, 1·79] 0·48 <0·01 92
Year 0·40 86
1988 - 1999 1 -7·80 [-16·45, 0·85] 0·08 - -
2000 - 2009 7 -0·96 [-3·01, 1·09] 0·36 <0·01 88
2010 – 2014 4 1·08 [-2·31, 4·46] 0·53 <0·01 83
WHO region 0·39 87
Americas 3 -2·68 [-6·61, 1·24] 0·18 0·01 78
Southeast Asia 4 -0·43 [-3·10, 2·24] 0·75 <0·01 93
Europe 3 1·01 [-7·70, 9·71] 0·82 0·01 80
Western Pacific 2 6·63 [2·05, 11·22] 0·01 0·58 0
Economy – World Bank 0·71 84
Low 1 2·99 [0·62, 5·36] 0·01 - -
Middle 7 -1·24 [-3·16, 0·68] 0·21 <0·01 87
High 4 1·01 [-6·31, 8·34] 0·79 0·02 70
Country-level NMR,
deaths/1000 live births 0·59 88
< 5 4 1·01 [-6·31, 8·34] 0·79 0·02 70
5 - < 15 3 -2·68 [-6·61, 1·24] 0·18 0·01 78
15 - < 30 5 0·64 [-2·17, 3·44] 0·66 <0·01 93
Setting 0·98 89
Urban 11 -0·74 [-2·29, 0·81] 0·35 <0·01 95
Missing 1 -0·08 [-1·73, 1·57] 0·92 - -
Facility type 0·98 89
Health facility 11 -0·74 [-2·29, 0·81] 0·35 <0·01 95
NICU/step-down 1 -0·08 [-1·73, 1·57] 0·92 - -

121
Supplementary Table 3.8 (Continued)
Subgroup
n
Subgroup analysis Univariable meta-regression
RR [95%CI]^
p
Test for
heterogeneity
(p)
I2,
%*
Test for
heterogeneity
by covariate (p)
Residual
I2, %
**
Gestational age 0·99 89
Preterm < 37 weeks 5 0·23 [-5·22, 5·68] 0·93 0·02 67
All gestational ages 1 -0·68 [-0·79, -0·57] <0·01 - -
Missing 6 -0·49 [-2·80, 1·83] 0·68 <0·01 93
Birth weight 0·06 86
LBW < 2500g 7 -1·32 [-3·24, 0·59] 0·18 <0·01 89
Very LBW < 1500g 2 8·69 [2·98, 14·41] <0·01 0·25 24
All BW 1 -0·68 [-0·79, -0·57] <0·01 - -
Missing 2 -5·72 [-13·57, 2·13] 0·15
KMC components 0·66 88
SSC 7 -0·10 [-2·17, 1·98] 0·93 <0·01 97
SSC/EBF 2 -3·03 [-7·34, 1·29] 0·17 <0·01 92
SSC/EBF/DC 1 -3·20 [-7·51, 1·11] 0·15 - -
SSC/EBF/FU 1 -0·08 [-1·73, 1·57] 0·92 - -
Undefined KMC 1 2·99 [0·62, 5·36] 0·01 - -
SSC duration promoted,
hours/day
0·68 89
< 2 1 13·71 [3·30, 24·12] 0·01 - -
2 - < 4 2 1·14 [-2·57, 4·86] 0·55 0·92 0
4 - < 9 2 -0·24 [-6·34, 5·86] 0·94 <0·01 96
≥ 22 3 0·09 [-5·11, 5·29] 0·97 <0·01 94
Undefined 4 -0·92 [-1·90, 0·06] 0·07 0·27 24
SSC as KMC component 0·44 88
SSC only 7 -0·10 [-2·17, 1·98] 0·93 <0·01 97
SSC+ other components 4 -2·25 [-5·03, 0·54] 0·11 <0·01 87
Undefined KMC 1 2·99 [ 0·62, 5·36] 0·01 - -
EBF as KMC component 0·44 88
EBF component 4 -2·25 [-5·03, 0·54] 0·11 <0·01 87
No EBF component 7 -0·10 [-2·17, 1·98] 0·93 <0·01 97
Undefined KMC 1 2·99 [ 0·62, 5·36] 0·01 - -
SSC start time 0·22 85
After stability met 6 -0·60 [-2·94, 1·75] 0·62 <0·01 91
After other criteria met 3 2·46 [0·46, 4·46] 0·02 0·71 0
Missing 3 -2·08 [-5·07, 0·91] 0·17 0·14 49

122
Supplementary Table 3.8 (Continued)
Subgroup
n
Subgroup analysis Univariable meta-regression
RR [95%CI]^
p
Test for
heterogeneity
(p)
I2,
%*
Test for
heterogeneity
by covariate (p)
Residual
I2, %
**
Risk of bias 0·71 87
Low 3 -1·49 [-3·78, 0·80] 0·20 <0·01 89
High 8 -0·27 [-3·16, 2·62] 0·85 <0·01 87
Unclear 1 2·99 [0·62, 5·36] 0·01 - -
KMC: kangaroo mother care, RCT: randomized control trial, WHO: World Health Organization, NMR: neonatal mortality
rate, NICU: neonatal intensive care unit, LBW: low birth weight, BW: birth weight, SSC: skin-to-skin contact, EBF: exclusive
breastfeeding, DC: early hospital discharge, FU: follow-up after discharge
^ Random effects estimates
* I-squared: variation in risk ratio or mean difference attributable to heterogeneity
** Residual I-squared: percent residual variation due to heterogeneity after adjustment for covariate

123
Supplementary Table 3.9. Subgroup analysis and meta-regression for the effect of KMC compared to
conventional care on weight gain, standardized mean difference (SMD)
Subgroup analysis Univariable meta-regression
Subgroup
n
SMD [95%CI]^
p
Test for
heterogeneity
(p)
I2,
%*
Test for
heterogeneity by
covariate (p)
Residual
I2, %
**
All studies 11 0·16 [-0·08, 0·40] 0·19 <0·01 82 - -
Study type 0·52 73
RCT 6 0·33 [-0·05, 0·70] 0·09 <0·01 83
Cohort 2 -0·19 [-0·32, -0·06] 0·01 0·39 0
Chart review 2 0·01 [-0·31, 0·32] 0·97 0·23 30
Facilities evaluation 1 -0·05 [-0·44, 0·34] 0·81 - -
Study size 0·95 87
< 50 2 -0·01 [-0·57, 0·54] 0·96 0·56 0
50 - <100 2 0·09 [-0·46, 0·64] 0·76 0·09 64
100 - < 200 4 0·22 [-0·09, 0·54] 0·17 0·03 67
≥ 200 3 0·19 [-0·36, 0·73] 0·50 <0·01 94
Year 0·23 82
1988 - 1999 1 -0·08 [-0·31, 0·15] 0·50 - -
2000 - 2009 7 0·17 [-0·16, 0·50] 0·32 <0·01 85
2010 - 2014 3 0·25 [-0·38, 0·87] 0·44 0·01 80
WHO region 0·01 41
Americas 4 -0·02 [-0·27, 0·24] 0·90 0·06 59
Southeast Asia 2 0·80 [0·56, 1·05] <0·01 0·37 0
Western Pacific 4 0·02 [-0·22, 0·25] 0·90 0·90 0
Multiple Regions 1 -0·08 [-0·31, 0·15] 0·50 - -
Economy – World Bank 0·36 82
Low 1 0·68 [0·33, 1·04] <0·01 - -
Middle 6 0·12 [-0·22, 0·45] 0·50 <0·01 87
High 3 0·20 [-0·18, 0·58] 0·30 0·49 0
Mixed 1 -0·08 [-0·31, 0·15] 0·50 - -
Country-level NMR,
deaths/1000 live births
0·20 68
< 5 4 0·13 [-0·12, 0·39] 0·31 0·65 0
5 - < 15 3 -0·11 [-0·32, 0·10] 0·29 0·19 40
15 - < 30 4 0·36 [-0·15, 0·87] 0·17 <0·01 90
Setting 0·13 71
Urban 9 0·09 [-0·13, 0·32] 0·42 <0·01 69
Mixed 1 -0·08 [-0·31, 0·15] 0·50 - -
Missing 1 0·91 [0·57, 1·25] <0·01 - -
Facility type 0·30 76
Health facility 8 0·06 [-0·16, 0·28] 0·59 <0·01 72
NICU/step-down 3 0·42 [-0·22, 1·06] 0·19 <0·01 83

124
Supplementary Table 3.9 (Continued)
Subgroup
n
Subgroup analysis Univariable meta-regression
SMD [95%CI]^
p
Test for
heterogeneity
(p)
I2,
%*
Test for
heterogeneity by
covariate (p)
Residual
I2, %
**
Gestational age 0·81 86
Very preterm < 34 weeks 1 0·40 [-0·13, 0·92] 0·14 - -
Preterm < 37 weeks 4 -0·01 [-0·23, 0·25] 0·95 0·62 0
Missing 6 0·21 [-0·14, 0·56] 0·24 <0·01 90
Birth weight 0·59 86
LBW < 2500g 7 0·20 [-0·13, 0·54] 0·24 <0·01 88
Very LBW < 1500g 3 0·09 [-0·14, 0·33] 0·43 0·41 0
Missing 1 -0·15 [-0·87, 0·57] 0·69 - -
KMC components <0·01 0
SSC 5 0·10 [-0·09, 0·28] 0·32 0·67 0
SSC/EBF 1 -0·20 [-0·33, -0·07] <0·01 - -
SSC/EBF/DC 1 -0·17 [-0·56, 0·23] 0·41 - -
SSC/EBF/DC/FU 1 -0·08 [-0·31, 0·15] 0·50 - -
SSC/EBF/FU 1 0·91 [0·57, 1·26] <0·01 - -
Undefined KMC 2 0·60 [ 0·24, 0·96] <0·01 0·30 5
SSC duration promoted,
hours/day
0·76 86
< 2 1 0·08 [-0·27, 0·43] 0·66 - -
2 - < 4 2 0·10 [-0·22, 0·42] 0·55 0·46 0
4 - < 9 2 0·59 [0·30, 0·89] <0·01 0·37 0
≥ 22 4 0·13 [-0·30, 0·56] 0·55 <0·01 92
Undefined 2 -0·11 [-0·47, 0·25] 0·56 0·47 0
SSC as KMC component 0·24 81
SSC only 5 0·10 [-0·09, 0·28] 0·32 0·70 0
SSC + other components 4 0·10 [-0·33, 0·54] 0·64 <0·01 92
Undefined KMC 2 0·60 [0·24, 0·96] <0·01 0·30 5
EBF as KMC component 0·24 81
EBF component 4 0·10 [-0·33, 0·54] 0·64 <0·01 92
No EBF component 5 0·10 [-0·09, 0·28] 0·32 0·67 0
Undefined KMC 2 0·60 [0·24, 0·96] <0·01 0·30 5
SSC start time 0·07 44
Immediately 1 -0·08 [-0·31, 0·15] 0·50 - -
After stability met 5 0·21 [-0·22, 0·65] 0·33 <0·01 90
After other criteria met 3 0·29 [-0·17, 0·75] 0·21 0·04 68
Missing 2 -0.11 [-0·47, 0·25] 0·56 0·47 0

125
Supplementary Table 3.9 (Continued)
Subgroup
n
Subgroup analysis Univariable meta-regression
SMD [95%CI]^
p
Test for
heterogeneity
(p)
I2,
%*
Test for
heterogeneity by
covariate (p)
Residual
I2, %
**
Risk of bias 0·06 65
Low 2 0·50 [-0·32, 1·31] 0·23 <0·01 91
High 6 -0·06 [-0·23, 0·12] 0·53 0·18 34
Unclear 3 0·26 [-0·32, 0·85] 0·38 <0·01 84
KMC: kangaroo mother care, RCT: randomized control trial, WHO: World Health Organization, NMR: neonatal mortality
rate, NICU: neonatal intensive care unit, LBW: low birth weight, BW: birth weight, SSC: skin-to-skin contact, EBF: exclusive
breastfeeding, DC: early hospital discharge, FU: follow-up after discharge
^ Standardized mean difference - random effects estimates
* I-squared: variation in risk ratio or mean difference attributable to heterogeneity
** Residual I-squared: percent residual variation due to heterogeneity after adjustment for covariate

126
Supplementary Table 3.10. Subgroup analysis and meta-regression for the effect of KMC compared to
conventional care on pain score, standardized mean difference (SMD)
Subgroup analysis Univariable meta-regression
Subgroup
n
SMD [95%CI]^
p
Test for
heterogeneity
(p)
I2,
%*
Test for
heterogeneity by
covariate (p)
Residual
I2, %
**
All studies 10 -0·63 [-1·09, -0·16] 0·01 <0·01 89 - -
Study type 0·28 96
RCT 6 -0·52 [-1·16, 0·13] 0·12 <0·01 91
Randomized crossover 2 -1·50 [-1·93, -1·06] <0·01 0·33 0
Crossover 1 -0·53 [-0·93, -0·13] 0·01 - -
Pre-post 1 0·31 [-0·37, 0·98] 0·37 - -
Study size 0·20 77
< 50 1 0·31 [-0·37, 0·98] 0·37 - -
50 - < 100 7 -0·67 [-1·09, -0·25] <0·01 <0·01 76
100 - < 200 1 -0·10 [-0·59, 0·39] 0·69 - -
≥ 200 1 -1·56 [-1·81, -1·31] <0·01 - -
Year 0·21 94
2000 – 2009 6 -0·59 [-1·31, 0·12] 0·10 <0·01 93
2010 – 2014 4 -0·65 [-1·07, -0·22] <0·01 0·07 58
WHO region 0·32 97
Americas 5 -0·89 [-1·58, -0·20] 0·01 <0·01 91
Southeast Asia 3 -0·62 [-1·18, -0·06] 0·03 0·03 71
Europe 2 0·02 [-0·43, 0·48] 0·92 0·28 14
Economy – World Bank 0·93 94
Middle 6 -0·65 [-1·25, -0·06] 0·03 <0·01 91
High 4 -0·59 [-1·44, 0·26] 0·17 <0·01 87
Country-level NMR,
deaths/1000 live births
0·22 92
< 5 4 -0·59 [-1·44, 0·26] 0·17 <0·01 87
5 - < 15 3 -0·66 [-1·71, 0·39] 0·22 <0·01 95
15 - < 30 3 -0·62 [-1·18, -0·06] 0·03 0·03 71
Setting 0·73 94
Urban 8 -0·68 [-1·21, -0·14] 0·01 <0·01 90
Missing 2 -0·40 [-1·07, 0·26] 0·23 0·10 62
Facility type 0·84 93
Health facility 4 -0·87 [-1·60, -0·14] 0·02 <0·01 92
NICU/step-down 6 -0·46 [-1·00, 0·08] 0·10 <0·01 81
Gestational age 0·34 80
Very preterm < 34 weeks 3 -0·73 [-1·88, 0·41] 0·21 <0·01 90
Preterm < 37 weeks 5 -0·44 [-0·79, -0·08] 0·02 0·04 59
Full Term 1 -1·56 [-1·81, -1·31] <0·01 - -
Missing 1 -0·14 [-0·70, 0·41] 0·62 - -

127
Supplementary Table 3.10 (Continued)
Subgroup
n
Subgroup analysis Univariable meta-regression
SMD [95%CI]^
p
Test for
heterogeneity
(p)
I2,
%*
Test for
heterogeneity by
covariate (p)
Residual
I2, %
**
Birth weight 0·40 94
LBW < 2500g 5 -0·48 [-0·95, -0·02] 0·04 0·01 70
Missing 5 -0·76 [-1·50, -0·02] 0·04 <0·01 93
KMC components
SSC 10 -0·63 [-1·09, -0·16] 0·01 <0·01 89 - -
SSC duration promoted,
hours/day
0·56 94
< 2 5 -0·62 [-1·31, 0·08] 0·14 <0·01 86
2 - < 4 1 -0·78 [-1·44, -0·12] 0·02 - -
Undefined 4 -0·60 [-1·40, 0·19] 0·14 <0·01 94
SSC start time 0·97 95
After other criteria met 2 -0·48 [-0·98, 0·03] 0·06 0·22 33
For a painful procedure 5 -0·96 [-1·66, -0·26] 0·01 <0·01 91
Missing 3 -0·19 [-0·65, 0·26] 0·41 0·10 56
Risk of bias 0·58 95
Low 8 -0·72 [-1·23, -0·20] 0·01 <0·01 90
Unclear 2 -0·24 [-1·31, 0·83] 0·66 0·02 80
KMC: kangaroo mother care, RCT: randomized control trial, WHO: World Health Organization, NMR: neonatal mortality
rate, NICU: neonatal intensive care unit, LBW: low birth weight, BW: birth weight, SSC: skin-to-skin contact, EBF: exclusive
breastfeeding, DC: early hospital discharge, FU: follow-up after discharge
^ Standardized mean difference - random effects estimates
* I-squared: variation in risk ratio or mean difference attributable to heterogeneity
** Residual I-squared: percent residual variation due to heterogeneity after adjustment for covariate

128
Supplementary Table 3.11. Risk of bias for randomized control trials (n=55)

129
Supplementary Table 3.11 (Continued)

130
Supplementary Table 3.12. Risk of bias for observational studies (n=69)

131
Supplementary Table 3.12 (Continued)

1
Supplementary Table 3.13. Studies included in kangaroo mother care systematic review and meta-analysis (n=124)
132

2
Supplementary Table 3.13 (Continued)
133

3
134
Supplementary Table 3.13 (Continued)

4
Supplementary Table 3.13 (Continued)
135

5
Supplementary Table 3.13 (Continued)
136

6
Supplementary Table 3.13 (Continued)
137

7
Supplementary Table 3.13 (Continued)
138

8
Supplementary Table 3.13 (Continued)
139

9
Supplementary Table 3.13 (Continued)
140

10
Supplementary Table 3.13 (Continued)
141
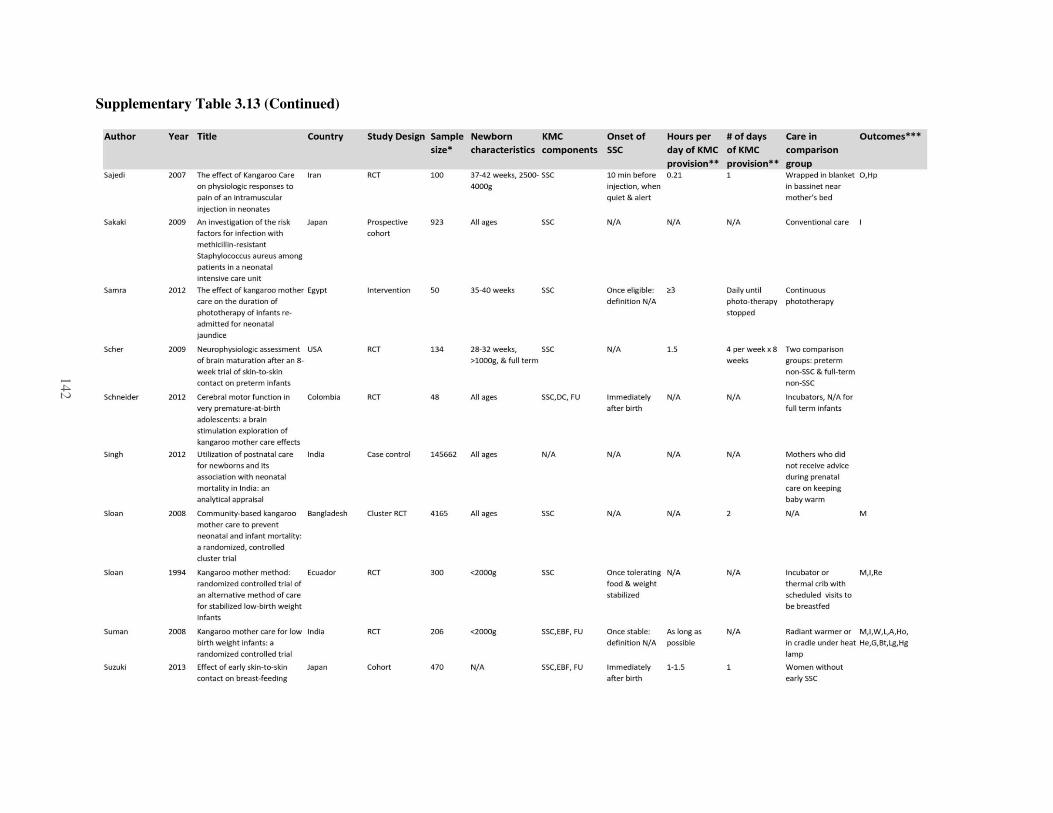
11
Supplementary Table 3.13 (Continued)
142
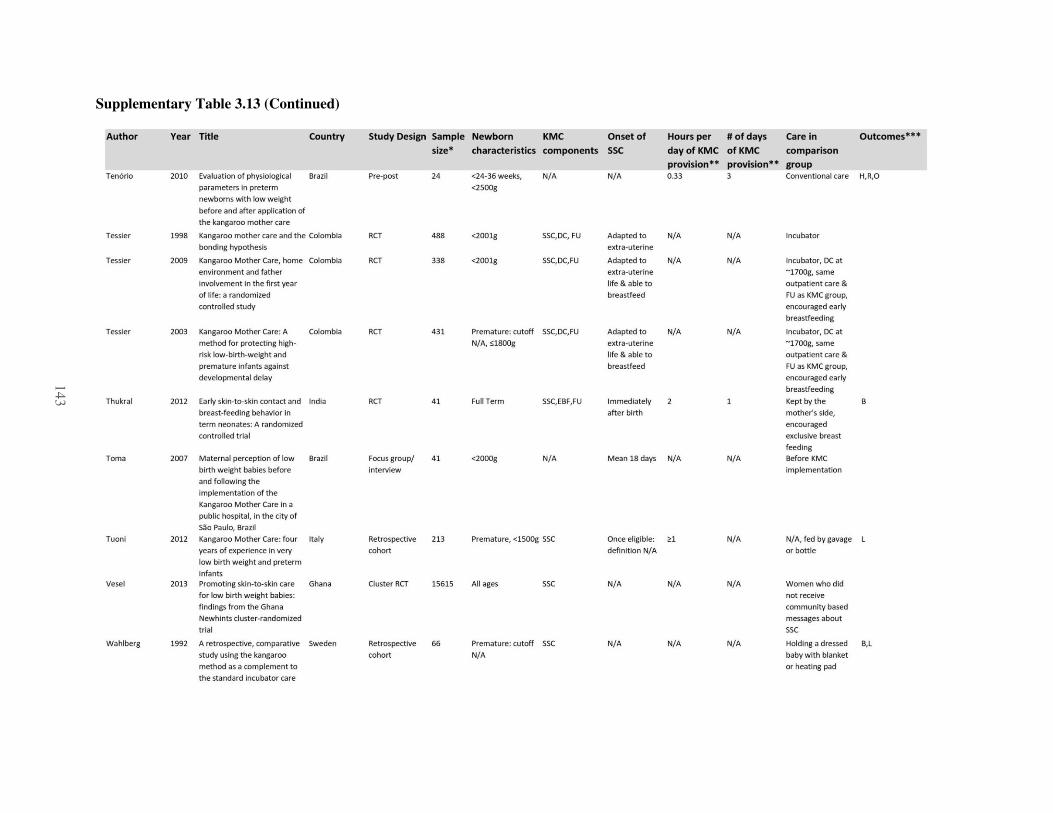
12
Supplementary Table 3.13 (Continued)
143

13
144
Supplementary Table 3.13 (Continued)