Determinants of Capital Structure (An Empirical …...Determinants of Capital Structure (An...
15
© 2016. Rashid Naim Nasim. This is a research/review paper, distributed under the terms of the Creative Commons Attribution- Noncommercial 3.0 Unported License http://creativecommons.org/licenses/by-nc/3.0/), permitting all non-commercial use, distribution, and reproduction in any medium, provided the original work is properly cited. Global Journal of Management and Business Research: C Finance Volume 16 Issue 4 Version 1.0 Year 2016 Type: Double Blind Peer Reviewed International Research Journal Publisher: Global Journals Inc. (USA) Online ISSN: 2249-4588 & Print ISSN: 0975-5853 Determinants of Capital Structure (An Empirical Evidence, US) The University of Lahore, Pakistan Abstract- This paper develops a study on identifying the most significant determinants of capital structure of 15 firms listed on the S&P 500 index, New York Stock Exchange using panel data over 5 years period from 2010 to 2014. Multiple regression analysis has been employed for testing the impact of six independent variables on three dependent variables. The results show that among all the six independent variables that represent profitability, size, growth, tangibility, cost of financial distress and non-debt tax shield effects; tangibility has a significant impact on the three of dependent variables which are total debt ratio, long term debt ratio and short term debt ratio. Thus, profitability, size, growth, tangibility, cost of financial distress and non-debt tax shield effects are the determinants of capital structure for the IT firms in the United States. The study concludes that debt is preferred in the capital structure of firms in the IT sector of the United States. Keywords: total debt ratio (TDR), long-term debt ratio (LTDR), short-term debt ratio (STDR), profitability (PROF), size (size), growth (growth), tangibility (tang), cost of financial distress (EVOL), non-debt tax effects (NDTS). GJMBR - C Classification : JEL Code : F65 DeterminantsofCapitalStructureAnEmpiricalEvidenceUS Strictly as per the compliance and regulations of: By Rashid Naim Nasimi
Transcript of Determinants of Capital Structure (An Empirical …...Determinants of Capital Structure (An...

© 2016. Rashid Naim Nasim. This is a research/review paper, distributed under the terms of the Creative Commons Attribution-Noncommercial 3.0 Unported License http://creativecommons.org/licenses/by-nc/3.0/), permitting all non-commercial use, distribution, and reproduction in any medium, provided the original work is properly cited.
Global Journal of Management and Business Research: C Finance Volume 16 Issue 4 Version 1.0 Year 2016 Type: Double Blind Peer Reviewed International Research Journal Publisher: Global Journals Inc. (USA)
Online ISSN: 2249-4588 & Print ISSN: 0975-5853
Determinants of Capital Structure (An Empirical Evidence, US) The University of Lahore, Pakistan
Abstract- This paper develops a study on identifying the most significant determinants of capital structure of 15 firms listed on the S&P 500 index, New York Stock Exchange using panel data over 5 years period from 2010 to 2014. Multiple regression analysis has been employed for testing the impact of six independent variables on three dependent variables. The results show that among all the six independent variables that represent profitability, size, growth, tangibility, cost of financial distress and non-debt tax shield effects; tangibility has a significant impact on the three of dependent variables which are total debt ratio, long term debt ratio and short term debt ratio. Thus, profitability, size, growth, tangibility, cost of financial distress and non-debt tax shield effects are the determinants of capital structure for the IT firms in the United States. The study concludes that debt is preferred in the capital structure of firms in the IT sector of the United States.
Keywords: total debt ratio (TDR), long-term debt ratio (LTDR), short-term debt ratio (STDR), profitability (PROF), size (size), growth (growth), tangibility (tang), cost of financial distress (EVOL), non-debt tax effects (NDTS).
GJMBR - C Classification : JEL Code : F65
DeterminantsofCapitalStructureAnEmpiricalEvidenceUS
Strictly as per the compliance and regulations of:
By Rashid Naim Nasimi
Determinants of Capital Structure (An Empirical Evidence, US)
Rashid Naim Nasimi
© 20 16 Global Journals Inc. (US)
29
Globa
l Jo
urna
l of M
anag
emen
t an
d Bu
siness Resea
rch
Volum
e XVI Issu
e IV
Ver
sion
IYe
ar
()
2016
C
Abstract- This paper develops a study on identifying the most significant determinants of capital structure of 15 firms listed on the S&P 500 index, New York Stock Exchange using panel data over 5 years period from 2010 to 2014. Multiple regression analysis has been employed for testing the impact of six independent variables on three dependent variables. The results show that among all the six independent variables that represent profitability, size, growth, tangibility, cost of financial distress and non-debt tax shield effects; tangibility has a significant impact on the three of dependent variables which are total debt ratio, long term debt ratio and short term debt ratio. Thus, profitability, size, growth, tangibility, cost of financial distress and non-debt tax shield effects are the determinants of capital structure for the IT firms in the United States. The study concludes that debt is preferred in the capital structure of firms in the IT sector of the United States.Keywords: total debt ratio (TDR), long-term debt ratio (LTDR), short-term debt ratio (STDR), profitability (PROF), size (size), growth (growth), tangibility (tang), cost of financial distress (EVOL), non-debt tax effects (NDTS).
I. Introduction
a) Introductionhe financial structure is said to be the relative proportion of funds from various sources used in a business. The part of the financial structure which
refers to the proportion of different long-term financing sources is termed as Capital structure. It deals with making a proper array of the various sources of the funds in the relative proportion and magnitude. The capital structure of a company is made up of debt and equity securities that comprise a firm’s financing of its assets. It is the permanent source of financing for a firm which is represented by long-term debt, preferred stock and net worth.Thus, it shows the capital arrangement which excludes short-term borrowings. Furthermore, it represents the degree of permanency as it excludes short-term sources of financing.
Author: Lahore School of Accountancy and Finance, The University of Lahore – Islamabad Campus Pakistan. e-mail: [email protected]
In this modern era, the capital structure choice is one of the most important decisions made by financial managers. The choice of capital structure is at the center of many other decisions in the area of corporate finance. One of the major objectives of a corporate financial manager is to ensure a low cost of capital and thus maximization of shareholders’ wealth. Hence, capital structure is one of the effective tool to manage the cost of capital. A minimal cost of capital is the indications of an optimal capital structure. However, what are the key potential determinants of such optimal capital structure choice? This question has been answered in this paper for the US firms listed on the New York Stock Exchange (S&P 500 index).
b) Objectives of the studyThe objective of the study is to empirically
investigate the determinants of capital structure (.i.e. to identify the factors to be considered prior making financing decisions) of US companies using firm specific panel data. The sample in the study comprises of 15 firms that are listed on New York Stock Exchange (S&P 500 index).
The impact of independent variables on the dependent variables of the study would be better investigated by breaking the objectives across various models. Considering the three dependent variables (short term debt, long term debt and total debt) and all the 6 independent variables (profitability, size, growth, tangibility, cost of financial distress and tax shield effects), the objective of the study has been divided into three models as under:
Model 1: American companies and total debt: To investigate the impact of independent1
c) Significance of the study
variables while raising total debt.
Model 2: American companies and long term debt: To investigate the impact of independent variables while raising long term debt.
Model 3: American companies and short term debt: To investigate the impact of independent variables while raising short term debt.
Assessing the factors that determines the capital structure choice will advantage the concerned
1 Independent Variables: The independent variables of the study are Profitability, Size, Growth, Tangibility, EVOL and NDTS
T
The question arises: What should be the appropriate proportion between owned and debt capital? It depends on the financial policy of individual firms. The debt capital may be nil in a company while it may be greater than owned capital in another company. The proportion between the two, usually expressed in terms of a ratio which represents the capital structure of a company.
30
Globa
l Jo
urna
l of M
anag
emen
t an
d Bu
siness Resea
rch
Volum
e XVI Issu
e IV
Ver
sion
IYe
ar
()
2016
© 2016 Global Journals Inc. (US)1
C
parties to innovate actions which fortifies their competitive position in the industry. This study, apart from being a step for the researcher’s educational career, has the following significance:
Firstly, it will have immense importance to external investors in making well-informed decisions by considering the financing patterns of the service sector in United States.
Secondly, even though there are plenty of studies on the area of capital structure, this study can contribute to the literature as a reference point by providing the picture of firm-level factors that determine capital structure choice of United States.
II. Literature Review
a) Literature ReviewThe debate on determining an optimal capital
structure and firms’ value can be traced back to Modigliani and Miller (1958) who constructed a mathematical model to attempt to provide a basis for making finance decisions. Their research was based on the assumption of no taxes (either personal or corporate). In their research they concluded that the firms’ value is self-determining of capital structure and that the total market value of an unlevered firm is equal to that of a levered firm. In their subsequent research Modigliani and Miller (1963) they considered no tax assumption to be unrealistic and took tax into consideration. They concluded that a levered firm has a higher market value than an unlevered firm because of tax shield on debt, and that this extra value was equal to the present value of the tax shield. Later Modigliani and Miller (1977) modified their research of 1963 by incorporating the effect of personal taxes in their study. Personal taxes were classified into two categories which are tax on income from holdings shares and tax on income from debt securities. In their research they analyzed certain special cases where the gain from leverage resulted zero, allowing the original (1958) result. Thus the results signify the existence of an optimal capital structure at the macro level and not at the micro level.
In their paper Myers and Majluf (1984) developed a model under the assumption that the management have more knowledge of the business than the investors. The model suggests that to undertake the valuable investment opportunity, a firm should rely on the internal sources of funds rather than the external source of finance. Once the internal source of finance is exhausted, the firm should go to the bond markets for the external capital alternative to financing by equity due to the asymmetry of information.
i. Determinants of Capital structure in Developed Countries
Titman and Wessels (1988) analyzed the explanatory power of recent theories of optimal capital
structure. The study analyzed the measure of short-term debt, long-term debt and convertible debt as dependent variables. The attributes suggested by different capital structure theories which may affect the firm’s debt to equity choice such as asset structure, non-debt tax shields, growth, uniqueness, industry classification, size, earnings volatility, and profitability has been used as explanatory variables of the study. It is found that level of leverage increased with non-debt tax shields, fixed assets, size of the firm, and growth opportunities; and decreased with profitability, research and development expenditures, advertising expenditures, uniqueness of the product, and volatility.
Rajan and Zingales (1995) applied the capital structure models which are derived from a U.S. setting to firms in the G-7 countries (namely United States, Japan, Germany, France, Italy, United Kingdom and Canada). The study analyzed the financing decisions of public firms in the major of the industrialized countries. The study analysis is concentrated on the period from 1987 to 1991. The study examined the correlation of the leverage with tangibility, market to book ratio, size and profitability. From the results, it is found that the variables that were found to have a correlation with leverage in the United States were also correlated with firms’ leverage in G-7 countries.
ii. Determinants of Capital structure in Developing Countries
The assessment for the portability of capital structure theory across countries with distinct institutional structure Booth et la. (2001) provided the first empirical study to test the capital structure models in developing countries. The financial structures of firms’ from 10 developing countries (namely India, Pakistan, Thailand, Malaysia, Turkey, Zimbabwe, Mexico, Brazil, Jordan and Korea) has been used for the study. For comparison, the study also included the G-7 economies (United States, Germany, Canada, Italy, France, Japan, and United Kingdom) which are reported in Rajan and Zingales (1995). The study provided that the variables which affects the capital choice decisions in developing countries were same as they were in developed countries. However, the persistent difference across the countries were due to the country specific factors.
Chen (2004) used the firm level panel data to explore the determinants of the capital structure of Chinese listed companies. The study interpreted that neither trade-off model nor the pecking order has convincing explanation for the capital choice of the Chinese firms. Chinese firms follow “new pecking order” – retained profits, equity finance and long term debt finance; therefore the study concluded that Chinese firms have substantial lower amount of long term debt and prefer short term finance.
Acaravci (2015) investigated the determinants of capital structure for the firms listed on Istanbul Stock
Determinants of Capital Structure (An Empirical Evidence, US)

© 20 16 Global Journals Inc. (US)
31
Globa
l Jo
urna
l of M
anag
emen
t an
d Bu
siness Resea
rch
Volum
e XVI Issu
e IV
Ver
sion
IYe
ar
()
2016
C
Exchange in Turkey. The results interpreted that growth opportunities have effect on leverage which supports the trade-off theory; size, profitability and tangibility have effect on leverage and supports pecking order theory. The paper concluded that the five potential determinants of capital structure for Turkish manufacturing firms are growth opportunities, size, profitability, tangibility and non-debt tax shields.
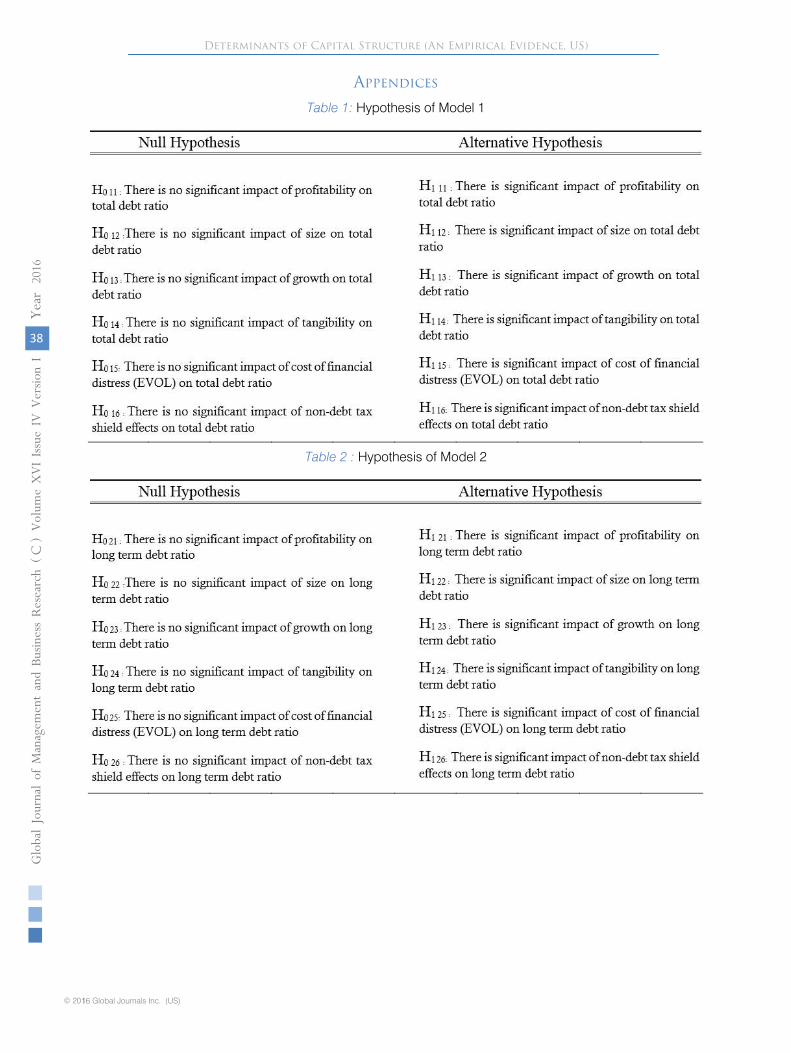
b) Hypothesis of the StudyBased on above literature review, the
researcher formulates the following hypothesis.
Model 1:
H0 : There is no significant impact of Independent Variables2
The hypothesis for each of the three models has been described in
on Total Debt.
H1: There is significant impact of Independent Variables on Total Debt.
Model 2:
H0: There is no significant impact of Independent Variables on Long Term Debt.
H1: There is significant impact of Independent Variables on Long Term Debt.
Model 3:
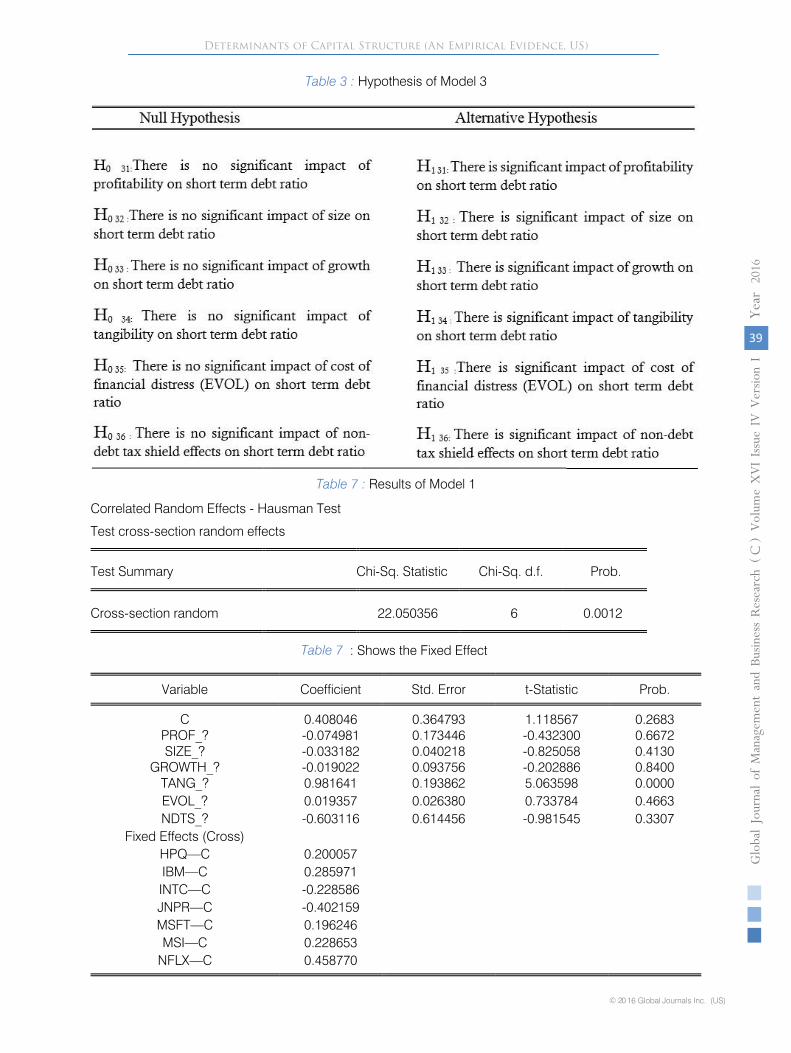
H0: There is no significant impact of Independent Variables on Short Term Debt.
Table 1,Table 2 and Table 3.
III. Research Methodology
a) Sample Set The current study on “Determinants of Capital
Structure, An Empirical Evidence from US” comprises a sample data collected from the New York Stock Exchange (NYSE) and the targeted Index of the study is Standard and Poor’s 500 (S&P 500). The panel data of the study is collected on the annual basis over a time period of 5 years (i.e. 2010 – 2014) from the Financial Statements (namely Income Statement and Balance Sheet) of the firms. The sample set of the study consists of 15 firms from the “Information Technology” sector which are listed on S&P 500.
b) Theoretical FrameworkThe study consists of following set of nine
variables to explore the determinants of the capital structure. The study consists of three dependent variables which are followed from the dependent variables of an existing literature (Handoo& Sharma, 2014) [173]; while the six independent variables are followed from the independent variables of existing literatures of (Chen, 2004) [1344]; (Handoo& Sharma, 2014) [173]. In the study, E-views 8 has been employed to test the hypothesis.
2 Independent Variables : The independent variables of the this study .i.e. PROF, SIZE, GROWTH, TANG, EVOL, NDTS
Determinants of Capital Structure (An Empirical Evidence, US)
H1: There is significant impact of Independent Variables on Short Term Debt.
Figure 1 : Show the Theoretical Framework of the Study

32
Globa
l Jo
urna
l of M
anag
emen
t an
d Bu
siness Resea
rch
Volum
e XVI Issu
e IV
Ver
sion
IYe
ar
()
2016
© 2016 Global Journals Inc. (US)1
C
i. Dependent variablesTotal debt ratio (TDR): The total debt ratio is a financial ratio which is expressed as percentage of a company’s assets that are provided in comparison to debt. It is calculated by dividing total debt to total assets.Long term debt ratio (LTDR): The long term debt ratio indicates the portion of a company’s total assets which are financed from long term debt. This value differs from industry to industry and company to company. Long term debt ratio is computed by dividing long term debt to total assets.Short term debt ratio (STDR): The short term debt is the current liabilities of a company shown on the balance sheet. This account is comprised of debts or repayments which are incurred by a company that is due in one year. The short term debt ratio is the calculated by dividing debt payables which are due within one year to total assets. Thus the ratio shows the capacity of a firm whether it is able to fulfill its immediate financial obligations or not. ii. Independent variables
is reflected to be lower in the larger size firms. The study uses the measure of a firm’s size by the taking natural logarithm of its total assets. (Handoo & Sharma, 2014) [173]
Growth (GROWTH): Those firms which possess growth opportunities have a comparatively higher capacity for expansions of project, development of new products, and acquisitions than the firm which do not possess growth opportunities. The growth factor is measured by the percentage change of sales. (Chen, 2004) [1344]
Assets tangibility (TANG): All those tangible assets which possess some degree of debt capacity are referred to as asset tangibility. Tangible assets comprise of land and building, plant and machinery and equipment. In this study, the formula used to measure the value of assets tangibility of the firms is the ratio of net fixed assets to total assets. (Handoo & Sharma, 2014) [173]
Cost of Financial distress (EVOL): Financial distress refers to the condition where a company has difficulties in the fulfillment of its financial obligations. The firms’ cost of financial distress increases with revenues that are sensitive to economic declines, higher fixed costs or illiquid assets. Earning volatility is the absolute value of percentage change in an operating income which is used as a measure for cost of financial distress in the study. (Chen, 2004) [1344]
Tax Shield effects (NDTS): Non-debt tax shields—ratio of depreciation & amortization to total assets (as depreciation & amortization is the most significant element among non-debt tax shield). (Chen, 2004) [1344]
Variables Measurement
Dependent variables
Total Debt Ratio (TDR) Ratio of book value of total debt to total assetsLong-term Debt Ratio (LTDR)Short-term Debt Ratio(STDR)
Ratio of book value of long term debt to total assetsRatio of book value of short term debt to total assets
Independent variables
Profitability (PROF)Ratio of earnings before interest, tax and depreciation and amortization (EBITDA) to total assets
Size (SIZE) Logarithm of total assets
Growth opportunities (GROWTH) Sales growth
Asset Tangibility (TANG) Tangibility - ratio of tangible assets (the sum of fixed assets) to total assets
Cost of financial distress (EVOL) Earning volatility - absolute value of percentage change in operating income
Tax shields effects (NDTS) Non-debt tax shields—ratio of depreciation and amortization to total assets (due to depreciation is the most significant element among non-debt tax shield)
Determinants of Capital Structure (An Empirical Evidence, US)
Profitability (PROF): Profitability is the primary goal of firms that is realized when the total amount of revenues attained from a business activity exceeds the expenditure, costs, and taxes. Operating profit rate of return (earnings before interest, taxes and depreciation and amortization (EBITDA) to total assets) is used as a measure of profitability. (Chen, 2004) [1344]Size (SIZE): Firms with larger size are more diversified and have stable cash flows; as a result the large size firms have a smaller probability of defaults than the smaller size firms. Thus, the cost of financial distress risk
Table 4 : Measurement of variables
© 20 16 Global Journals Inc. (US)
33
Globa
l Jo
urna
l of M
anag
emen
t an
d Bu
siness Resea
rch
Volum
e XVI Issu
e IV
Ver
sion
IYe
ar
()
2016
C
c) Regression ModelsRegression analysis is statistical process to
estimate the relationship among variables. In the current
study, multiple regression analysis is employed to examine the relationship between the firm capital structure and the explanatory variables.
Where
TDR = Total Debt RatioLTDR = Long Term Debt RatioSTDR = Short Term Debt RatioPORF = ProfitabilitySIZE = SizeGROWTH = GrowthTANG = Asset TangibilityEVOL = Earning Volatility (Cost of Financial Distress)NDTS = Non-debt Tax Shield Effects
ε = an error term.
IV. Results and Discussions
a) Descriptive StatisticsThe descriptive analysis of variables for the
sample in terms of mean, median, maximum, minimum, standard deviation, skewness and kurtosis is made to see the variation in data for Information and Technology Sector of United States.
TDR LTDR STDR PROF SIZE GROWTH TANG EVOL NDTS
Mean 0.545288 0.279536 0.265761 0.188009 9.661988 0.031955 0.514285 0.250741 0.061583
Median 0.474876 0.278315 0.262703 0.192027 9.447702 0.000000 0.540077 0.117700 0.038991
Maximum 1.409745 0.692349 0.891415 0.637474 12.07951 0.481800 0.843463 3.567700 0.428931
Minimum 0.099443 0.017989 0.073095 -0.080687 6.889591 -0.574600 0.108838 0.000000 0.009796
Std. Dev. 0.277655 0.160186 0.150812 0.116095 1.446829 0.134637 0.147015 0.461458 0.086430
Skewness 0.471981 0.263356 1.423220 0.960411 0.089573 -0.636223 -0.407903 5.245774 3.387273
Kurtosis 2.872259 2.460432 6.389096 5.466206 1.893202 9.047132 2.825432 37.01894 13.37170
Jarque-Bera 2.835567 1.776746 61.21310 30.53666 3.928423 119.3342 2.175046 3960.503 479.5834
Probability 0.242250 0.411324 0.000000 0.000000 0.140266 0.000000 0.337050 0.000000 0.000000
Sum 40.89662 20.96520 19.93207 14.10066 724.6491 2.396600 38.57137 18.80560 4.618715Sum Sq. Dev. 5.704847 1.898814 1.683073 0.997367 154.9051 1.341406 1.599390 15.75782 0.552791
Observation 75 75 75 75 75 75 75 75 75
The above table shows that the highest mean value of size 9.66 while the non-debt tax shield effects (NDTS) has 0.061583 which is the lowest value. The size has highest value of standard deviation which is 1.446829 whereas the non-debt tax shield effects has the lowest value of standard deviation of 0.086430. The earning volatility (EVOL) has the highest value of kurtosis of 37.01894 while size has the lowest value of kurtosis of 1.893202.
b) Correlation AnalysisCorrelation means the relationship between two
variables. The correlation shows two things, first it shows the direction between two variables and secondly it shows the strength of associations between two variables. The below table shows the values of correlation among the variable
Determinants of Capital Structure (An Empirical Evidence, US)
TDR = β0 + β 1PROF+ β 2SIZE+ β 3GROWTH + β 4TANG+ β 5EVOL+ β 6NDTS + ε (1)
LTDR = β0 + β 1PROF+ β 2SIZE+ β 3GROWTH + β 4TANG+ β 5EVOL+ β 6NDTS + ε (2)
STDR = β0 + β 1PROF+ β 2SIZE+ β 3GROWTH + β 4TANG+ β 5EVOL+ β 6NDTS + ε (3)
β0 =Coefficient of intercept (constant)β1- β6 = Coefficient of Slope
Table 5 : Shows the descriptive statistics
34
Globa
l Jo
urna
l of M
anag
emen
t an
d Bu
siness Resea
rch
Volum
e XVI Issu
e IV
Ver
sion
IYe
ar
()
2016
© 2016 Global Journals Inc. (US)1
Determinants of Capital Structure (An Empirical Evidence, Us)C
TDR LTDR STDR PROF SIZE GROWTH TANG EVOL NDTS
TDR 1.000000LTDR 0.899505 1.000000STDR 0.885735 0.593913 1.000000PROF 0.118504 0.009029 0.208640 1.000000SIZE 0.031437 0.114076 -0.063373 -0.227565 1.000000GROWTH -0.038453 -0.116147 0.052642 0.471752 -0.269473 1.000000TANG -0.441636 -0.296840 -0.497857 -0.279015 0.300555 -0.104628 1.000000EVOL -0.001658 0.024529 -0.029101 0.284043 -0.161491 0.324673 0.008432 1.000000NDTS 0.142156 0.081362 0.175277 0.707812 -0.215951 0.341420 -0.102734 0.539787 1.000000
The above table shows that the highest positive correlation is observed between total debt ratio and long term debt ratio, the correlation value of total debt ratio and long term debt ratio is 0.899505, which means that 89.95% positive correlation is present between TDR and LTDR. PROF, SIZE and NDTS are positively correlated with Total Debt Ratio, whereas GRWOTH, TANG and EVOL is negatively correlated with total debt ratio. PROF, SIZE, EVOL and NDTS are positively correlated with Long-Term debt ratio, while GROWTH and TANG are negatively correlated. PROF, GRWOTH and NDTS are positively correlated with Short-Term debt ratio, while SIZE, TANG and EVOL are negatively correlated.
TDR, LTDR and STDR are positively correlated with each other. PRFO has a positive correlation with GROWTH, EVOL and NDTS while negatively correlated with SIZE and TANG. SIZE is positively correlated with TANG and negatively correlated with GROWTH, EVOL and NDTS. GROWTH has a positive correlation with EVOL and NDTS and a negative correlation with TANG. TANG is positively correlated with EVOL and negatively correlated with NDTS. There exists a positive correlation between EVOL and NDTS.
c) Regression AnalysisPanel regression comprises of three effects
namely Common Effect, Fixed Effect and Random Effect. Selection of an appropriate effect for the panel data has been based on Likelihood Ratio and Hausman Test for each individual model of the study.
i. Model 1: American companies and Total DebtFrom the results of Likelihood Ratio (Cross
section F with P-value of 0.000) and Hausman Test (Cross-section random with P-value of 0.0012) shows that Fixed Effect is the best describe for the Model 1 of the study. Table 7 shows the results of the Fixed Effect.
The coefficient value of profitability is -0.074981, which means that 7.4981 percent negative variation of total debt ratio has been explained by the variation of profitability. The t-statistics of profitability is -0.432300with a p- value of> 0.05 which shows that
debt ratio. If one unit increases in profitability than total debt ratio will decrease at 0.075 units.
The coefficient value of size is -0.033182, which means that 3.3182 percent negative variation of total debt ratio has been explained by the variation of size. The t-statistics of size is -0.825058 with a p- value of > 0.05 which shows that profitability has insignificant negative impact on total debt ratio. If one unit increases in size than total debt ratio will decrease at 0.033 units.
The coefficient value of growth is -0.019022, which means that -1.9022 percent negative variation of total debt ratio has been explained by the variation of growth. The t-statistics of growth is -0.202886 with a p-value of > 0.05 which shows that growth has insignificant negative impact on total debt ratio. If one unit increases in growth than total debt ratio will decrease at 0.019 units.
The coefficient value of tangibility is 0.981641, which means that 98.1641 percent positive variation of total debt ratio has been explained by the variation of tangibility. The t-statistics of tangibility is 5.063598 with a p- value of < 0.05 which shows that tangibility has significant positive impact on total debt ratio. If one unit increases in tangibility than total debt ratio will increase at 0.98 units.
The coefficient value of earning volatility is0.019357, which means that 1.9357 percent positive variation of total debt ratio has been explained by the variation of earning volatility. The t-statistics of earning volatility is 0.733784 with a p- value of > 0.05 which shows that earning volatility has insignificant positive impact on total debt ratio. If one unit increases in earning volatility than total debt ratio will increase at 0.019 units.
The coefficient value of non-debt tax shield effects is -0.603116, which means that 60.3116 percent negative variation of total debt ratio has been explained by the variation of non-debt tax shield effects. The t-statistics of non-debt tax shield effects is -0.981545 with a p- value of > 0.05 which shows that non-debt tax
profitability has insignificant negative impact on total shield effects has insignificant negative impact on total
Table 6 : Shows the correlation analysis

© 20 16 Global Journals Inc. (US)
35
Globa
l Jo
urna
l of M
anag
emen
t an
d Bu
siness Resea
rch
Volum
e XVI Issu
e IV
Ver
sion
IYe
ar
()
2016
C
debt ratio. If one unit increases in non-debt tax shield effects than total debt ratio will decrease at 0.603 units.
All 15 firms have a common coefficient of 0.408046. The value of R-squared is 0.951567 which represents that 95.16% variation of total debt ratio has been explained by the variation of 6 independent variables which are profitability, size, growth, tangibility, cost of financial distress and non-debt tax shield effects.
The value of AdjR2 is 0.933629, which shows that if the researcher incorporates more relevant variables than it will adjust R2 at the rate of 93.36 percent. The p-value of F-statistic is 0.0000 (i.e. significant value) which shows that the model is best fitted for the study. ii. Model 2: American companies and Long Term Debt
From the results of Likelihood Ratio (Cross section F with Prob. of 0.000) and Hausman Test (Cross-section random with Prob. of 0.0316) shows that Fixed Effect is the best describe for the Model 2 of the study. Table 8 shows the results of Fixed Effect.
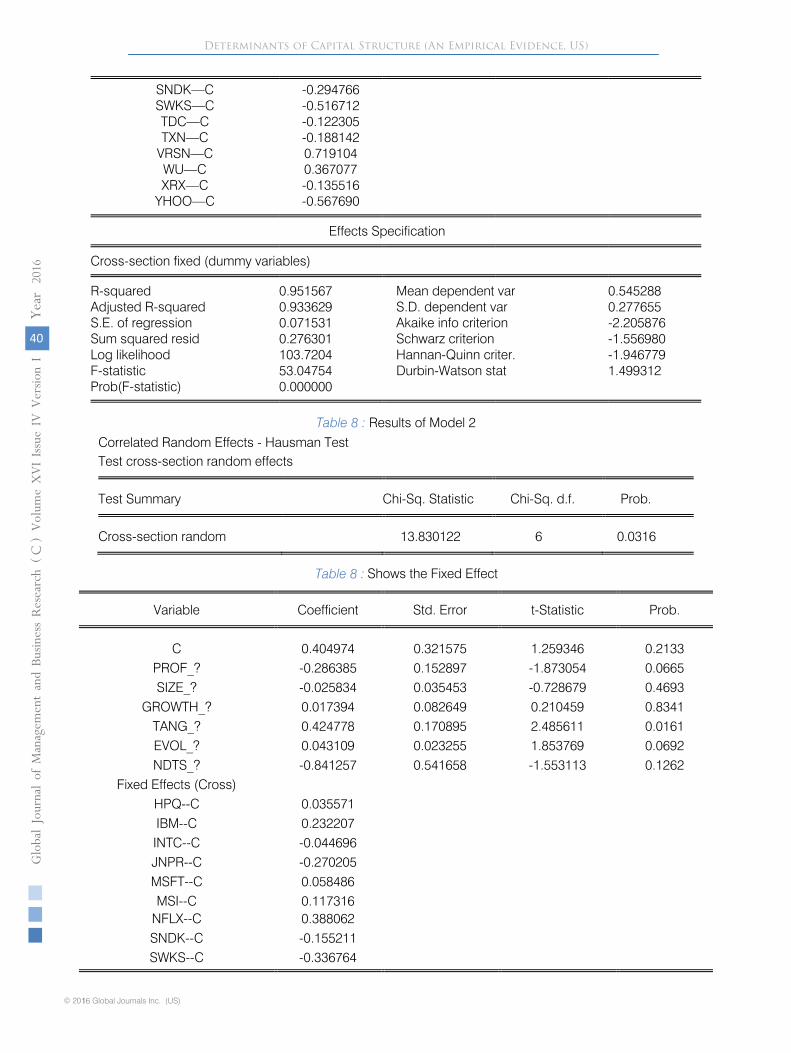
The coefficient value of profitability is -0.286385, which means that 28.6385 percent negative variation of long term debt ratio has been explained by the variation of profitability. The t-statistics of profitability is -1.873054 with a p- value of > 0.05 which shows that profitability has insignificant negative impact on long term debt ratio. If one unit increases in profitability than long term debt ratio will decrease at 0.286 units.
The coefficient value of size is -0.025834, which means that 2.5834 percent negative variation of long term debt ratio has been explained by the variation of size. The t-statistics of size is -0.728679 with a p- value of > 0.05 which shows that profitability has insignificant negative impact on long term debt ratio. If one unit increases in size than long term debt ratio will decrease at 0.026 units.
The coefficient value of growth is 0.017394, which means that 1.7394 percent positive variation of long term debt ratio has been explained by the variation of growth. The t-statistics of growth is0.210459 with a p-value of > 0.05 which shows that growth has insignificant positive impact on long term debt ratio. If one unit increases in growth than long term debt ratio will increase at 0.017 units.
The coefficient value of tangibility is 0.424778, which means that 42.4778percent positive variation of long term debt ratio has been explained by the variation of tangibility. The t-statistics of tangibility is 2.485611 with a p- value of < 0.05 which shows that tangibility has significant positive impact on long term debt ratio. If one unit increases in tangibility than long term debt ratio will increase at 0.425 units.
The coefficient value of earning volatility is 0.043109, which means that 4.3109 percent positive variation of long term debt ratio has been explained by the variation of earning volatility. The t-statistics of
earning volatility is 1.853769 with a p- value of > 0.05 which shows that earning volatility has insignificant positive impact on long term debt ratio. If one unit increases in earning volatility than long term debt ratio will increase at 0.043 units.
The coefficient value of non-debt tax shield effects is -0.841257, which means that 84.1257percent negative variation of long term debt ratio has been explained by the variation of non-debt tax shield effects. The t-statistics of non-debt tax shield effects is -1.553113 with a p- value of > 0.05 which shows that non-debt tax shield effects has insignificant negative impact on long term debt ratio. If one unit increases in non-debt tax shield effects than long term debt ratio will decrease at 0.841 units.
All 15 firms have a common coefficient of 0.404974. The value of R-squared is 0.886924 which represents that 88.69% variation of long term debt ratio has been explained by the variation of 6 independent variables which are profitability, size, growth, tangibility, cost of financial distress and non-debt tax shield effects. The value of AdjR2 is 0.845044, which shows that if the researcher incorporates more relevant variables than it will adjust R2 at the rate of 84.50percent. The p-value of F-statistic is 0.0000 (i.e. significant value) which shows that the model is best fitted for the study.
iii. Model 3: American companies and Short Term DebtFrom the results of Likelihood Ratio (Cross
section F with Prob. of 0.000) and Hausman Test (Cross-section random with Prob. of 0.0009) displayed below shows that Fixed Effect is the best describe for the Model 3 of the study. Table 9 shows the results of Fixed Effects.
The coefficient value of profitability is 0.211674, which means that 21.1674 percent positive variation of short term debt ratio has been explained by the variation of profitability. The t-statistics of profitability is 1.177483 with a p- value of > 0.05 which shows that profitability has insignificant positive impact on short term debt ratio. If one unit increases in profitability than short term debt ratio will increase at 0.212 units.
The coefficient value of size is -0.007320, which means that -0.7320 percent negative variation of short term debt ratio has been explained by the variation of size. The t-statistics of size is -0.175595 with a p- value of > 0.05 which shows that profitability has insignificant negative impact on short term debt ratio. If one unit increases in size than short term debt ratio will decrease at 0.007 units.
The coefficient value of growth is -0.036421, which means that 3.6421 percent negative variation of short term debt ratio has been explained by the variation of growth. The t-statistics of growth is -0.374798 with a p-value of > 0.05 which shows that growth has insignificant negative impact on short term debt ratio. If
Determinants of Capital Structure (An Empirical Evidence, US)
36
Globa
l Jo
urna
l of M
anag
emen
t an
d Bu
siness Resea
rch
Volum
e XVI Issu
e IV
Ver
sion
IYe
ar
()
2016
© 2016 Global Journals Inc. (US)1
CDeterminants of Capital Structure (An Empirical Evidence, US)
one unit increases in growth than short term debt ratio will decrease at 0.036 units.
The coefficient value of tangibility is 0.556963, which means that 55.6963 percent positive variation of short term debt ratio has been explained by the variation of tangibility. The t-statistics of tangibility is 2.771940 with a p- value of < 0.05 which shows that tangibility has significant positive impact on short term debt ratio. If one unit increases in tangibility than short term debt ratio will increase at 0.557 units.
The coefficient value of earning volatility is -0.023757, which means that 2.3757 percent negative variation of short term debt ratio has been explained by the variation of earning volatility. The t-statistics of earning volatility is -0.868873 with a p- value of > 0.05 which shows that earning volatility has insignificant negative impact on short term debt ratio. If one unit increases in earning volatility than short term debt ratio will decrease at 0.024 units.
The coefficient value of non-debt tax shield effects is 0.238048, which means that 23.8048 percent positive variation of short term debt ratio has been explained by the variation of non-debt tax shield effects. The t-statistics of non-debt tax shield effects is 0.373788 with a p- value of > 0.05 which shows that non-debt tax shield effects has insignificant positive impact on short term debt ratio. If one unit increases in non-debt tax shield effects than short term debt ratio will increase at 0.238 units.
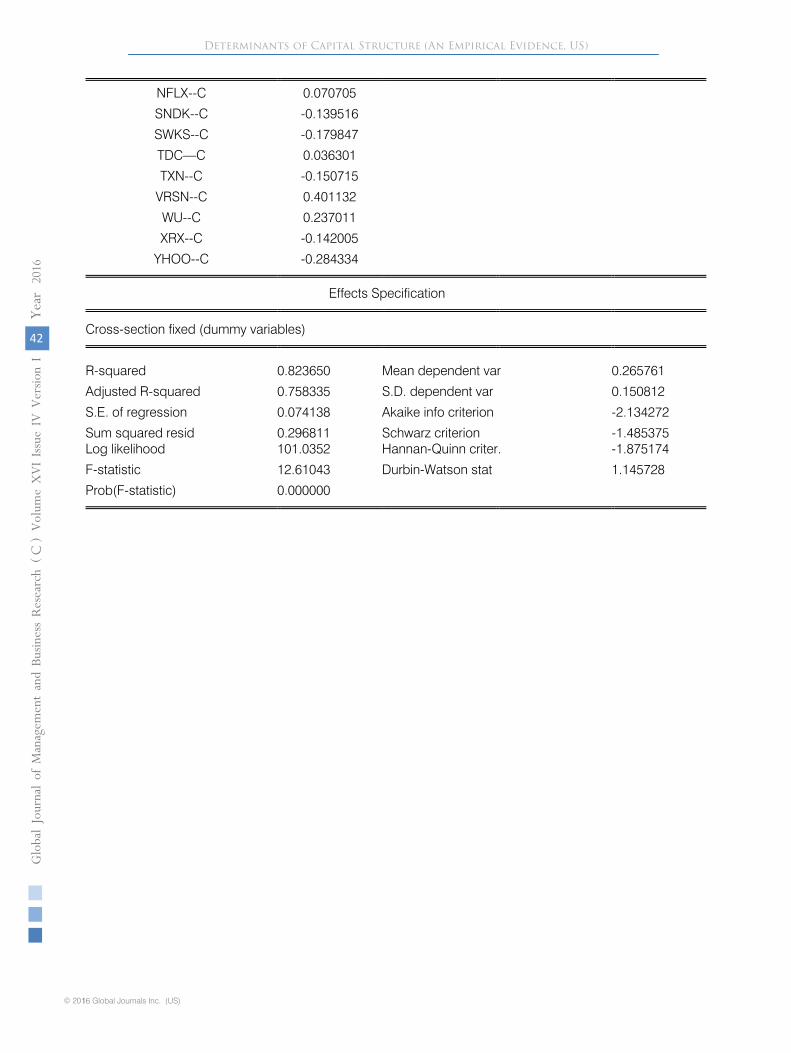
All 15 firms have a common coefficient of 0.002709. The value of R-squared is 0.823650 which represents that 82.37% variation of short term debt ratio has been explained by the variation of 6 independent variables which are profitability, size, growth, tangibility, cost of financial distress and non-debt tax shield effects.The value of AdjR2 is 0.758335, which shows that if the researcher incorporates more relevant variables than it will adjust R2 at the rate of 75.83 percent. The p-value of F-statistic is 0.0000 (i.e. significant value) which shows that the model is best fitted for the study.
V. Conclusion and Recommendation
a) ConclusionThe results of the study provides a better
understanding the financial behavior of US IT firms during the period of 2010 to 2014. The relationship between total debt, long-term debt and short-term debt and 6 independent variables that represents profitability, size, growth, asset tangibility, cost of financial distress (EVOL) and non-debt tax shield effects was tested to identify the variable which explained the capital structure of US firm more appropriately. Results show that among all the 6 independent variables, TANG has a positive significant impact on the total debt ratio, long term debt ratio and short term debt ratio; and overall the other independent variables have insignificant impact on the total debt ratio, long term debt ratio and short term debt ratio.
The study concludes that profitability, size, growth, tangibility, cost of financial distress and non-debt tax shield effects are the determinants of capital structure in the IT sector of S&P 500 index. Among all the independent variables of the study, Tangibility best describe the capital structure of the IT firms listed on the New York Stock Exchange “S&P 500 index“ . The results reveal that firms with higher tangibility prefers higher debt capital structure in their total capital structure.
d) Summary of Hypothesis testingBased on above results, the following
hypothesis are accepted or rejected.Model 1H1 11: There is significant impact of profitability on total debt ratio [Rejected].H1 12: There is significant impact of size on total debt ratio [Rejected].H1 13: There is significant impact of growth on total debt ratio [Rejected].H1 14: There is significant impact of tangibility on total debt ratio [Accepted].H1 15: There is significant impact of cost of financial distress on total debt ratio [Rejected].H1 16: There is significant impact of non-debt tax shield effects on total debt ratio [Rejected].
Model 2H1 21: There is significant impact of profitability on long term debt ratio [Rejected].H1 22: There is significant impact of size on long term debt ratio [Rejected].H1 23: There is significant impact of growth on long term debt ratio [Rejected].H1 24: There is significant impact of tangibility on long term debt ratio [Accepted].H1 25: There is significant impact of cost of financial distress on long term debt ratio [Rejected].H1 26: There is significant impact of non-debt tax shield effects on long term debt ratio [Rejected].Model 3H1 31: There is significant impact of profitability on short term debt ratio [Rejected].H1 32: There is significant impact of size on short term debt ratio [Rejected].H1 33: There is significant impact of growth on short term debt ratio [Rejected].H1 34: There is significant impact of tangibility on short term debt ratio [Accepted].H1 35: There is significant impact of cost of financial distress on short term debt ratio [Rejected].H1 36: There is significant impact of non-debt tax shield effects on short term debt ratio [Rejected].
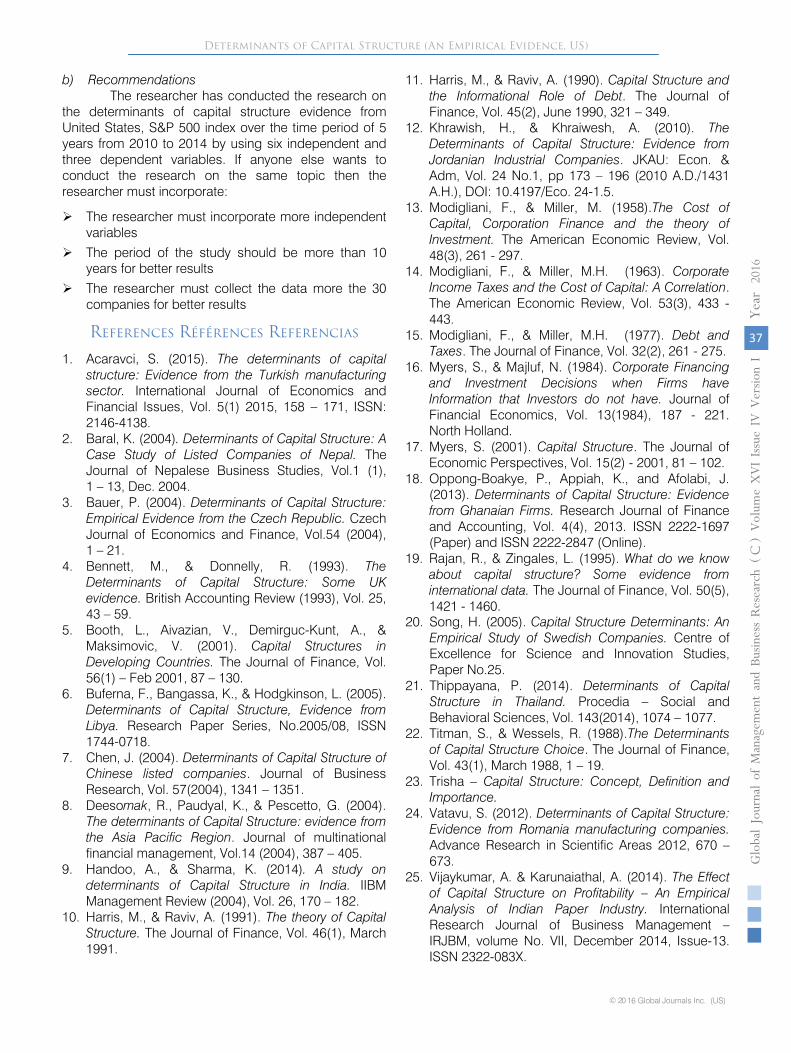
b) Recommendations The researcher has conducted the research on
the determinants of capital structure evidence from United States, S&P 500 index over the time period of 5 years from 2010 to 2014 by using six independent and three dependent variables. If anyone else wants to conduct the research on the same topic then the researcher must incorporate:
The researcher must incorporate more independent variables
The period of the study should be more than 10 years for better results
The researcher must collect the data more the 30 companies for better results
References Références Referencias
1. Acaravci, S. (2015). The determinants of capital structure: Evidence from the Turkish manufacturing sector. International Journal of Economics and Financial Issues, Vol. 5(1) 2015, 158 – 171, ISSN: 2146-4138.
2. Baral, K. (2004). Determinants of Capital Structure: A Case Study of Listed Companies of Nepal. The Journal of Nepalese Business Studies, Vol.1 (1), 1 – 13, Dec. 2004.
3. Bauer, P. (2004). Determinants of Capital Structure: Empirical Evidence from the Czech Republic. Czech Journal of Economics and Finance, Vol.54 (2004), 1 – 21.
4. Bennett, M., & Donnelly, R. (1993). The Determinants of Capital Structure: Some UK evidence. British Accounting Review (1993), Vol. 25, 43 – 59.
5. Booth, L., Aivazian, V., Demirguc-Kunt, A., & Maksimovic, V. (2001). Capital Structures in Developing Countries. The Journal of Finance, Vol. 56(1) – Feb 2001, 87 – 130.
6. Buferna, F., Bangassa, K., & Hodgkinson, L. (2005). Determinants of Capital Structure, Evidence from Libya. Research Paper Series, No.2005/08, ISSN 1744-0718.
7. Chen, J. (2004). Determinants of Capital Structure of Chinese listed companies. Journal of Business Research, Vol. 57(2004), 1341 – 1351.
8. Deesomak, R., Paudyal, K., & Pescetto, G. (2004). The determinants of Capital Structure: evidence from the Asia Pacific Region. Journal of multinational financial management, Vol.14 (2004), 387 – 405.
9. Handoo, A., & Sharma, K. (2014). A study on determinants of Capital Structure in India. IIBM Management Review (2004), Vol. 26, 170 – 182.
10. Harris, M., & Raviv, A. (1991). The theory of Capital Structure. The Journal of Finance, Vol. 46(1), March 1991.
11. Harris, M., & Raviv, A. (1990). Capital Structure and the Informational Role of Debt. The Journal of Finance, Vol. 45(2), June 1990, 321 – 349.
12. Khrawish, H., & Khraiwesh, A. (2010). The Determinants of Capital Structure: Evidence from Jordanian Industrial Companies. JKAU: Econ. & Adm, Vol. 24 No.1, pp 173 – 196 (2010 A.D./1431 A.H.), DOI: 10.4197/Eco. 24-1.5.
13. Modigliani, F., & Miller, M. (1958).The Cost of Capital, Corporation Finance and the theory of Investment. The American Economic Review, Vol. 48(3), 261 - 297.
14. Modigliani, F., & Miller, M.H. (1963). Corporate Income Taxes and the Cost of Capital: A Correlation. The American Economic Review, Vol. 53(3), 433 - 443.
15. Modigliani, F., & Miller, M.H. (1977). Debt and Taxes. The Journal of Finance, Vol. 32(2), 261 - 275.
16. Myers, S., & Majluf, N. (1984). Corporate Financing and Investment Decisions when Firms have Information that Investors do not have. Journal of Financial Economics, Vol. 13(1984), 187 - 221. North Holland.
17. Myers, S. (2001). Capital Structure. The Journal of Economic Perspectives, Vol. 15(2) - 2001, 81 – 102.
18. Oppong-Boakye, P., Appiah, K., and Afolabi, J. (2013). Determinants of Capital Structure: Evidence from Ghanaian Firms. Research Journal of Finance and Accounting, Vol. 4(4), 2013. ISSN 2222-1697 (Paper) and ISSN 2222-2847 (Online).
19. Rajan, R., & Zingales, L. (1995). What do we know about capital structure? Some evidence from international data. The Journal of Finance, Vol. 50(5), 1421 - 1460.
20. Song, H. (2005). Capital Structure Determinants: An Empirical Study of Swedish Companies. Centre of Excellence for Science and Innovation Studies, Paper No.25.
21. Thippayana, P. (2014). Determinants of Capital Structure in Thailand. Procedia – Social and Behavioral Sciences, Vol. 143(2014), 1074 – 1077.
22. Titman, S., & Wessels, R. (1988).The Determinants of Capital Structure Choice. The Journal of Finance, Vol. 43(1), March 1988, 1 – 19.
23. Trisha – Capital Structure: Concept, Definition and Importance.
25. Vijaykumar, A. & Karunaiathal, A. (2014). The Effect
of Capital Structure on Profitability – An Empirical Analysis of Indian Paper Industry. International Research Journal of Business Management – IRJBM, volume No. VII, December 2014, Issue-13. ISSN 2322-083X.
© 20 16 Global Journals Inc. (US)
37
Globa
l Jo
urna
l of M
anag
emen
t an
d Bu
siness Resea
rch
Volum
e XVI Issu
e IV
Ver
sion
IYe
ar
()
2016
C
Determinants of Capital Structure (An Empirical Evidence, US)
24. Vatavu, S. (2012). Determinants of Capital Structure: Evidence from Romania manufacturing companies.Advance Research in Scientific Areas 2012, 670 –673.
38
Globa
l Jo
urna
l of M
anag
emen
t an
d Bu
siness Resea
rch
Volum
e XVI Issu
e IV
Ver
sion
IYe
ar
()
2016
© 2016 Global Journals Inc. (US)1
C
Appendices
Table 1: Hypothesis of Model 1
Table 2 : Hypothesis of Model 2
Determinants of Capital Structure (An Empirical Evidence, US)
© 20 16 Global Journals Inc. (US)
39
Globa
l Jo
urna
l of M
anag
emen
t an
d Bu
siness Resea
rch
Volum
e XVI Issu
e IV
Ver
sion
IYe
ar
()
2016
C
Table 3 : Hypothesis of Model 3
Table 7 : Results of Model 1
Correlated Random Effects - Hausman Test
Test cross-section random effects
Test Summary Chi-Sq. Statistic Chi-Sq. d.f. Prob.
Cross-section random 22.050356 6 0.0012
Table 7 : Shows the Fixed Effect
Variable Coefficient Std. Error t-Statistic Prob.
C 0.408046 0.364793 1.118567 0.2683PROF_? -0.074981 0.173446 -0.432300 0.6672SIZE_? -0.033182 0.040218 -0.825058 0.4130
GROWTH_? -0.019022 0.093756 -0.202886 0.8400TANG_? 0.981641 0.193862 5.063598 0.0000EVOL_? 0.019357 0.026380 0.733784 0.4663NDTS_? -0.603116 0.614456 -0.981545 0.3307
Fixed Effects (Cross)HPQ—C 0.200057IBM—C 0.285971INTC—C -0.228586JNPR—C -0.402159MSFT—C 0.196246MSI—C 0.228653
NFLX—C 0.458770
Determinants of Capital Structure (An Empirical Evidence, US)
40
Globa
l Jo
urna
l of M
anag
emen
t an
d Bu
siness Resea
rch
Volum
e XVI Issu
e IV
Ver
sion
IYe
ar
()
2016
© 2016 Global Journals Inc. (US)1
C
SNDK—C -0.294766SWKS—C -0.516712TDC—C -0.122305TXN—C -0.188142
VRSN—C 0.719104WU—C 0.367077XRX—C -0.135516
YHOO—C -0.567690
Effects Specification
Cross-section fixed (dummy variables)
R-squared 0.951567 Mean dependent var 0.545288Adjusted R-squared 0.933629 S.D. dependent var 0.277655S.E. of regression 0.071531 Akaike info criterion -2.205876Sum squared resid 0.276301 Schwarz criterion -1.556980Log likelihood 103.7204 Hannan-Quinn criter. -1.946779F-statistic 53.04754 Durbin-Watson stat 1.499312Prob(F-statistic) 0.000000
Table 8 : Results of Model 2Correlated Random Effects - Hausman TestTest cross-section random effects
Test Summary Chi-Sq. Statistic Chi-Sq. d.f. Prob.
Cross-section random 13.830122 6 0.0316
Variable Coefficient Std. Error t-Statistic Prob.
C 0.404974 0.321575 1.259346 0.2133PROF_? -0.286385 0.152897 -1.873054 0.0665SIZE_? -0.025834 0.035453 -0.728679 0.4693
GROWTH_? 0.017394 0.082649 0.210459 0.8341TANG_? 0.424778 0.170895 2.485611 0.0161EVOL_? 0.043109 0.023255 1.853769 0.0692NDTS_? -0.841257 0.541658 -1.553113 0.1262
Fixed Effects (Cross)HPQ--C 0.035571IBM--C 0.232207INTC--C -0.044696JNPR--C -0.270205MSFT--C 0.058486MSI--C 0.117316
NFLX--C 0.388062SNDK--C -0.155211SWKS--C -0.336764
Shows the Fixed EffectTable 8 :
Determinants of Capital Structure (An Empirical Evidence, US)

© 20 16 Global Journals Inc. (US)
41
Globa
l Jo
urna
l of M
anag
emen
t an
d Bu
siness Resea
rch
Volum
e XVI Issu
e IV
Ver
sion
IYe
ar
()
2016
C
TDC--C -0.158570TXN--C -0.037462
VRSN--C 0.318127WU--C 0.130060XRX--C 0.006470
YHOO--C -0.283389
Effects Specification
Cross-section fixed (dummy variables)
R-squared 0.886924 Mean dependent var 0.279536Adjusted R-squared 0.845044 S.D. dependent var 0.160186S.E. of regression 0.063056 Akaike info criterion -2.458079Sum squared resid 0.214710 Schwarz criterion -1.809182Log likelihood 113.1780 Hannan-Quinn criter. -2.198982F-statistic 21.17780 Durbin-Watson stat 1.930042Prob(F-statistic) 0.000000
Table 9 : Results of Model 3
Correlated Random Effects - Hausman Test
Test cross-section random effects
Test Summary Chi-Sq. Statistic Chi-Sq. d.f. Prob.
Cross-section random 22.773018 6 0.0009
Variable Coefficient Std. Error t-Statistic Prob.
C 0.002709 0.378091 0.007166 0.9943
PROF_? 0.211674 0.179768 1.177483 0.2442
SIZE_? -0.007320 0.041684 -0.175595 0.8613
GROWTH_? -0.036421 0.097174 -0.374798 0.7093
TANG_? 0.556963 0.200929 2.771940 0.0076
EVOL_? -0.023757 0.027342 -0.868873 0.3888
NDTS_? 0.238048 0.636853 0.373788 0.7100
Fixed Effects (Cross)
HPQ—C 0.164442
IBM—C 0.053680
INTC—C -0.183980
JNPR—C -0.131948
MSFT—C 0.137700MSI—C 0.111373
Shows the result of Fixed EffectTable 9 :
Determinants of Capital Structure (An Empirical Evidence, US)
42
Globa
l Jo
urna
l of M
anag
emen
t an
d Bu
siness Resea
rch
Volum
e XVI Issu
e IV
Ver
sion
IYe
ar
()
2016
© 2016 Global Journals Inc. (US)1
C
NFLX--C 0.070705
SNDK--C -0.139516
SWKS--C -0.179847
TDC—C 0.036301
TXN--C -0.150715
VRSN--C 0.401132
WU--C 0.237011
XRX--C -0.142005
YHOO--C -0.284334
Effects Specification
Cross-section fixed (dummy variables)
R-squared 0.823650 Mean dependent var 0.265761
Adjusted R-squared 0.758335 S.D. dependent var 0.150812
S.E. of regression 0.074138 Akaike info criterion -2.134272
Sum squared resid 0.296811 Schwarz criterion -1.485375Log likelihood 101.0352 Hannan-Quinn criter. -1.875174
F-statistic 12.61043 Durbin-Watson stat 1.145728
Prob(F-statistic) 0.000000
Determinants of Capital Structure (An Empirical Evidence, US)