DETERMINANTS OF ASSET VALUATION APPROACHES IN …
51
DETERMINANTS OF ASSET VALUATION APPROACHES IN ACQUISITION OF FRANCHISED PETROL FILLING STATIONS IN NAKURU COUNTY OPAP OCHIENG SAMSON A RESEARCH PROJECT SUBMITTED TO THE COLLEGE OF HUMAN RESEARCH DEVELOPMENT IN PARTIAL FULFILLMENT OF THE REQUIREMENTS FOR THE AWARD OF DEGREE IN MASTER OF SCIENCE IN FINANCE OF JOMO KENYATTA UNIVERSITY OF AGRICULTURE AND TECHNOLOGY MAY, 2018
Transcript of DETERMINANTS OF ASSET VALUATION APPROACHES IN …

DETERMINANTS OF ASSET VALUATION APPROACHES IN
ACQUISITION OF FRANCHISED PETROL FILLING STATIONS IN
NAKURU COUNTY
OPAP OCHIENG SAMSON
A RESEARCH PROJECT SUBMITTED TO THE COLLEGE OF HUMAN
RESEARCH DEVELOPMENT IN PARTIAL FULFILLMENT OF THE
REQUIREMENTS FOR THE AWARD OF DEGREE IN MASTER OF
SCIENCE IN FINANCE OF JOMO KENYATTA UNIVERSITY OF
AGRICULTURE AND TECHNOLOGY
MAY, 2018

ii
DECLARATION AND RECOMMENDATION
Declaration by the Student
I declare that this research project is my original work and has not been presented for
any award of any diploma/degree/masters in any University.
Signed: ......................................................... Date: ............................................
OPAP OCHIENG SAMSON
HD335-C007-6342/2015
Recommendation
This research project has been submitted for examination with my approval as the
Jomo Kenyatta University of Agriculture and Technology supervisor.
Signature…………………………………… Date……………………………..
MR. WECHE ESHIWANI
LECTURER, JKUAT

iii
DEDICATION
I dedicate this research project to my family especially my mum Mrs. Serfina Opap
for their financial support during my coursework through to during research. I also
give thanks and gratitude to my classmates who have been a great team to me during
the course of my studies and during the period of my research. I also dedicate this
work to the Almighty God for the strength, wisdom, knowledge and good health
throughout my work.

iv
ACKNOWLEDGMENT
First, I am grateful to the Almighty God for providing me with good health,
knowledge and skills that have enabled me complete my project without any
difficulties. Secondly I thank my supervisor Mr. Weche Eshiwani for giving me
brilliant ideas that enabled me polish, learn, comprehend and successfully complete
this research project. Special thanks go to my family for helping me financially and
friends and family who kept supporting me whenever they could.
Lastly, I wish to thank the College of Human Resource Development for the tireless
follow ups on the progress regarding the research and the University as a whole.
Thank you very much.
v
ABSTRACT
Acquisitions have become a big part of the corporate world, and are among the most
strategic and tactical decisions made by companies. Therefore, asset valuation is
gaining prominence within the investment sector. However, the key question that
remains to be addressed is how do these valuation factors affect the acquisition of
business assets such as petrol filling stations majority of which are still franchises.
Therefore, general objective of the study was to investigate the asset valuation factors
affecting acquisition of franchised petrol filling stations in Nakuru County. The
specific objectives were to determine the influence of sales comparison approach,
income approach, and cost approach on the acquisition of franchised petrol filling
stations in Nakuru County. The theory of asset pricing, accounting theory and
neoclassical theory was used to explain into detail on asset valuation factors and how
they affect acquisition. The study used a descriptive survey research design targeting
98 recently acquired and operating franchised petrol filling stations in Nakuru County.
From these, the accessible population comprised the investors, the owners of the
petrol stations, the management of the petrol stations and asset valuers in the region.
Stratified random sampling was used to select a sample size of 130 respondents. Data
was collected using questionnaire and analyzed using both descriptive and inferential
statistical methods. The study established that the acquiring firms often assess the
value of comparable properties when making a petrol station acquisition and the firms
consider the transaction dates when the comparable property was sold or leased.
However, with regards to property size, the firms factor in the size of the comparable
property with respect to the new property before acquiring the same. Besides, it
emerged that the acquiring firm considers the location and physical characteristics of
the comparable properties, a number of the participants remained neutral while others
expressed contrary opinion. The findings of the study further indicated that the firm
considers the potential annual gross income from the property before acquisition and
that it considers the net operating income from the targeted property. In addition, it
emerged that the estimated capitalization rate from the target property and the
expected growth rate of the property remain critical in the process of valuation and
acquisition of franchised petrol filling stations. It also came out that the acquiring firm
takes into account the growth rate of the property income. The study revealed that the
acquiring entities greatly consider the cost of the vacant land and the cost of
developing structures before making a petrol station acquisition. It further showed that
the replacement cost of the structure cannot be ignore before making a petrol station
acquisition and that the firm considers the purpose of the structure before making a
petrol station acquisition. Besides, the study showed that the time over which the
structure has been existing in order to decide on asset acquisition. Besides, the
purpose of the structure as a significant determinant of franchised petrol station
acquisition. The study recommended the necessity to consider the comparison of sales
in relation to the expected performance of the acquiring entity should it consider it fit
to make an acquisition. This study also recommended that in full consideration of the
perpetual life a business expects to enjoy and the expected costs should as well be
considered in relation to the expected useful life of the franchised business entity.

vi
TABLE OF CONTENTS
DECLARATION AND RECOMMENDATION .................................................................. ii
DEDICATION........................................................................................................................ iii
ACKNOWLEDGMENT ........................................................................................................ iv
ABSTRACT .............................................................................................................................. v
TABLE OF CONTENTS ....................................................................................................... vi
LIST OF FIGURES ............................................................................................................. viii
LIST OF TABLES .................................................................................................................. ix
LIST OF ABBREVIATIONS ................................................................................................. x
DEFINITION OF TERMS..................................................................................................... xi
CHAPTER ONE: INTRODUCTION .................................................................................... 1
1.1 Background of the Study .....................................................................................................1
1.2 Statement of the Problem .....................................................................................................6
1.3 Research Objectives .............................................................................................................8
1.4 Research Hypotheses ...........................................................................................................9
1.5 Significance of the Study .....................................................................................................9
1.6 Scope of the Study ...............................................................................................................9
1.7 Limitations of the Study.....................................................................................................10
CHAPTER TWO: LITERATURE REVIEW ..................................................................... 11
2.1 Introduction ........................................................................................................................11
2.2 Theoretical Review ............................................................................................................11
2.4 Conceptual Framework ......................................................................................................14
2.5 Empirical Review...............................................................................................................15
2.6 Summary of the Literature Review and Research Gap ......................................................18
2.7 Research Gaps ....................................................................................................................19
CHAPTER THREE: RESEARCH METHODOLOGY .................................................... 20
3.1 Introduction ........................................................................................................................20
3.2 Research Design.................................................................................................................20
3.3 Target Population and Sample ...........................................................................................20
3.4 Sampling Design ................................................................................................................20
3.5 Data Collection Instruments ..............................................................................................21
3.6 Pilot Study ..........................................................................................................................21
3.7 Data Analysis Procedures ..................................................................................................22

vii
CHAPTER FOUR: RESEARCH FINDINGS AND DISCUSSIONS ............................... 23
4.1 Introduction ........................................................................................................................23
4.2 Response Rate ....................................................................................................................23
4.3 Respondents’ Profile ..........................................................................................................23
4.4 Findings of Study Variables...............................................................................................24
4.5 Inferential analysis .............................................................................................................27
4.6 Hypothesis Testing.............................................................................................................31
CHAPTER FIVE: SUMMARY OF FINDINGS, CONCLUSSIONS AND
RECOMMENDATIONS ....................................................................................................... 32
5.1 Introduction ........................................................................................................................32
5.2 Summary of Findings .........................................................................................................32
5.3 Conclusions ........................................................................................................................33
5.4 Recommendations ..............................................................................................................33
5.5 Areas of Further Studies ....................................................................................................34
REFERENCES ....................................................................................................................... 35
APPENDICES ........................................................................................................................ 38
APPENDIX 1: QUESTIONNAIRES ................................................................................... 38

viii
LIST OF FIGURES
Figure 2:1: Conceptual Framework ................................................................................... 14
ix
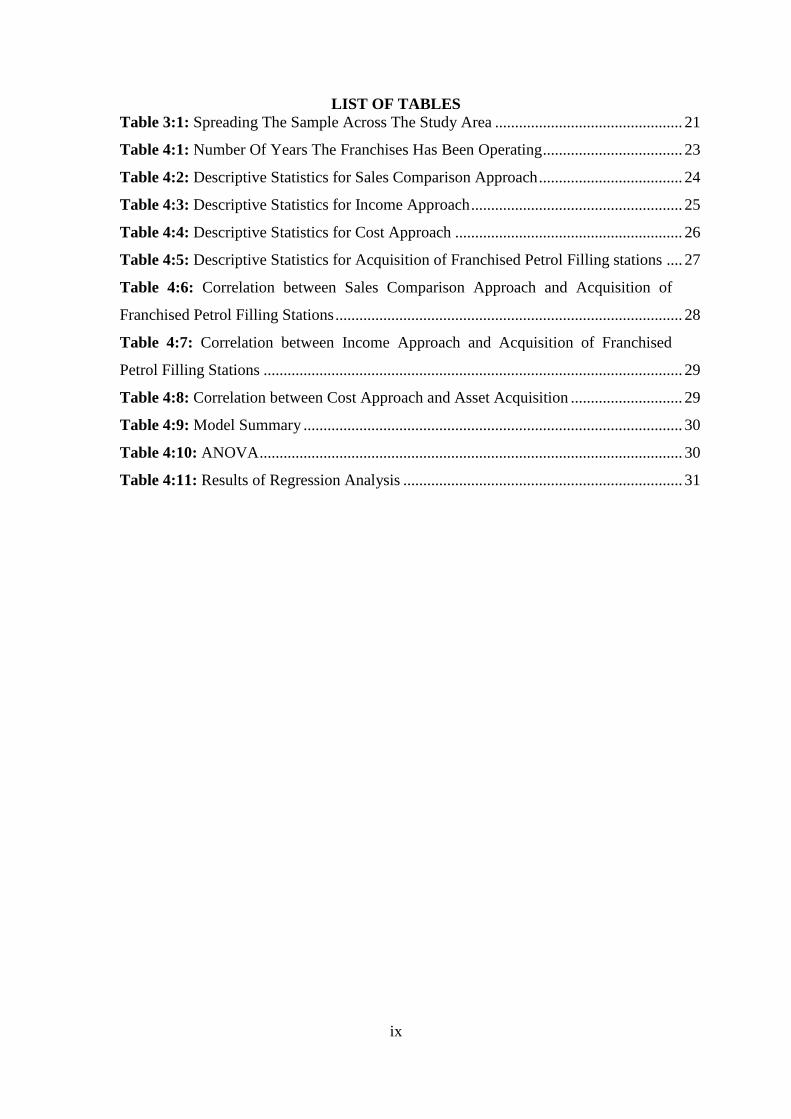
LIST OF TABLES
Table 3:1: Spreading The Sample Across The Study Area ............................................... 21
Table 4:1: Number Of Years The Franchises Has Been Operating ................................... 23
Table 4:2: Descriptive Statistics for Sales Comparison Approach .................................... 24
Table 4:3: Descriptive Statistics for Income Approach ..................................................... 25
Table 4:4: Descriptive Statistics for Cost Approach ......................................................... 26
Table 4:5: Descriptive Statistics for Acquisition of Franchised Petrol Filling stations .... 27
Table 4:6: Correlation between Sales Comparison Approach and Acquisition of
Franchised Petrol Filling Stations ....................................................................................... 28
Table 4:7: Correlation between Income Approach and Acquisition of Franchised
Petrol Filling Stations ......................................................................................................... 29
Table 4:8: Correlation between Cost Approach and Asset Acquisition ............................ 29
Table 4:9: Model Summary ............................................................................................... 30
Table 4:10: ANOVA .......................................................................................................... 30
Table 4:11: Results of Regression Analysis ...................................................................... 31

x
LIST OF ABBREVIATIONS
GAAP Generally Accepted Accounting Principles
NOCK National Oil Corporation of Kenya
SAPIA South African Petroleum Industry Association
SPSS Statistical Package for Social Sciences

xi
DEFINITION OF TERMS
Capitalization Rate
=Net Operating Income / Purchase Price or Property Value
(Miaria, 2011).
Cost approach In real estate appraisal, the cost approach is one of three
basic valuation methods. The others are market approach, or
sales comparison approach, and income approach. The
fundamental premise of the cost approach is that a potential
user of real estate won't, or shouldn't, pay more for a property
than it would cost to build an equivalent. The cost of
construction minus depreciation, plus land, therefore is a
limit, or at least a metric, of market value (Pike & Neale,
2003).
Effective Gross
Income
= Gross Income - Vacancy Rate - Rent Loss (Neal &
Wheatley 2012)
Franchised petrol
station
An agreement in which an entrepreneur buys a license to use
another petrol filling station’s products, brand, proprietary
knowledge and trade secrets. This allows the franchisee to
start a business without building up his brand or products.
This is a common way to start a business, especially in
highly competitive industries (Lim, 2016).
Income approach Is one of three major groups of methodologies, called
valuation approaches, used by appraisers. It is particularly
common in commercial real estate appraisal and in business
appraisal. The fundamental math is similar to the methods
used for financial valuation, securities analysis, or bond
pricing. However, there are some significant and important
modifications when used in real estate or business valuation
(Hill & Jones, 2001).
Net Operating
Income
= Effective Gross Income - Operating Expenses (Shleifer &
Thaler, 2015)
Property Value = Net Operating Income / Capitalization Rate (Miaria, 2011).

xii
Sales comparison The sales comparison approach is based upon the principles
of supply and demand, as well as upon the principle of
substitution. Supply and demand indicates value through
typical market behavior of both buyers and sellers.
Substitution indicates that a purchaser would not purchase an
improved property for any value higher than it could be
replaced for on a site with equivalent utility, assuming no
undue delays in construction (Kumar & Bansal, 2008).

1
CHAPTER ONE
INTRODUCTION
1.1 Background of the Study
Mergers and Acquisitions (M&A) are arguably the most popular strategies among
firms as they seek to establish a competitive advantage over their rivals. The constant
state of global flux arising from forces of globalization and rapid technological
changes pile intense competitive pressure on firms. In order to ward off the challenges
and explore new opportunities, firms are opting for inorganic growth through various
strategic alternatives like mergers and acquisitions (M&A), strategic alliances, joint
ventures etc. In the last two decades, during the fifth merger wave, the value of
acquisitions has increased dramatically (Kumar & Bansal, 2008). This is evident in
the petroleum industry which has seen a number of acquisitions in the recent times.
However, questions still arise on the value and profitability of such acquisitions
especially with regard to local acquisitions which essentially do not involve major
changes in brand.
An acquisition is the taking over by one company of the business assets or share
capital of another in exchange for cash, ordinary shares, loan stock or a combination
of this. This results in the identity of the target being absorbed into that of the
acquirer, Pike and Neale (2003). A definition supplied by Hill and Jones (2001)
suggests that a takeover is when the acquiring company gains control of another
without the cooperation of its existing management. The acquiring company usually
joins forces with the key shareholders, purchase stock on the open market or by
soliciting proxies. Local acquisitions of franchises mostly involve transfer of
dealership and operating assets and seldom involve the transfer of fixed assets to the
new dealer.
According to Lim (2016), acquisition valuation involves the use of multiple
analyses to determine a range of possible prices to pay for an acquisition
candidate. There are many ways to value a business, which can yield widely
varying results, depending upon the basis of each valuation method. Some
methods assume a valuation based on the assumption that a business will be sold
off at bankruptcy prices, while other methods focus on the inherent value of
intellectual property and the strength of a company’s brands, which can yield

2
much higher valuations. Of interest to the present study is the valuation mechanisms
used by local dealers when making such acquisitions.
1.1.1 Asset Valuation
In finance, valuation is the process of estimating what something is worth. Items that
are usually valued are a financial asset or liability. Asset valuation is the process of
assessing the value of a company, real property or any other item of worth, in
particular assets that produce cash flows (Lim, 2016). Asset valuation is commonly
performed prior to the purchase or sale of an asset or prior to purchasing insurance for
an asset. Asset valuation can be based on cash flows, comparable valuation metrics or
transaction value. Lim, (2016) further argues that valuations can be done on assets
(for example, investments in marketable securities such as stocks, options, business
enterprises, or intangible assets such as patents and trademarks) or on liabilities (e.g.,
bonds issued by a company). Valuations are needed for many reasons such as
investment analysis, capital budgeting, merger and acquisition transactions, financial
reporting, taxable events to determine the proper tax liability, and in litigation.
Valuation of financial assets is done using one or more of these types of models:
Acquisitions have become a big part of the corporate world, and are among the most
strategic and tactical decisions made by companies.
Absolute value models that determine the present value of an asset’s expected future
cash flows. These kinds of models take two general forms which are multi-period
models such as discounted cash flow models or single-period models such as the
Gordon model (Neal & Wheatley 2012). These models rely on mathematics rather
than price observation. Fair value is used in accordance with US GAAP (FAS 157),
where fair value is the amount at which the asset could be bought or sold in a current
transaction between willing parties, or transferred to an equivalent party, other than in
a liquidation sale. This is used for assets whose carrying value is based on mark-to-
market valuations; for fixed assets carried at historical cost (less accumulated
depreciation), the fair value of the asset is not used.
Common terms for the value of an asset or liability are fair market value, fair value,
and intrinsic value. The meanings of these terms differ. For instance, when an analyst
believes a stock’s intrinsic value is greater (less) than its market price, an analyst
makes a buy (sell) recommendation. Moreover, an asset’s intrinsic value may be

3
subject to personal opinion and vary among analysts. When a plant asset is purchased
for cash, its acquisition cost is simply the agreed on cash price (Miaria, 2011).
However, when a business acquires plant assets in exchange for other non-cash assets
(shares of stock, a customer’s note, or a tract of land) or as gifts, it is more difficult to
establish a cash price.
Shleifer & Thaler (2015) discusses possible asset valuation bases. The general rule on
non-cash exchanges is to value the non-cash asset received at its fair market value or
the fair market value of what was given up, whichever is more clearly evident. The
reason for not using the book value of the old asset to value the new asset is that the
asset being given up is often carried in the accounting records at historical cost. In the
case of a fixed asset, its value on the balance sheet is historical cost less accumulated
depreciation, or book value. Neither amount may adequately represent the actual fair
market value of either asset. Therefore, if the fair market value of one asset is clearly
evident, a firm should record this amount for the new asset at the time of the
exchange.
Sometimes, neither of the items exchanged has a clearly determinable fair market
value. Then, accountants record exchanges of items at their appraised values as
determined by a professional appraiser. An appraised value is an expert’s opinion of
an item’s fair market price if the item were sold. Appraisals are used often to value
works of art, rare books, antiques, and real estate. The book value of a fixed asset is
the recorded cost less accumulated depreciation. An old asset’s book value is usually
not a valid indication of the new asset’s fair market value. However, if a better basis is
not available, a firm could use the book value of the old asset. Occasionally, a
company receives an asset without giving up anything for it (Shleifer, & Thaler 2015)
1.1.2 Petrol Filling Stations in the World
The fuel retail sector operates in a highly competitive environment that is
characterized by low profit margins and high stock turnover. It is both capital and
labor intensive, with approximately 58 000 pump attendants employed in the sector
(Thomas, 2005). A study conducted by the DME in 2004, found that the average fuel
station sold 270000 liters of fuel per month, with approximately 70% of all fuel
stations selling only 200000 liters (Thomas, 2005). Despite the regulation in the
industry, the DME found that only 40% of fuel stations are profitable with regard to
selling fuel. Many fuel stations have explored alternative sources of income in order

4
to remain profitable and there is a concern that there are too many fuel stations,
resulting in an overtraded market (Thomas, 2005). According to the DME, the retail
market may be overtraded by as much as 30% (Visser, 2005).
The reliance of fuel stations on additional sources of income is commonplace in de-
regulated markets. In the USA, fuel is considered the volume driver, whilst
convenience store sales drive the bulk of the profits (Reid, 2004). A survey performed
by National Petroleum News in 2005, indicated that 66.5% of sales relate to motor
fuel, but these sales only contributed 31.7% to the gross profit in the industry.
Therefore 68.3% of the gross profit in the US fuel retail industry is derived from
convenience store sales. The United Kingdom is no different, and Shell Oil Company
has admitted that they make no profit from UK fuel sales (Harwood, 2006). Profits
from European fuel sales are also being eroded, causing companies to search for new
revenue streams (Weirauch, 2000).
In Australia, the level of competition increased with the mergers of Woolworths
Limited and Caltex Australia and also Coles Myer and Shell. The Coles Myer/Shell
merger announced in May, 2003 included some 584 Shell outlets. The merger
enabled Coles to match Woolworths’ offer of a 4¢ discount per litre of petrol with
grocery purchases above $30. The merger also benefited Shell which increased fuel
market share. Shell is the exclusive supplier of fuel products to the Coles Express
network, leases the service station property to Coles, and maintains the presence of
Shell branding. Coles Express sets fuel and shop prices and operates the business,
provides convenience and grocery merchandise through its supply chain and
distribution network, and directly employs service station staff (RandR, 2014).
The merger of Woolworths and Caltex added up to about 160 sites to the existing 290
site Woolworths petrol business. The joint venture company leases all of Woolworths
and Safeways petrol outlets. Caltex manages the co-branded petrol and convenience
stores located adjacent to or near Woolworths Supermarkets and supply the fuel in
New South Wales and Queensland. Woolworths supplies the convenience stores.
These two major developments within the fuel and retail industries reveal the highly
competitive and evolving nature of these businesses. These two mergers also place
pressure on smaller and non-aligned companies such as BP and the independents
(RandR, 2014).

5
South African fuel retailers are already relying heavily on convenience store sales, in
an overtraded industry, to remain profitable. With the impending deregulation of the
industry, it is imperative that retailers understand the variables affecting the
profitability of outlets in order to remain in the industry. According to the South
African Petroleum Industry Association [SAPIA] 2015 report the current asking price
of a service station business can vary from R1 million to R35 million. In addition, the
average working capital requirement of a service station can fluctuate between R1.2
million and R1.5 million. The cost of these investments is based on the usual appraisal
criteria of a commercial property such as the profitability of the operation and the
evaluation of the physical real-estate, including its assets and location.The report
noted that operators can maximize revenues through the addition of alternate profit
centers to the forecourts, such as quick-service restaurants, convenience stores and car
wash businesses.
1.1.3 The Kenya Petroleum Retail Industry
The Kenyan oil industry is divided into two segments; the upstream and downstream.
The upstream comprises of companies that are in the exploration business. This
segment has generated a lot of interest among stakeholders with the discovery of
commercially viable reservoirs in Ngamia 1 in Turkana on 2012 (Reuters). The other
segment; the downstream is concerned with the distribution and marketing of the
petroleum products and was dominated by multinationals in the early years. The
industry was liberalized in 1994 giving way to the introduction of many new local
marketers and retailers. The oil marketing companies fall in the larger Kenyan oil
industry, they comprise of companies that are involved in the import and export of
petroleum products. The export business is done to neighboring countries like
Uganda, Rwanda, Burundi, DRC and South Sudan as these countries are landlocked
and have no way to access crude that comes from the Middle East via sea.
According to PIEA insight magazine, there are currently over 35 oil marketing
companies in the country. The market is however dominated by six companies, Total
Kenya is the leader controlling 16.7 per cent, Vivo Energy trading as Kenya Shell
13.6 per cent KenolKobil controls 11.6 per cent, Hashi Energy 6.1 per cent, Gulf
Energy 5.9 per cent and Libya Oil at 4.9 per cent. Other players include Gapco Oil
Company, Hass, National Oil Corporation of Kenya (NOCK), Engen, Mogas, Galana
Oil Company and other small marketers. The market is divided into the commercial,

6
retail and export business. The major companies operate in all three segments while
the small players choose either one or two areas of operation. Commercial business
involves selling of bulk fuel to either resellers or companies for their industrial use,
the export business involves selling of fuel across the country’s territorial bounders,
and retail business involves selling fuel to the end user at service stations. Out of the
over, 35 marketers only 14 have retail networks across the country, others with retail
outlets are independent individual.
However, the industry was thrown into disarray were many duty exempt products
began to find their way into the market as well as product adulteration (Munyua &
Ragui, 2013). According to Wachira (2007), the bigger players began to panic, and
would trade at high risk and low margins only to stay in the market. This resulted in
the mass exit of these multinationals in the early 2000. Other factors cited by
international companies for their exit included increased competition and official
price caps. These companies shifted focus to the more lucrative exploration and
production activities. Shell was the latest multinational company to exit Kenya,
following in the footsteps of five international majors that had left the country in the
past decade over dwindling margins. The major multinationals were; Caltex
(Chevron), Beyond Petroleum Plc (BP), Mobil, Agip and Esso (Kinyanjui, 2013).
1.1.4 Petrol Filling Stations in Nakuru
Samuel, (2014) argues that basic explanation of assets in Nakuru petrol filling stations
reveals that there are two ways in which you can earn money from holding an asset.
Assets that have a market value are valued based on multiples of that value. In
Nakuru, to attract industry to an area and provide jobs for local residents, the county
government of Nakuru gives a company a tract of land on which to build a factory.
Although such a gift costs the recipient company nothing, it usually records the asset
(land) at its fair market value.
1.2 Statement of the Problem
Despite the petroleum industry often being viewed as lucrative, owning operating a
filling station is seldom simple and involves several risks and challenges to the
investor. Over the last ten years, the number of fuel stations both in the British and
Polish market has been declining. For instance, in the UK, the number of fuel stations
declined from more than 9,900 in 2005 to less than 8,600 (nearly a 14% decrease),
while in Poland, the total went down from over 6,800 in 2005 to 6,479 at the end of

7
2014 (nearly a 5% decrease). The main reasons for this situation are the increasing
costs of compliance with environmental regulations and strong competition among
fuel retailers (UK PIA 2015). According to National Oil Corporation of Kenya (2015)
the challenges that the petroleum industry faces include inadequate and aged
petroleum infrastructure that provides only a maximum 10 days of operational stocks
cover, lack of strategic petroleum stocks, petroleum infrastructure concentrated only
on the southern part of the country leading to massive trucking of products,
inadequate retail petrol station outlets - only 1,600 stations to serve a population of 44
million Kenyans which is approximately equivalent to South Africa’s Gauteng
province alone with an area of 18,178 km2 and population of 10 million. Still, locally,
the KenolKobil website lists a total of 14 petrol filling stations as open for dealership
in Kenya including Kobil Milimani in Nakuru County. This is an indicator of the high
turnover in the industry.
Majority of the filling stations in the country are franchises, the brand having being
developed by the parent oil company, therefore, the investor has virtually no
obligation to develop the brand and the products. Investors, however, lack information
on how much a brand is worth; the brand is an intangible asset and the valuation is
subjective. Acquiring a filling station requires a substantial amount of capital for the
franchise to authorize one to be a dealer of their products as well as operating capital.
Sales are not guaranteed despite the marketing done by the franchise owner and
dealers have to contend with unpredictable customer preferences and location
constraints. In several cases, the returns fall below the investments, hence, leading to
cashflow constraints. As a result, some franchised petrol filling stations in Nakuru
County are now experiencing serious cash flow problems, and these have made it
difficult for them to meet debt obligations to their bankers. Consequently, an
increasing number of these franchised petrol filling stations are now faced with
receivership and foreclosure threats from their bankers. Another influence potentially
affecting valuations in business combination is the changing structure of corporate
land holdings. The increasing realization that property is an asset to be pro-actively
managed has implications for both tenure and valuation. For assets value to be useful
during acquisition, the target companies have been found not to have followed a
regular depreciation, replacement and revaluation policy. The reasons for using this
method is that it can be used as a starting point to be compared and complemented by

8
other analysis. Where large investment in fixed assets is required to generate earnings,
the book value could be a critical factor especially where plant and equipment are
relatively new. Therefore, it is evident that that apart from cashflow challenges, other
liabilities exist which if not factored during the acquisition, may give misleading
information on the property’s networth. Mwangi (2012) researched on factors that
influence relocation of Multinational Oil companies based in Kenya to other countries
and found that major reasons that led to the exit was shrinking profit margins. Chege
(2012) focused on challenges of strategy implementation for firms in the petroleum
industry in Kenya and found that the major challenges were technology, resource
allocation, job responsibilities, prioritization, organization structure, values and
resistance to change. However, the key question that remains to be addressed is how
do these valuation factors affect the acquisition of petrol filling stations? Previous
studies on asset valuation and acquisitions have not focused franchised petrol filling
stations in Kenya. This study therefore was set to assess the asset valuation factors
affecting acquisition of franchised petrol filling stations in Nakuru County.
1.3 Research Objectives
The study sought to achieve the following objectives:
1.3 1 General Objective
The general objective of the study was to investigate the determinants of asset
valuation approaches in acquisition of franchised petrol filling stations in Nakuru
County
1.3.2 Specific Objectives
i. To determine the influence of sales comparison approach on the acquisition of
franchised petrol filling stations in Nakuru County.
ii. To establish the influence of income approach on the acquisition of franchised
petrol filling stations in Nakuru County.
iii. To determine the influence of cost approach on the acquisition of franchised
petrol filling stations in Nakuru County.

9
1.4 Research Hypotheses
Ha1:Sales comparison approach influences the acquisition of franchised petrol
filling stations in Nakuru County.
Ha2:Income approach influences the acquisition of franchised petrol filling
stations in Nakuru County.
Ha3: Cost approach influences the acquisition of franchised petrol filling stations
in Nakuru County.
1.5 Significance of the Study
The overall premise of investment is to create profitable assets and this implies
growth. However, acquiring already existing assets can pose significant challenges to
the acquiring firms and lead to poor returns or significant losses if proper valuation is
not done. Therefore, the outcome of this study is meant to be of benefit to all
stakeholders in the petroleum retail industry, purposely, the current franchise holders,
potential investors, franchise owners, regulators and future researchers.
The current franchise holders and their management of petrol filling stations in the
area and beyond may find the outcome of the study useful determining the asset
valuation factors to best adopt in order to help in the event of future acquisition so as
to make it profitable. Potential investors and franchise owners may also be
enlightened on the critical factors needed to make such acquisitions worthwhile
ventures. The regulators and other policy makers at the county and national
government levels may also find the findings and recommendations of the study
useful in determining level playing fields for future investments into this crucial
sector. The study is also expected to be useful to researchers and academicians who
may be interested on furthering the research on fixed asset valuation and acquisitions.
The findings of this study may also add to the growing fund of knowledge in asset
valuation and acquisitions both from a theoretical and empirical perspective.
1.6 Scope of the Study
The study focused on determinants of asset valuation approaches in acquisition of
franchised petrol filling stations in Nakuru County. It specifically sought to establish
the influence of sales comparison approach, income approach and cost approach on
the acquisition of franchised petrol filling stations in the area. A descriptive survey
research design was used targeting 98 acquired franchised petrol filling stations in the
10
County (See Appendix II). The study used only primary data collected through
questionnaires from the filling stations owners, their management and asset valuation
agents in the area. The study was conducted over a period of six months at a cost of
Kshs. 92,218.50.
1.7 Limitations of the Study
The study faced the following limitations. The main limitation of the study was its
scope as it mainly focused on fixed and current business asset valuation of franchise
dealerships in Nakuru County. As such, the findings could not necessarily hold in
other different contexts without some assumptions and modifications. However, every
care was taken in the sampling and instrumentation to make the findings more
adaptable to other areas of interest for future researchers and other stakeholders. Co-
operation is also one of the limiting factors anticipated in the study in that some of the
respondents may be reluctant when approached to participate in the study. The
researcher, however, sought to create a good relationship with the respondents and
inform them of the significance and value of their participation in the study.

11
CHAPTER TWO
LITERATURE REVIEW
2.1 Introduction
The chapter presents a review of the related literature on the subject under study by
various researchers, scholars and authors. The subject is explored from both empirical
and theoretical perspectives. The study draws materials from several sources which
are closely related to the theme and objectives.
2.2 Theoretical Review
A discussion of the theories undergirding the study subject follows in this section. The
theories under review are; The Theory of Asset Pricing, The Accounting Theory and
The Neoclassical Theory.
2.2.1 The Theory of Asset Pricing
The pricing of assets is a topic that cuts across financial and asset management
(Singh, 2012). In financial management, a firm wants to know the cost of capital and
the return required before investing in a long-term investment project. In portfolio
management, a key input in portfolio construction is the expected return for an asset.
Asset pricing theory describes the relationship between the risks of and the expected
return (Neal & Wheatley 2012). An estimate of the expected return that providers of
capital require on investments is needed in order to value an asset. Therefore, asset
pricing models are premised on the expected return investors require given the risk
associated with an investment. Theory of Asset Pricing unifies the central tenets and
techniques of asset valuation into a single, comprehensive resource(Neal & Wheatley,
2012).
The two most well-known equilibrium pricing models are the capital asset pricing
model developed in the 1960s and the arbitrage pricing theory model developed in the
mid-1970s. According to Foster, (2013), asset prices are determined by investors’ risk
preferences and by the distributions of assets’ risky future payments. Economists refer
to these two bases of prices as investor "tastes" and the economy’s "technologies" for
generating asset returns. A satisfactory theory of asset valuation must consider how
individuals allocate their wealth among assets having different future payments.
The value of assets can be manipulated to favor either the investor or the property
owner and as such this theory may only serve to explain the motivations, risks and
ideal situations of asset pricing. However, its needs to be complimented by the
accounting theory so as to give a true position of the asset and reduce speculations.

12
2.2.2 Accounting Theory
According to (Boland, 1992), accounting theory is a set of assumptions and
methodologies used in the study and application of financial reporting principles. In
the positive accounting theory, the firm value maximization is linked to the arguments
of the neoclassical theory of economics based on individualism and the neoclassical
maximization hypothesis (Boland, 1992). This theory views the firm as a set of
contracts and groups of selfish-minded individuals, and consequently all its members,
in their own interest, are motivated to maximize the firm value and as rational
individuals. They seek to boost their personal benefit that is directly related to their
current pay value, therefore, giving the owners and the management opportunity to
get an increased pay now is associate with the profit level. Higher profits will mean
bigger dividends to the owners, while the achieved performance results may be linked
to the management bonus system.
That being the case, the choice of profit increasing accounting techniques becomes
relevant in developing the accounting policy. While accounting procedures are
formulaic in nature, accounting theory is more qualitative in that it is a guide for
effective accounting and financial reporting. The most important aspect of accounting
theory is usefulness, which, in the corporate finance world, means that all financial
statements should provide important information that can be used to make informed
business decisions. This also means that accounting theory is intentionally flexible so
that it can provide effective financial information, even when the legal environment
changes. In addition to usefulness, accounting theory states that all accounting
information should be relevant, reliable, comparable and consistent. What this
essentially means is that all financial statements need to be accurate and adhere to the
generally accepted accounting principles (GAAP).
Adherence to GAAP allows the preparation of financial statements to be both
consistent and comparable to a company's past financials, as well as the financials of
other companies. Finally, accounting theory requires that all accounting and financial
professionals operate under four assumptions. The first assumption states that a
business is separate from its owners. The second affirms the belief that a company
will continue to exist and not go bankrupt. The third assumes that all financial
statements are prepared with dollar amounts and not with other numbers like unit
13
production. Finally, all financial statements must be prepared on a monthly or annual
basis.
In the current study, the accounting theory is meant to provide insight into investor
decisions on asset value based on the financial position of the business property as
declared by the financial reports.
2.2.3 Neoclassical theory
The neoclassical theory states that merger waves occur as firms in specific industries
react to economic shocks (deregulation, emergence of new technologies or substitute
products and services), which explains why merger activity clusters by industries. The
empirical evidence in support of this theory is provided by Gort, (1969) and more
recently by Mitchell & Mulherin, (1996) which states that before selling an asset, the
asset must undergo valuation). The size and length of each wave largely depends on
the number of industries influenced. The emergence of the Internet for instance was
more pervasive than the deregulation of utilities. When firm valuations deviate from
fundamentals, managers use overvalued stock of their firms as currency to buy assets
of undervalued (or less overvalued) firms (Shleifer & Vishny, 2004), which explains
the correlation of merger activity with stock market performance.
Accordingly, the overvaluation theory posits that more acquisitions will happen in
periods of bubbles. Rhodes, (2005) provide empirical evidence consistent with the
market valuations theory of merger waves. The theory also argues that technological
change has a major influence on valuation of assets. The term neoclassical
economics was officially coined in 1900. Neoclassical economists believes that a
consumer's number-one concern is to maximize personal satisfaction, and that
everyone makes decisions based on fully informed evaluations of utility. This theory
coincides with the idea of rational behavior theory, which states that people act
rationally when making economic decisions. Further, neoclassical
economics stipulates that a good or service often has value that goes above and
beyond its input costs. For example, while classical economics believes that a
product's value is derived as the cost of materials plus the cost of labor, neoclassical
practitioners say that consumers have a perceived value of a product that affects its
price and demand. Finally, this theory states that competition leads to an efficient
allocation of resources within an economy (Shleifer & Vishny, 2004). This resource
allocation establishes market equilibrium between supply and demand.

14
2.4 Conceptual Framework
A conceptual framework is a research tool intended to assist a researcher to develop
awareness and understanding of the situation under scrutiny and to communicate this.
It was used in research to outline possible courses of action or to present a preferred
approach to an idea or thought.
Independent Variables Intervening variable Dependent Variable
Figure 2:1: Conceptual Framework
The sales comparison approach will be measured by use of the comparable properties,
transaction dates for the sales, as well as land use and zoning. The income approach
will be measured using the annual gross income of the properties, the net operating
income, and the capitalization rate, among others. The cost approach will be measured
using the cost of vacant land, the cost of structures, the time since construction was
done, etc.
Sales comparison
approach
Comparable properties
Transaction date
Land use and zoning
Income approach
Annual gross income
Net operating income
Capitalization rate
Acquisitions of Petrol
Stations in Nakuru
Number of new owners
Rates of acquisitions
Terms of acquisitions
Cost approach
Cost of vacant land
Cost of structures
Time since construction
was done

15
The government regulations will consist of those regulations that apply to transfer and
lease of properties, such as taxes, licenses, and permits, etc.
The acquisition of petrol stations in Nakuru will be measured by the number of new
owners, rates of acquisitions, terms of acquisitions.
2.5 Empirical Review
This section reviews existing empirical literature on asset valuation and acquisitions.
The aim is to provide insight into the variables previously identified and expose gaps
that need to be filled by the present study.
2.5.1 Sales Comparison Approach
In arriving at the market value, a subject property needs to be compared with an
appropriate number of comparable properties for the similarities and the
dissimilarities. The types of properties that are amenable to the treatment by
comparison method as suggested by various authors are residential (Rodgers, 2001;
Dennis & Pinkowish, 2007), investment (Wincott, 2002), industrial (Ellsworth, 2001;
2002), mining (Healy & Berquist, 2000), contaminated land (Patchin, 1999), vacant
land (Guidry, 2003), telecommunication corridor (Bucaria & Kuls, 2002) and office
properties (Wincott, 2001; Clendaniel, 2005). Rodgers (2001) proposes that valuers
can apply a systematic grid-adjustment process that employs specific percentage or
dollar-amount adjustments, highlighting that this approach emphasizes the individual
comparable sales as the most meaningful units of comparison called “property-to-
property comparison‟. Williams (2004) observes that adjustments for the numerous of
dissimilarities between a subject property and its comparables can be made on a dollar
or a percentage basis.
A competitive market analysis (CMA) is the estimation of the value of a property by
comparing it to similar properties in the same area that have been recently sold. If a
comparable property is superior to the subject property to which it is being compared,
then a negative or minus adjustment is made to take the comparable property from
that superior position down to an equal level equal to the subject property. If a
comparable property is inferior which it is being compared to the subject property,
then a positive adjustment is made. The market itself determines whether the item is
superior or inferior.
16
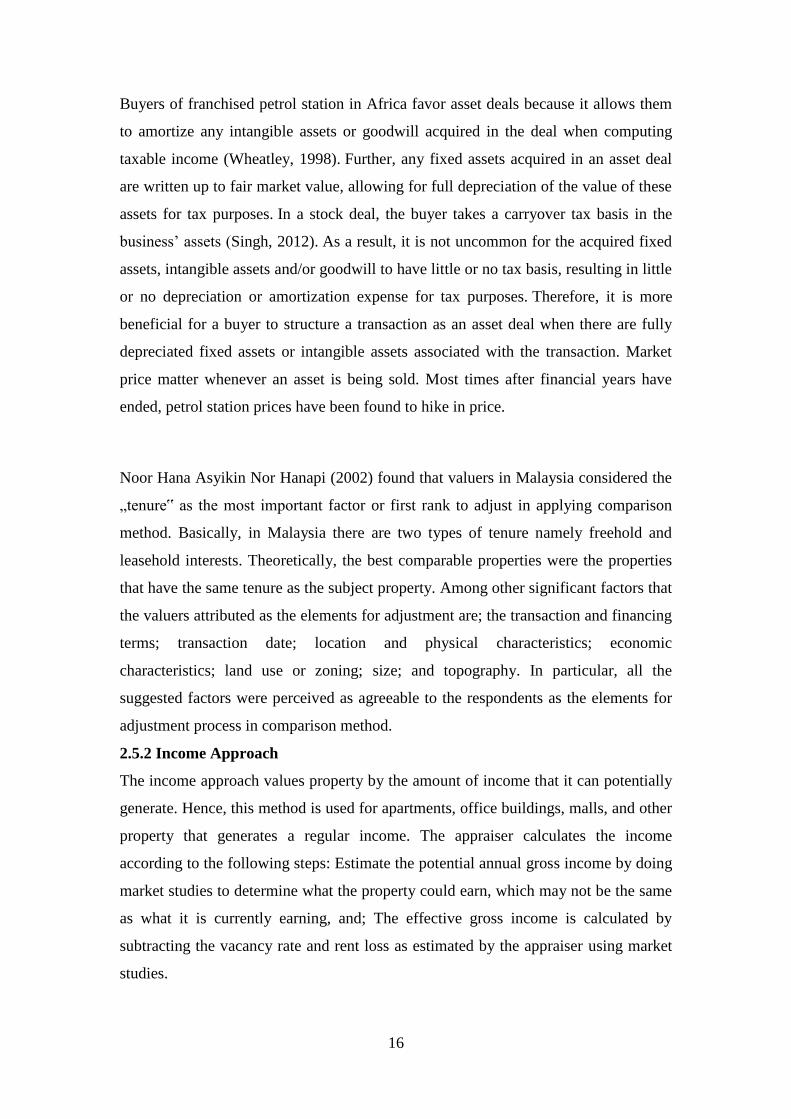
Buyers of franchised petrol station in Africa favor asset deals because it allows them
to amortize any intangible assets or goodwill acquired in the deal when computing
taxable income (Wheatley, 1998). Further, any fixed assets acquired in an asset deal
are written up to fair market value, allowing for full depreciation of the value of these
assets for tax purposes. In a stock deal, the buyer takes a carryover tax basis in the
business’ assets (Singh, 2012). As a result, it is not uncommon for the acquired fixed
assets, intangible assets and/or goodwill to have little or no tax basis, resulting in little
or no depreciation or amortization expense for tax purposes. Therefore, it is more
beneficial for a buyer to structure a transaction as an asset deal when there are fully
depreciated fixed assets or intangible assets associated with the transaction. Market
price matter whenever an asset is being sold. Most times after financial years have
ended, petrol station prices have been found to hike in price.
Noor Hana Asyikin Nor Hanapi (2002) found that valuers in Malaysia considered the
„tenure‟ as the most important factor or first rank to adjust in applying comparison
method. Basically, in Malaysia there are two types of tenure namely freehold and
leasehold interests. Theoretically, the best comparable properties were the properties
that have the same tenure as the subject property. Among other significant factors that
the valuers attributed as the elements for adjustment are; the transaction and financing
terms; transaction date; location and physical characteristics; economic
characteristics; land use or zoning; size; and topography. In particular, all the
suggested factors were perceived as agreeable to the respondents as the elements for
adjustment process in comparison method.
2.5.2 Income Approach
The income approach values property by the amount of income that it can potentially
generate. Hence, this method is used for apartments, office buildings, malls, and other
property that generates a regular income. The appraiser calculates the income
according to the following steps: Estimate the potential annual gross income by doing
market studies to determine what the property could earn, which may not be the same
as what it is currently earning, and; The effective gross income is calculated by
subtracting the vacancy rate and rent loss as estimated by the appraiser using market
studies.

17
The net operating income (NOI) is then calculated by subtracting the annual operating
expenses from the effective gross income. Annual operating expenses include real
estate taxes, insurance, utilities, maintenance, repairs, advertising and management
expenses. Management expenses are included even if the owner is going to manage it,
since the owner incurs an opportunity cost by managing it herself. The cost of capital
items is not included, since it is not an operating expense. Hence, it does not include
mortgage and interest, since this is a debt payment on a capital item. Also there is
need to estimate the capitalization rate (aka cap rate), which is the rate of return, or
yield, that other investors of property are getting in the local market, thus;
Effective Gross Income = Gross Income - Vacancy Rate - Rent Loss
Net Operating Income = Effective Gross Income - Operating Expenses
Capitalization Rate = Net Operating Income / Purchase Price or Property Value
Therefore: Property Value = Net Operating Income / Capitalization Rate
The capitalization rate is equivalent to the interest rate for bonds or the E/P ratio for
stocks: more desirable properties will have lower cap rates than less desirable
properties, for the same reason that Treasuries have lower interest rates than junk
bonds or high-growth companies have lower earnings-to-price ratios than companies
that are not growing. The cap rate takes into account the growth potential of either the
property or its income. In other words, investors will be willing to pay a higher price
for a property in a desirable neighborhood than for a property earning the same
amount of income in a ghetto.
2.5.3 Cost Approach
Generally, the cost approach considers what the land, devoid of any structures, would
cost, then adds the cost of actually building the structures, then depreciation is
subtracted. The cost approach is most often used for public buildings, such as schools
and churches, because it is difficult to find recently sold comparable properties in the
local market, and public buildings do not earn income, so the income approach cannot
be used, either. A property that already has improvements will usually contribute a
certain amount of value to the site, but improvements can also lower property value if
the site's potential buyers wish to use the property for another use that would entail
removing some of the improvements to the current site.

18
The cost approach is best used when improvements are new and there is adequate
pricing information to value the property components. The cost approach may be less
desirable if there are no recent sales of vacant land for which to compare, since the
major method of valuing vacant lands is to use the sales comparison approach, or
when construction costs are not readily available. The reproduction cost is the cost of
duplicating the subject property's structure completely. The replacement cost is the
cost of building a similar structure, but using modern construction methods and
materials. The replacement cost is the approach most often used because it uses the
most modern materials and features, eliminating functional obsolescence, such as
rooms of an undesirable size or high maintenance construction materials. The
replacement cost is also usually lower than the reproduction cost.
There are three major methods of estimating the reproduction or replacement cost:
The square-foot method (aka comparison method) takes the cost per square foot of a
recently developed comparable property and multiplies it by the square footage, using
the external dimensions of the structures of the subject property: The unit-in-place
method estimates the cost of the subject property by summing the costs of the
individual components of the structures, such as materials, labor, overhead, and profit:
The quantity-survey method estimates the separate costs of construction materials
(wood, plaster, etc.), labor, and other factors and adds them together. This method is
the most accurate and the most expensive method, and is mainly used for historical
buildings.
There is also an index method that uses the actual construction cost of the subject
property, then multiplies it by how much the cost of materials and labor have
increased since the structure was built. This method is deemed the least accurate and
is generally used as a check on the 3 main methods of reproduction or replacement
cost.
2.6 Summary of the Literature Review and Research Gap
When negotiating for the purchase or sale of a business, the focus of both the buyer
and seller is typically on the transaction price. If valuation is made for possible
acquisition sales price is agreed upon by both parties, it should matter whether it is the
target company’s stock or assets being sold. As discussed above, there are pros and
cons to each party involve in asset valuation during the asset acquisition in a
transaction depending upon whether it is structured as an asset deal or a stock

19
deal. The overriding forces typically result in buyers favoring asset deals and sellers
favoring stock deals. During the negotiation process, it is important to understand the
benefits not only to you, but also to the other party, so that a mutually beneficial deal
structure can be achieved. There are three main reasons that parties negotiate for asset
or stock deals during acquisition process after valuation (depending upon what side of
the table they are sitting on): tax issues, liability issues, and depreciation amortization
issues. The general pros and cons related to these issues for buyers and sellers. To
both the buyer and the seller, however, the structure of the deal can be just as
important as the price. Therefore, this study will fill the research gap on the asset
valuation factors affecting acquisition of franchised petrol filling stations.
2.7 Research Gaps
Diverse scholars such as Wheatley (1998), Singh (2012) and Rodgers (2001) have
examined diverse valuation methods utilized across the companies. These studies
have however not examined the aspects of valuation influence on the acquisition of
petrol filling stations which is the focus of this study.

20
CHAPTER THREE
RESEARCH METHODOLOGY
3.1 Introduction
This chapter describes the methods and tools that were used in collecting the available
data in order to meet the objectives. It includes the research design, sampling design,
data collection method and instruments, data processing and analysis techniques.
3.2 Research Design
The study used descriptive survey research design. According to Orodho (2005),
descriptive survey research design can generate accurate information for large number
of people over a wide area using a small sample. It is used to explore relationships
between variables and allows generalizations across populations. Since this study
sought to obtain descriptive and self-reported information on how strategic asset
valuation and acquisition of local franchises, the descriptive research design enabled
the researcher to expose the respondents to a set of standardized questions to allow
comparison.
3.3 Target Population and Sample
According to Kothari (2004), a population is a well-defined set of people, services,
elements, and events, group of things or households that are being investigated. The
study will target 70 recently acquired and operational franchised petrol filling stations
in Nakuru County (See appendix II). From these, the accessible population comprised
of the owners, management and investors. Local asset valuers in the area were also
involved in the study. This could bring the entire population accessible to the study to
200 persons.
3.4 Sampling Design
The present study used the stratified random sampling in order to obtain the required
sample size. Stratified random sampling is also ideal for the other respondents as it
has the characteristic of providing each member of the target population in their strata
an equal chance of being included in the study while at the same time keeping the size
manageable (Kothari, 2004). Since the target population of this study is sufficiently
large to warrant to use of random sampling methods, the overall sample size was first
calculated using the formula proposed by Yamane (1967) since no population
parameters are available;

21
= 98
Where N is the population and e = 0.05 is the level of precision. Therefore, the sample
size at 95% confidence level was 98 respondents.
The sample size was then allocated into various according to their relative sizes in the
target population as shown the sampling frame as shown in Table 3.2.
Table 3:1: Spreading the Sample Across The Study Area
Category Population size Sample Size
Management 70 53
Petrol Station Proprietors 45 34
Asset valuers 15 11
Total 130 98
3.5 Data Collection Instruments
The data collection instrument is the device used to collect research data from a
sample group. The study relied on primary data. Primary data was collected using
semi structured questionnaire that were administered by drop and pick methods and
through E-mail. The questionnaires with 5-point Likert scale were used. The
questionnaires contained 2 sections: Section A sought data on Background
information of the petrol filling stations; Section B sought data on the designed
objectives.
3.6 Pilot Study
A pilot study was carried out to assess the effectiveness of the data collection
instruments which were then subjected to tests for validity and reliability for
standardization of the research instruments to be used in the study before venturing
fully into data collection. The pilot study was carried out on a population that is
similar to the target population in Kericho County. Modifications, additional
questions and other shortcomings found in the questions were corrected.
3.6.1 Validity
Fraenkel & Wallen (1993) observed that an instrument may be constructed to measure
a number of things hence the validity of such instrument must be established. Grinnell
22
(1993) observed that the pretest of research instruments is more concerned with the
difficulties respondents may have in answering the questions. It will be further
advocated that before testing the instruments, it is important to define the variables to
be measured and ask the experts to evaluate the content of the instruments in order to
determine its content validity. To ascertain content and face validity of the
questionnaires, they were presented to lecturers in Jomo Kenyatta University of
science and technology who are authorities in the area for scrutiny and advice. The
contents of the instruments were improved based on the advice and comments of the
supervisors. The questionnaires were then reconstructed in a way that they relate to
each research question.
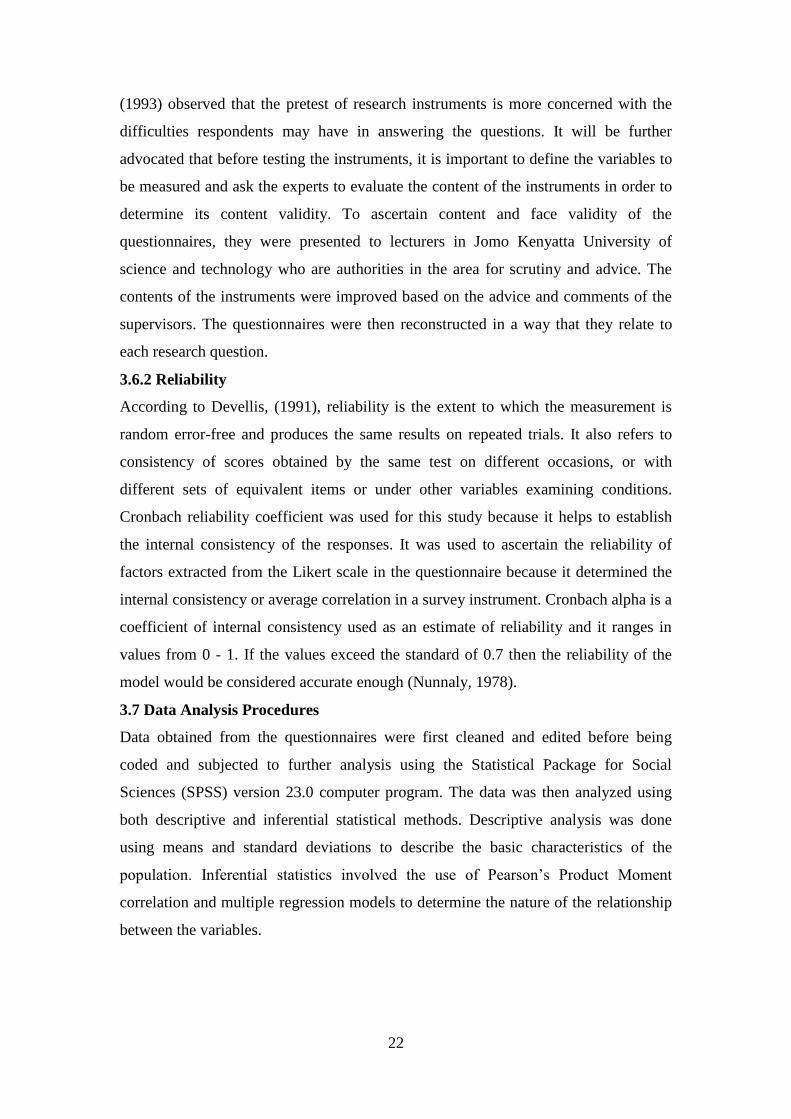
3.6.2 Reliability
According to Devellis, (1991), reliability is the extent to which the measurement is
random error-free and produces the same results on repeated trials. It also refers to
consistency of scores obtained by the same test on different occasions, or with
different sets of equivalent items or under other variables examining conditions.
Cronbach reliability coefficient was used for this study because it helps to establish
the internal consistency of the responses. It was used to ascertain the reliability of
factors extracted from the Likert scale in the questionnaire because it determined the
internal consistency or average correlation in a survey instrument. Cronbach alpha is a
coefficient of internal consistency used as an estimate of reliability and it ranges in
values from 0 - 1. If the values exceed the standard of 0.7 then the reliability of the
model would be considered accurate enough (Nunnaly, 1978).
3.7 Data Analysis Procedures
Data obtained from the questionnaires were first cleaned and edited before being
coded and subjected to further analysis using the Statistical Package for Social
Sciences (SPSS) version 23.0 computer program. The data was then analyzed using
both descriptive and inferential statistical methods. Descriptive analysis was done
using means and standard deviations to describe the basic characteristics of the
population. Inferential statistics involved the use of Pearson’s Product Moment
correlation and multiple regression models to determine the nature of the relationship
between the variables.

23
CHAPTER FOUR
RESEARCH FINDINGS AND DISCUSSIONS
4.1 Introduction
This chapter provides a detailed descriptive analysis of the research data obtained the
interpretation and discussion of the findings of the study. The chapter first presents
the response rate, presents the respondents’ profile and the findings of the study
variables. The said findings are presented in tables and discussed in this chapter in
respect of the specific study objectives.
4.2 Response Rate
According to Schwarz (2013), a response rate refers to the number of units in the net
sample used in the study expressed as a percentage of the units in the gross sample. In
this study, a total of 98 questionnaires were administered out of which only 79
questionnaires used in the study representing a response rate of 80.6%.
4.3 Respondents’ Profile
The researcher examined the respondents’ profiles in terms of the number of years the
franchised petrol stations have been operational.
4.3.1 Years of Operation
The study sought to determine the number of years during which the franchised petrol
filling stations have been operating. Table 4.1 shows the distribution of the
respondents according to their lifetime.
Table 4:1: Number Of Years The Franchises Has Been Operating
Years of Operation Frequency Percent
Less than 5 years 13 16.5
5-10 Years 7 8.9
11-15 Years 30 38.0
Over 15 Years 29 36.7
Total 79 100.0
From table 4.1, the study revealed that 16.5% of the franchised petrol filling stations
had operated for less than 5 years, while only 8.9% have been operational for a period
ranging from 5-10 years. In addition, the study also established that a significant
majority 38% of the franchised petrol filling stations have been operating 11-15 years
while 36.7% of them have been operating for over 15 years, implying that quite an
overwhelming majority of the franchised petrol filling stations have been enjoyed
perpetuity and thus have been in the business for relatively long.
24
4.4 Findings of Study Variables
The study examined the determinants of asset valuation approaches in acquisition of
franchised petrol filling stations in Nakuru County. The main approaches of asset
valuation studied included sales comparison approach, income approach, and cost
approach while the dependent variable was acquisition of franchised petrol filling
stations.
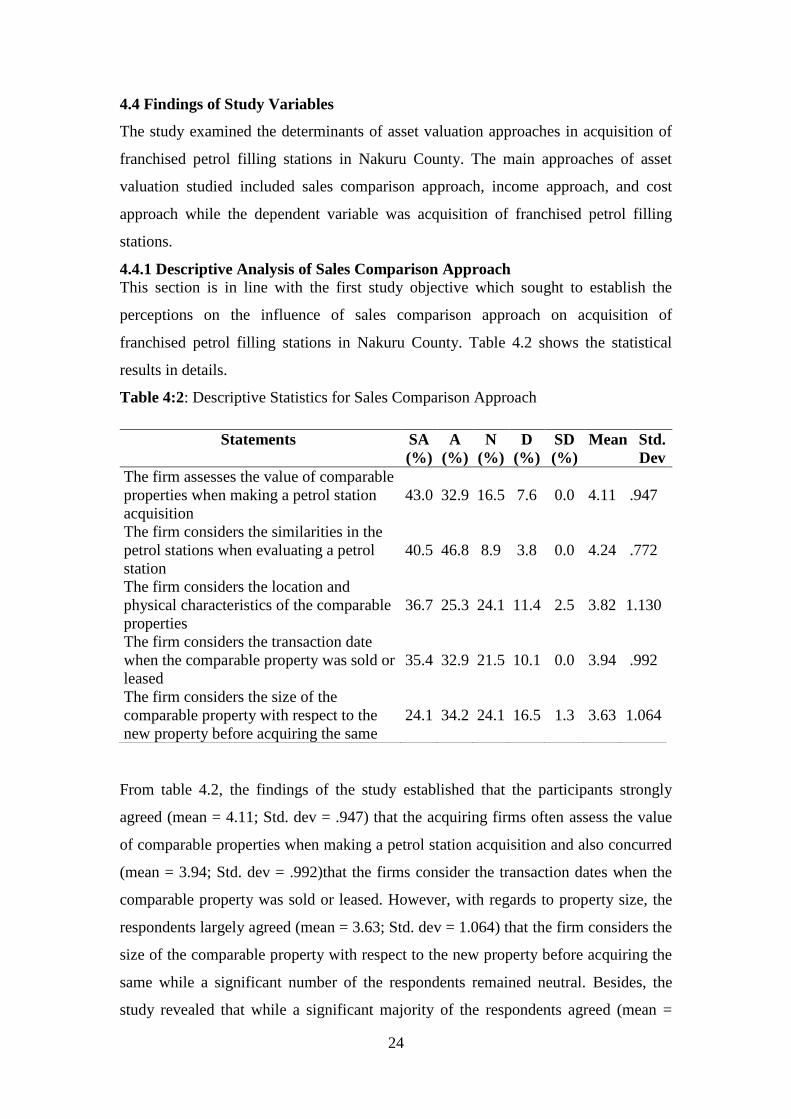
4.4.1 Descriptive Analysis of Sales Comparison Approach
This section is in line with the first study objective which sought to establish the
perceptions on the influence of sales comparison approach on acquisition of
franchised petrol filling stations in Nakuru County. Table 4.2 shows the statistical
results in details.
Table 4:2: Descriptive Statistics for Sales Comparison Approach
From table 4.2, the findings of the study established that the participants strongly
agreed (mean = 4.11; Std. dev = .947) that the acquiring firms often assess the value
of comparable properties when making a petrol station acquisition and also concurred
(mean = 3.94; Std. dev = .992)that the firms consider the transaction dates when the
comparable property was sold or leased. However, with regards to property size, the
respondents largely agreed (mean = 3.63; Std. dev = 1.064) that the firm considers the
size of the comparable property with respect to the new property before acquiring the
same while a significant number of the respondents remained neutral. Besides, the
study revealed that while a significant majority of the respondents agreed (mean =
Statements SA
(%)
A
(%)
N
(%)
D
(%)
SD
(%)
Mean Std.
Dev
The firm assesses the value of comparable
properties when making a petrol station
acquisition
43.0 32.9 16.5 7.6 0.0 4.11 .947
The firm considers the similarities in the
petrol stations when evaluating a petrol
station
40.5 46.8 8.9 3.8 0.0 4.24 .772
The firm considers the location and
physical characteristics of the comparable
properties
36.7 25.3 24.1 11.4 2.5 3.82 1.130
The firm considers the transaction date
when the comparable property was sold or
leased
35.4 32.9 21.5 10.1 0.0 3.94 .992
The firm considers the size of the
comparable property with respect to the
new property before acquiring the same
24.1 34.2 24.1 16.5 1.3 3.63 1.064

25
3.82; Std. dev = 1.130) that the firm considers the location and physical characteristics
of the comparable properties, a number of the participants remained neutral while
others expressed contrary opinion.
4.4.2 Descriptive Analysis of Income Approach
This section presents the analysis in accordance with the second objective of the study
which sought to determine the perceptions held on the influence of Income approach
on acquisition of franchised petrol filling stations in Nakuru County. Table 4.3 shows
the descriptive statistics and results in details.
Table 4:3: Descriptive Statistics for Income Approach
Statements SA
(%)
A
(%)
N
(%)
D
(%)
SD
(%)
Mean Std.
Dev
The firm considers the potential annual
gross income from the property before
acquisition of the same
49.4 43.0 6.3 1.3 0.0 4.41 .670
The firm considers the net operating
income from the targeted property 46.6 50.6 2.5 0.0 0.0 4.44 .549
The firm considers the estimated
capitalization rate from the target
property
36.7 39.2 20.3 3.8 0.0 4.09 .850
The firm considers the expected growth
rate of the property 40.5 55.7 3.8 0.0 0.0 4.37 .559
The firm considers the expected growth
rate of the property income 40.5 45.6 11.4 2.5 0.0 4.24 .755
The findings of the study shown on table 4.3 indicate that the respondents strongly
agreed (mean = 4.41; Std. dev = 0.670) that firm considers the potential annual gross
income from the property before acquisition and also concurred (mean = 4.44; Std.
dev = 0.549) that firm considers the net operating income from the targeted property.
In addition, the participants also alluded (mean = 4.09; Std. dev = 0.580) that firm
considers the estimated capitalization rate from the target property and also strongly
agreed (mean = 4.37; Std. dev = 0.559) that the firm considers the expected growth
rate of the property. It also emerged that a significant majority of the participants
concurred (mean = 4.24; Std. dev = 0.755) that the acquiring firm takes into account
the growth rate of the property income.

26
4.4.3 Descriptive Analysis of Cost Approach
In this section, an analysis is presented in accordance with the third objective of the
study which sought to find out the perceptions held on the influence of cost approach
on acquisition of franchised petrol filling stations in Nakuru County. Table 4.4 shows
the descriptive statistics and results in details.
Table 4:4 Descriptive Statistics for Cost Approach
Statements SA
(%)
A
(%)
N
(%)
D
(%)
SD
(%)
Mean Std.
Dev
The firm considers the cost of the
vacant land before making a petrol
station acquisition
21.5 51.9 11.4 10.1 5.1 3.75 1.068
The firm considers the cost of
building the structures before making
a petrol station acquisition
40.5 35.4 19.0 5.1 0.00 4.11 .891
The firm considers the time since the
structure was put up before making a
petrol station acquisition
15.2 49.4 12.7 21.5 1.30 3.56 1.035
The firm considers the replacement
cost of the structure before making a
petrol station acquisition
41.8 39.2 3.8 15.2 0.0 4.08 1.035
The firm considers the purpose of the
structure before making a petrol
station acquisition
36.7 51.9 3.8 7.6 0.0 4.18 .828
Table 4.4 revealed (mean = 3.75; Std. dev = 1.068) that the firm greatly considers the
cost of the vacant land before making a petrol station acquisition. The study indicated
(mean = 4.11; Std. dev = .891) that the firm considers the cost of building the
structures before making a petrol station acquisition. It further showed (mean = 4.08;
Std. dev = 1.035) that the firm factors in the replacement cost of the structure before
making a petrol station acquisition and the respondents strongly agreed (mean = 4.18;
Std. dev = 0.828) that the firm considers the purpose of the structure before making a
petrol station acquisition. It also emerged (mean = 3.56; Std. dev = 1.035) that the
firm considers the time since the structure was put up before making a petrol station
acquisition. However, 23% of the respondents expressed contrary opinion. Besides,
majority of the respondents agreed (mean = 4.08; Std. dev = 1.035) that the firm
considers the purpose of the structure before making a petrol station acquisition.

27
4.4.4 Descriptive Analysis of Acquisition of Franchised Petrol Filling stations
This section entails an analysis of the dependent variable. It examined the perceptions
held on the acquisition of franchised petrol filling stations in Nakuru county. Table
4.5 shows the descriptive statistics and results in details.
Table 4:5: Descriptive Statistics for Acquisition of Franchised Petrol Filling stations
Statements SA
(%)
A
(%)
N
(%)
D
(%)
SD
(%)
Mean Std.
Dev
Most of the new investors taking over the
petrol stations are corporate investors 39.2 48.1 5.1 7.6 0.0 4.19 .848
The new investors use a variety of
financial instruments when acquiring the
petrol stations
36.7 49.4 5.1 7.6 1.3 4.13 .911
Investors are showing a lot of interest in
petrol stations in our area 41.8 54.4 3.8 0.0 0.0 4.38 .562
Every year, at least five petrol stations are
completely acquired by new investors 17.7 38.0 30.4 6.3 7.6 3.52
1.09
6
During the acquisitions, there is total
transfer of assets and liabilities 16.5 48.1 12.7 17.7 5.1 3.53
1.11
9
The results of the study indicate that the participants concurred (mean = 4.19; Std. dev
= 0.848) that most of the new investors taking over the petrol stations are corporate
investors and also strongly agreed (mean = 4.19; Std. dev = 0.911) that new investors
use a variety of financial instruments when acquiring the petrol stations. In addition, it
revealed (mean = 4.38; Std. dev = 0.563) that investors are showing a lot of interest in
the petrol stations. Whereas a considerable number of the respondents agreed (mean =
3.52; Std. dev = 1.096) that every year, at least five petrol stations are completely
acquired by new investors, about 30% of the respondents remained neutral while
others held a contrary opinion. Besides, from the data obtained, it was agreed by a
significant majority of the respondents (mean = 4.19; Std. dev = 0.911) that during the
acquisitions, there is total transfer of assets and liabilities.
4.5 Inferential analysis
This study focused on the determinants of asset valuation approaches in relation to
acquisition of franchised petrol filling stations in Nakuru county. In particular, the

28
asset valuation approaches studied include Sales Comparison Approach, Income
approach, and cost approach. Correlating each of the said asset valuation approaches
with acquisition enabled the researcher to determine the relationships between each
independent variable and the dependent variable of the study. Further, a multiple
regression analysis was done to assess the relationship between the determinants of
asset valuation approaches and acquisition of franchised petrol filling stations.
4.5.1 Relationship between Sales Comparison Approach and Acquisition of
Franchised Petrol Stations
This section outlines the results of correlation analysis between Sales Comparison
Approach and Acquisition of petrol stations (Table 4.6). The findings were interpreted
and discussed accordingly.
Table 4:6: Correlation between Sales Comparison Approach and Acquisition of
Franchised Petrol Filling Stations
Acquisition of Petrol Station
Sales Comparison Approach
Pearson
Correlation .204
Sig. (2-tailed) .071
N 79
*. Correlation is significant at the 0.05 level (2-tailed).
The study results revealed a weak, positive and statistically insignificant (r=0.204;
p˃0.05) relationship between sales comparison approach and the acquisition of
franchised petrol filing stations. The analysis implied that the adoption of sales
comparison approach in valuation does not influence the acquisition of franchised
petrol stations.
4.5.2 Relationship between Income Approach and Acquisition of Petrol Stations
This section outlines the results of correlation analysis between Sales Comparison
Approach and Acquisition of Petrol Stations (Table 4.7). The findings were
interpreted and discussed accordingly.

29
Table 4:7: Correlation between Income Approach and Acquisition of Franchised
Petrol Filling Stations
Acquisition of Petrol Stations
Income Approach
Pearson Correlation .601**
Sig. (2-tailed) .000
N 79
*. Correlation is significant at the 0.05 level (2-tailed).
The study results indicated a strong, positive and statistically significant (r=0.601;
p<0.05) relationship between income approach and the acquisition of franchised
petrol stations. The analysis implied that the adoption of the income approach to asset
valuation significantly influences the acquisition of franchised petrol filling stations.
4.5.3 Relationship between Cost Approach and Acquisition of Franchised Petrol
Stations
This section outlines the results of correlation analysis between Cost Approach and
Acquisition of Petrol Station of Petrol Station (Table 4.8). The findings were
interpreted and discussed accordingly.
Table 4:8: Correlation between Cost Approach and Asset Acquisition
Acquisition of Petrol
Station
Cost Approach
Pearson Correlation .586**
Sig. (2-tailed) .000
N 79
*. Correlation is significant at the 0.05 level (2-tailed).
The findings of the study revealed a strong, positive and statistically significant
(r=0.586; p<0.05) relationship between cost approach to valuation and the acquisition
of franchised petrol stations. The analysis implied that the adoption of the cost
approach to asset valuation significantly influences the decision for the acquisition of
franchised petrol filling stations.
4.5.4 Relationship between Asset Valuation Approaches and Acquisition of
Franchised Petrol Stations
This study assessed how the approaches to asset valuation influenced the acquisition
of franchised petrol stations in Nakuru County. Tables 4.9, 4.10 and 4.11 show the
results of the multiple regression analysis.

30
Table 4:9: Model Summary
Model R R Square Adjusted R Square Std. Error of the
Estimate
1 .747a .558 .541 .39938
a. Predictors: (Constant), Cost Approach, Sales Comparison Approach, Income
Approach
Table 4.9 presents an overview of the results of coefficient of determination (r2) and
correlation coefficient (R). The results of (r2
= 0.558) and (R=0.747) reflected a strong
positive correlation between the Asset Valuation Approaches and Acquisition of
Franchised Petrol Stations in Nakuru County.
Table 4:10: ANOVA
Model Sum of Squares df Mean
Square
F Sig.
1
Regression 15.114 3 5.038 31.585 .000b
Residual 11.963 75 .160
Total 27.077 78
a. Dependent Variable: Acquisition of Petrol Station
b. Predictors: (Constant), Cost Approach, Sales Comparison Approach, Income
Approach
Table 4.10 presents the findings of analysis of variance (ANOVA) which indicates
that the asset valuation approaches significantly influenced Acquisition of franchised
petrol stations in Nakuru county (F = 31.585: p < 0.05) at 95% degree of confidence.
These findings were based on the adoption of various asset valuation approaches in
relation to acquisition of franchised entities.
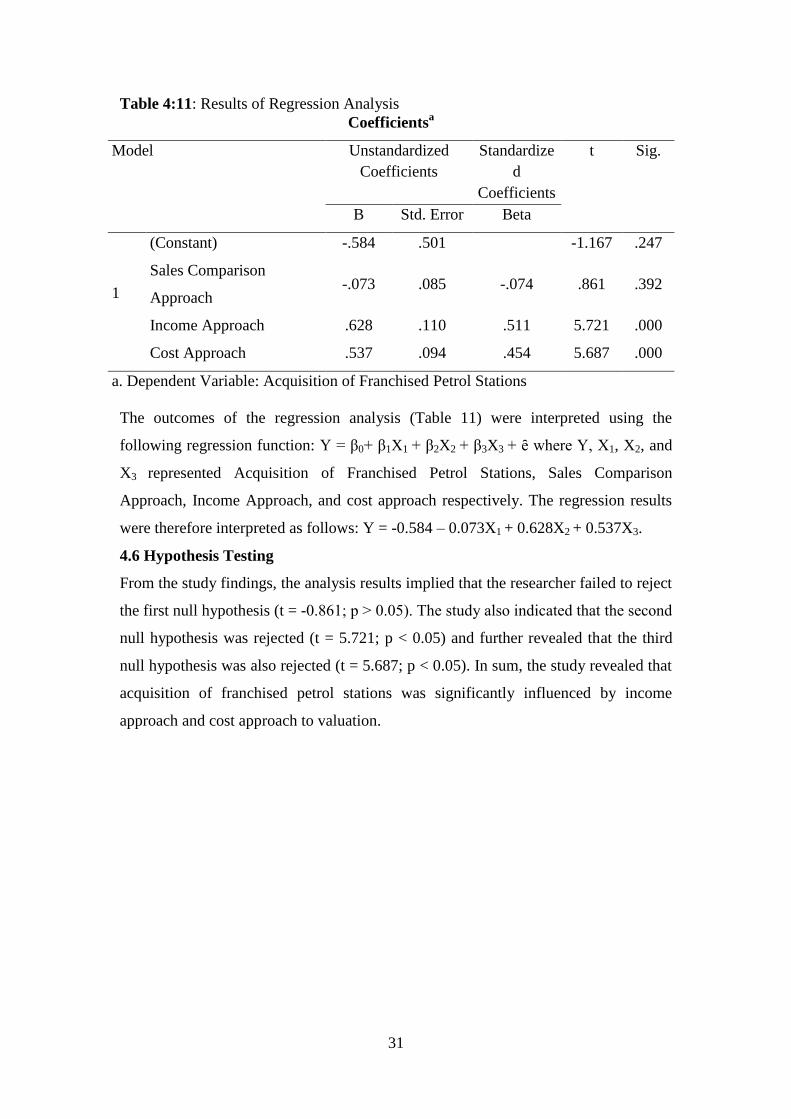
31
Table 4:11: Results of Regression Analysis
Coefficientsa
Model Unstandardized
Coefficients
Standardize
d
Coefficients
t Sig.
B Std. Error Beta
1
(Constant) -.584 .501 -1.167 .247
Sales Comparison
Approach -.073 .085 -.074 .861 .392
Income Approach .628 .110 .511 5.721 .000
Cost Approach .537 .094 .454 5.687 .000
a. Dependent Variable: Acquisition of Franchised Petrol Stations
The outcomes of the regression analysis (Table 11) were interpreted using the
following regression function: Y = β0+ β1X1 + β2X2 + β3X3 + ȇ where Y, X1, X2, and
X3 represented Acquisition of Franchised Petrol Stations, Sales Comparison
Approach, Income Approach, and cost approach respectively. The regression results
were therefore interpreted as follows: Y = -0.584 – 0.073X1 + 0.628X2 + 0.537X3.
4.6 Hypothesis Testing
From the study findings, the analysis results implied that the researcher failed to reject
the first null hypothesis (t = -0.861; p ˃ 0.05). The study also indicated that the second
null hypothesis was rejected (t = 5.721; p < 0.05) and further revealed that the third
null hypothesis was also rejected (t = 5.687; p < 0.05). In sum, the study revealed that
acquisition of franchised petrol stations was significantly influenced by income
approach and cost approach to valuation.

32
CHAPTER FIVE
SUMMARY OF FINDINGS, CONCLUSSIONS AND
RECOMMENDATIONS
5.1 Introduction
This chapter provides a detailed summary of findings and conclusions from the study
highlighting results that are most relevant to policy issues and managerial decisions as
well as the undertakings relevant to asset valuation and acquisition. The chapter
further presents detailed recommendations for specific areas requiring action and
future research
5.2 Summary of Findings
This section outlines the major findings of the study done in tandem with the specific
objectives of the study as pointed out in chapter one. The findings are summarized in
every paragraph per variable studied.
Going by the first objective, the findings of the study established that the acquiring
firms often assess the value of comparable properties when making a petrol station
acquisition and the firms consider the transaction dates when the comparable property
was sold or leased. However, with regards to property size, the firms factor in the size
of the comparable property with respect to the new property before acquiring the
same. Besides, it emerged that the acquiring firm considers the location and physical
characteristics of the comparable properties, a number of the participants remained
neutral while others expressed contrary opinion.
As per the second objective, the findings of the study indicated that the firm considers
the potential annual gross income from the property before acquisition and that it
considers the net operating income from the targeted property. In addition, it emerged
that the estimated capitalization rate from the target property and the expected growth
rate of the property remain critical in the process of valuation and acquisition of
franchised petrol filling stations. It also came out that the acquiring firm takes into
account the growth rate of the property income.
Moreover, the study revealed that the acquiring entities greatly consider the cost of
the vacant land and the cost of developing structures before making a petrol station
acquisition. It further showed that the replacement cost of the structure cannot be
ignore before making a petrol station acquisition and that the firm considers the
purpose of the structure before making a petrol station acquisition. Besides, the study
showed that the time over which the structure has been existing in order to decide on

33
asset acquisition. Besides, the purpose of the structure as a significant determinant of
franchised petrol station acquisition.
The results of the study also indicated that most of the new investors taking over the
petrol stations are corporate investors and that the new investors use a variety of
financial instruments when acquiring the petrol stations. In addition, the study
revealed that potential and prospective investors are showing a lot of interest in the
petrol stations. Besides, from the data obtained, majority of the respondents indicated
that during the acquisitions, there is total transfer of assets and liabilities.
5.3 Conclusions
The conclusions in this section were made in context of the stated specific objectives
of the study.
The study results revealed a weak, positive and statistically insignificant relationship
between sales comparison approach and the acquisition of franchised petrol filing
stations implying that the adoption of sales comparison approach in valuation does not
influence the acquisition of franchised petrol stations. In addition, it also indicated a
strong, positive and statistically significant relationship between income approach and
the acquisition of franchised petrol stations. The analysis implied that the adoption of
the income approach to asset valuation significantly influences the acquisition of
franchised petrol filling stations. In addition, the findings of the study revealed a
strong, positive and statistically significant relationship between cost approach to
valuation and the acquisition of franchised petrol stations indicating that the cost
approach to asset valuation significantly influences the decision for the acquisition of
franchised petrol filling stations.
5.4 Recommendations
The recommendations made herein were based on the study findings in relation to the
existing literature. From the findings presented in the previous chapter, the following
recommendations were imperative.
First, it is necessary to consider the comparison of sales in relation to the expected
performance of the acquiring entity should it consider it fit to make an acquisition.
This study also recommends that in full consideration of the perpetual life a business
expects to enjoy and the expected costs should as well be considered in relation to the
expected useful life of the franchised business entity. This would enable the acquiring
entity to develop well-structured financial forecasts to aid in recouping the capital
outlays spent on acquisition of the valued petrol stations.

34
5.5 Areas of Further Studies
Drawing from the study findings, it is imperative that further research be done to
unearth the relationship between the choice of a valuation approach and the short-term
financial performance of the acquiring firms. The study also recommends future
research on the motivations and critical factors underlying the choice of asset
valuation approaches in relation to acquisition by cross-listed Oil and Gas Companies
in Kenya.

35
REFERENCES
Bayrak, (2014). Valuation of firms in mergers and acquisitions; University of
Pennsylvania; 2003
Boland, (1992). A theory model of investor sentiment. Journal of Financial
Economics 49:307–43.
Chaplinsky, (2015) Methods of valuation for mergers and acquisitions; University of
Virginia Darden School Foundation, Charlottesville.
Chege, J. (2012). Challenges of strategy implementation for firms in the petroleum
Industry in Kenya. Unpublished MBA Thesis, University of Nairobi.
Durugbo, (2012). A unified theory of under reaction, momentum trading, and
overreaction in asset markets. Journal of Finance 54:2143–84.
Economic Perspectives 4:67–83.
Ellis, (1979). Investor sentiment and stock returns. Financial Analysts Journal
(March–April):16–23.
Foster, (2013). The Clasic M & A Handbook, The Art of M&A; A Merger and
Acquisition Buyout Guide 3rd Edition Investopedia: Mergers and
Acquisitions;
Gavirneni, (2002). The aggregation of investor’s diverse judgments and preferences in
purely competitive security markets. Journal of Financial and Quantitative
Analysis 4: 347–400.
Gervais & Odean (2001). Corporate business valuation for mergers and acquisitions;
International Journal of Strategic Property Management
Gort, H. (1969). Theories to follow in business. Journal of Finance 56:1911–27.
Hearth, 2006). On persistence in mutual fund performance. Journal of Finance 52:57–
82.
Hong, (2014). Bad news travels slowly: Size, analyst coverage, and the profitability of
momentum strategies. Journal of Finance 55:265–95.
Jensen, (1986). A unified theory of under reaction, momentum trading, and over
reaction in asset markets. Journal of Finance 8:100–47.
Lentz and Wang, Journal of Real Estate Research, 1997
Lim, (2016). Forward exchange rates as optimal predictors of future spot rates: An
empirical analysis. Journal of Political Economy 88:829–53.
36
Merrill et al. (2008). The variation in asset valuation and acqusisiton. Journal of
Political Economy 99:385–415.
Mitchell & Mulherin, (1996). Asset valuation in dynamic economies. Journal of
Financial Markets, in press.
Morris, (1988). Asset returns and inflation. Journal of Financial Economics 5:115–46.
Mwangi, B. (2012). Factors that influence relocation of multinational oil companies
based in Kenya to other countries. Unpublished MBA Thesis, University of
Nairobi.
Neal & Wheatley, (2012). The aggregation of asset valuation and preferences in
purely competitive security markets. Journal of Financial and Quantitative
Analysis 4: 347–400.
NOCK (2015). Overview of the Oil and Gas Sector in Kenya. http://nationaloil.co.ke
Pentland, (2004). A unified theory of underreaction, momentum trading, and
overreaction in asset markets. Journal of Finance 54:2143–84.
Rhodes, (2005). Possible theories of asset financing. Review of Financial Studies
52:100–07.
Robertson & Robertson (2014). Service Station Property Market Report 2014.
www.randr.com.au
SAPIA (2015). Annual Report . http://www.sapia.org.za
Schramm, (2015). For HR, HRMagazine, September 2005 Wikipedia: Mergers and
Acquisitions;
Schwarz, G. (2013). Response Rate in European Business Tendency Surveys.
Australian Institute of Economic Research, 1-54.
Shleifer & Vishny, (2004). A theory on asset Valation in the Internet sector. Working
paper. New York University.
Shleifer, & Thaler (2015). Returns to buying winners and selling losers: Implications
for stock market efficiency. Journal of Finance 48:65–91.
Singh, (2012). Can the market add and subtract? Mispricing in tech stock carve-outs.
Working paper, University of Chicago.
Stein, (2016). The stock market boom and crash of 1929 revisited. Journal of
Strong, (1997). Bad news travels slowly: Size, analyst coverage, and the profitability
of momentum strategies. Journal of Finance 55:265–95.

37
Yan, (2008). “Factors affecting the role of HR managers in international mergers and
acquisitions: skills, abilities and competencies of HR managers”; University of
Kassel.

38
APPENDICES
APPENDIX 1: QUESTIONNAIRES
Section A: Background information:
1. Name of your franchised petrol
station…………………………………………..
2. Number of years of operation
Less than 5 years [ ] 5 – 10 years [ ]
11 -15 years [ ] Over 15 years [ ]
Section B: Sales Comparison Approach
Kindly indicate your level of agreement with the statements on Sales Comparison
Approach by using the following scale of 5 points where: 1 = Strongly Disagree, 2 =
Disagree, 3 = Neutral, 4 = Agree and 5 = Strongly Agree
No. Sales Comparison Approach 5 4 3 2 1
1. The firm assesses the value of comparable properties when making
a petrol station acquisition
2. The firm considers the similarities in the petrol stations when
evaluating a petrol station
3. The firm considers the location and physical characteristics of the
comparable property
4. The firm considers the transaction date when the comparable
property was sold or leased
5. The firm considers the size of the comparable property with
respect to the new property before acquiring the same
Section C: Income Approach
Kindly indicate your level of agreement with the statements on Income Approach by
using the following scale of 5 points where: 1 = Strongly Disagree, 2 = Disagree, 3 =
Neutral, 4 = Agree and 5 = Strongly Agree
No. Income Approach 5 4 3 2 1
1. The firm considers the potential annual gross income from the
property before acquisition of the same
2. The firm considers the net operating income from the targeted
property
3. The firm considers the estimated capitalization rate from the target
property
4. The firm considers the expected growth rate of the property
5. The firm considers the expected growth rate of the property
income

39
Section D: Cost Approach
Kindly indicate your level of agreement with the statements on Cost Approach by
using the following scale of 5 points where: 1 = Strongly Disagree, 2 = Disagree, 3 =
Neutral, 4 = Agree and 5 = Strongly Agree
No. Cost Approach 5 4 3 2 1
1. The firm considers the cost of the vacant land before making a
petrol station acquisition
2. The firm considers the cost of building the structures before
making a petrol station acquisition
3. The firm considers the time since the structure was put up before
making a petrol station acquisition
4. The firm considers the replacement cost of the structure before
making a petrol station acquisition
5. The firm considers the purpose of the structure before making a
petrol station acquisition
Section E: Value of Petrol Station
Kindly indicate your level of agreement with the statements on Value of the Petrol
Station by using the following scale of 5 points where: 1 = Strongly Disagree, 2 =
Disagree, 3 = Neutral, 4 = Agree and 5 = Strongly Agree
No. Acquisition of Petrol Stations 5 4 3 2 1
1. Most of the new investors taking over the petrol stations are
corporate investors
2. The new investors use a variety of financial instruments when
acquiring the petrol stations
3. Investors are showing a lot of interest in petrol stations in our area
4. Every year, at least 5 petrol stations are completely acquired by
new investors
5. During the acquisitions, there is total transfer of assets and
liabilities
….. THANKS FOR YOUR PARTICIPATION ……