DETERMINANT FACTORS OF INDONESIAN MILLENNIALS’ …
23
Vol. 4 No. 2 Firm Journal of Management Studies 177 | Halaman DETERMINANT FACTORS OF INDONESIAN MILLENNIALS’ REVISIT INTENTION: A CASE OF LABUAN BAJO Farida Komalasari 1 and Eko Ganiarto 2 [email protected] ¹, [email protected]² 1 Business Administration Programme, Faculty of Business, President University, 2 Management Study Programme, Faculty of Business, President University Abstract In an effort to increase the number of foreign tourists to Indonesia, the government has set Labuan Bajo as one of the four priority tourist destinations, in addition to Lake Toba, Borobudur and Mandalika. Of the four priority areas, Labuan Bajo is the region with the least number of tourist visits, even though Labuan Bajo has its own uniqueness with its Komodo (giant lizard). Therefore a study of the determinants of revisit to Labuan Bajo, especially for millennial groups, is needed. The main purpose of this study is to determine the determinants factors of the revisit intention of the Indonesian millenials to Labuan Bajo. This research is a quantitative study by interviewing 155 respondents of millennial visitors to Labuan Bajo, who were selected by snowball sampling. The research data was processed and analyzed using the SEM (Stuctural Equation Model) model. The results of the study show that new experiences, new knowledge (push factors), historical values, local values and travelling values (pull factors) influence the destination satisfaction. Furthermore, the destination satisfaction affected the revisit intention to Labuan Bajo. Keywords: push factors, pull factors, tourist satisfaction, revisit intention, Labuan Bajo Abstrak Dalam upaya meningkatkan jumlah wisatawan asing ke Indonesia, pemerintah telah menetapkan Labuan Bajo sebagai salah satu dari empat kawasan tujuan wisata prioritas, selain Danau Toba, Borobudur, dan Mandalika. Dari keempat kawasan prioritas tersebut, Labuan Bajo merupakan kawasan yang paling sedikit jumlah kunjungan wisatawannya, meskipun Labuan Bajo mempunyai keunikan tersendiri dengan hewan komodonya. Oleh karena itu studi tentang faktor-faktor penentu dalam melakukan kunjungan kembali ke Labuan Bajo, khususnya bagi kelompok milenial menjadi sangat perlu dilakukan. Tujuan utama penelitian ini adalah untuk mengetahui faktor-faktor penentu dari niat berkunjung kembali para wisatawan ke Labuan Bajo. Penelitian ini merupakan penelitian kuantitatif dengan mewawancarai 155 responden kaum milenial pengunjung Labuan Bajo, yang dipilih secara snowball sampling. Data penelitian diolah dan dianalisis dengan menggunakan model SEM (Stuctural Equation Model). Hasil penelitian menunjukkan bahwa pengalaman baru, pengetahuan baru (faktor-faktor pendorong), nilai historis, nilai lokal dan nilai perjalanan (faktor-faktor penarik) memengaruhi kepuasan terhadap tempat tujuan wisata di Labuan Bajo. Selanjutnya kepuasan terhadap tempat wisata tersebut memengaruhi niat berkunjung kembali ke Labuan Bajo. Kata kunci: faktor pendorong, faktor penarik, kepuasan wisatawan, niat kunjungan kembali, Labuan bajo A. Introduction In an effort to increase the number of tourists to Indonesia, the government has designated 10 tourist destinations as "New Bali", with four priority areas, namely: Lake Toba, Borobudur, Mandalika,
Transcript of DETERMINANT FACTORS OF INDONESIAN MILLENNIALS’ …

Vol. 4 No. 2 Firm Journal of Management Studies
177 | H a l a m a n
DETERMINANT FACTORS OF INDONESIAN MILLENNIALS’ REVISIT INTENTION:
A CASE OF LABUAN BAJO
Farida Komalasari1 and Eko Ganiarto2
[email protected] ¹, [email protected]² 1Business Administration Programme, Faculty of Business, President University, 2Management Study Programme,
Faculty of Business, President University
Abstract
In an effort to increase the number of foreign tourists to Indonesia, the government has set Labuan Bajo as one of the four priority tourist destinations, in addition to Lake Toba, Borobudur and Mandalika. Of the four priority areas, Labuan Bajo is the region with the least number of tourist visits, even though Labuan Bajo has its own uniqueness with its Komodo (giant lizard). Therefore a study of the determinants of revisit to Labuan Bajo, especially for millennial groups, is needed. The main purpose of this study is to determine the determinants factors of the revisit intention of the Indonesian millenials to Labuan Bajo. This research is a quantitative study by interviewing 155 respondents of millennial visitors to Labuan Bajo, who were selected by snowball sampling. The research data was processed and analyzed using the SEM (Stuctural Equation Model) model. The results of the study show that new experiences, new knowledge (push factors), historical values, local values and travelling values (pull factors) influence the destination satisfaction. Furthermore, the destination satisfaction affected the revisit intention to Labuan Bajo.
Keywords: push factors, pull factors, tourist satisfaction, revisit intention, Labuan Bajo
Abstrak
Dalam upaya meningkatkan jumlah wisatawan asing ke Indonesia, pemerintah telah menetapkan Labuan Bajo sebagai salah satu dari empat kawasan tujuan wisata prioritas, selain Danau Toba, Borobudur, dan Mandalika. Dari keempat kawasan prioritas tersebut, Labuan Bajo merupakan kawasan yang paling sedikit jumlah kunjungan wisatawannya, meskipun Labuan Bajo mempunyai keunikan tersendiri dengan hewan komodonya. Oleh karena itu studi tentang faktor-faktor penentu dalam melakukan kunjungan kembali ke Labuan Bajo, khususnya bagi kelompok milenial menjadi sangat perlu dilakukan. Tujuan utama penelitian ini adalah untuk mengetahui faktor-faktor penentu dari niat berkunjung kembali para wisatawan ke Labuan Bajo. Penelitian ini merupakan penelitian kuantitatif dengan mewawancarai 155 responden kaum milenial pengunjung Labuan Bajo, yang dipilih secara snowball sampling. Data penelitian diolah dan dianalisis dengan menggunakan model SEM (Stuctural Equation Model). Hasil penelitian menunjukkan bahwa pengalaman baru, pengetahuan baru (faktor-faktor pendorong), nilai historis, nilai lokal dan nilai perjalanan (faktor-faktor penarik) memengaruhi kepuasan terhadap tempat tujuan wisata di Labuan Bajo. Selanjutnya kepuasan terhadap tempat wisata tersebut memengaruhi niat berkunjung kembali ke Labuan Bajo.
Kata kunci: faktor pendorong, faktor penarik, kepuasan wisatawan, niat kunjungan kembali, Labuan bajo
A. Introduction
In an effort to increase the number of tourists to Indonesia, the government has designated 10
tourist destinations as "New Bali", with four priority areas, namely: Lake Toba, Borobudur, Mandalika,
Vol. 4 No. 2 Firm Journal of Management Studies
178 | H a l a m a n
and Labuan Bajo. Comparing to three other priority destination areas, Laboan Bajo has the lowest number
of visitors. In 2017, the number of visitors to Labuan Bajo were 122,000 visitors, while the number of
visitors to Lake Toba, Borobudur, and Mandalika were 300,000, 750,000, and 3,800,000 visitors
respectively (Republika, 2017; Kompas, 2018). In other side, Labuan Bajo has a very unique attraction.
So, what should we do to develop Labuan bajo to become favourite tourist destination, especially for
millennial domestic traveller, who have the big portion (29.3 percent) of domestic visitors in Indonesia?
Many pieces of information are needed to develop Labuan Bajo, to increase the number of visitor; such as
what are a favourite destination in Labuan Bajo? How satisfied are they? What are the determinant factor
of tourist visit intention? Do they want to recommend other to visit Labuan Bajo? To get the answer of
those questions, this research will be done.
The aims of this research are:
1. To determine the favourite destination in Labuan Bajo
2. To know the visitors’ satisfaction to Labuan Bajo
3. To know the determinant factors of tourist revisit intention to Labuan Bajo
4. To know the visitors’ willingness to remommend other to visit Labuan Bajo
B. Theoritical Review
Tourist Revisit Intention and Willingness to Recommend
Customer activities in travel and tourism industry could be devided into three main parts, those
are pre-visitation, during visitation, and post-visitation. Revisit (return) intention is a part of post-
visitation. It refers to the customer intention to revisit the same destination and willingness to recommend
it to others (summarized from Chen & Tsai (2007), Som, Marzuki, Yousefi & Khalifeh (2012)).
Willingness to recommend is the real action of word-of-mouth (WOM). In the era of digital
technology, WOM could be done by social media widely. It is needed by T&T industry to increase the
number of traveler with minimum marketing cost. Therefore, willingness of experienced visitors to
recommend other to visit a certain tourist destination is important.
Visitors’ revisit intention is determined by tourist destination satisfaction. A study done Som et
al. (2012) in Sabah, Malaysia, mentioned that tourists’ experience during visitation part give significant
impact on their willingness to revisit intention and recommend it to others. In Ho Chi Minh, Vietnam,
Khuong & Ha (2014) found that visitors’ revisit intention was affected by destination satisfaction. This
research result inspired Putra (2016) to use Khuong & Ha’s theoritical framework to do research in Bali.

Vol. 4 No. 2 Firm Journal of Management Studies
179 | H a l a m a n
He found that destination satisfaction significantly affects visitors’ revisit intention to Water Sport in
Tanjung Benoa, Bali.
Tourist Destination Satisfaction
Tourist destination satisfaction is the overall enjoyment felt as the result of the tour experiences.
Tourist automatically compares their pre-visitation knowledge and their experience during visitation. So,
destination satisfaction is about the comparison between the tourist’s expectation before visiting the
destination and experience during visitation at destination (summarized from Chen & Tsai (2007),
McDowall (2010), Osman (2013), Ngoc & Trinh (2015)).
Tourist destination satisfaction is affected by tourit’s needs, wants and desires (Osman, 2013),
natural and cultural environment (Ngoc & Trinh, 2015). In addition, Prebensen, Skallerud & Chen (2010)
found that tourist motivation has significant impact on satisfaction and the word of mouth (wom)-effect.
More detail, needs, wants, desire, natural environment, and cultural environment are included on tourist
motivation, which will be explained in the following sub-chapter.
The Tourist Motivation
Dann (1977) (cited by Komalasari & Zharfan, 2017) is the first author that introduced a theory in
travel motivation, consists of push and pull factors. Push factor refers to internal factor and pull factor
refers to external factor. These two factors were motivational influences and showcased the beneficial
attributes of a destination. These all factors determine the who, what, why, where and when tourist make
decision of vacation planning. Tabel 2.1 is the detail of the push-pull factors, based on Uysal & Hagan
(1993) (cited by Komalasari & Zharfan, 2017)
Table 1
Push and Pull Framework of Tourism Motivations
Origin (Push Factors) Destination (Pull Factors) 1. Motivations:
− Escape − Rest and Relaxation − Self-esteem − Prestige − Health and Fitness − Adventure − Social Interaction − Benefits − Interests
2. Socioeconomic and Demographic
1. Destination Attributes and Type of Facilities: − Climate − History Sights − Scenic beauty − Sunshine − Beaches − Snow − Cultural Events − Recreational Opportunities − Benefot Expectations

Vol. 4 No. 2 Firm Journal of Management Studies
180 | H a l a m a n
Factors: − Age − Gender − Income − Education − Famili-life Cycle and Size − Race/Ethnic Group − Occupation − Second Home Ownership
3. Market Knowledge
2. Assessibility 3. Maintenance/Situational Factors:
− Safety − Security − Seasonality
4. Market Images: − Formed Negative/Positive
Destination Images − Quality of Services − Quality of Facilities
Source: Uysal & Hagan (1993) in Komalasari & Zharfan (2017)
C. Research Method
Theoretical Framework and Hypotheses
Based on the literature review and previous research, push and pull factors are proved to become
the factors of destination satisfaction. Furthermore, destination satisfaction affects revisit intention. This
research uses two models, they are the push factors model and the pull factors model. The theoretical
framework of these models could be figured out in Figure 1 and Figure 2.
Figure 1
Push Factors Model Framework
According to the theoretical framework in Figure 1, the hypotheses are as follow:
1. Push factors influence destination satisfaction
2. Destination satisfaction influences revisit intention
Figure 2
Push Factors Model Framework
According to the theoretical framework in Figure 2, the hypotheses are as follow:
1. Pull factors influence destination satisfaction
2. Destination satisfaction influences revisit intention
Destination Satisfaction
Revisit Intention Push Factors
Destination Satisfaction
Revisit Intention Pull Factors

Vol. 4 No. 2 Firm Journal of Management Studies
181 | H a l a m a n
The complete hypotheses will be formulated in the factor analysis section.
Variables, Variables Measurement and Research Instrument
This research needs data about the three variables, whether in the push factors model or in the pull
factors model. For the push and pull factors, they are measured by using Likert scale, with 5 levels. The
destination satisfaction variable (named as SATISFACTION) is measured by rating the respondent’s
experience of 16 factors using interval scale, from 1 (low) to 5 (high). The revisit intention variable
(named as REVISIT) is measured by rating the respondent’s willingness to revisit using interval scale,
from 1 (low) to 5 (high).
Factoring process is used to determine the push and pull variables. The number of push and pull
variables formed and its name will be explained later. At the end, all the variables are organized in a set
of questionnaire. The questionnaire does not only consist of the push and pull factors (variables), but also
about the respondent profile.
Data Collection Method and Sampling Design
This research is quantitative research using primary data. The primary data are collected directly
from Labuan Bajo visitors, using questionnaire. The content validity and reliability test will be applied to
test the validity and reliability of each construct, as the most important part of the questionnaire.
The samples are drawn from the population of Indonesian millenials who have experience visiting
Labuan Bajo. The number of respondents are 155 respondents, selected using non-probability sampling,
which is snowball sampling.
Data Analysis Method
The data was analysed by using a statistical software throgh some steps as follow:
1. Descriptive Analysis, to figure out the respondents profile, favourite destinations, respondents
satisfaction, and destination worthiness (gain of new knowledge and experiences, value of money,
willingness to revisit, and willingness to recommend to others.
2. Factor Analyses, to determine the push and pull variables.
3. Structural Equation Model (SEM) Analysis, to examine the influence of push and pull factors to the
destination satisfaction and the influence of destination satisfaction to the revisit intention.

Vol. 4 No. 2 Firm Journal of Management Studies
182 | H a l a m a n
D. Result and Discussion
Descriptive Analysis
Respondents Profile
The Figure 3 below show some profiles of the respondents. All respondents are from the milenial
generation that were born in 1980 – 2000.
The total respondent in this research are 155 respondents, that consist of 90 males (58 percent)
and 65 females (42 percent). Sixty five percent of their highest education is undergraduate program.
Almost half of them (45.2 percent) are students and 38.7 percent are employee. Most of the respondents
are single (79.4 percent).
Most of the respondents are there for their first visit to Labuan Bajo (86.5 percent), while the rest
is fore their second visit (9 percent), the third and more (4.5 percent). To travel to Labuan Bajo, almost
half of the respondents (44.5 percent) spend around Rp 5,000,000 – Rp7,500,000/trip/person. Eighty
percent of the respondents go with their friends
Figure 3
The Respondent’s Profile
(a) (b) (c)
(d) (e) (f)

Vol. 4 No. 2 Firm Journal of Management Studies
183 | H a l a m a n
Destinations
There some tourism destinations in Labuan Bajo. From sixteen tourism destinations, there are
seven places considered as the most favourite destinations. They are Pulau Rinca, which is 87 percent
respondents most likely to visit, Pulau Padar (84 percent), Gili Laba (84 percent), Pantai Pink (83
percent), Pulau Kanawa (77 percent), Pulau Komodo (75 percent), Pulau Kelor (74 percent), and Manta
Point (63 percent). Figure 4 shows the places that are considered as the favourite destinations according
to the respondents.
Figure 4
Favourite Destinations in Labuan Bajo
Respondent Satisfaction
Overall, respondent will feel satisfied after travelling to Labuan Bajo. On the average, 66 percent
respondents give a high score for the satisfaction value. Figure 5 below shows the proportion of
respondents feel satisfied by the satisfaction type. It can be seen that the respondents were not satisfied
0% 20% 40% 60% 80% 100%
Manta Point
Pulau Kelor
Pulau Komodo
Pulau Kanawa
Pantai Pink
Pulau Padar
Gili Laba
Pulau Rinca
63%
74%
75%
77%
83%
84%
84%
87%
Percentages of Respondent Most Likely to Visit
Favourite Destination

Vol. 4 No. 2 Firm Journal of Management Studies
184 | H a l a m a n
with restaurant quality (48 percent) and the traffic condition (33 percent), also for the hotel quality (56
percent), land transportation (57 percent), cullinary (57 percent) and tidiness of public area (59 percent).
Figure 5 Satisfied Respondent by the Type of Satisfaction
The Destination Worthiness
There are some indicators used to indicate the destination’s worthiness of Labuan Bajo. They are
gaining new knowledge and experiences, the value of money spent in Labuan Bajo, the willingness to
revisit and the willingness to recommend the others. Figure 6 shows that the destinations’ worthiness of
Labuan Bajo is so high. There are 87.7 percent respondents who gave the high score for gaining new
knowledge and experiences. While the value of money spent in Labuan Bajo, willingness to revisit and
willingness to recommend Labuan Bajo to others are 86.4 percent, 91.6 percent and 94.9 percent
respectively.
0,0% 20,0% 40,0% 60,0% 80,0% 100,0%
Traffict
Hotel Quality
Cullinary
Safety
Language and Communication
Hospitality
Lanscape
Greenary
33%48%
56%57%57%
59%61%
63%71%72%
74%78%79%80%
83%85%
Types of Satisfaction
Percentages of Satisfied Respondent

Vol. 4 No. 2 Firm Journal of Management Studies
185 | H a l a m a n
Figure 6
The Destinations’ Worthiness of Labuan Bajo
Factor Analysis
Push Factor Variables
Based on factor analysis, there are five push factors (variables) formed. Each formed variable is
as follows:
a. Sightseeing, which consist of statements about:
(1) Physically relaxed
(2) Satisfying the desire to be somewhere else
(3) Seeking for novelty
(4) Sighseeing for scenic attractions
(5) Sightseeing tourism spot
Finally, this factor is deleted and not to be continued for the next analysis (SEM Analysis) since
its loading factor is low or it is not good enough to explain the construct.
b. New Experience, named as NEWEXPER, is formed from statements about:
(1) New experience and different life styles or traditions
(2) Exploring cultural resources
(3) Having an enjoyable time
(4) Participating in new activities
c. New Knowledge, named as NEWKNOW, is formed from statements about:
(1) To enhance communication with local community
(2) To improve knowledge
(3) To exchange customs and traditions
(4) Meeting new people
d. Social Status, named as SOCSTATUS, is formed from statements about:
(1) Increasing social status
0,0%
50,0%
100,0%
Gain of NewKnowledge
andExperiences
Value ofMoney
Willingnessto Revisit
Willingnessto
Recommendto Others
87,7% 86,4% 91,6% 94,9%
Respondent (%)

Vol. 4 No. 2 Firm Journal of Management Studies
186 | H a l a m a n
(2) Learning about the history
(3) Visiting friends and relatives
(4) Visiting impressive destinations
e. Visiting Place, named as VISPLACE, is formed from statements about:
(1) To be away from home
(2) Visiting a place that friends have not been to
(3) Visiting a place that friends have been to
(4) Visiting a place that you have not been visited before
Pull Factor Variables
There are five factors (variables) formed based on the factoring process. Each formed variable is
as follows:
a. Historical Value, named as HISVALUE which consist of statements about:
(1) Activities for the entire family
(2) Affordable tourist destinations
(3) Availability of pre-trip tourist info
(4) Historical locations
(5) Historical reenactment
(6) History
(7) Warm welcome for tourists
b. Local Value, named as LOCVALUE which consist of statements about:
(1) Interesting cullinary
(2) Reliable weather/climate
(3) Save destination/personal safety
(4) Souvenirs
(5) Standards of hygiene and cleanliness
c. Culture and Heritage, named as CULTURHER which consist of statements about:
(1) Culture, arts and traditions
(2) Festival and events
(3) Good transportation
(4) Heritage sites
d. Travelling Value, named as TRAVALUE which consist of statements about:
(1) Travelling to a nearby destination
(2) Travelling to a place people appreciate
Vol. 4 No. 2 Firm Journal of Management Studies
187 | H a l a m a n
(3) Value of money
(4) Variety of short tours
e. Attraction, which consist of statements about:
(1) Outdoor activities
(2) Outstanding scenic attraction
Like Sightseeing (push factor), this factor is also deleted and not to be continued for the next
analysis (SEM Analysis) since its loading factor is low or it is not good enough to explain the
construct.
As stated above, now there are four variables of push factors (New experience, New knowledge,
Social status, and Historical value) and four variables of pull factors (Historical value, Local value,
Culture and heritage, and Travel value). Those variables are used in the SEM analysis as independent
variables that influence the destination satisfaction (SATISFACTION), whether in the Push Factors
Model or in the Pull Factors Model. Then the destination satisfaction influences the revisit intention
(REVISIT).
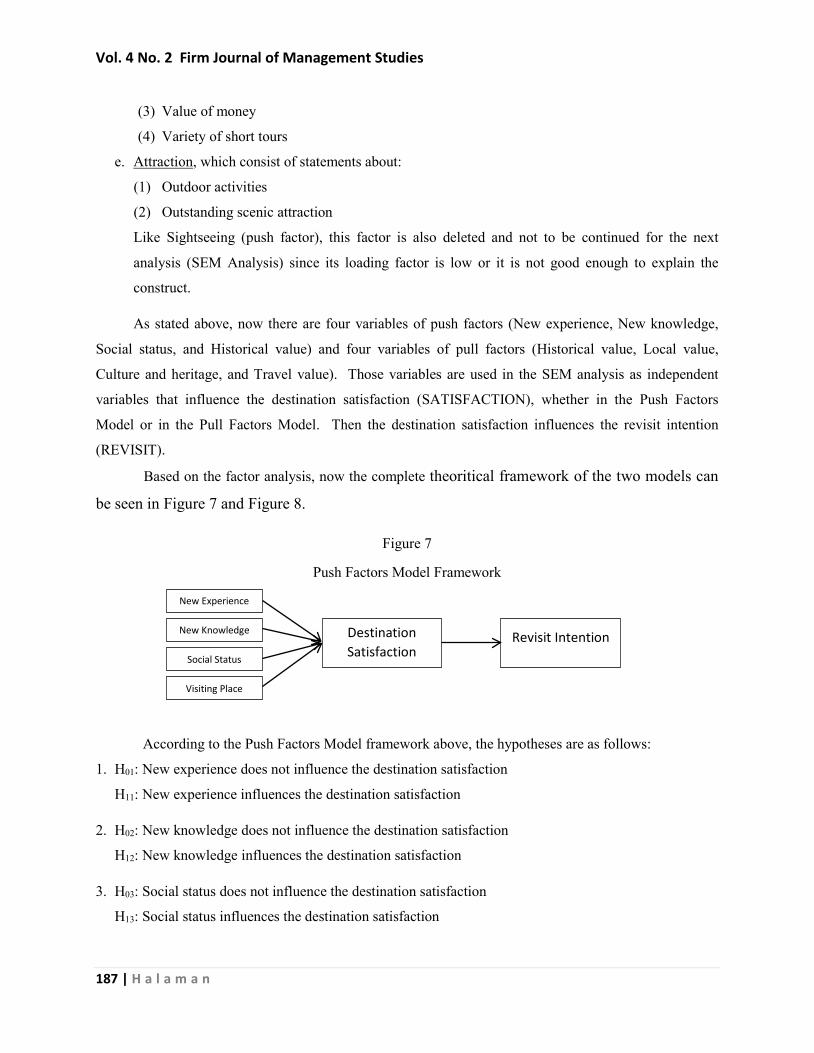
Based on the factor analysis, now the complete theoritical framework of the two models can
be seen in Figure 7 and Figure 8.
Figure 7
Push Factors Model Framework
According to the Push Factors Model framework above, the hypotheses are as follows:
1. H01: New experience does not influence the destination satisfaction
H11: New experience influences the destination satisfaction
2. H02: New knowledge does not influence the destination satisfaction
H12: New knowledge influences the destination satisfaction
3. H03: Social status does not influence the destination satisfaction
H13: Social status influences the destination satisfaction
New Experience
Destination Satisfaction
Revisit Intention New Knowledge
Social Status
Visiting Place

Vol. 4 No. 2 Firm Journal of Management Studies
188 | H a l a m a n
4. H04: Visiting place does not influence the destination satisfaction
H14: Visiting place influences the destination satisfaction
5. H05: Destination satisfaction does not influence the revisit intention
H15: Destination satisfaction influences the revisit intention
Figure 8
Pull Factors Model Framework
According to the Pull Factors Model framework above, the hypotheses are as follows:
1. H06: Historical value does not influence the destination satisfaction
H16: Historical value influences the destination satisfaction
2. H07: Local value does not influence the destination satisfaction
H17: Local value influences the destination satisfaction
3. H08: Culture-heritage does not influence the destination satisfaction
H18: Culture-heritage influences the destination satisfaction
4. H09: Travelling value does not influence the destination satisfaction
H19: Travelling value influence the destination satisfaction
5. H010: Destination satisfaction does not influence the revisit intention
H110: Destination satisfaction influences the revisit intention
Inferential Analysis (SEM Analysis)
Push Factors Model The Model
In push factors model, there are six variables. Four variables as independent variables, they are
new experience (NEWEXPER), new knowledge (NEWKNOW), social status (SOCSTATUS), and
visiting place (VISPLACE). Revisit intention (REVISIT) is an dependent variable, and destination
satisfaction (SATISFACTION) as an intervening variable. The model of push factors can be seen in
Figure 9.
Historical Value
Destination Satisfaction
Revisit Intention Local Value
Culture-Heritage
Travelling Value
Vol. 4 No. 2 Firm Journal of Management Studies
189 | H a l a m a n
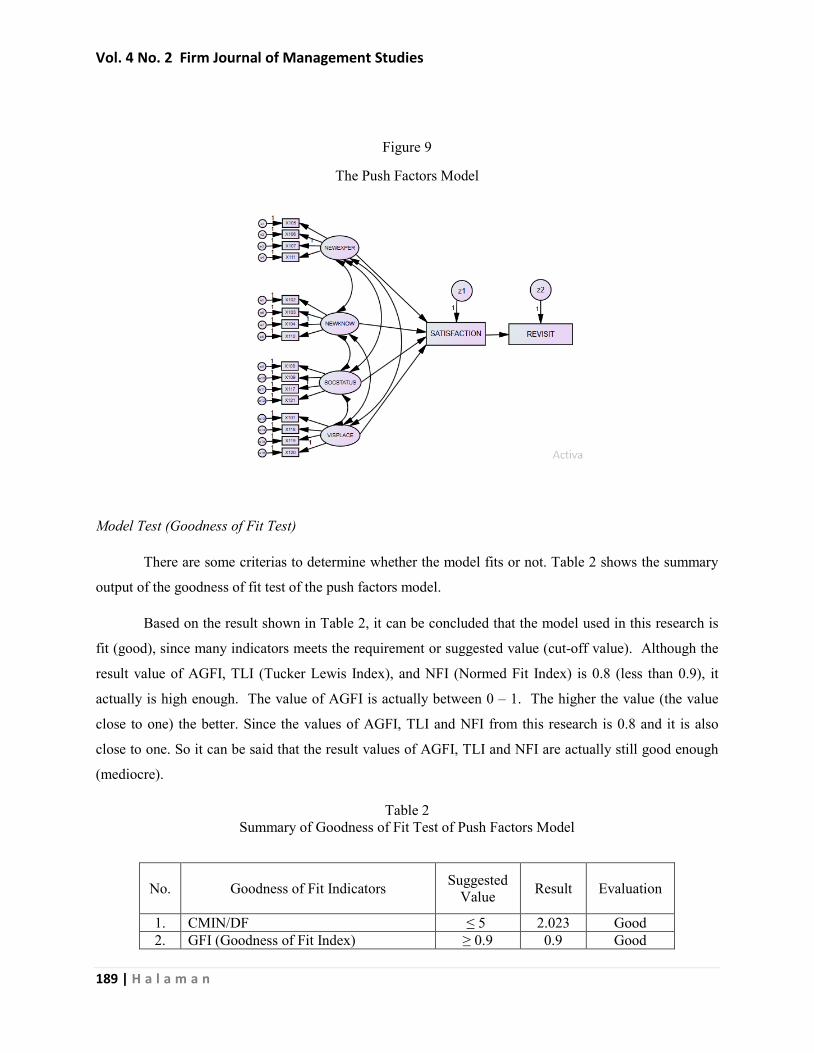
Figure 9
The Push Factors Model
Model Test (Goodness of Fit Test)
There are some criterias to determine whether the model fits or not. Table 2 shows the summary
output of the goodness of fit test of the push factors model.
Based on the result shown in Table 2, it can be concluded that the model used in this research is
fit (good), since many indicators meets the requirement or suggested value (cut-off value). Although the
result value of AGFI, TLI (Tucker Lewis Index), and NFI (Normed Fit Index) is 0.8 (less than 0.9), it
actually is high enough. The value of AGFI is actually between 0 – 1. The higher the value (the value
close to one) the better. Since the values of AGFI, TLI and NFI from this research is 0.8 and it is also
close to one. So it can be said that the result values of AGFI, TLI and NFI are actually still good enough
(mediocre).
Table 2 Summary of Goodness of Fit Test of Push Factors Model
No.
Goodness of Fit Indicators Suggested
Value
Result
Evaluation
1. CMIN/DF ≤ 5 2.023 Good 2. GFI (Goodness of Fit Index) ≥ 0.9 0.9 Good

Vol. 4 No. 2 Firm Journal of Management Studies
190 | H a l a m a n
3. AGFI (Adjusted Goodness of Fit Index) ≥ 0.9 0.8 Mediocre 3. IFI (Incremental Fit Index) ≥ 0.9 0.9 Good 4. CFI (Comparative Fit Index) ≥ 0.9 0.9 Good 5. TLI (Tucker Lewis Index) ≥ 0.9 0.8 Mediocre 6. NFI (Normed Fit Index) ≥ 0.9 0.8 Mediocre 7. RMR (Root Mean Residual) < 0.08 0.08 Good
Reliability and Validity Test of Construct
Reliability Test
The objective of this test is to know the consistency of the indicators of the latent variable
(construct) that indicate a general formed variable. The formula of the construct reliability test as
follows:
Construct Reliability (CR) = (Σ standardize loading)2/[(Σ standardize loading)2 + Σεj]
The cut-off value of CR is 0.7. If the value of CR ≥ 0.7 it means that the construct formed is
reliable. Otherwise, it is not reliable.
Table 3 shows the value of construct reliability (CR) of the push variables (NEWEXPER,
NEWKNOW, SOCSTATUS, and VISPLACE). Since all the CR values of push variables are higher than
0.70, it can be concluded that the formed constructs/variables (NEWEXPER, NEWKNOW,
SOCSTATUS, and VISPLACE) are reliable.
Validity Test
Table 4 shows how each indicator (X101 – X121) can explain its construct (variable) and how the
independent variables influence the dependent variable. It can be seen from Table 4 that the P
(probability) value of all indicators (X101 – X121) are significant at p = 0.001 (less than 0.05), shown as
*** in Table 4. So, it can be concluded that all indicators are valid or they can explain its construct.
Vol. 4 No. 2 Firm Journal of Management Studies
191 | H a l a m a n
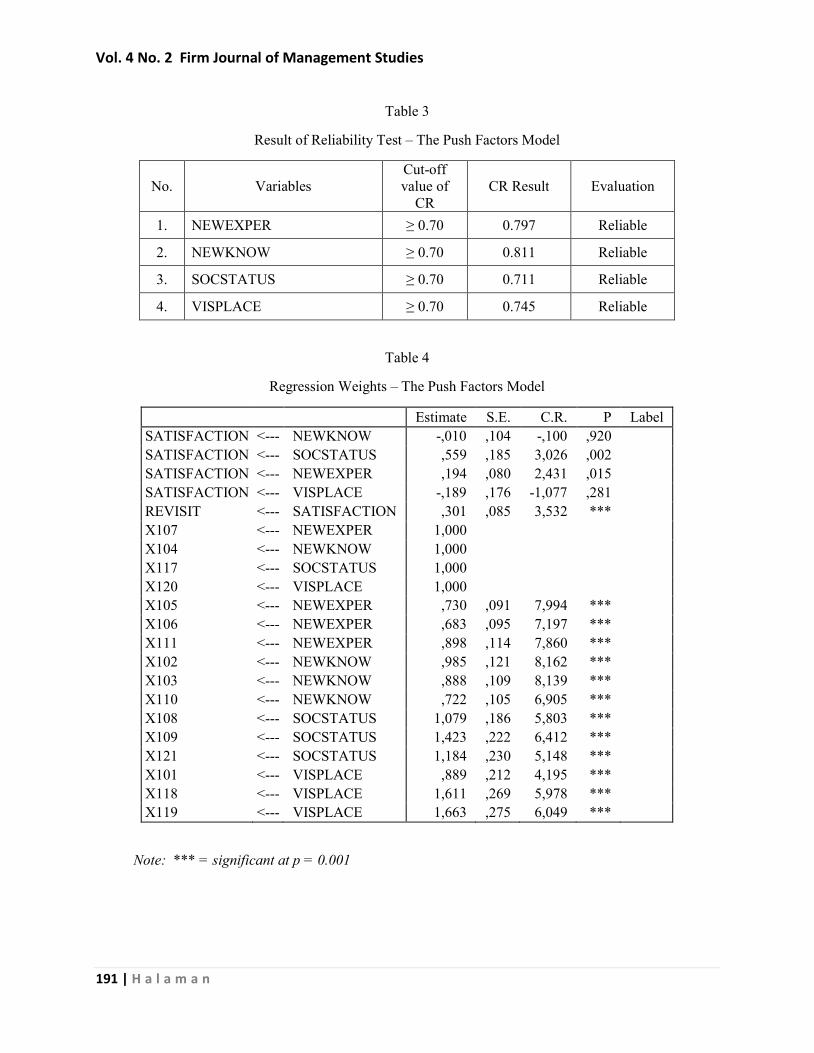
Table 3
Result of Reliability Test – The Push Factors Model
No.
Variables
Cut-off value of
CR
CR Result
Evaluation
1. NEWEXPER ≥ 0.70 0.797 Reliable
2. NEWKNOW ≥ 0.70 0.811 Reliable
3. SOCSTATUS ≥ 0.70 0.711 Reliable
4. VISPLACE ≥ 0.70 0.745 Reliable
Table 4
Regression Weights – The Push Factors Model
Estimate S.E. C.R. P Label SATISFACTION <--- NEWKNOW -,010 ,104 -,100 ,920 SATISFACTION <--- SOCSTATUS ,559 ,185 3,026 ,002 SATISFACTION <--- NEWEXPER ,194 ,080 2,431 ,015 SATISFACTION <--- VISPLACE -,189 ,176 -1,077 ,281 REVISIT <--- SATISFACTION ,301 ,085 3,532 *** X107 <--- NEWEXPER 1,000 X104 <--- NEWKNOW 1,000 X117 <--- SOCSTATUS 1,000 X120 <--- VISPLACE 1,000 X105 <--- NEWEXPER ,730 ,091 7,994 *** X106 <--- NEWEXPER ,683 ,095 7,197 *** X111 <--- NEWEXPER ,898 ,114 7,860 *** X102 <--- NEWKNOW ,985 ,121 8,162 *** X103 <--- NEWKNOW ,888 ,109 8,139 *** X110 <--- NEWKNOW ,722 ,105 6,905 *** X108 <--- SOCSTATUS 1,079 ,186 5,803 *** X109 <--- SOCSTATUS 1,423 ,222 6,412 *** X121 <--- SOCSTATUS 1,184 ,230 5,148 *** X101 <--- VISPLACE ,889 ,212 4,195 *** X118 <--- VISPLACE 1,611 ,269 5,978 *** X119 <--- VISPLACE 1,663 ,275 6,049 ***
Note: *** = significant at p = 0.001

Vol. 4 No. 2 Firm Journal of Management Studies
192 | H a l a m a n
Hypothesis Test
The hypotheses test can be done based on the SEM analysis output in Table 4 by seeing the
column P (probability). If p-value is less than 0.05, then the H0 is rejected or H1 is accepted. Otherwise, if
p-value is more than 0.05, then H0 is not rejected (accepted) or H1 is rejected. The result of hypothesis
test can be seen in Table 5.
Table 5
Summary Result of Hypothesis Test – The Push Factors Model
No.
Hypothesis be Tested p-value
Decision
Conclusion (Result)
1. H01: New experience does not influence the destination satisfaction
0.015 H01 is rejected New experience influences the destination satisfaction
2. H02: New knowledge does not influence the destination satisfaction
0.920 H02 is not rejected New knowledge does not influence the destination satisfaction
3. H03: Social status does not influence the destination satisfaction
0.002 H03 is rejected Social status influences the destination satisfaction
4. H04: Visiting place does not influence the destination satisfaction
0.281 H04 is not rejected Visiting place does not influence the destination satisfaction
5. H05: Destination satisfaction does not influence the revisit intention
0.001 H05 is rejected Destination satisfaction influences the revisit intention
It can be seen in Table 5 that variable NEWEXPER (New experience) influences destination
satisfaction significantly, since the visitors feel that travel to Labuan Bajo like being an adventurer who
can find something new, new environment, new people, new culture, new life style and participating in
activities. These conditions are in line with the thinking of Uysal & Hagan (1993, cited by Komalasari &
Zharfan, 2017) who stated that the adventure was one of the elements in tourism motivations. Motivation
it self is one of push factors in tourism motivations. The higher the adventurous spirit of the
visitor/tourist, the higher the tourism motivations. Then it tends to appreciate something new and
ultimately give satisfaction to them.
Similar to the NEWEXPER variable, the SOCSTATUS (social status) variable also has a
significant effect on destination satisfaction. In the era of social media nowadays, social status seems to
be something important. Many people want to show to others about what they do and they experience,

Vol. 4 No. 2 Firm Journal of Management Studies
193 | H a l a m a n
include travelling to unique tourism destination like Labuan Bajo. Thus they feel proud and can improve
their social status too, especially for the the millenial generation. Furthermore, the increasing of social
status will provide the destination satisfaction of traveler/tourists.
The variable NEWKNOW (New Knowledge) and VISPLACE (Visiting Place) do not influence
on destination satisfaction. The millenial generation feel that travel to Labuan Bajo is not to improve
their knowledge, or to exchange custums and new traditions. Also it is not just visiting a new place. But,
they tend more to be an adventurer and having the high social status.
Pull Factors Model The Model
In pull factors model, there are six variables also. Four variables as independent variables, they
are historical value (HISVALUE), local value (LOCVALUE), culture-heritage (CULTURHER), and
travel value (TRAVALUE). Revisit intention (REVISIT) is a dependent variable, and destination
satisfaction (SATISFACTION) as an intervening variable (see Figure 10.
Figure 10
The Pull Factors Model
Model Test (Goodness of Fit Test)
There are some criterias to determine whether the model fits or not. Table 5 shows the summary
output of the goodness of fit test of the pull factors model.

Vol. 4 No. 2 Firm Journal of Management Studies
194 | H a l a m a n
Based on the result shown in Table 5, it can be concluded that the model used in this research is
fit enough (mediocre), since many indicators a little bit below the cut-off value (0.9) except the value of
CMIN/DF and RMR that meets the requirement or suggested value (cut-off value). Although many
indicators (GFI, AGFI, IFI, CFI, TLI and NFI) do not meet the requirement, the result value of GFI,
AGFI, IFI, CFI, TLI and NFI is 0.8 (less than 0.9), it actually is high enough (mediocre). The value of
GFI, AGFI, IFI, CFI, TLI and NFI is actually between 0 – 1. The higher the value (the value close to
one) the better. Since the result values of GFI, AGFI, IFI, CFI, TLI and NFI from this research is 0.8 and
it is also close to one. So it can be said that the result values of GFI, AGFI, IFI, CFI, TLI and NFI are
actually still good enough (mediocre).
Table 6
Summary of Goodness of Fit Test of Pull Factors Model
No.
Goodness of Fit Indicators Suggested
Value
Result
Evaluation
1. CMIN/DF ≤ 5 2.623 Good 2. GFI (Goodness of Fit Index) ≥ 0.9 0.8 Mediocre 3. AGFI (Adjusted Goodness of Fit Index) ≥ 0.9 0.7 Mediocre 3. IFI (Incremental Fit Index) ≥ 0.9 0.8 Mediocre 4. CFI (Comparative Fit Index) ≥ 0.9 0.8 Mediocre 5. TLI (Tucker Lewis Index) ≥ 0.9 0.8 Mediocre 6. NFI (Normed Fit Index) ≥ 0.9 0.8 Mediocre 7. RMR (Root Mean Residual) < 0.08 0.07 Good
Reliability and Validity Test of Construct
Reliability Test
Table 7 shows the value of construct reliability (CR) of the pull variables (HISVALUE,
LOCVALUE, CULTURHER and TRAVALUE). Since all the CR values of pull variables are higher
than 0.70, it can be concluded that the formed constructs/variables (HISVALUE, LOCVALUE,
CULTURHER and TRAVALUE) are reliable.
Validity Test
Table 8 shows how each indicator (X201 – X222) can explain its construct (variable) and how the
independent variables influence the dependent variable. It can be seen from Table 8 that the P

Vol. 4 No. 2 Firm Journal of Management Studies
195 | H a l a m a n
(probability) value of all indicators (X201 – X222) are *** which mean that they are significant at p =
0.001 (less than 0.05). So, it can be concluded that all indicators are valid or they can explain its
construct.
Table 7 Result of Reliability Test – The Pull Factors Model
No.
Variables
Cut-off value of
CR
CR Value
Evaluation
1. HISVALUE ≥ 0.70 0.893 Reliable
2. LOCVALUE ≥ 0.70 0.832 Reliable
3. CULTURHER ≥ 0.70 0.836 Reliable
4. TRAVALUE ≥ 0.70 0.753 Reliable
Table 8
Regression Weights – The Pull Factors Model
Estimate S.E. C.R. P Label SATISFACTION <--- LOCVALUE ,252 ,078 3,243 ,001 SATISFACTION <--- CULTURHER ,101 ,106 ,951 ,342 SATISFACTION <--- HISVALUE ,144 ,061 2,382 ,017 SATISFACTION <--- TRAVALUE ,285 ,117 2,434 ,015 X201 <--- HISVALUE ,800 ,086 9,292 *** REVISIT <--- SATISFACTION ,301 ,085 3,532 *** X208 <--- HISVALUE 1,000 X215 <--- LOCVALUE 1,000 X206 <--- CULTURHER 1,000 X221 <--- TRAVALUE 1,000 X202 <--- HISVALUE ,563 ,071 7,895 *** X203 <--- HISVALUE ,516 ,062 8,331 *** X209 <--- HISVALUE 1,052 ,059 17,860 *** X210 <--- HISVALUE ,977 ,059 16,531 *** X222 <--- HISVALUE ,533 ,067 7,922 *** X211 <--- LOCVALUE ,958 ,124 7,755 *** X214 <--- LOCVALUE ,771 ,120 6,416 *** X216 <--- LOCVALUE 1,294 ,145 8,947 *** X217 <--- LOCVALUE 1,142 ,122 9,381 *** X204 <--- CULTURHER 1,336 ,157 8,491 *** X205 <--- CULTURHER 1,349 ,162 8,344 ***

Vol. 4 No. 2 Firm Journal of Management Studies
196 | H a l a m a n
Estimate S.E. C.R. P Label X207 <--- CULTURHER 1,125 ,147 7,664 *** X218 <--- TRAVALUE 1,021 ,177 5,779 *** X219 <--- TRAVALUE 1,128 ,174 6,476 *** X220 <--- TRAVALUE 1,223 ,194 6,301 ***
Note: *** = significant at p = 0.001
Hypothesis Test
The same with the push factors model, the hypotheses test also can be done based on the SEM
analysis output in Table 8 above, by seeing the column P (probability). If p-value is less than 0.05, then
the H0 is rejected or H1 is accepted. Otherwise, if p-value is more than 0.05, then H0 is not rejected
(accepted) or H1 is rejected. The result of hypothesis test can be seen in Table 9.
Table 9
Summary Result of Hypothesis Test – The Pull Factors Model
No.
Hypothesis to be Tested p-value
Decision
Conclusion (Result)
1. H06: Historical value does not influence the destination satisfaction
0.017 H06 is rejected Historical value influences the destination satisfaction
2. H07: Local value does not influence the destination satisfaction
0.001 H07 is rejected Local value influences the destination satisfaction
3. H08: Culture-heritage does not influence the destination satisfaction
0.342 H08 is not rejected Culture-heritage does not influence the destination satisfaction
4. H09: Travelling value does not influence the destination satisfaction
0.015 H09 is rejected Travelling value influences the destination satisfaction
5. H010: Destination satisfaction does not influence the revisit intention
0.001 H010 is rejected Destination satisfaction influences the revisit intention
The variable HISVALUE (Historical value) influence sigificantly on destination satisfaction. It is
understandable that Labuan Bajo is a very unique place because it is the only place in the world where

Vol. 4 No. 2 Firm Journal of Management Studies
197 | H a l a m a n
ancient animals (dragons) that are still life in the world can be found. This factor is the main attraction for
visitors to visit Labuan Bajo. Generally, visitors are very satisfied to be able to visit Labuan Bajo.
Likewise with LOCVALUE (local values). The visitors really enjoy Labuan Bajo not only
because of its culinary, but also because of the climate (especially for foreign tourists), security, and
souvenirs. So it is not surprising that they feel satisfied being able to visit Labuan Bajo.
Meanwhile, TRAVALUE (Traveling Value) also has a significant effect on destination
satisfaction. The visitors gave high appreciation to the tourist destinations and the variety of short tours.
Unlike the three variables above, CULTURHER (Culture and heritage) variables do not have a
significant effect on destination satisfaction. Visitors are generally not interested in local culture. They
also feel comfortable with existing transportation services, thus providing a low value on visitor
satisfaction.
E. Conclusion
Based on the analysis in previous section, it can be drawn some conclusion, are as follows:
1. The are eight favourite destination in Labuan Bajo. They are Pulau Rinca, Gili Laba, Pulau Padar,
Pantai Pink, Pulau Kanawa, Pulau Komodo, Pulau Kelor and Manta Point.
2. On the average, 66 percent respondent are satisfied visiting to Labuan Bajo. There are 85 percent
respondent are satisfied with the entertainment in Labuan Bajo, followed by Greenary (83 percent),
Quiet/Serenity (80 percent), Lanscape (79 percent) and sea transportation (78 percent). Meanwhile,
condition of traffic, restaurant quality and hotel quality make the respondents are unsatisfied.
3. There are push and pull factors that influence the destination satisfaction of the respondent. The push
factors consist of new experience, new knowledge, social status and visiting place. Of those variables,
only two variables effect the destination satisfaction, they are new experience and social status. The
new kowledge and visiting value does not influence the destination satisfaction. Meanwhile, the pull
factors consist of the historical value, local value, culture and heritage and travelling value. Three of
those variables influence the destination satisfaction, they are historical value, local value and
travelling value. Meanwhile, the culture-heritage does not influence the destination satisfaction.
4. The destination satisfaction of respondent influences the revisit intention to Labuan Bajo.
5. Since there are so many interesting place/moment in Labuan Bajo, then almost 95 percent
respondents recommend others to visit Labuan Bajo.

Vol. 4 No. 2 Firm Journal of Management Studies
198 | H a l a m a n
Recommendation
1. Government and Company
To increase the number of visitor to Labuan Bajo, formulating some actions to develop Labuan Bajo
is really needed, like : (1) increasing the air, sea and land transportation, not only for the quantity but
also the quality; (2) increasing the hotel and restaurant quality; (3) increasing the tidiness of public
area; (4) increasing the tourist information; and also increasing the safety during in Labuan Bajo.
2. Economy
By developing Labuan Bajo as an alternatif tourist destination, it will give higher contribution to the
East Nusa Tenggara domestic product and higher job opportunity to local labor force.
Reference
Chen. C.F., Tsai, D.C. 2007. How Destination Image and Evaluative Factors Affect Behavioral Intention?. Tourism Management. Vol. 28, No. 4, 1115-1122.
Ghozali, I. 2011. Model Persamaan Struktural: Konsep & Aplikasi dengan Menggunakan AMOS 21.0. Semarang: Badan Penerbit Universitas Diponegoro.
Howe, N., Strauss, W. 2000. Millennials Rising: The Next Great Generation. New York: Vintage.
Jakarta Globe. 2018. How are Indonesia’s Four Priority Tourism Destinations Coming Along So Far? Retrieved from <www.jakartaglobe.id>
Jakarta Post. 2017. Indonesia Announces 10 New Destinations Brands. Retrieved from <http://www.thejakartapost.com/news/2017/06/15/ indonesia-announces-10-new-destination-brands.html>
Kementerian Pariwisata Republik Indonesia. 2017. Kajian Data Pasar Wisatawan Nusantara 2016. Jakarta: Kementerian Pariwisata Republik Indonesia.
Kesterson, K. D. (2013). The Relationships between ‘Push’ and ‘Pull’ Factors of Millennial Generation Tourists to Heritage Tourism Destinations: Antebellum and Civil War Sites in the State of Arkansas. Theses and Dissertations. University of Arkansa, Fayetteville. Retrived on March 12, 2018 from <https://www.google.com/search?client=firefox-b-ab&ei=7iOmWuOgNsHmvASS-paYDw&q=kesterson+antebellum&oq =kesterson+antebellum&gs_l=psy-ab.3...4178.11647.0.13194.
24.24.0.0.0.0.197.3273.0j22.22.0....0...1c.1.64.psy- ab..2.18.2729...0j46j0i131k1j35i39k1j0i67k1j0i46k1j0i1
0i203k1j0i10k1j0i22i30k1j33i160k1.0.dPYBm2-jJAc>
Khuong, M. N., Ha, H.T.T. 2014. Factors on the International Leisure Tourits’ Return Intention to Ho Chi Minh City, Vietnam – A Mediation Analysis of Destination Satisfaction. International Journal of Trade, Economics and Finance, Vol. 5, No.6, 490-496.
Vol. 4 No. 2 Firm Journal of Management Studies
199 | H a l a m a n
Komalasari, F., Zharfan, M. 2017. The Determinants of Travel Decision to Monas, Jakarta. Proceeding on The 1st International Conference on Sustainable Tourism. Lombok, 2-4 October 2018, 34-49.
Kompas. 2018. Jadi KSPN, Jumlah Wisatawan ke Danau Toba Melonjak 50 Persen www.kompas.com
Lovreda, N. (2015). An Analysis of Push and Pull Factors of Foreign Tourists Travelling to the Maltese Islands. University of Malta Retrieved on March 12, 2018 from <https://www.um.edu.mt/library/ oar/bitstream/handle/123456789/8117/15BTOU021.pdf?sequence=1&isAllowed=y>
McDowall, S. 2010. International Tourist Satisfaction and Destination Loyalti: Bangkok, Thailand. Asia Pacific Journal of Tourism Research. Vol. 15, No. 1, 21-42.
Ngoc, K.M., Trinh, N. T. 2015. Factors Affecting Tourists’ Return Intention towards Vung TauCity, Vietnam-A Mediation Analysis of Destination Satisfaction. Journal of Advanced Management Science, Vol. 3, No. 4, 292-298.
Osman, Z. 2013. Service Quality and Customer Loyalty in Malaysian Rural Tourism: A Mediating Effect of Trust. International Journal of Marketing Practices. Vol. 1 No. 1, 31-42.
Putra, E.D.P. 2016. Push and Pull Factors that Influence People in Choosing Tourits’ Destination and Its Implication on Revisit Intention: A Case Stude of Tourist to Water Sport in Tanjung Benoa, Bali. Thesis. Indonesia: President University.
Republika, 2017. Kunjungan ke Pulau Komodo Meningkat Tajam. Retrieved from <www.republika.co.id>
Republika, 2018a. Investasi Pariwisata NTB yang Terus Meningkat. <www.republika.co.id>
Republika. 2018b. 2019, Wisatawan ke Borobudur Ditarget 2 Juta Orang. <www.republika.co.id>
Som, A.P.M., Marzuki, A., Yousefi, M. & Khalifeh, A.N.A. 2012. Factors Influencing Visitors’ Revisit Behavioral Intentions: A Case Study of Sabah, Malaysia. International Journal of Marketing Studies, Vol. 4, No.4, 39-50
World Travel & Tourism Council. 2017. Travel & Tourism Economic Impact 2017: Indonesia. Retrieved from <www.wttc.org>
<https://tempatwisataunik.com/wisata-indonesia/nusa-tenggara-
timur/tempat-wisata-labuan-bajo