DETECTION OF WASTEWATER CONTAMINATION - WEF
40
DETECTION OF WASTEWATER CONTAMINATION KNOWLEDGE DEVELOPMENT FORUM
Transcript of DETECTION OF WASTEWATER CONTAMINATION - WEF
DETECTION OF WASTEWATER CONTAMINATION KNOWLEDGE DEVELOPMENT FORUM
IMPORTANT NOTICE
The material presented in this publication has been prepared in accordance with generally recognized engineering
principles and practices and is for general information only. This information should not be used without first
securing competent advice with respect to its suitability for any general or specific application.
The contents of this publication are not intended to be a standard of the Water Environment Federation® (WEF)
and are not intended for use as a reference in purchase specifications, contracts, regulations, statutes, or any other
legal document.
No reference made in this publication to any specific method, product, process, or service constitutes or implies an
endorsement, recommendation, or warranty thereof by WEF.
WEF makes no representation or warranty of any kind, whether expressed or implied, concerning the accuracy,
product, or process discussed in this publication and assumes no liability.
Anyone using this information assumes all liability arising from such use, including but not limited to infringement
of any patent or patents.
The Publisher works hard to ensure that the information in this publication is accurate and complete. However, it
is possible that the information may change after publication, and/or that errors or omissions may occur. We
welcome your suggestions on how to improve this publication and correct errors. The Publisher disclaims all
liability for, damages of any kind arising out of use, reference to, or reliance on information included in this
publication to the full extent provided by state and Federal law.
Water Environment Federation, Water Science & Engineering Center, WSEC-2019-KDF_TR-001 Page i
TECHNICAL PAPER
DETECTION OF WASTEWATER CONTAMINATION
KNOWLEDGE DEVELOPMENT FORUM
CONTENTS
AUTHORS AND CONTRIBUTORS ................................................................................................................................................................................................ iii
PREFACE ................................................................................................................................................................................................................................................. 1
OVERVIEW ............................................................................................................................................................................................................................................. 1
WASTEWATER CONTAMINATION DETECTION ................................................................................................................................................................... 1
Human bacterial markers ........................................................................................................................................................................................................... 1
Chemistry techniques: strengths, weaknesses, and where chemistry fits best ................................................................................................. 3
Canine scent tracking ................................................................................................................................................................................................................... 7
Optical properties of water for prediction of wastewater contamination in surface water ........................................................................ 8
Background .................................................................................................................................................................................................................................. 8
Objectives ..................................................................................................................................................................................................................................... 8
Study Approach .......................................................................................................................................................................................................................... 9
Sampling Design ........................................................................................................................................................................................................................ 9
Status of Research .................................................................................................................................................................................................................. 10
Additional Bacteria ................................................................................................................................................................................................................ 11
ROUNDTABLE DISCUSSION SYNTHESIS RE: WASTEWATER DETECTION METHODS .................................................................................... 11
What techniques are used within each group and how? List advantages and limitations and cost for each method.
Are there methods not represented here that should be, and what research is needed? .......................................................................... 12
What information is needed for investigation and what information is needed for action to be taken? ............................................ 13
How do we interpret results? ................................................................................................................................................................................................ 14
PRACTICAL APPLICATIONS AND FUTURE TECHNOLOGIES ....................................................................................................................................... 15
CASE STUDY 1 – Incorporating Molecular Testing as an Evidentiary Tool in
Municipal Water Quality Monitoring Programs ........................................................................................................................................................... 15
CASE STUDY 2 –Collection System Infrastructure Microbial Source Tracking ............................................................................................... 18
CASE STUDY 3 –Illicit Discharge Investigation Examples: Unraveling the Spaghetti .................................................................................. 21
FUTURE TECHNOLOGIES: MOBILE qPCR, SEQUENCING, AND OTHERS ........................................................................................................... 22
ROUNDTABLE DISCUSSION SYNTHESIS RE: Challenges for implementing wastewater detection programs ...................................... 25
Mapping the collection system.............................................................................................................................................................................................. 25
Water Environment Federation, Water Science & Engineering Center, WSEC-2019-KDF_TR-001 Page ii
What are the major hurdles for backtracking? Financial, expertise, administrative,
research needs, political will. What needs to happen logistically? Administratively? ............................................................................... 26
Can production laboratories help? What turn-around time is needed? ............................................................................................................. 26
What financial barriers are there? ...................................................................................................................................................................................... 26
How can effectiveness in results interpretation be implemented through information
sharing among agencies? ......................................................................................................................................................................................................... 27
WHAT RESEARCH NEEDS TO BE DONE? .............................................................................................................................................................................. 28
Contamination detection and source identification .................................................................................................................................................... 28
Guidance and tools ..................................................................................................................................................................................................................... 28
Remedies......................................................................................................................................................................................................................................... 29
Management .................................................................................................................................................................................................................................. 29
REFERENCES ..................................................................................................................................................................................................................................... 30
10-AUG-2018 KNOWLEDGE DEVELOPMENT FORUM PARTICIPANTS .................................................................................................................. 32
Table 1: Quantitative PCR (qPCR) ............................................................................................................................................................................................... 2
Table 2: Characterizing Illicit Discharges................................................................................................................................................................................. 4
Table 3: Typical Chemical Field Parameters for Illicit Discharge Detection ............................................................................................................ 5
Table 4: Chemical Monitoring, Strengths and Weaknesses ............................................................................................................................................. 6
Table 5: Techniques for Detection of Wastewater Contamination, Pros and Cons of each Method, and Relative Cost .................... 12
Table 6: The Applications of Lachno3 and Lachno12 Assays on Environmental Samples that were Inconsistent in HB and
Lachno2 Assays Results ................................................................................................................................................................................................................ 22
Table 7: Mapping the Collection System................................................................................................................................................................................ 25
Water Environment Federation, Water Science & Engineering Center, WSEC-2019-KDF_TR-001 Page iii
Special thanks go out to the
Great Lakes Protection Fund for financial support, and to the School of Freshwater Sciences, University of Wisconsin-Milwaukee for hosting the Knowledge Development Forum
National Institutes for Water Resources (NIWR) Agency project number: 2016WI354G Project title: Detection of sewage contamination in urban areas of the Great Lakes Principal Investigator: Sandra McLellan for additional funding
AUTHORS AND CONTRIBUTORS
Danny Barker, Environmental Scientist,
Hampton Roads Sanitation District
Annette DeMaria, P.E., Principal Engineer,
Environmental Consulting & Technology, Inc.
Deb Caraco, P.E., Senior Watershed Engineer,
Center for Watershed Protection
Steven R. Corsi, Research Hydrologist,
U.S. Geological Survey
Julie Kinzelman, Ph.D., M.S., M.T., Laboratory Director / Research Scientist,
City of Racine, WI
Barry Liner, Ph.D., P.E., Chief Technology Officer and Sr. Director, Water Science & Engineering Center,
Water Environment Federation
Sandra L. McLellan, Ph.D., University of Wisconsin-Milwaukee, School of Freshwater Sciences
Lisa McFadden, Director, Integrated Technical Programs and Associate Director, Water Science & Engineering Center,
Water Environment Federation
Cheryl Nenn, M.S., Riverkeeper
Milwaukee Riverkeeper
For further information, please contact:
Steven R. Corsi
Research Hydrologist
U.S. Geological Survey
Upper Midwest Water Science Center
8505 Research Way
Middleton, WI 53562
email: [email protected]
Sandra McLellan
Associate Editor, NPJ Biofilms and Microbiomes
Professor
School of Freshwater Sciences
University of Wisconsin-Milwaukee
600 E. Greenfield Avenue
Milwaukee, WI 53204
email: [email protected]
http://home.freshwater.uwm.edu/mclellanlab
Water Environment Federation, Water Science & Engineering Center, WSEC-2019-KDF_TR-001 Page 1
PREFACE
The U.S. Geological Survey, the University of Wisconsin-Milwaukee, and the Water Environment Federation in cooperation
with the Great Lakes Protection Fund gathered substantive feedback through engagement during a Knowledge Development
Forum (KDF) on detection of wastewater contamination for targeted remediation. The event provided opportunity for subject
matter experts and interested parties to openly discuss new technology and management practices. Unlike a traditional
workshop, the KDF provided an interactive gathering of stakeholders brought together to develop new knowledge, identify
collaborative efforts to bridge gaps, and facilitate adoption of new and better ways of problem solving in the water sector.
Through a series of highly interactive discussions, experts in the field provided a platform for evaluation and dissemination of
information gleaned from recent studies with a focus on:
1. Wastewater detection methods,
2. Wastewater detection methods round table discussions with the KDF participants,
3. Practical applications and future technologies, and
4. Practical applications round table discussions with KDF participants.
OVERVIEW
Wastewater contamination from illicit discharges and leaking sewer infrastructure in the Great Lakes remains a serious source
of pollution in tributaries and nearshore waters. These situations result in substantial surface water contamination, and once
located, are considered a high priority by municipalities for rapid repair. One of the major barriers for municipalities
responsible for mitigation of these contamination sources is locating them in a time-, labor- and cost-efficient manner.
Stormwater sewer systems capture runoff from streets, parking lots and rooftops and discharge water directly to rivers. An
illicit connection between the sanitary and the stormwater system is expensive and time intensive to locate with standard
methods. The Detection of Wastewater Contamination KDF provided an opportunity for industry leaders to collaborate and
discuss current techniques and parameters used to identify wastewater contamination sources, the vision of improvements to
technology and practices, and next steps, which are catalogued and highlighted in this document.
WASTEWATER CONTAMINATION DETECTION
KDF introductory presentations provided an overview of current methods for wastewater detection in different spatial
contexts for short-term and long-term management goals.
HUMAN BACTERIAL MARKERS –
SANDRA L. MCLELLAN, PH.D., UNIVERSITYOF WISCONSIN, MILWAUKEE,
SCHOOL OF FRESHWATER SCIENCES, GREAT LAKES WATER INSTITUTE
To assist in framing the KDF discussion, Dr. McLellan provided the following summary of human bacterial markers, the how,
what, and why of microbial source tracking through fecal pollution.
All animals and humans have E. coli in their gut including dogs, birds, people, and agricultural animals. Fecal pollution sources
such as leaking wastewater and farm run-off are more likely to contain pathogens. For 100 years, easily cultured organisms
have been used to track sanitation concerns, starting with Bacillus coli, then later total coliforms and fecal coliforms. E. coli
and enterococci are currently the most common indicators of fecal pollution and have been recommended for use by the
USEPA since 1986. E. coli and enterococci reliably indicate fecal pollution since they are present in almost all animals and are
Water Environment Federation, Water Science & Engineering Center, WSEC-2019-KDF_TR-001 Page 2
easily detectable. However, there are problems with the use of these organisms, as they do not differentiate the source.
Human sources have a high likelihood to contain human pathogens, and certain animal sources can be of concern also for
specific pathogens (E. coli O157:H7, Salmonella spp.). Additionally, E. coli and enterococci can survive and grow in the
environment.
E. coli can be detected because this bacterium can easily be grown on media, but there are hundreds if not thousands of other
organisms present in pollution sources such as wastewater. An estimated 90% of human gut bacteria are fecal anaerobes and
difficult to culture but may be uniquely associated with humans. Next generation sequencing can be used to inventory and
identify organisms that are specifically associated with a host. This analysis has not been available until relatively recently, as
cloning sequences individually limited the depth to an estimated 1000 sequences per sample, which only will characterize the
most abundant organisms. Next generation sequencing has brought in a whole new era in microbial ecology. Today, next
generation sequencing can sequence 10,000,000 bacteria per run – 100,000 per sample.
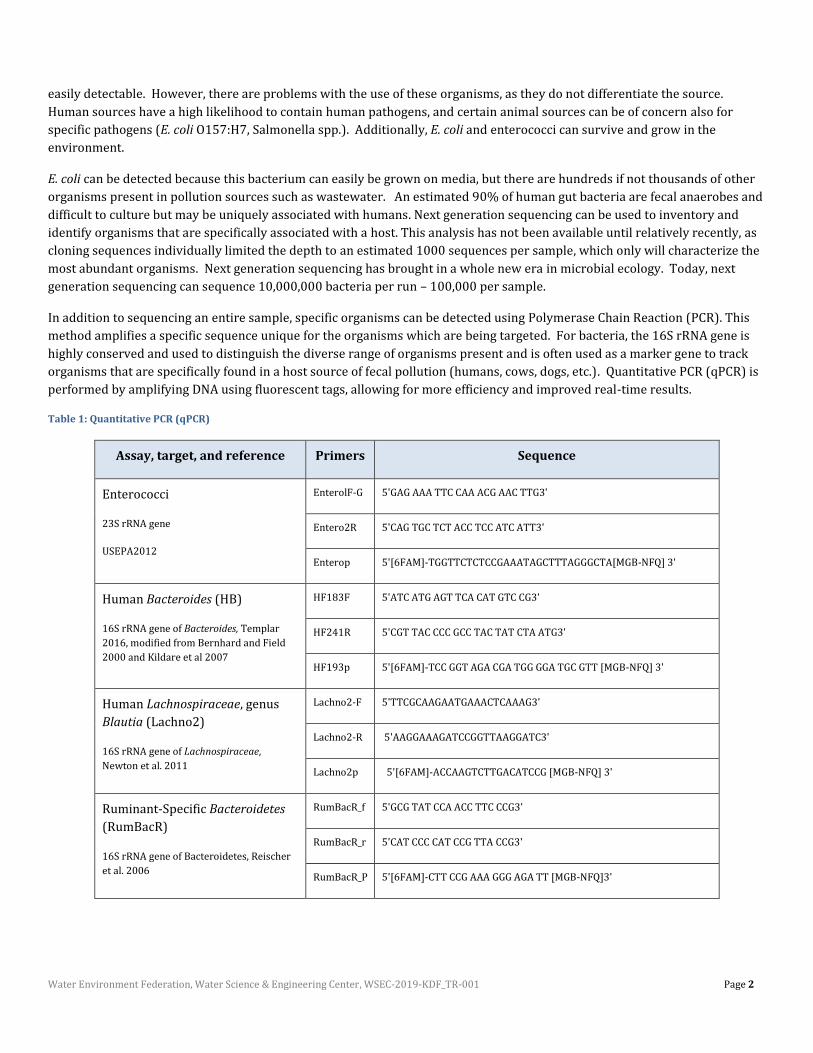
In addition to sequencing an entire sample, specific organisms can be detected using Polymerase Chain Reaction (PCR). This
method amplifies a specific sequence unique for the organisms which are being targeted. For bacteria, the 16S rRNA gene is
highly conserved and used to distinguish the diverse range of organisms present and is often used as a marker gene to track
organisms that are specifically found in a host source of fecal pollution (humans, cows, dogs, etc.). Quantitative PCR (qPCR) is
performed by amplifying DNA using fluorescent tags, allowing for more efficiency and improved real-time results.
Table 1: Quantitative PCR (qPCR)
Assay, target, and reference Primers Sequence
Enterococci
23S rRNA gene
USEPA2012
EnterolF-G 5'GAG AAA TTC CAA ACG AAC TTG3'
Entero2R 5'CAG TGC TCT ACC TCC ATC ATT3'
Enterop 5'[6FAM]-TGGTTCTCTCCGAAATAGCTTTAGGGCTA[MGB-NFQ] 3'
Human Bacteroides (HB)
16S rRNA gene of Bacteroides, Templar
2016, modified from Bernhard and Field
2000 and Kildare et al 2007
HF183F 5'ATC ATG AGT TCA CAT GTC CG3'
HF241R 5'CGT TAC CCC GCC TAC TAT CTA ATG3'
HF193p 5'[6FAM]-TCC GGT AGA CGA TGG GGA TGC GTT [MGB-NFQ] 3'
Human Lachnospiraceae, genus
Blautia (Lachno2)
16S rRNA gene of Lachnospiraceae,
Newton et al. 2011
Lachno2-F 5'TTCGCAAGAATGAAACTCAAAG3'
Lachno2-R 5'AAGGAAAGATCCGGTTAAGGATC3'
Lachno2p 5'[6FAM]-ACCAAGTCTTGACATCCG [MGB-NFQ] 3'
Ruminant-Specific Bacteroidetes
(RumBacR)
16S rRNA gene of Bacteroidetes, Reischer
et al. 2006
RumBacR_f 5'GCG TAT CCA ACC TTC CCG3'
RumBacR_r 5'CAT CCC CAT CCG TTA CCG3'
RumBacR_P 5'[6FAM]-CTT CCG AAA GGG AGA TT [MGB-NFQ]3'
Water Environment Federation, Water Science & Engineering Center, WSEC-2019-KDF_TR-001 Page 3
In some urban areas, runoff models of land use only account for an estimated 10% of the fecal indicator bacteria, which has
large implications for estimating Total Maximum Daily Loads (TMDLs). In these instances, it is important to account for these
unknown sources of fecal pollution. Urban stormwater has been shown to be a major delivery route of fecal indicator bacteria
and is at the forefront for pollution inputs in cities.
Stormwater should be comprised of rain runoff; however, studies have shown there are areas of wastewater intrusion within
the stormwater system, thus high levels of fecal indicator bacteria and likely, pathogens. Urban stormwater is collected from
streets and roof tops and is released directly into rivers. A recent survey completed by the McLellan lab group, in
collaboration with Milwaukee Riverkeeper and the Milwaukee Metropolitan Sewerage District (315 outfalls n=1500 samples),
estimates 30% of stormwater outfalls show high and consistent level of untreated wastewater and 8% had very high levels of
wastewater. When considering low to moderate levels, greater than 70% of stormwater outfalls had some evidence of
wastewater contamination. Evidence of sewage contamination did not coincide with fecal coliform levels and 50% of the
outfalls with high fecal coliforms do not have wastewater.
To track these problem areas within a stormwater system, qPCR may be effective; however, it can be very costly, as well as
technically challenging. Dr. McLellan noted that the microbiome of humans and animals has host specific organisms and while
qPCR is sensitive and specific, there is a need for better approaches for surveys along pipe network since this type of effort
requires a large amount of samples and rapid results.
CHEMISTRY TECHNIQUES: STRENGTHS, WEAKNESSES, AND WHERE CHEMISTRY FITS BEST – DEB CARACO,
P.E. , CENTER FOR WATERSHED PROTECTION, ELLICOTT CITY, MD
Deb Caraco provided an overview of how chemical monitoring techniques can be best used to identify wastewater discharges,
along with other illicit discharges to the storm sewer system or stream network, and the conditions where chemical
monitoring is effective at identifying these discharges. The presentation drew largely form the 2004 Center for Watershed
Protection guidance, “Illicit Discharge Detection and Elimination: A Guidance Manual for Program Development and Technical
Assessments.” (Brown et al., 2004), and was also informed by field experiences and studies since that manual was originally
developed.
Characterizing Illicit Discharges
Illicit discharges include both wastewater discharges, and other discharges, such as industrial wastes, that are illegally
discharged to the sewer system, or directly to waterways. The best approach to identify and eliminate these discharges
depends on characteristics of the discharge, including the discharge frequency and mode of entry (Table 2) and the chemical
content of the discharge (Figure 1). The Discharge Frequency is critical to determining how difficult it is to identify a
discharge, and is also an indicator of the potential for a discharge to contribute pollutants to water resources:
• Continuous discharges are constantly flowing, such as a broken sewer main that discharges to the storm drain system.
These discharges are the most easily captured through regular outfall or instream monitoring, and typically have the
potential to contribute the greatest amount of pollution because of their constant nature.
• Intermittent discharges flow certain times of the day, only on certain days, or intermittently throughout the day. Most
discharges fall into this class and may include an individual home or building that is cross-connected to the storm
drain system, or other discharges that occur only at certain times. There are techniques to capture these discharges
through monitoring, but more vigilance is needed. These discharges also have the potential to contribute large
pollutant loads, depending on the volume and frequency of the discharge.
• Transitory discharges are very rare or “one time” discharges such as spills or other rare events. While these
discharges can have a large short-term impact, they are typically not easily identified through monitoring. A
combination of adequate spill-response and educational programs are best suited to addressing these pollution
sources.
Water Environment Federation, Water Science & Engineering Center, WSEC-2019-KDF_TR-001 Page 4
Discharges can also enter the system either directly (i.e., through a straight pipe entry, or through a cross-connection), or
indirectly, such as by wastewater or another contaminant entering the stormwater system or a stream by seepage through
soils or groundwater. This distinction is important because discharges that enter the system indirectly are more difficult to
detect using traditional monitoring techniques and are better detected using more sophisticated techniques that more suited
to identify diluted contamination sources.
Table 2: Characterizing Illicit Discharges
Characterizing Illicit Discharges
DISCHARGE TYPE FREQUENCY MODE OF ENTRY*
Continuous discharges Occur most or all of the time Direct and/or Indirect
Intermittent discharges Occur over shorter/more limited time period Direct and/or Indirect
Transitory discharges Occur rarely and without predictable frequency Direct and/or Indirect
*/ Direct includes direct cross connection and/or straight pipe entry Indirect includes groundwater seepage and/or septic tank overland flow
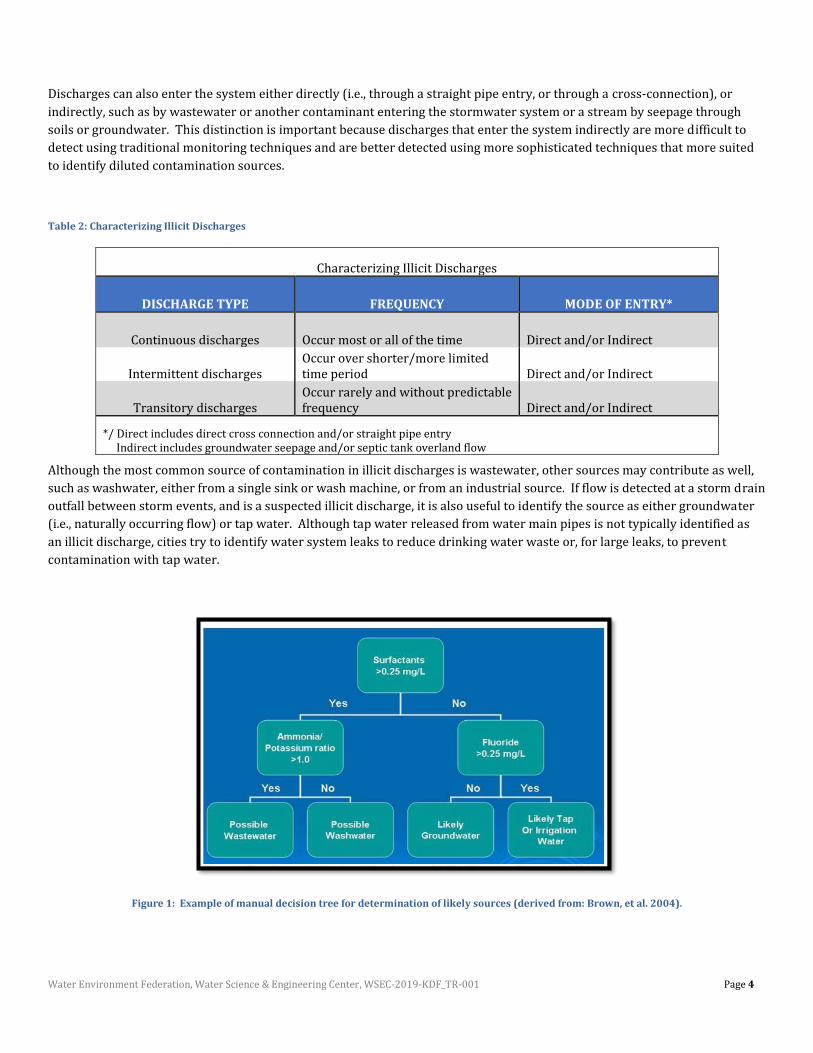
Although the most common source of contamination in illicit discharges is wastewater, other sources may contribute as well,
such as washwater, either from a single sink or wash machine, or from an industrial source. If flow is detected at a storm drain
outfall between storm events, and is a suspected illicit discharge, it is also useful to identify the source as either groundwater
(i.e., naturally occurring flow) or tap water. Although tap water released from water main pipes is not typically identified as
an illicit discharge, cities try to identify water system leaks to reduce drinking water waste or, for large leaks, to prevent
contamination with tap water.
Figure 1: Example of manual decision tree for determination of likely sources (derived from: Brown, et al. 2004).

Water Environment Federation, Water Science & Engineering Center, WSEC-2019-KDF_TR-001 Page 5
Appropriate Chemical Parameters
For field work, ideal field parameters are portable, achieve quick results, have safe reagents and are conservative (i.e., do not
degrade in the environment). In addition, the ideal parameter has a relatively high concentration in the type of discharge
being identified. For example, surfactants (found in detergents) are excellent at distinguishing an illicit discharge (wastewater
or washwater) from other natural waters or tap water, because surfactants are not typically found (or are not detectable) in
tap water or groundwater. Similarly, fluoride can often be used to distinguish tap water from groundwater, since tap water is
fluoridated in most communities. Unfortunately, no single parameter can meet all of these criteria, so a combination of
different parameters is often the best approach.
Figure 1 represents a “flow chart” approach (from Brown, et al., 2004) that was proven effective based on a large dataset from
Birmingham, Alabama. This approach is fairly robust but can be adjusted based on local data. For example, some communities
may not add fluoride to tap water, so a different parameter may be appropriate. Further, alternative parameters may be
effective in some settings. For example, boron has shown some promise as a potential washwater indicator (Brown, et al.,
2004), but has not been widely used in the field.
In practice, the “flow chart approach” employs simple, immediate field parameters that can identify potential discharges
quickly so that field crews can attempt to track down the source of the discharge. Although ammonia is not conservative
because it volatilizes quickly, it can be a good, quick indicator of potential wastewater discharges, and typically can be useful
for tracking a discharge to its source in the storm drain system. Some typical parameters and their uses are identified below.
Table 3: Typical Chemical Field Parameters for Illicit Discharge Detection
Typical Chemical Field Parameters for Illicit Discharge Detection
PARAMETER USES ADVANTAGES DISADVANTAGES
Ammonia
• Good single indicator of wastewater
• Can be used in the “flow chart technique” to distinguish wastewater from other discharges
• Quick results. • Can be analyzed in the
field
• Volatilizes easily • May not be sensitive enough to
capture dilute or distant discharges
• Natural sources can confound results
Boron
• Potential indicator of any discharge containing detergents
• Safe reagents, and alternative to surfactants
• Boron is present in natural waters in some areas
• May not be detected in dilute discharges
Chlorine
• Identify tap water presence • Simple field test • Volatilizes extremely quickly
Fluorine
• Identify tap water • Used as a flow chart
parameter
• Simple test • May not be effective in all communities, depending on natural waters concentrations and fluoridation policies
Nitrogen/ Phosphorus
• An in-stream parameter to identify large-scale wastewater contamination
• Fairly easy to measure. • Often monitored as a
part of other efforts
• Not a very useful parameter for outfall monitoring
• Other nitrogen and phosphorus sources are common
pH • Identifies some industrial
discharges • Very easy and quick to
monitor • Rarely detects discharges in
practice
Potassium
• Excellent indicator of industrial discharges
• “Flow Chart” parameter
• Easy to use • Robust indicator of
industrial discharges
• Not very useful as a “stand alone” parameter in the absence of other indicators
• Natural sources can be present
Water Environment Federation, Water Science & Engineering Center, WSEC-2019-KDF_TR-001 Page 6
Surfactants (MBAS)
• Good indicator of any discharge containing detergents
• Not found in natural waters
• Found in almost all detergents
• Hazardous reagents • May not detect very dilute
discharges
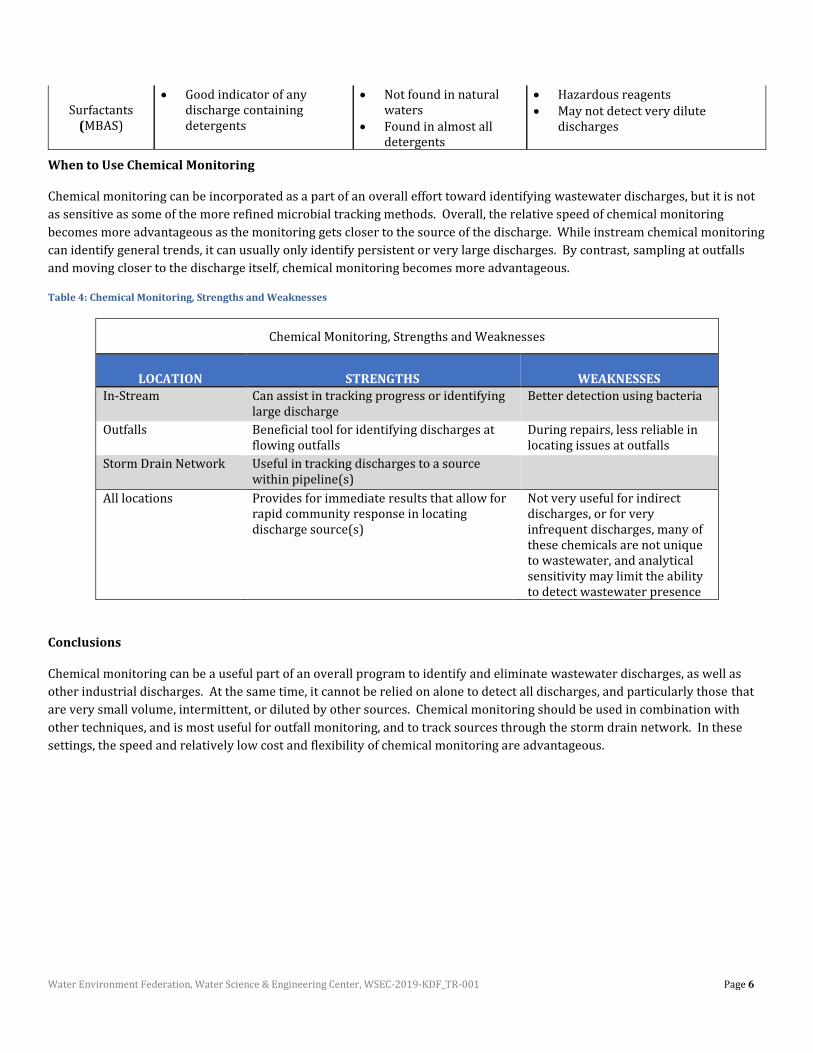
When to Use Chemical Monitoring
Chemical monitoring can be incorporated as a part of an overall effort toward identifying wastewater discharges, but it is not
as sensitive as some of the more refined microbial tracking methods. Overall, the relative speed of chemical monitoring
becomes more advantageous as the monitoring gets closer to the source of the discharge. While instream chemical monitoring
can identify general trends, it can usually only identify persistent or very large discharges. By contrast, sampling at outfalls
and moving closer to the discharge itself, chemical monitoring becomes more advantageous.
Table 4: Chemical Monitoring, Strengths and Weaknesses
Chemical Monitoring, Strengths and Weaknesses
LOCATION STRENGTHS WEAKNESSES
In-Stream Can assist in tracking progress or identifying large discharge
Better detection using bacteria
Outfalls Beneficial tool for identifying discharges at flowing outfalls
During repairs, less reliable in locating issues at outfalls
Storm Drain Network Useful in tracking discharges to a source within pipeline(s)
All locations Provides for immediate results that allow for rapid community response in locating discharge source(s)
Not very useful for indirect discharges, or for very infrequent discharges, many of these chemicals are not unique to wastewater, and analytical sensitivity may limit the ability to detect wastewater presence
Conclusions
Chemical monitoring can be a useful part of an overall program to identify and eliminate wastewater discharges, as well as
other industrial discharges. At the same time, it cannot be relied on alone to detect all discharges, and particularly those that
are very small volume, intermittent, or diluted by other sources. Chemical monitoring should be used in combination with
other techniques, and is most useful for outfall monitoring, and to track sources through the storm drain network. In these
settings, the speed and relatively low cost and flexibility of chemical monitoring are advantageous.
Water Environment Federation, Water Science & Engineering Center, WSEC-2019-KDF_TR-001 Page 7
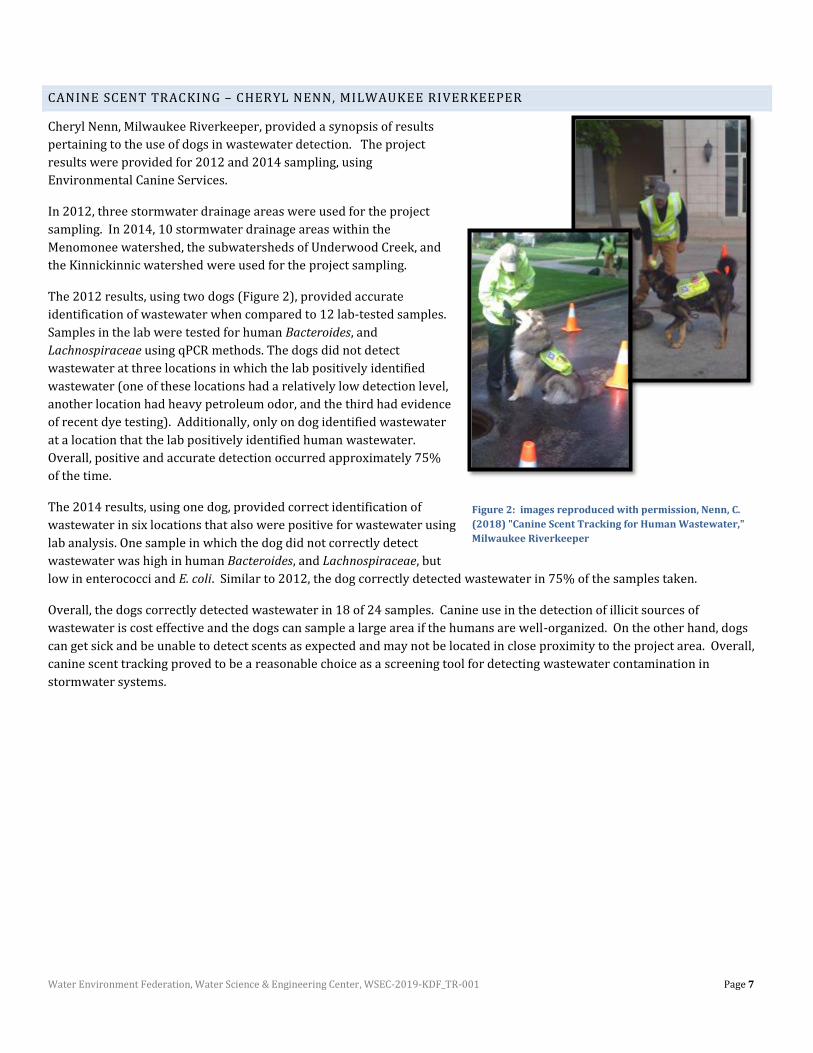
CANINE SCENT TRACKING – CHERYL NENN, MILWAUKEE RIVERKEEPER
Cheryl Nenn, Milwaukee Riverkeeper, provided a synopsis of results
pertaining to the use of dogs in wastewater detection. The project
results were provided for 2012 and 2014 sampling, using
Environmental Canine Services.
In 2012, three stormwater drainage areas were used for the project
sampling. In 2014, 10 stormwater drainage areas within the
Menomonee watershed, the subwatersheds of Underwood Creek, and
the Kinnickinnic watershed were used for the project sampling.
The 2012 results, using two dogs (Figure 2), provided accurate
identification of wastewater when compared to 12 lab-tested samples.
Samples in the lab were tested for human Bacteroides, and
Lachnospiraceae using qPCR methods. The dogs did not detect
wastewater at three locations in which the lab positively identified
wastewater (one of these locations had a relatively low detection level,
another location had heavy petroleum odor, and the third had evidence
of recent dye testing). Additionally, only on dog identified wastewater
at a location that the lab positively identified human wastewater.
Overall, positive and accurate detection occurred approximately 75%
of the time.
The 2014 results, using one dog, provided correct identification of
wastewater in six locations that also were positive for wastewater using
lab analysis. One sample in which the dog did not correctly detect
wastewater was high in human Bacteroides, and Lachnospiraceae, but
low in enterococci and E. coli. Similar to 2012, the dog correctly detected wastewater in 75% of the samples taken.
Overall, the dogs correctly detected wastewater in 18 of 24 samples. Canine use in the detection of illicit sources of
wastewater is cost effective and the dogs can sample a large area if the humans are well-organized. On the other hand, dogs
can get sick and be unable to detect scents as expected and may not be located in close proximity to the project area. Overall,
canine scent tracking proved to be a reasonable choice as a screening tool for detecting wastewater contamination in
stormwater systems.
Figure 2: images reproduced with permission, Nenn, C.
(2018) "Canine Scent Tracking for Human Wastewater,"
Milwaukee Riverkeeper
Water Environment Federation, Water Science & Engineering Center, WSEC-2019-KDF_TR-001 Page 8
OPTICAL PROPERTIES OF WATER FOR PREDICTION OF WASTEWATER CONTAMINATION IN SURFACE
WATER – STEVEN R. CORSI, RESEARCH HYDROLOGIST, U.S. GEOLOGICAL SURVEY AND SANDRA L.
MCLELLAN, PH.D., UNIVERSITYOF WISCONSIN, MILWAUKEE, SCHOOL OF FRESHWATER SCIENCES
BACKGROUND
Wastewater contamination from illicit discharges and leaking sewer infrastructure in the Great Lakes remains a serious source
of pollution in tributaries and nearshore waters. Construction of wastewater infrastructure often includes misconnections
into the storm sewer system, and many metropolitan areas in the U.S. have an aging sanitary sewer infrastructure with failures
in the system that can result in exfiltration of wastewater. One study by the United States Environmental Protection Agency
reported between 12% and 49% of wastewater flows are lost due to leaking infrastructure (Amick, et al., 2000). Contaminants
found in wastewater including toxic compounds, pathogens, nutrients, pharmaceuticals, and hormones and other endocrine
disruptors can have a substantial effect on the aquatic ecosystem. These situations result in substantial receiving-water
contamination, but once located, are considered a high priority by municipalities for rapid repair.
A major barrier for municipalities responsible for administering state and Federal Illicit Discharge Detection and Elimination
(IDDE) programs for reducing these contamination sources is locating them in a time-, labor- and cost-efficient manner.
Wastewater leaking outward from cracked pipes (exfiltration) or entering storm sewers from illicit connections can migrate
into the stormwater system, which acts as a very effective conduit to deliver leaking wastewater into streams. However, the
point of entry of wastewater into the stormwater system is very difficult to locate with standard methods. Each outfall
represents an area of several acres to hundreds of acres that is drained by a complicated network of storm sewers and/or
ditches. In addition, the complex mixture of factors that influence sanitary wastewater systems and the dynamics of urban
hydrology and urban stormwater conveyance systems result in highly variable concentrations of wastewater in receiving
streams. Defining the quantity, timing, and location of wastewater contamination is a very challenging task that would benefit
from new tools that offer improved efficiency in measurement of these parameters.
Optical sensors: Human wastewater has distinct optical properties that are different than those typically observed in natural
waters. Optical property analysis includes measurement of fluorescence and absorbance spectra that serve to characterize the
composition of dissolved organic matter (DOM) in water (Fellman, et al., 2010). There are many sources that contribute to
DOM in natural waters that influence optical property signals. Research has previously been conducted to identify signals that
predict wastewater presence in natural waters, but these studies have typically been limited in scope to single study areas and
have not been examined thoroughly for transferability to other geographic regions. Identifying reliable optical signals that can
predict the presence and relative magnitude of wastewater in real time would provide an additional tool to help improve
efficiency for practitioners aiming to define contamination and locate sources.
OBJECTIVES
The overall objective of this research is to identify optical signals that could be designed into a real-time sensor system for
detection of wastewater in surface waters. Specific objectives include: (1) to characterize the optical properties in stormwater
conveyance systems and surface-water samples in a diverse set of geographic and watershed settings, (2) to define
wastewater presence and magnitude by concurrent analysis of human-specific bacteria, (3) to identify optical signals that best
serve as surrogates to predict wastewater contamination for development of field sensors, (4) to conduct this research using
samples that represent multiple settings including: variable land use, variable hydrologic conditions, through different
seasons, and at multiple watershed scales, to define limitations of such signals, and (5) to provide results to stakeholders for
development of sensor systems that can detect wastewater presence in real time.
Water Environment Federation, Water Science & Engineering Center, WSEC-2019-KDF_TR-001 Page 9
STUDY APPROACH
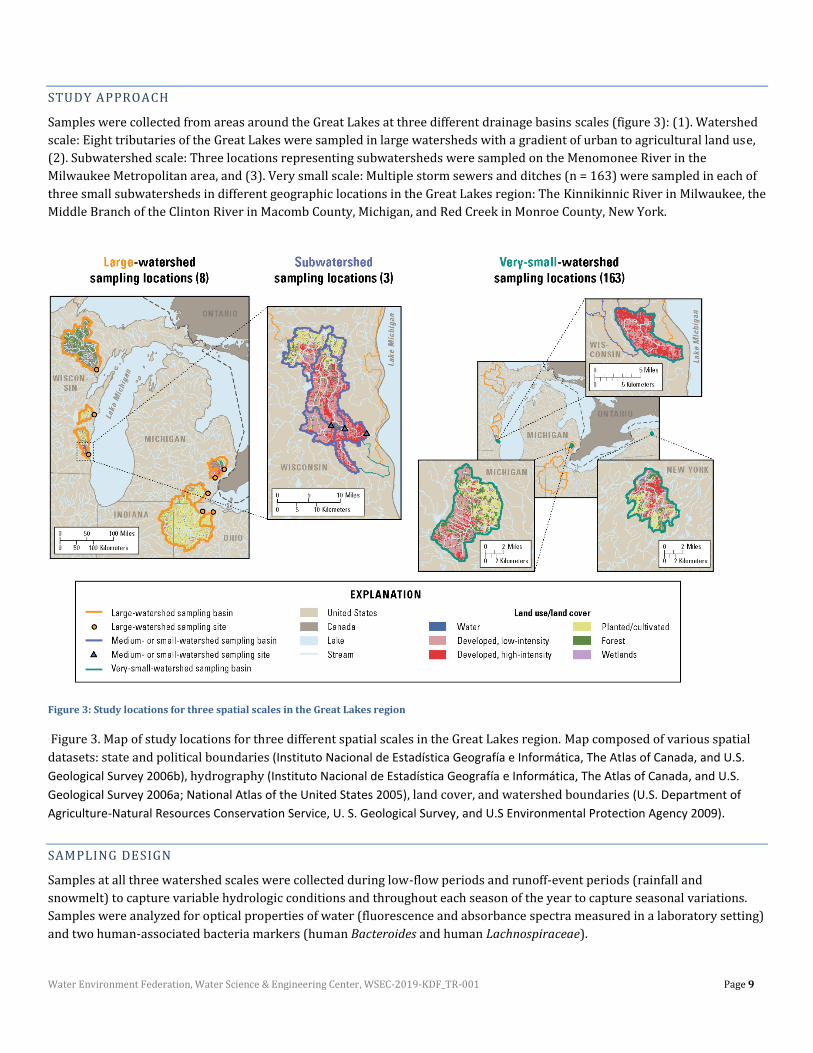
Samples were collected from areas around the Great Lakes at three different drainage basins scales (figure 3): (1). Watershed
scale: Eight tributaries of the Great Lakes were sampled in large watersheds with a gradient of urban to agricultural land use,
(2). Subwatershed scale: Three locations representing subwatersheds were sampled on the Menomonee River in the
Milwaukee Metropolitan area, and (3). Very small scale: Multiple storm sewers and ditches (n = 163) were sampled in each of
three small subwatersheds in different geographic locations in the Great Lakes region: The Kinnikinnic River in Milwaukee, the
Middle Branch of the Clinton River in Macomb County, Michigan, and Red Creek in Monroe County, New York.
Figure 3: Study locations for three spatial scales in the Great Lakes region
Figure 3. Map of study locations for three different spatial scales in the Great Lakes region. Map composed of various spatial
datasets: state and political boundaries (Instituto Nacional de Estadística Geografía e Informática, The Atlas of Canada, and U.S.
Geological Survey 2006b), hydrography (Instituto Nacional de Estadística Geografía e Informática, The Atlas of Canada, and U.S.
Geological Survey 2006a; National Atlas of the United States 2005), land cover, and watershed boundaries (U.S. Department of
Agriculture-Natural Resources Conservation Service, U. S. Geological Survey, and U.S Environmental Protection Agency 2009).
SAMPLING DESIGN
Samples at all three watershed scales were collected during low-flow periods and runoff-event periods (rainfall and
snowmelt) to capture variable hydrologic conditions and throughout each season of the year to capture seasonal variations.
Samples were analyzed for optical properties of water (fluorescence and absorbance spectra measured in a laboratory setting)
and two human-associated bacteria markers (human Bacteroides and human Lachnospiraceae).
Water Environment Federation, Water Science & Engineering Center, WSEC-2019-KDF_TR-001 Page 10
At the large watersheds and subwatersheds, samples were collected to represent conditions throughout the full sampling
period which included 24-hr flow-weighted composite samples for low-flow periods, and flow-weighted composite samples
collected throughout the period of increased streamflow for runoff-event periods. The large watersheds were sampled over a
two-year period for a total of 236 samples and 127 samples were collected in subwatersheds over a four-year period. At the
very small-scale watershed sampling locations, discrete grab samples were collected by peristaltic pump or direct bottle
submersion. A total of 593 samples were collected during low-flow and runoff-event periods at the very small-scale sites over
a two-year period. All data are available in the U.S. Geological Survey National Water Information System at
https://waterdata.usgs.gov/nwis.
STATUS OF RESEARCH
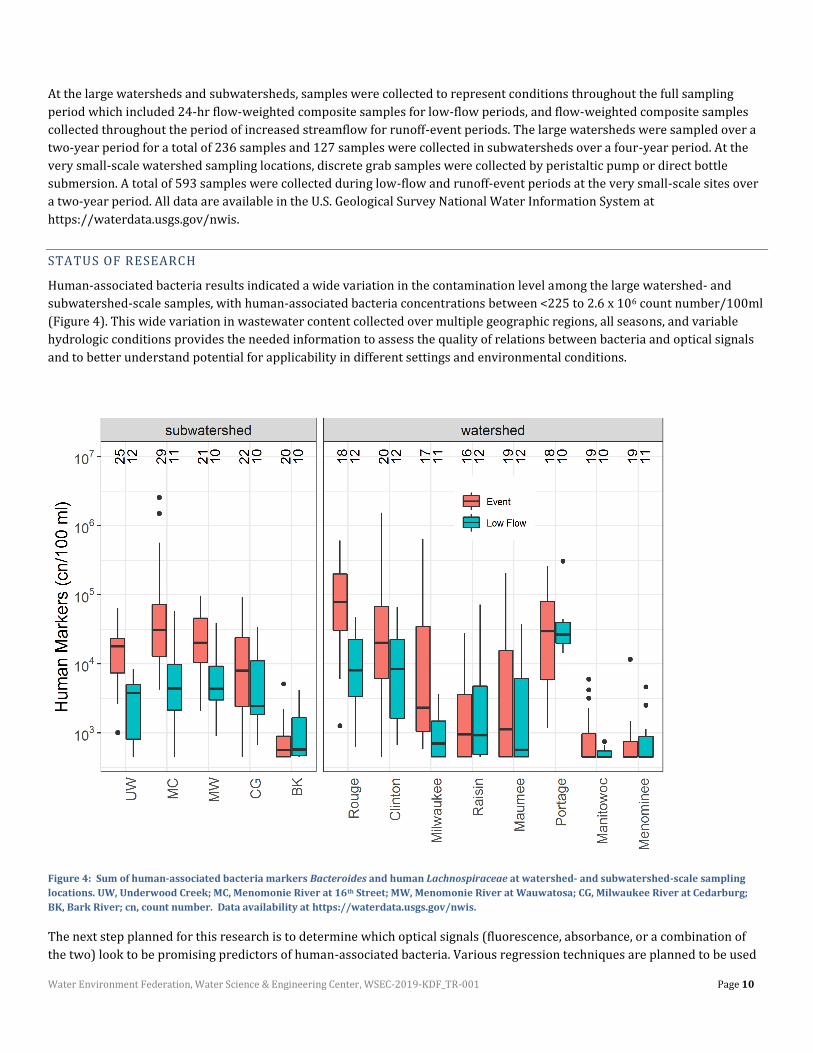
Human-associated bacteria results indicated a wide variation in the contamination level among the large watershed- and
subwatershed-scale samples, with human-associated bacteria concentrations between <225 to 2.6 x 10⁶ count number/100ml
(Figure 4). This wide variation in wastewater content collected over multiple geographic regions, all seasons, and variable
hydrologic conditions provides the needed information to assess the quality of relations between bacteria and optical signals
and to better understand potential for applicability in different settings and environmental conditions.
Figure 4: Sum of human-associated bacteria markers Bacteroides and human Lachnospiraceae at watershed- and subwatershed-scale sampling
locations. UW, Underwood Creek; MC, Menomonie River at 16th Street; MW, Menomonie River at Wauwatosa; CG, Milwaukee River at Cedarburg;
BK, Bark River; cn, count number. Data availability at https://waterdata.usgs.gov/nwis.
The next step planned for this research is to determine which optical signals (fluorescence, absorbance, or a combination of
the two) look to be promising predictors of human-associated bacteria. Various regression techniques are planned to be used
Water Environment Federation, Water Science & Engineering Center, WSEC-2019-KDF_TR-001 Page 11
to explore these relationships. Given that there are more than 6000 optical signals that were generated with each sample
analysis, several steps will be taken to reduce the number of potential signals to a number that would be practical for
development of a field sensor system. First, common optical signals that currently exist as field sensors will be examined. This
includes sensors that target fluorescence signals such as “tryptophan-like” fluorescence, “colored dissolved organic matter
(CDOM)”, and “optical brighteners” because sensors for these signals already exist from several different manufacturers. If
regressions of sufficient quality cannot be developed with existing sensor signals, the next step would be to explore additional
signals with alternative regression techniques along with more advanced “variable selection” procedures.
Data are planned to be analyzed by various factors to determine potential transferability of results among different
watersheds, regions, and drainage-area scales. This will include analysis for different geographic regions and specific areas
within a geographic region, different hydrologic conditions, different seasons, and by grouping study sites into those with
similar dissolved organic matter composition based on fluorescence spectra. Ultimately, the goal is to reduce the number of
optical signals down to a number that would be practical to implement in a field sensor system, and to use optical signals that
are effective at multiple or all studied settings. Such a sensor system could be deployed in a fixed location for defining
wastewater contamination concentration and loadings in streams, or as a mobile unit to track contamination and help identify
source locations.
ADDITIONAL BACTERIA
Although the objective of this project was to identify optical signals to detect wastewater contamination, many stakeholders
are interested in the presence and magnitude of fecal indicator bacteria (FIB) as well. The presence of FIB does not necessarily
indicate wastewater contamination but is thought to provide information on more general fecal contamination that includes
human and non-human sources. In addition to the human-associated bacteria, two genetic markers that represent commonly
measured FIB were quantified (E. coli and enterococci) concurrently with the samples for optical properties. This optical
properties data set will be used to assess the potential for the use of selected optical signals as surrogates for FIB estimation
with the same techniques as those used with the human-associated bacteria. This information would expand the utility of this
data set beyond the initial intent for limiting analysis to human-specific contamination.
ROUNDTABLE DISCUSSION SYNTHESIS RE: WASTEWATER DETECTION
METHODS
The following questions and responses were asked of the participants during the KDF session. Please note that the responses
do not necessarily represent the full spectrum of possible responses to these questions, but rather represent only those
highlighted during the KDF discussion period. For instance, costs attributed to techniques and methods are estimates based
on participant responses and may not accurately reflect actual costs.
Water Environment Federation, Water Science & Engineering Center, WSEC-2019-KDF_TR-001 Page 12
WHAT TECHNIQUES ARE USED WITHIN EACH GROUP AND HOW? LIST ADVANTAGES AND LIMITATIONS
AND COST FOR EACH METHOD. ARE THERE METHODS NOT REPRESENTED HERE THAT SHOULD BE, AND
WHAT RESEARCH IS NEEDED?
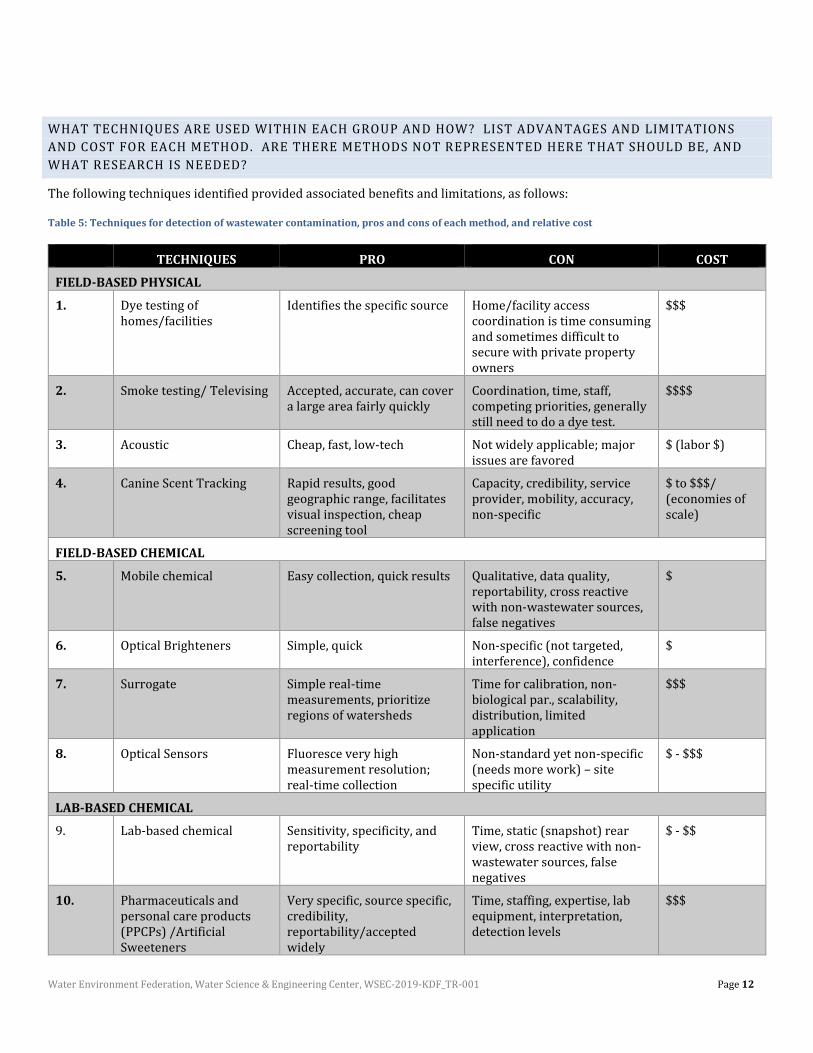
The following techniques identified provided associated benefits and limitations, as follows:
Table 5: Techniques for detection of wastewater contamination, pros and cons of each method, and relative cost
TECHNIQUES PRO CON COST
FIELD-BASED PHYSICAL
1. Dye testing of homes/facilities
Identifies the specific source Home/facility access coordination is time consuming and sometimes difficult to secure with private property owners
$$$
2. Smoke testing/ Televising Accepted, accurate, can cover a large area fairly quickly
Coordination, time, staff, competing priorities, generally still need to do a dye test.
$$$$
3. Acoustic Cheap, fast, low-tech Not widely applicable; major issues are favored
$ (labor $)
4. Canine Scent Tracking Rapid results, good geographic range, facilitates visual inspection, cheap screening tool
Capacity, credibility, service provider, mobility, accuracy, non-specific
$ to $$$/ (economies of scale)
FIELD-BASED CHEMICAL
5. Mobile chemical Easy collection, quick results Qualitative, data quality, reportability, cross reactive with non-wastewater sources, false negatives
$
6. Optical Brighteners Simple, quick Non-specific (not targeted, interference), confidence
$
7. Surrogate Simple real-time measurements, prioritize regions of watersheds
Time for calibration, non-biological par., scalability, distribution, limited application
$$$
8. Optical Sensors Fluoresce very high measurement resolution; real-time collection
Non-standard yet non-specific (needs more work) – site specific utility
$ - $$$
LAB-BASED CHEMICAL
9. Lab-based chemical Sensitivity, specificity, and reportability
Time, static (snapshot) rear view, cross reactive with non-wastewater sources, false negatives
$ - $$
10. Pharmaceuticals and personal care products (PPCPs) /Artificial Sweeteners
Very specific, source specific, credibility, reportability/accepted widely
Time, staffing, expertise, lab equipment, interpretation, detection levels
$$$

Water Environment Federation, Water Science & Engineering Center, WSEC-2019-KDF_TR-001 Page 13
MICROBIOLOGICAL
11. Rapid Coliform Test - 3M (single type)
Can be done in the field; no lab needed
Non-specific source, background sources exist, less effective with intermittent flows, limited dynamic range
$
12. Lab-based microbiological (fecal indicators)
Widely used procedure, established, existing data, EPA risk factors established, established standards
Non-specific source, background sources exist, less effective with intermittent flows, limited sample hold time
$
13. Biosensor Very specific, rapid, configurable
Sensitivity/ chemical oxygen demand (COD), needs vetting, credibility
$$
14. Human bacteria (Genetics Testing)
• Lab-based PCR method
Very specific, source specific, credibility, reportability/accepted widely
Time, staffing, expertise, lab equipment, interpretation
$$$
15. Sequence-based genetic testing (Illumina MiSeq)
In-house, rapid, project level results (prioritize)
Initial Capex; not quantitative, high level of expertise needed for interpretation
$$$ (excluding Capex at onset)
WHAT INFORMATION IS NEEDED FOR INVESTIGATION AND WHAT INFORMATION IS NEEDED FOR ACTION
TO BE TAKEN?
The following information was provided by KDF participants as needed for investigation and action to be taken:
• Information on the following items are beneficial to have in advance of investigating sanitary contamination of
stormwater:
o Groundwater levels and flow direction
o Reporting of sanitary sewer overflows (SSOs) or combined sewer overflows (CSOs)
o Age of the sewer system
o Age of pipes
o Bypass points in the system
o Current sewer and stormwater infrastructure maps
o Most recent inspection information (condition assessments)
o Monitoring flow/level in collection systems in real-time
o Basement backups
o Surcharge conditions
o Catchment characteristics
• For adaptive management action to be taken (further testing with more expensive methods, smoke testing, etc.) the
following were identified in which responses might prompt action:
o A high confidence in the location of wastewater leakage is needed for a remedy to be implemented
o Single sample exceedance of a criterion calls for more focused examination to confirm risk and identify
source(s).
o On the laboratory side - confidence should be high (80% or greater) before further action is taken to ensure
data are sound.
o Management action depends on the scale of the problem. Situations with high-risk to human health
regardless of confidence, and situations with high confidence should be prioritized.
o Wastewater contamination levels exceed water quality standard that reflect a risk to human health.
Water Environment Federation, Water Science & Engineering Center, WSEC-2019-KDF_TR-001 Page 14
o Sufficient redundancy in monitoring must be done to avoid decisions based on false positives.
o Clear directions are needed regarding what the concentrations mean. Is there an action level? What do non-
detects really mean? Was the study design and technology choice appropriate for the question being asked?
o Prioritization of affected water bodies based on potential risk to exposure can help direct resources.
o Improved indicators for human sources are still needed. E.coli still has significant nonhuman sources. More
research on levels of nonhuman sources that may be a health risk is needed. The frequency and type of
human contact with potentially contaminated water should also be considered.
o In coordination with human health risk information, cost-benefit analyses are valuable to leverage available
funds when working in systems with multiple potential deficiencies.
The most effective wastewater contamination detection technique or combination of techniques identified by the
participants. The best contamination technique or combined technique depends on the context, including risk to
human health, and the goal of the investigation. With this in mind, some effective methods are listed below.
o Host-specific markers (qPCR, dPCR) combined with mass balance approaches;
o Dye testing from potential sources for detecting illicit connections;
o Bacteria testing (E. coli, other emerging rapid tests) for surface waters;
o Enzymatic testing (these tests can detect viable organisms that are not actively dividing);
o The use of microbial source tracking can assist in looking for a source, but cost of testing and expertise may
limit its applicability at this time
Education is needed so decision makers are well informed about the state of the sciences. These techniques are most
useful when they can be applied in the right context and the results interpreted properly. Educational information
and other considerations that are needed to empower municipalities and managers to act includes:
o A 'how to document' with successful case studies.
o An understanding of uncertainty in monitoring data.
o Connecting results to human health outcomes and the benefits to the community and watershed.
o Incorporating ratepayers/community members as part of the strategy.
o Realistic preventive maintenance schedules for infrastructure as it ages.
o A need for resilience with respect to climate change including system response to increasing extreme events,
clear understanding where citizens interact with water resources, and concentrating evaluation in areas of
greatest risk.
o Engaging the community to foster a more proactive management of their systems.
o Communication products that focus on leveraging data to make positive contributions.
HOW DO WE INTERPRET RESULTS?
Participant discussion regarding interpretation of the results led to identification of some important considerations.
Limitations for interpreting results include:
• Canine scent tracking provides only positive/negative results
• Using resulting data to prioritize areas of greatest risk is challenging. Mixed positive and negative results are difficult
to interpret.
o Multiple lines of evidence are needed
o Methods to treat uncertainty and variability are necessary (parse out seasonality, etc.)
o Development of a model that considers all factors is needed
• Resulting data from environmental conditions can be highly variable
• Balancing cost, sensitivity, and confidence of methods.
Water Environment Federation, Water Science & Engineering Center, WSEC-2019-KDF_TR-001 Page 15
o A tiered approach is beneficial to find hotspots with appropriate methods to screen for contamination with
inexpensive methods, and follow up using methods with increased sensitivity and confidence in areas where
there is a high likelihood of wastewater contamination
• Competing interests could interpret results differently, for example, different stakeholder may interpret what is “bad”
differently.
• There is a gap between research, citizen science, and approved methods (EPA, etc.)
• Improve communication with municipalities on the interpretation of results.
How to Interpret Results:
• Put results into context with the goals of a monitoring program
o Resources available
o Consider techniques used and timing of samples
o Develop manual decision tree for prioritizing areas
o Use low cost method and follow up with higher cost method where needed
o Use multiple methods for weight of evidence to develop confidence
• Identify responsible party with great caution.
• Final results should be framed in a way that can be understood by general public/multiple audiences
PRACTICAL APPLICATIONS AND FUTURE TECHNOLOGIES
CASE STUDY 1 – INCORPORATING MOLECULAR TESTING AS AN EVIDENTIARY TOOL IN MUNICIPAL WATER
QUALITY MONITORING PROGRAMS – JULIE KINZELMAN, CITY OF RACINE, WI
Dr. Julie Kinzelman, Laboratory Director and Research Scientist for the City of Racine (WI) Public Health Department, provided
insights on the way in which the City of Racine incorporates molecular testing in the identification of pollution sources as part
of their comprehensive watershed assessment program. An emphasis is placed on visual observation; site surveys (indicators
+ conditions); and microbial source tracking. Chemical and microbial indicators include: E. coli, pH, temperature, turbidity,
conductivity, detergents, chlorine, copper, phenols, and nutrients. Fecal source tracking markers include human-specific
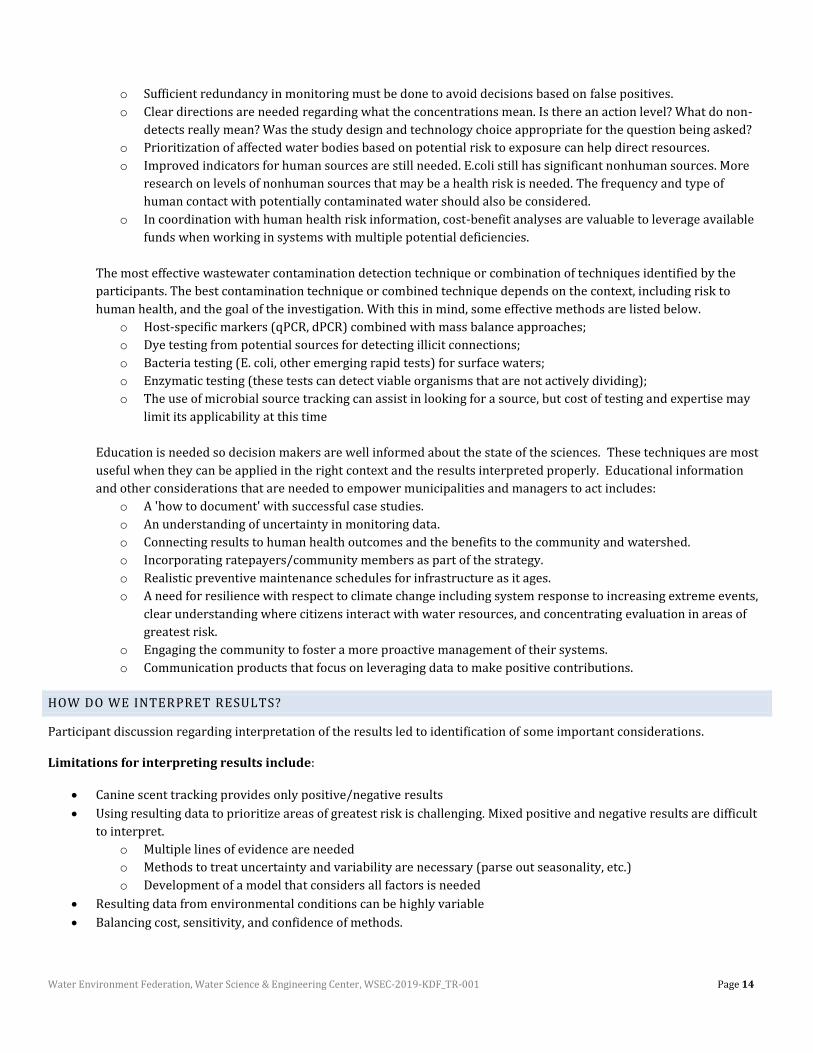
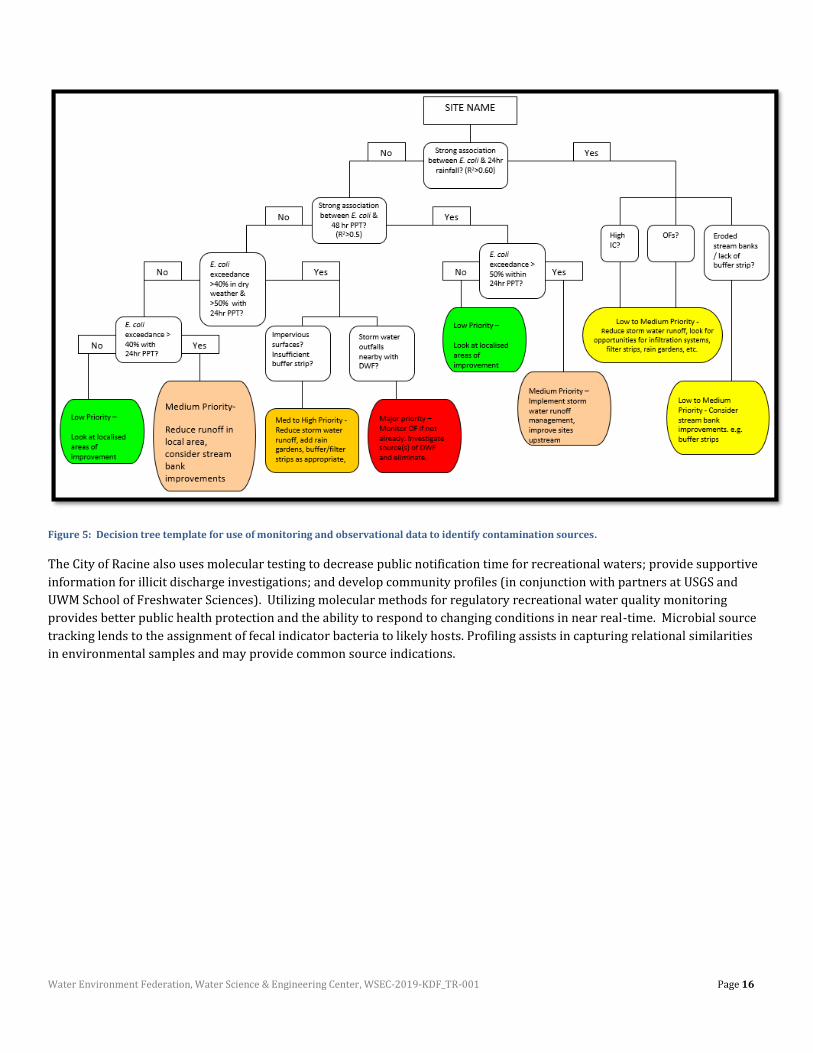
Bacteroides and Lachnospiraceae. Utilizing the accumulated data, the City of Racine employs a decision tree approach derived
from the correlation between water quality parameters, environmental parameters and physical assessments to guide future
actions (Figure 5).
Water Environment Federation, Water Science & Engineering Center, WSEC-2019-KDF_TR-001 Page 16
Figure 5: Decision tree template for use of monitoring and observational data to identify contamination sources.
The City of Racine also uses molecular testing to decrease public notification time for recreational waters; provide supportive
information for illicit discharge investigations; and develop community profiles (in conjunction with partners at USGS and
UWM School of Freshwater Sciences). Utilizing molecular methods for regulatory recreational water quality monitoring
provides better public health protection and the ability to respond to changing conditions in near real-time. Microbial source
tracking lends to the assignment of fecal indicator bacteria to likely hosts. Profiling assists in capturing relational similarities
in environmental samples and may provide common source indications.
Water Environment Federation, Water Science & Engineering Center, WSEC-2019-KDF_TR-001 Page 17
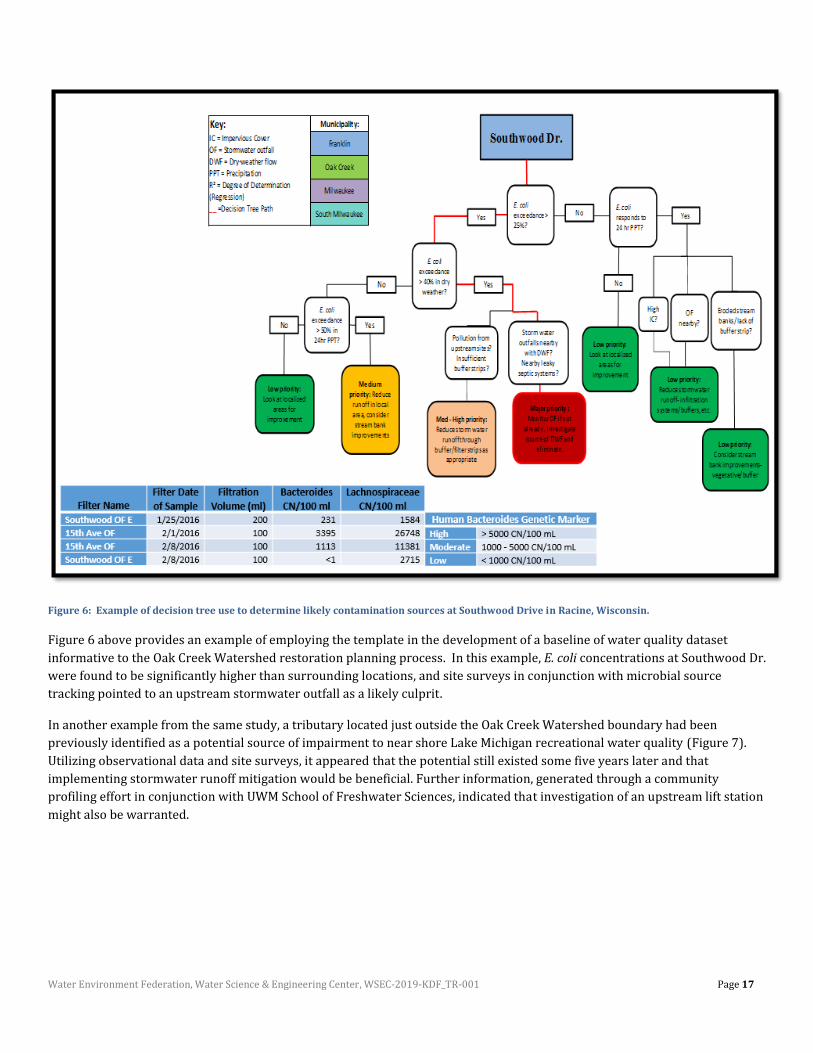
Figure 6: Example of decision tree use to determine likely contamination sources at Southwood Drive in Racine, Wisconsin.
Figure 6 above provides an example of employing the template in the development of a baseline of water quality dataset
informative to the Oak Creek Watershed restoration planning process. In this example, E. coli concentrations at Southwood Dr.
were found to be significantly higher than surrounding locations, and site surveys in conjunction with microbial source
tracking pointed to an upstream stormwater outfall as a likely culprit.
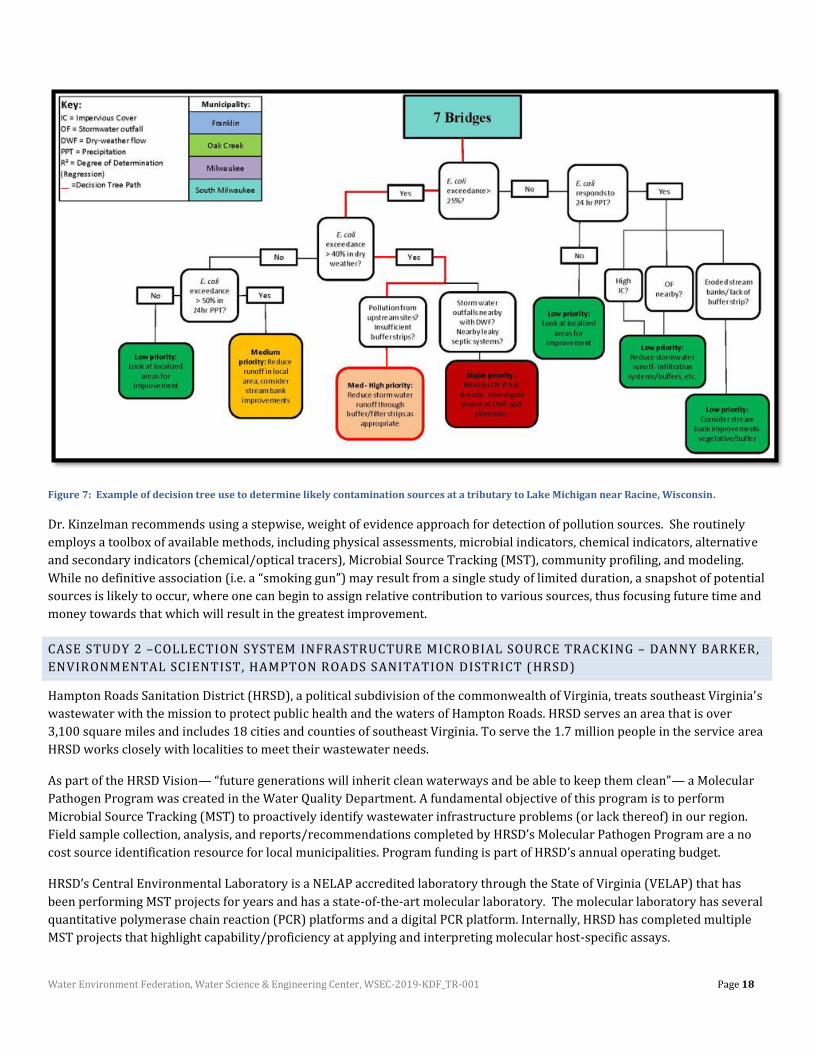
In another example from the same study, a tributary located just outside the Oak Creek Watershed boundary had been
previously identified as a potential source of impairment to near shore Lake Michigan recreational water quality (Figure 7).
Utilizing observational data and site surveys, it appeared that the potential still existed some five years later and that
implementing stormwater runoff mitigation would be beneficial. Further information, generated through a community
profiling effort in conjunction with UWM School of Freshwater Sciences, indicated that investigation of an upstream lift station
might also be warranted.
Water Environment Federation, Water Science & Engineering Center, WSEC-2019-KDF_TR-001 Page 18
Figure 7: Example of decision tree use to determine likely contamination sources at a tributary to Lake Michigan near Racine, Wisconsin.
Dr. Kinzelman recommends using a stepwise, weight of evidence approach for detection of pollution sources. She routinely
employs a toolbox of available methods, including physical assessments, microbial indicators, chemical indicators, alternative
and secondary indicators (chemical/optical tracers), Microbial Source Tracking (MST), community profiling, and modeling.
While no definitive association (i.e. a “smoking gun”) may result from a single study of limited duration, a snapshot of potential
sources is likely to occur, where one can begin to assign relative contribution to various sources, thus focusing future time and
money towards that which will result in the greatest improvement.
CASE STUDY 2 –COLLECTION SYSTEM INFRASTRUCTURE MICROBIAL SOURCE TRACKING – DANNY BARKER,
ENVIRONMENTAL SCIENTIST, HAMPTON ROADS SANITATION DISTRICT (HRSD)
Hampton Roads Sanitation District (HRSD), a political subdivision of the commonwealth of Virginia, treats southeast Virginia’s
wastewater with the mission to protect public health and the waters of Hampton Roads. HRSD serves an area that is over
3,100 square miles and includes 18 cities and counties of southeast Virginia. To serve the 1.7 million people in the service area
HRSD works closely with localities to meet their wastewater needs.
As part of the HRSD Vision— “future generations will inherit clean waterways and be able to keep them clean”— a Molecular
Pathogen Program was created in the Water Quality Department. A fundamental objective of this program is to perform
Microbial Source Tracking (MST) to proactively identify wastewater infrastructure problems (or lack thereof) in our region.
Field sample collection, analysis, and reports/recommendations completed by HRSD’s Molecular Pathogen Program are a no
cost source identification resource for local municipalities. Program funding is part of HRSD’s annual operating budget.
HRSD’s Central Environmental Laboratory is a NELAP accredited laboratory through the State of Virginia (VELAP) that has
been performing MST projects for years and has a state-of-the-art molecular laboratory. The molecular laboratory has several
quantitative polymerase chain reaction (PCR) platforms and a digital PCR platform. Internally, HRSD has completed multiple
MST projects that highlight capability/proficiency at applying and interpreting molecular host-specific assays.
Water Environment Federation, Water Science & Engineering Center, WSEC-2019-KDF_TR-001 Page 19
HRSD began an effort to reduce bacteria contamination in local waterways by proactively identifying and repairing sources of
human fecal contamination. To accomplish this objective HRSD has been applying molecular MST tools to stormwater and
sewer infrastructure samples with the goal of either identifying compromised infrastructure or defining the fecal
contamination origin to a smaller, more manageable area. The backbone of HRSD’s source tracking studies has been the
implementation of rapid in-house human-associated molecular assays that have high sensitivity and specificity (e.g. Human-
associated Bacteroides, detected by the HF183 marker assay). Informed, adaptive results-based decisions used in tandem with
local knowledge of sanitary sewer and stormwater maps allow HRSD to trace a human fecal signal through infrastructure to a
point of origin.
Due to the large number of potential sites within a collection system’s infrastructure, HF183 is used to narrow down and
locate compromised infrastructure issues. EPA’s HumM2 and/or crAssphage molecular assays are used in tandem with HF183
results to confirm remediation (repair) of infrastructure problems using a weight-of-evidence approach.
The successes of the program include:
• In-pipe infrastructure investigations
o Elimination of dilution and marker degradation
• Matrix inhibition alleviation
o Elimination of false negative results
• In-house data turnaround
o Adaptive sampling design based on prior sample data
o Knowledge of local marker concentrations
• Engineering tools (e.g. DNA mass balances, infrastructure monitoring)
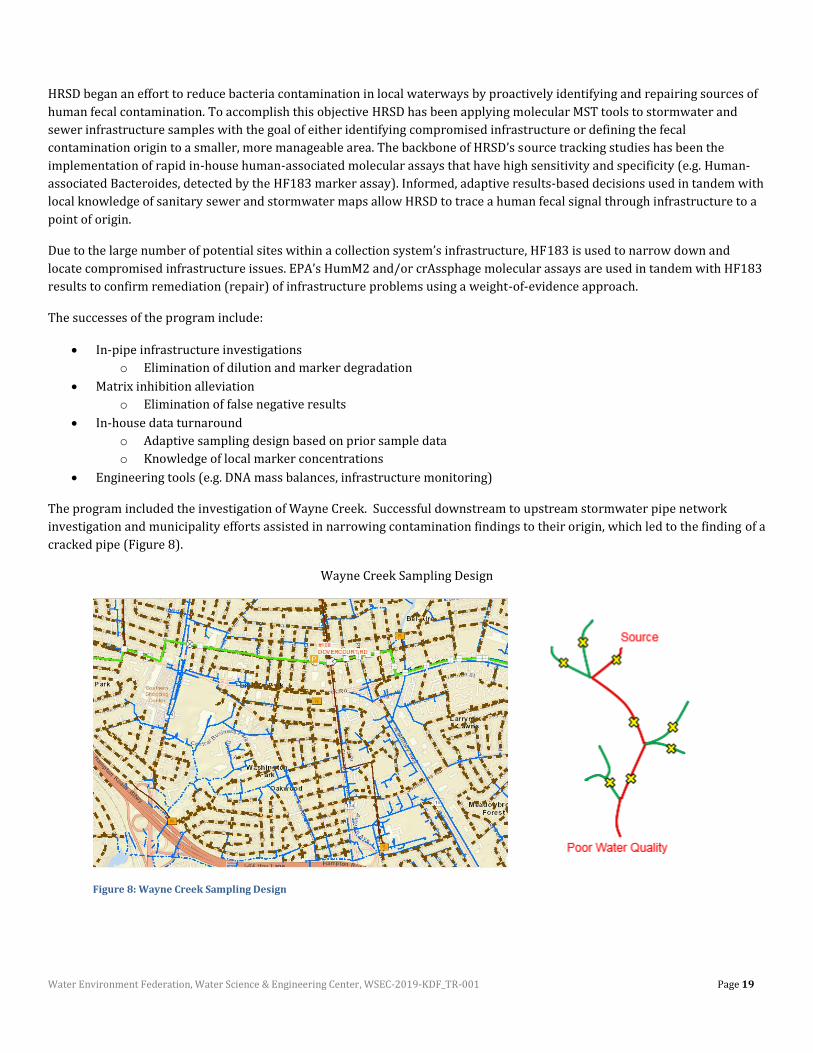
The program included the investigation of Wayne Creek. Successful downstream to upstream stormwater pipe network
investigation and municipality efforts assisted in narrowing contamination findings to their origin, which led to the finding of a
cracked pipe (Figure 8).
Wayne Creek Sampling Design
Figure 8: Wayne Creek Sampling Design
Water Environment Federation, Water Science & Engineering Center, WSEC-2019-KDF_TR-001 Page 20
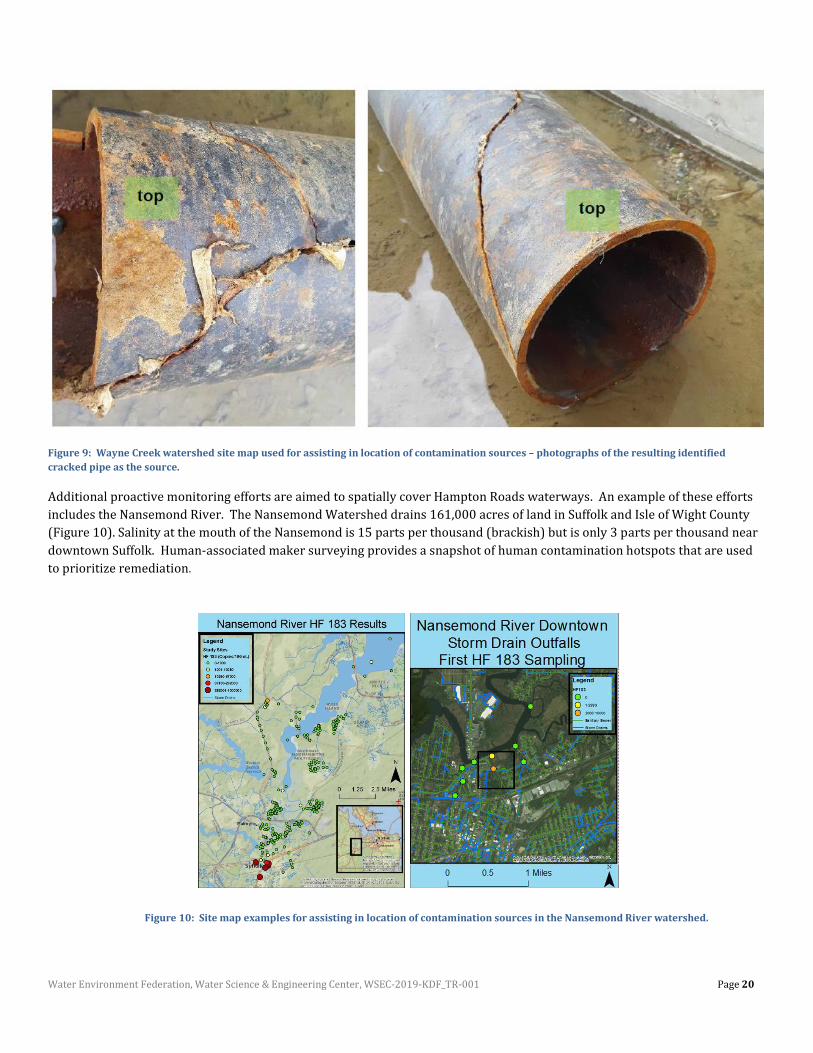
Figure 9: Wayne Creek watershed site map used for assisting in location of contamination sources – photographs of the resulting identified
cracked pipe as the source.
Additional proactive monitoring efforts are aimed to spatially cover Hampton Roads waterways. An example of these efforts
includes the Nansemond River. The Nansemond Watershed drains 161,000 acres of land in Suffolk and Isle of Wight County
(Figure 10). Salinity at the mouth of the Nansemond is 15 parts per thousand (brackish) but is only 3 parts per thousand near
downtown Suffolk. Human-associated maker surveying provides a snapshot of human contamination hotspots that are used
to prioritize remediation.
Figure 10: Site map examples for assisting in location of contamination sources in the Nansemond River watershed.
Water Environment Federation, Water Science & Engineering Center, WSEC-2019-KDF_TR-001 Page 21
CASE STUDY 3 –ILLICIT DISCHARGE INVESTIGATION EXAMPLES: UNRAVELING THE SPAGHETTI - ANNETTE
DEMARIA, P.E., PRINCIPAL ENGINEER, ENVIRONMENTAL CONSULTING & TECHNOLOGY, INC
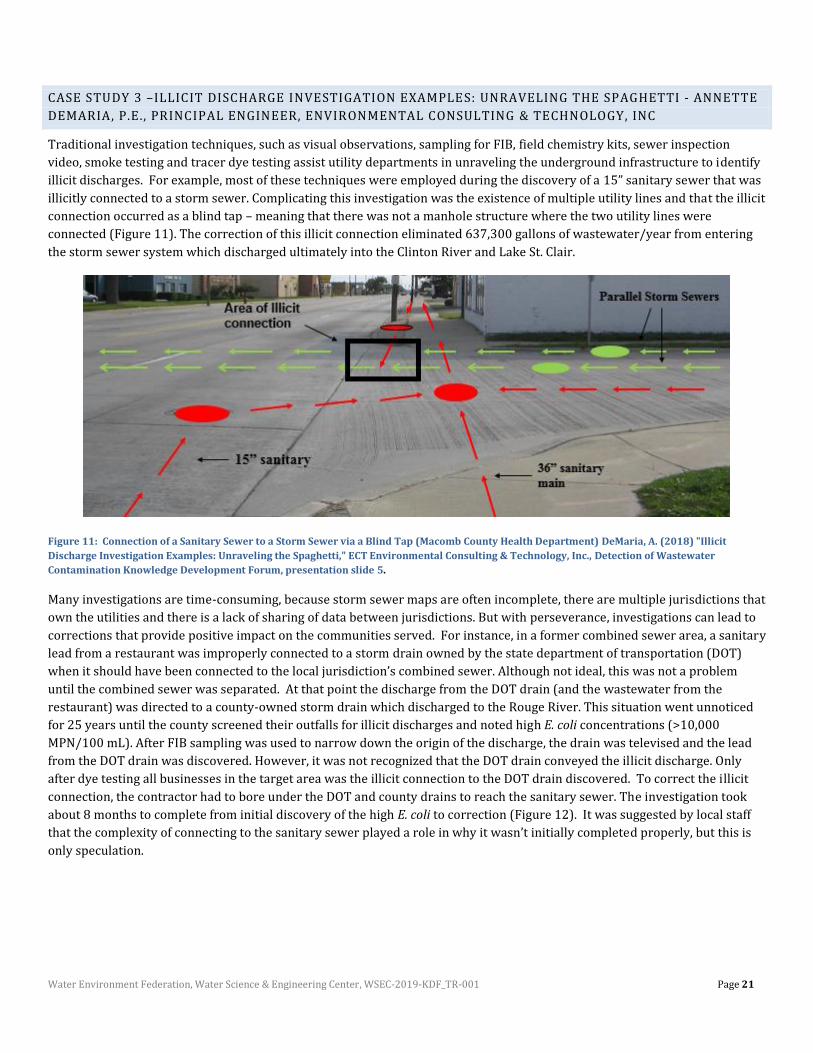
Traditional investigation techniques, such as visual observations, sampling for FIB, field chemistry kits, sewer inspection
video, smoke testing and tracer dye testing assist utility departments in unraveling the underground infrastructure to identify
illicit discharges. For example, most of these techniques were employed during the discovery of a 15” sanitary sewer that was
illicitly connected to a storm sewer. Complicating this investigation was the existence of multiple utility lines and that the illicit
connection occurred as a blind tap – meaning that there was not a manhole structure where the two utility lines were
connected (Figure 11). The correction of this illicit connection eliminated 637,300 gallons of wastewater/year from entering
the storm sewer system which discharged ultimately into the Clinton River and Lake St. Clair.
Figure 11: Connection of a Sanitary Sewer to a Storm Sewer via a Blind Tap (Macomb County Health Department) DeMaria, A. (2018) "Illicit
Discharge Investigation Examples: Unraveling the Spaghetti," ECT Environmental Consulting & Technology, Inc., Detection of Wastewater
Contamination Knowledge Development Forum, presentation slide 5.
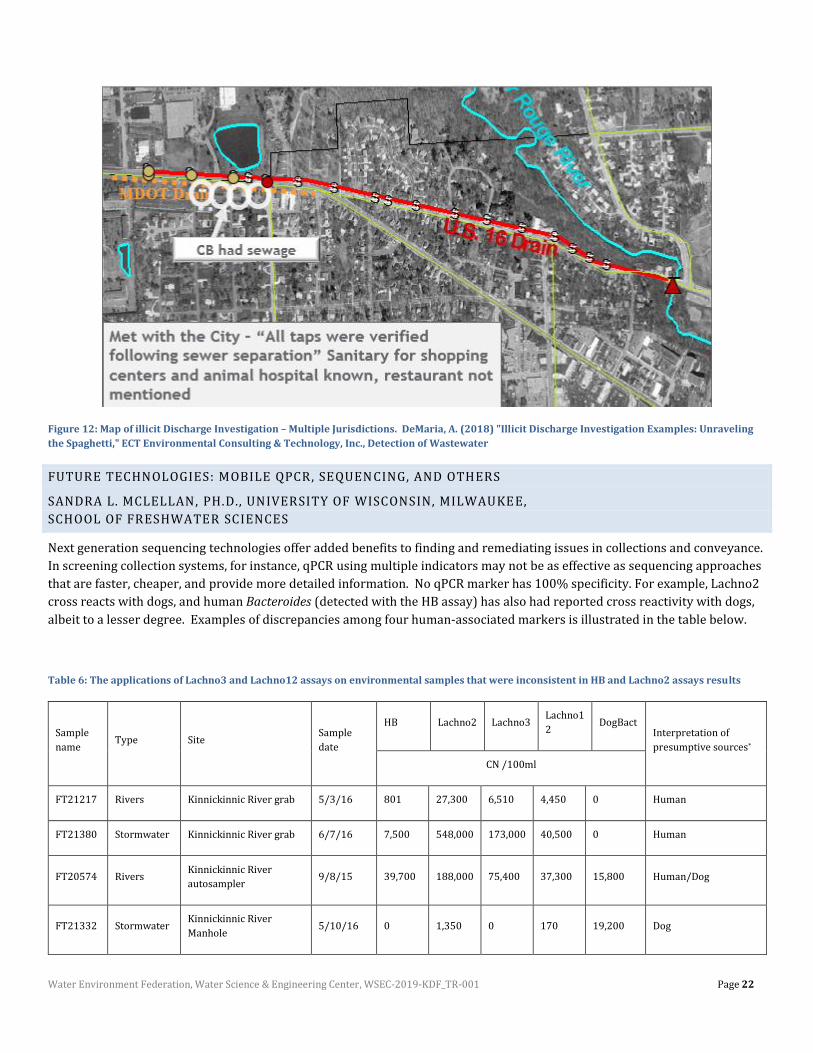
Many investigations are time-consuming, because storm sewer maps are often incomplete, there are multiple jurisdictions that
own the utilities and there is a lack of sharing of data between jurisdictions. But with perseverance, investigations can lead to
corrections that provide positive impact on the communities served. For instance, in a former combined sewer area, a sanitary
lead from a restaurant was improperly connected to a storm drain owned by the state department of transportation (DOT)
when it should have been connected to the local jurisdiction’s combined sewer. Although not ideal, this was not a problem
until the combined sewer was separated. At that point the discharge from the DOT drain (and the wastewater from the
restaurant) was directed to a county-owned storm drain which discharged to the Rouge River. This situation went unnoticed
for 25 years until the county screened their outfalls for illicit discharges and noted high E. coli concentrations (>10,000
MPN/100 mL). After FIB sampling was used to narrow down the origin of the discharge, the drain was televised and the lead
from the DOT drain was discovered. However, it was not recognized that the DOT drain conveyed the illicit discharge. Only
after dye testing all businesses in the target area was the illicit connection to the DOT drain discovered. To correct the illicit
connection, the contractor had to bore under the DOT and county drains to reach the sanitary sewer. The investigation took
about 8 months to complete from initial discovery of the high E. coli to correction (Figure 12). It was suggested by local staff
that the complexity of connecting to the sanitary sewer played a role in why it wasn’t initially completed properly, but this is
only speculation.
Water Environment Federation, Water Science & Engineering Center, WSEC-2019-KDF_TR-001 Page 22
Figure 12: Map of illicit Discharge Investigation – Multiple Jurisdictions. DeMaria, A. (2018) "Illicit Discharge Investigation Examples: Unraveling
the Spaghetti," ECT Environmental Consulting & Technology, Inc., Detection of Wastewater
FUTURE TECHNOLOGIES: MOBILE QPCR, SEQUENCING, AND OTHERS
SANDRA L. MCLELLAN, PH.D., UNIVERSITY OF WISCONSIN, MILWAUKEE,
SCHOOL OF FRESHWATER SCIENCES
Next generation sequencing technologies offer added benefits to finding and remediating issues in collections and conveyance.
In screening collection systems, for instance, qPCR using multiple indicators may not be as effective as sequencing approaches
that are faster, cheaper, and provide more detailed information. No qPCR marker has 100% specificity. For example, Lachno2
cross reacts with dogs, and human Bacteroides (detected with the HB assay) has also had reported cross reactivity with dogs,
albeit to a lesser degree. Examples of discrepancies among four human-associated markers is illustrated in the table below.
Table 6: The applications of Lachno3 and Lachno12 assays on environmental samples that were inconsistent in HB and Lachno2 assays results
Sample
name Type Site
Sample
date
HB Lachno2 Lachno3 Lachno1
2 DogBact
Interpretation of
presumptive sources*
CN /100ml
FT21217 Rivers Kinnickinnic River grab 5/3/16 801 27,300 6,510 4,450 0 Human
FT21380 Stormwater Kinnickinnic River grab 6/7/16 7,500 548,000 173,000 40,500 0 Human
FT20574 Rivers Kinnickinnic River
autosampler 9/8/15 39,700 188,000 75,400 37,300 15,800 Human/Dog
FT21332 Stormwater Kinnickinnic River
Manhole 5/10/16 0 1,350 0 170 19,200 Dog
Water Environment Federation, Water Science & Engineering Center, WSEC-2019-KDF_TR-001 Page 23
FT12198 Stormwater Wilson Park Creek
Outfall 25 6/21/12 566 0 0 132 0 Raccoon
FT12431 Stormwater Honey Creek 05 7/24/12 672 318 151 162 0 Low human
FT14569 Beaches South shore old beach
001 7/9/13 BLD 1,760 394 391 276 Low human/ Low dog
FT14570 Beaches South shore old beach
002 7/9/13 166 3,460 1,000 1,430 1,060 Human/Dog
FT14571 Beaches South shore old beach
003 7/9/13 0 18,100 985 765 27,900 Low human/Dog
FT15268 Stormwater Kinnickinnic River
Outfall 47 10/31/13 3,540 0 0 0 0 Raccoon
FT15280 Stormwater Kinnickinnic River
Outfall New 11/6/13 225 33,700 249 196 8,710 Human/Dog
FT17167 Rivers Kinnickinnic River 7/22/14 1,381 34,000 6,730 8,900 944 Human/Dog
FT17171 Rivers Kinnickinnic River 7/22/14 375 6,450 821 1,610 0 Human
FT17708 Stormwater Wilson Park Creek
Outfall 07 8/25/14 BLD** 9,020 1,630 466 839 Human/Dog
FT17713 Stormwater Wilson Park Creek
Outfall 15 8/25/14 0 6,150 107 193 408 Low human/Low dog
FT18040 Stormwater Wilson Park Creek
Outfall 18 10/14/14 BLD** 9,620 1,890 185 0 Human
FT19920 Rivers Menomonee River 7/9/15 0 675 265 161 0 Human
FT20193 Beaches South Shore Old Beach
001 8/10/15 0 1,320 132 0 320 Low human/ Low dog
FT20724 Stormwater Russell Avenue Manhole 10/28/15 8,560 0 45 256 0 Raccoon
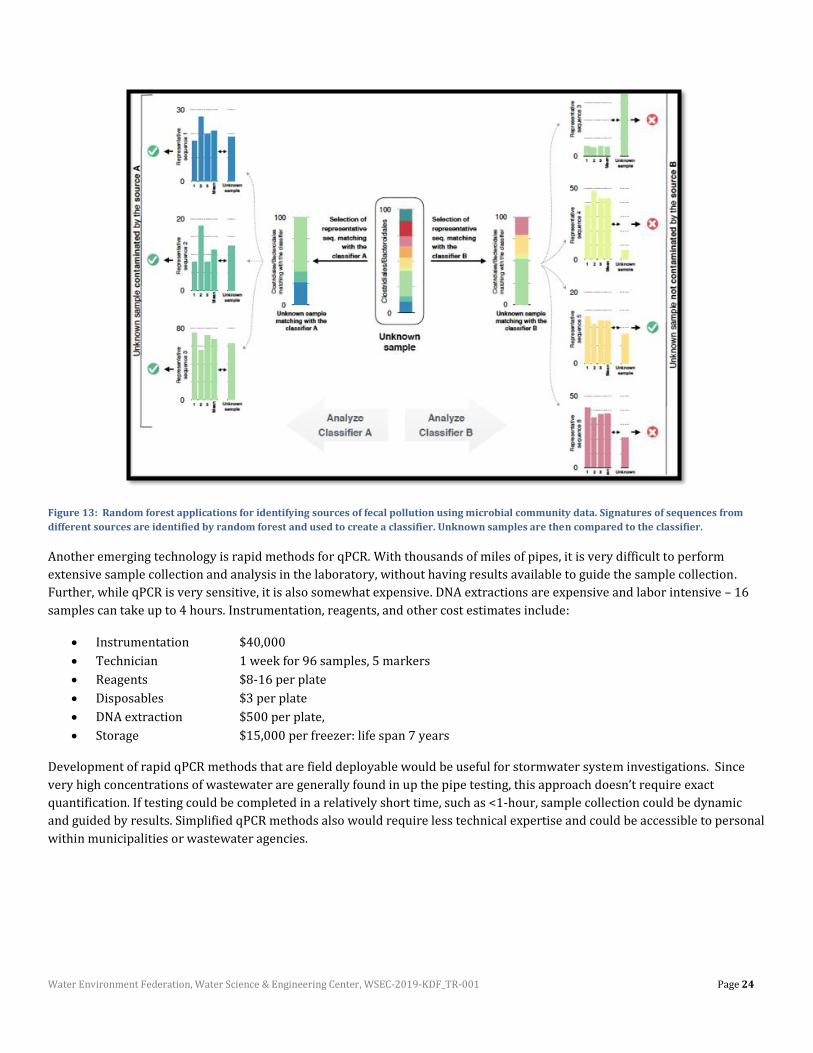
Next generation sequencing can be used to inventory host-specific bacteria and has ushered in a whole new era in microbial
ecology. Next generation sequencing can sequence 10,000,000 bacteria per run – nearly 100,000 per sample, which gives a
very in-depth profile of the organisms that are present. To analyze these complex datasets, there are a variety of bioinformatic
tools available. Random forest is one machine learning algorithm that is used to create a classifier by selecting signature of
sequences (Figure 13). This type of very high-level resolution data would be useful in sewersheds that have a mixture of fecal
pollution sources. Further, the falling cost of sequencing (as low as $50/sample in some cases) may make the approach
feasible in the future.
Water Environment Federation, Water Science & Engineering Center, WSEC-2019-KDF_TR-001 Page 24
Figure 13: Random forest applications for identifying sources of fecal pollution using microbial community data. Signatures of sequences from
different sources are identified by random forest and used to create a classifier. Unknown samples are then compared to the classifier.
Another emerging technology is rapid methods for qPCR. With thousands of miles of pipes, it is very difficult to perform
extensive sample collection and analysis in the laboratory, without having results available to guide the sample collection.
Further, while qPCR is very sensitive, it is also somewhat expensive. DNA extractions are expensive and labor intensive – 16
samples can take up to 4 hours. Instrumentation, reagents, and other cost estimates include:
• Instrumentation $40,000
• Technician 1 week for 96 samples, 5 markers
• Reagents $8-16 per plate
• Disposables $3 per plate
• DNA extraction $500 per plate,
• Storage $15,000 per freezer: life span 7 years
Development of rapid qPCR methods that are field deployable would be useful for stormwater system investigations. Since
very high concentrations of wastewater are generally found in up the pipe testing, this approach doesn’t require exact
quantification. If testing could be completed in a relatively short time, such as <1-hour, sample collection could be dynamic
and guided by results. Simplified qPCR methods also would require less technical expertise and could be accessible to personal
within municipalities or wastewater agencies.
Water Environment Federation, Water Science & Engineering Center, WSEC-2019-KDF_TR-001 Page 25
ROUNDTABLE DISCUSSION SYNTHESIS RE: CHALLENGES FOR
IMPLEMENTING WASTEWATER DETECTION PROGRAMS
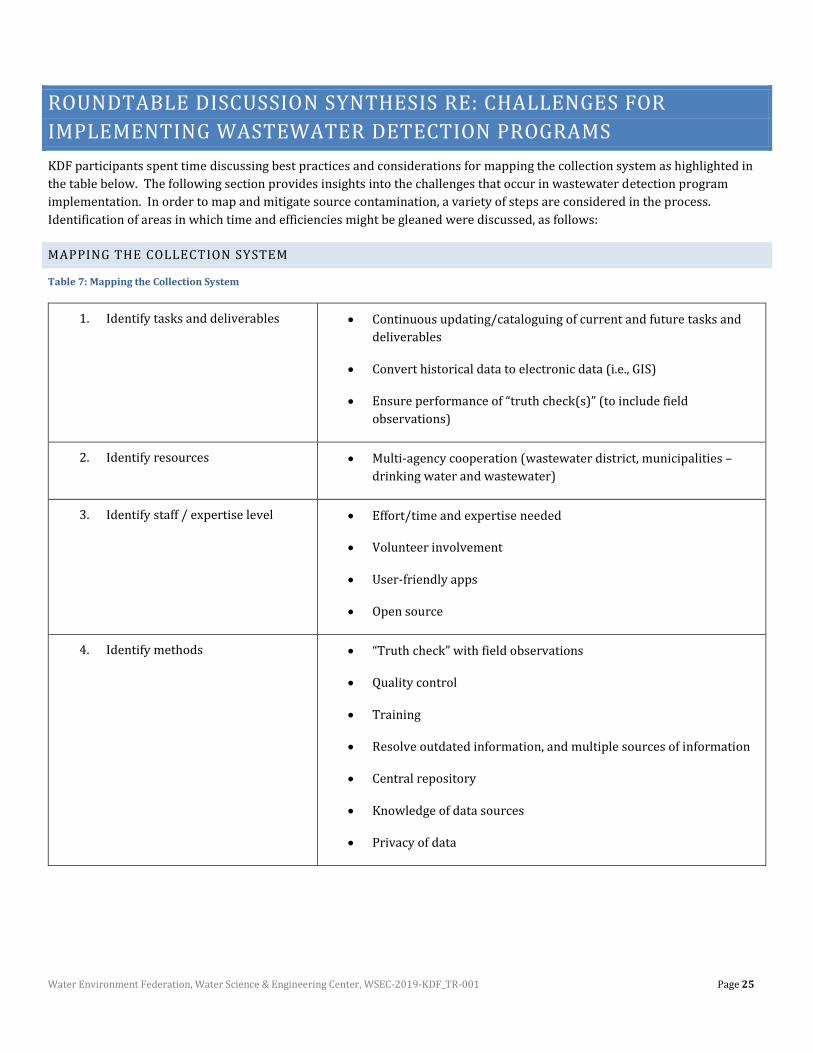
KDF participants spent time discussing best practices and considerations for mapping the collection system as highlighted in
the table below. The following section provides insights into the challenges that occur in wastewater detection program
implementation. In order to map and mitigate source contamination, a variety of steps are considered in the process.
Identification of areas in which time and efficiencies might be gleaned were discussed, as follows:
MAPPING THE COLLECTION SYSTEM
Table 7: Mapping the Collection System
1. Identify tasks and deliverables • Continuous updating/cataloguing of current and future tasks and
deliverables
• Convert historical data to electronic data (i.e., GIS)
• Ensure performance of “truth check(s)” (to include field
observations)
2. Identify resources • Multi-agency cooperation (wastewater district, municipalities –
drinking water and wastewater)
3. Identify staff / expertise level • Effort/time and expertise needed
• Volunteer involvement
• User-friendly apps
• Open source
4. Identify methods • “Truth check” with field observations
• Quality control
• Training
• Resolve outdated information, and multiple sources of information
• Central repository
• Knowledge of data sources
• Privacy of data
Water Environment Federation, Water Science & Engineering Center, WSEC-2019-KDF_TR-001 Page 26
WHAT ARE THE MAJOR HURDLES FOR BACKTRACKING? FINANCIAL, EXPERTISE, ADMINISTRATIVE,
RESEARCH NEEDS, POLITICAL WILL. WHAT NEEDS TO HAPPEN LOGISTICALLY? ADMINISTRATIVELY?
KDF participants discussed the most challenging issues in the process of administering a program for remediating wastewater
contamination sources. Some of these challenges are listed below:
• Financial
o There can be challenges in demonstrating that there will be a beneficial return on investment including an impact
on the desired public good.
o Treatment of environmental justice issues need to be defined
o Competing priorities can limit resources
o Long-term payback needs evaluation and justification
• Expertise
o To keep up with changing technology, expertise needs to evolve
o The industry can struggle to maintain sufficient expertise to conduct field, laboratory, and administrative tasks
• Research
o Procurement of financial support to advance technology and methods is an ongoing and challenging process that
requires substantial funds
o Justification is needed to prove worth for research and development investments
• Political
o There can be a distrust in public-private partnerships in some instances
o Justification of the benefits can be questioned
CAN PRODUCTION LABORATORIES HELP? WHAT TURN-AROUND TIME IS NEEDED?
KDF participants exchanged views on the option of using production laboratories rather than field techniques to help with
monitoring needs and listed the following items to consider:
• Private and municipal laboratories have potentially important roles that they could play.
• Parameters could include fundamental water chemistry and microbiology through advanced analysis such as
pharmaceuticals and host-specific microorganisms.
• Assistance with interpretation of results would be helpful, especially for more modern and advanced parameters.
• Cost could be a limitation as well as turn-around times.
• Proximity of laboratories could influence the ability to meet holding time requirements.
• Turn-around time requirements would vary depending on the situation. In general, 24-hour to 2-week time periods
would be beneficial for these types of investigations.
WHAT FINANCIAL BARRIERS ARE THERE?
Like many areas of research, financial barriers can prove to be the limiting factor in the scope of projects moving forward, or in
halting projects in mid-stream. KDF participants noted financial barriers as one of, if not the, most significant barrier to
innovation in research development. The following responses were additionally provided as financial barriers:
• There is often the sentiment that “It is someone else’s problem”
• Garnering the political will to make investments
• Data and evidence-based reasoning sometimes does not convince those who are opposed to support for these efforts
• Regulatory priorities may or may not support the need to remediate wastewater contamination issues depending on
the circumstances
• Financial priorities (competing interests) may result in a lack of incentive to provide resources
• Outside contracts may be needed to fill the needed expertise or capacity.
Water Environment Federation, Water Science & Engineering Center, WSEC-2019-KDF_TR-001 Page 27
• Stakeholders may not be informed properly to develop the perception that this is important work.
• Not a clear return on investment
• Scalability
• Reduction of federal and state funds (lack of O&M support; federal funding exclusion for infrastructure)
HOW CAN EFFECTIVENESS IN RESULTS INTERPR ETATION BE IMPLEMENTED THROUGH INFORMATION
SHARING AMONG AGENCIES?
In assessing coordination and collaboration opportunities to improve effectiveness in results interpretation, KDF participants
discussed opportunities for furthering information sharing potential, while at the same time noting the need to coordinate
with one another to alleviate duplicative activities and ensure that fragmented results are shared for incorporation into
higher-level extrapolations.
How can effectiveness in results be improved through information sharing among agencies?
• Learning nuances of strategy and approaches through experience of colleagues
• Sharing of project planning techniques to achieve desired results
• Availability of open source tools
• Share of information is most effective when done in a timely fashion
• Eliminating “silos” would help inform all stakeholders
• Sharing of information would help inform all stakeholders
• More opportunities to be involved in forums to share ideas would be beneficial to bring relevant entities together
• Joint databases would allow seamless data sharing
• Sharing mapping applications among different levels of organizations would increase efficiency and leverage
resources
• Collaborative grants would help to provide resources in areas where needed
• Collaborative field work may reduce travel needs
Water Environment Federation, Water Science & Engineering Center, WSEC-2019-KDF_TR-001 Page 28
WHAT RESEARCH NEEDS TO BE DONE?
Investment in research and development will assist in fueling advancements in detection of wastewater
contamination. The KDF participants provided feedback on research topics that could use some emphasis as
follows:
CONTAMINATION DETECTION AND SOURCE IDENTIFICATION
• Development of improved methods for reliable, accessible, and time-relevant wastewater-specific indicators is
needed.
• Identification and implementation of multiple reliable microbial source tracking markers are needed to improve
confidence in results.
• Innovative development of real-time PCR for rapid estimation (mobile field unit) of microbial contaminants.
• Development of real-time sensors as surrogates for microbial contaminants to better define magnitude and variability
throughout contamination events via grab samples or unattended deployments.
• Identification of additional parameters that are specific to human wastewater, easy and inexpensive to measure in a
rapid timeframe.
• Field-level methods/sensors are needed to reliably identify and quantify existing human-specific microbial markers
or chemical wastewater-specific parameters by direct measurement or surrogate techniques.
• Better definition of safety thresholds for monitoring parameters to understand the risk from human and non-human
sources.
• Development of volunteer monitoring/surveillance program to help define potential contamination areas.
• Study the use of remote sensing and heat mapping for locating areas of contamination.
• Development of more effective and efficient methods of identifying, ranking, and prioritizing individual private
property source contributors within a specific project area. This could include microbial indicators and water quality
parameters, and flow-based assessment to identify suspect properties.
• Consider all physical, thermal, and chemical properties of sanitary water to develop more novel methods of source
identification on the micro level for the residential private sector.
• Development of more effective and efficient methods of distinguishing the characteristics of the contribution once a
property has been identified by considering flow contribution from a source with a diverse set of metrics (flow, temp,
chemical composition) to assess the likely composition of the contribution (% sanitary lateral, % foundation drain,
etc).
• Conduct research to determine which combinations of methods in variable conditions provides the most robust, cost
effective, and widely applicable means for identifying wastewater components in ambient water.
• Conduct research to define how current approved methods correlate to next generation methods.
• Conduct a formal evaluation of the effectiveness of mobile chemistry test kits to define effectiveness and uncertainties
involved in identifying contamination sources with these methods.
• Formulation of methods to limit false positive and false negative errors in detection of wastewater contamination.
• Evaluate the use of rapid E. coli and fecal coliform testing methods.
• Consider options for implementing proactive vs. reactive wastewater detection monitoring.
GUIDANCE AND TOOLS
• Development of a toolbox of means and methods for detecting wastewater contamination utilizing traditional
microbial, molecular, chemical and emerging methods.
• Development of additional guidance on how to address contamination from private laterals.
• Development of a decision tree framework for locating and prioritizing likely portals of entry/sources of wastewater
contamination
Water Environment Federation, Water Science & Engineering Center, WSEC-2019-KDF_TR-001 Page 29
• Development of an update of the Center for Watershed Protection document (Illicit Discharge Detection and
Elimination. A Guidance Manual for Program Development and Technical Assessments) that incorporates the latest
techniques.
• Development of a best practices/industry standard for pollution source investigation.
• Development of guidance for public education (i.e. understanding who is responsible for the pipes, risk to public,
working with insurance companies to replace laterals, etc.)
• Development of training protocols for end users to effectively make use of new technologies (markers, instruments,
etc.).
REMEDIES
• Conduct research to determine the effectiveness of green infrastructure for wastewater contaminants.
• Evaluation of the feasibility of end-of-pipe treatment before discharging into surface water systems.
• Defining options for products that can be used to minimize risk of infrastructure failures (ex., types of pipes).
• Development of methods to efficiently conduct cost/benefit analysis for repairing leaks and prioritizing remediation
efforts.
• Conduct research and development on materials and methods for reducing rehabilitation costs on private property
including use of current innovation in the public and commercial private sector and applying it to the residential
private sector of sanitary and water infrastructure.
MANAGEMENT
• Identify partners for provision or development of best practice case studies that demonstrate an effective team
approach to IDDE; i.e. it may not be collaboration of departments, agencies, and consultants.
• Identify partners for provision or development of examples for practitioners to reference where entities have worked
through remedies and red tape to successfully remove sources of wastewater contamination.
• Develop innovative policy and funding approaches to help expand opportunities.
• Investigate opportunities for public/private partnerships in support of this work.
• Work with regulators at local, state, and national levels to approve next generation methods.
• Develop centralized location to store data, accessible to anyone (including metadata of pipe system as well as results).
Water Environment Federation, Water Science & Engineering Center, WSEC-2019-KDF_TR-001 Page 30
REFERENCES
Amick, R. S., and Burgess, E. H. (2000) “Exfiltration in Sewer Systems.” EPA/600/R-01/034. Cincinnati, OH: U.S. Environmental
Protection Agency.
Barker, D. (2018) "Collection System Infrastructure Microbial Source Tracking," HRSD, Detection of Wastewater
Contamination Knowledge Development Forum presentation.
Bernhard A.E. and Field K.G. (2000) A PCR assay to discriminate human and ruminant feces on the basis of host differences in
Bacteroides-Prevotella genes encoding 16S rRNA. Appl. Environ. Microbiol. 66. 4571-4574.
Brown, E., Caraco, D., Pitt, R. (2004) Illicit Discharge Detection and Elimination: A Guidance Manual for Program Development
and Technical Assessments," Center for Watershed Protection and University of Alabama, Web., https://owl.cwp.org/mdocs-
posts/idde-guidance-manual/
Deb Caraco, D. (2018)"Chemistry Techniques: Strengths, Weaknesses, and Where Chemistry Fits Best," Center for Watershed
Protection, Detection of Wastewater Contamination Knowledge Development Forum presentation.
Corsi, S. R. and McLellan, S.L. (2018) Optical Properties of Water for Prediction of Wastewater Contamination in Surface
Water," U.S. Geological Survey and University of Wisconsin-Milwaukee, Detection of Wastewater Contamination Knowledge
Development Forum presentation.
DeMaria, A. (2018) "Illicit Discharge Investigation Examples: Unraveling the Spaghetti," ECT Environmental Consulting &
Technology, Inc., Detection of Wastewater Contamination Knowledge Development Forum presentation.
Fellman, Jason B., Eran Hood, and Robert G. M. Spencer (2010) “Fluorescence Spectroscopy Opens New Windows into
Dissolved Organic Matter Dynamics in Freshwater Ecosystems: A Review.” Limnology and Oceanography 55 (6): 2452–62.
https://doi.org/10.4319/lo.2010.55.6.2452.
Instituto Nacional de Estadística Geografía e Informática, The Atlas of Canada, and U.S. Geological Survey. 2006a. “North
American Atlas - Hydrography: Government of Canada, Ottawa, Ontario, Canada.” Instituto Nacional de Estadística, Geografía e
Informática, Aguascalientes, Aguascalientes, Mexico;U.S. Geological Survey, Reston, Virginia, USA.
http://nationalmap.gov/small_scale/atlasftp.html?openChapters=%2Cchpwater#chpwater.
Instituto Nacional de Estadística Geografía e Informática, The Atlas of Canada, and U.S. Geological Survey. 2006b. “North
American Atlas - Political Boundaries: Government of Canada, Ottawa, Ontario, Canada.” Instituto Nacional de Estadística,
Geografía e Informática, Aguascalientes, Aguascalientes, Mexico;U.S. Geological Survey, Reston, Virginia, USA.
http://nationalatlas.gov/atlasftp-na.html.
Kildare B.J., Leutenegger C.M., McSwain B.S., Bambic D.G., Rajal V.B., Wuertz S. (2007) 16S rRNA-based assays for quantitative
detection of universal, human-, cow-, and dog-specific fecal Bacteroidales: A Bayesian approach. Water Res. 41:3701–3715.
Kinzelman, J. (2018) "Incorporating Molecular Testing as an Evidentiary Tool in Municipal Water Quality Monitoring
Programs," City of Racine, WI, Detection of Wastewater Contamination Knowledge Development Forum presentation.
McLellan, S. L. (2018) "Microbial source tracking using new indicators of fecal pollution," University of Wisconsin-Milwaukee,
School of Freshwater Sciences, Detection of Wastewater Contamination Knowledge Development Forum presentation.
National Atlas of the United States (2005) “National Atlas of the United States, County Boundaries of the United States, 2001.”
National Atlas of the United States. Reston, VA: National Atlas of the United States. http://nationalatlas.gov/atlasftp.html.
Water Environment Federation, Water Science & Engineering Center, WSEC-2019-KDF_TR-001 Page 31
Nenn, C. (2018) "Canine Scent Tracking for Human Wastewater," Milwaukee Riverkeeper, Detection of Wastewater
Contamination Knowledge Development Forum presentation.
Newton R.J., Vandewalle J.L., Borchardt M.A., Gorelick M.H., McLellan S.L. (2011) Lachnospiraceae and Bacteroidales alternative
fecal indicators reveal chronic human sewage contamination in an urban harbor. Appl. Environ. Microbiol. 77: 6972–6981.
Reischer G.H., Kasper D.C., Steinborn R., Mach R.L., Farnleitner A.H. (2006) Quantitative PCR method for sensitive detection of
ruminant fecal pollution in freshwater and evaluation of this method in alpine karstic regions. Appl. Environ. Microbiol. 72:
5610–4.
Rutsch, M., Franz, T., & Krebs, P. (2007) Transferability of exfiltration rates from sewer systems. Journal of Soils and Sediments,
7(2), 69–74.
Templar H.A., Dila D.K., Bootsma M.J., Corsi S.R., McLellan S.L. (2016) Quantification of human-associated fecal indicators
reveal sewage from urban watersheds as a source of pollution to Lake Michigan. Water Res. 100:556–567.
U.S. Department of Agriculture-Natural Resources Conservation Service, U. S. Geological Survey, and U.S Environmental
Protection Agency (2009) “The Watershed Boundary Dataset (WBD).” Vector digital data. Fort Worth, Texas.
http://datagateway.nrcs.usda.gov.
USEPA (2012) Method 1611: Enterococci in Water by TaqMan® Quantitative Polymerase Chain Reaction (qPCR) Assay. EPA-
821-R-12-008.

Water Environment Federation, Water Science & Engineering Center, WSEC-2019-KDF_TR-001 Page 32
10-AUG-2018 KNOWLEDGE DEVELOPMENT FORUM PARTICIPANTS
1 John Attridge
2 Danny Barker
3 Benjamin Benninghoff
4 Christopher Bocciardi
5 Joseph Boxhorn
6 Marty Collins
7 Annette DeMaria
8 Shannon Donley
9 Zac Driscoll
10 Raul Gonzalez
11 Justin Hart
12 Graham Hoppe
13 Shannon
Johnson-
Windsor
14 Julie Kinzelman
15 Brandon Koltz
16 Adrian Koski
17 Peter Lenaker
18 Barry Liner
19 Matthew Magruder
20 Lisa McFadden
21 Sandra McLellan
22 Julie McMullin
23 Dan Murray
24 Cheryl Nenn
25 Nicklaus Neureuther
26 Amy Nitka
27 Hayley Olds
28 Christopher Palassis
29 Katie Rademacher
30 Beth Sauer
31 Nancy Schultz
32 Corinne Wiesner
33 Tracy Wilkins