
Detection of Sleep Bruxism Based on EEG Hilbert Huang ... · Detection of Sleep Bruxism Based on...
7
Detection of Sleep Bruxism Based on EEG Hilbert Huang Transform Swarnalatha. R. 1 and Prasad D. V. 1+ 1 Department of Electrical & Electronics Engg., BITS Pilani Dubai Campus, Dubai, UAE Abstract. Bruxism is the excessive grinding of the teeth or excessive clenching of the jaw. Early diagnosis of Bruxism is advantageous, due to the possible damage that may be incurred and the detrimental effect on quality of life. A diagnosis of Bruxism is usually made clinically and is mainly based on the person's history e.g. reports of grinding noises and the presence of typical signs and symptoms, including tooth mobility, tooth wear, indentations on the tongue and pain in the muscles of mastication, The neuronal activity of brain Electroencephalogram (EEG) is a highly non stationary signal. For analysis purpose it is useful to divide the EEG into segments in which the signals can be considered stationary. Hilbert Huang Transform(HHT) is an effective tool to understand the nonlinearity of the medium and nonstationarity of the EEG signals. The signals in the frontal plane from electrodes F4C4, FP2F4, F8T4, FP1F3, F3C3 and F7T3 are used to understand and diagnose Bruxism. In this paper Empirical Mode Decomposition (EMD) is used to decompose the EEG signal in to Intrinsic mode functions(IMF). Since some nonlinearity still exists in the intrinsic mode functions, we used non linear analysis methods of IMF's to predict the Bruxism. Largest Lyapunov exponent, Hurst component and correlation dimension of each intrinsic mode function are found. The mean amplitude of the instantaneous frequency of each IMF is also used in the analysis of the signal and the results used in diagnosing the presence of Bruxism. Keywords: Bruxism, EMD, IMF, largest lyapunov exponent, hurst component 1. Introduction EEG signals originate in the outer layer of the brain (the cerebral cortex) which is believed to be responsible for thoughts, emotions and behaviour. From mathematical or theoretical considerations, many of these waveforms are typically nonlinear and non-stationary systems. It is very reasonable to assume EEG signals as the summed effects of locally generated activity in small networks. Brain can be visualised as a massive parallel processing network, each processor containing several thousands of cell systems. A cell system is an organised network of different cell types. The analysis of EEG data can give us insight into how information processing in neural systems is done. This analysis plays an important role in clinical diagnosis. EEG reflects the correlated synaptic activity of the neurons. These are thought to be caused by extracellular summation of ionic currents from individual cells. Thus EEG's can detect changes over milliseconds. The rhythmic activity within certain frequency range will have certain biological significance. Many nonlinear methods have been proposed to extract parameters linked to electrical activity of the human brain. Among these methods, Lyapunov exponent can detect changes in the EEG signal, the fractal dimension and entropy measure the complexity of the signal. New techniques for analysis of nonlinear and non stationary signal have been proposed which are based on empirical mode decomposition (EMD). The Fourier Bessel expansion based mean frequency measure of IMF's and the area measure of analytic IMF's have been used for analysis of EEG. The main purpose of this paper is to decompose EEG signal to IMF's and identify Theta, Alpha and Beta waves and apply non linear analysis techniques assuming that these waves still retain some amount nonlinearity and non stationarity and then use these result to diagnose bruxism. Corresponding author. Tel.: + 971508916077; fax: + 971 4 4200844. E-mail address: [email protected]. 2015 5th International Conference on Biomedical Engineering and Technology (ICBET 2015) IPCBEE vol.81 (2015) © (2015) IACSIT Press, Singapore DOI: 10.7763/IPCBEE. 2015. V81. 7 33
-
Upload
nguyenliem -
Category
Documents
-
view
217 -
download
0
Transcript of Detection of Sleep Bruxism Based on EEG Hilbert Huang ... · Detection of Sleep Bruxism Based on...
Detection of Sleep Bruxism Based on EEG Hilbert Huang Transform
Swarnalatha. R. 1 and Prasad D. V.
1+
1 Department of Electrical & Electronics Engg., BITS Pilani Dubai Campus, Dubai, UAE
Abstract. Bruxism is the excessive grinding of the teeth or excessive clenching of the jaw. Early diagnosis
of Bruxism is advantageous, due to the possible damage that may be incurred and the detrimental effect on
quality of life. A diagnosis of Bruxism is usually made clinically and is mainly based on the person's history
e.g. reports of grinding noises and the presence of typical signs and symptoms, including tooth mobility,
tooth wear, indentations on the tongue and pain in the muscles of mastication, The neuronal activity of brain
Electroencephalogram (EEG) is a highly non stationary signal. For analysis purpose it is useful to divide the
EEG into segments in which the signals can be considered stationary. Hilbert Huang Transform(HHT) is an
effective tool to understand the nonlinearity of the medium and nonstationarity of the EEG signals. The
signals in the frontal plane from electrodes F4C4, FP2F4, F8T4, FP1F3, F3C3 and F7T3 are used to
understand and diagnose Bruxism. In this paper Empirical Mode Decomposition (EMD) is used to
decompose the EEG signal in to Intrinsic mode functions(IMF). Since some nonlinearity still exists in the
intrinsic mode functions, we used non linear analysis methods of IMF's to predict the Bruxism. Largest
Lyapunov exponent, Hurst component and correlation dimension of each intrinsic mode function are found.
The mean amplitude of the instantaneous frequency of each IMF is also used in the analysis of the signal and
the results used in diagnosing the presence of Bruxism.
Keywords: Bruxism, EMD, IMF, largest lyapunov exponent, hurst component
1. Introduction
EEG signals originate in the outer layer of the brain (the cerebral cortex) which is believed to be
responsible for thoughts, emotions and behaviour. From mathematical or theoretical considerations, many of
these waveforms are typically nonlinear and non-stationary systems. It is very reasonable to assume EEG
signals as the summed effects of locally generated activity in small networks. Brain can be visualised as a
massive parallel processing network, each processor containing several thousands of cell systems. A cell
system is an organised network of different cell types. The analysis of EEG data can give us insight into how
information processing in neural systems is done. This analysis plays an important role in clinical diagnosis.
EEG reflects the correlated synaptic activity of the neurons. These are thought to be caused by extracellular
summation of ionic currents from individual cells. Thus EEG's can detect changes over milliseconds. The
rhythmic activity within certain frequency range will have certain biological significance.
Many nonlinear methods have been proposed to extract parameters linked to electrical activity of the
human brain. Among these methods, Lyapunov exponent can detect changes in the EEG signal, the fractal
dimension and entropy measure the complexity of the signal. New techniques for analysis of nonlinear and
non stationary signal have been proposed which are based on empirical mode decomposition (EMD). The
Fourier Bessel expansion based mean frequency measure of IMF's and the area measure of analytic IMF's
have been used for analysis of EEG. The main purpose of this paper is to decompose EEG signal to IMF's
and identify Theta, Alpha and Beta waves and apply non linear analysis techniques assuming that these
waves still retain some amount nonlinearity and non stationarity and then use these result to diagnose
bruxism.
Corresponding author. Tel.: + 971508916077; fax: + 971 4 4200844.
E-mail address: [email protected].
2015 5th International Conference on Biomedical Engineering and Technology (ICBET 2015)
IPCBEE vol.81 (2015) © (2015) IACSIT Press, Singapore
DOI: 10.7763/IPCBEE. 2015. V81. 7
33
We used the available EEG sleep data from two bruxism patients. We used only the combination of the
frontal plane electrodes namely F4C4, FP2F4, F8T4, FP1F3, F3C3 and F7T3 and the signal is sampled at
500Hz.
2. Methodology
EEG data analysis so far relied on methods based on linear and stationary assumptions. The Hilbert
Huang transform (HHT) [1]-[3] is an adaptive signal processing technique based on empirical basic
functions and thus well suited for nonlinear and non stationary signals. Using this algorithm, the signals are
decomposed into a set of intrinsic components called intrinsic mode functions (IMF) by an empirical mode
decomposition (EMD) process. The IMFs thus obtained can be compared to the delta, theta, alpha and beta
components of EEG. However more significant information is available from the IMFs 2,3 and 4. These
were analysed to understand Bruxism.
2.1. Hilbert Huang Transform
The Hilbert Huang Transform (HHT) of any signal consists of two steps: empirical decomposition (EMD)
and Hilbert Transform. The principle of the EMD technique is to decompose a signal x(t) into a set of the
band-limited functions ck(t) called IMF's. Each IMF satisfies two basic conditions: (i) The number of
extrema and number of zero crossings must be the same or differ at most by one in the complete data set. (ii)
At any point the mean value of the envelope defined by the local maxima and the envelope defined by the
local minima is zero. The non-stationary signal x(t) is then represented as a linear sum of IMFs and the
residual component as [4]-[6]:
n
x(t) = ∑ ck(t) + rM(t) (1)
k=1
where n is the number of IMFs and rM(t) is the final residue. Each IMF is assumed to yield a meaningful
local frequency and different IMFs do not exhibit the same frequency at the same time [7]-[9]. The analytic
signal of any real IMF cH(t) is defined as
z(t) = c(t) + jcH(t) = A(t) ejφ(t)
(2)
The signal amplitude A(t) and instantaneous and φ(t) can be defined as follows :
A(t) =√ ( ) ( ) (3)
φ(t) = arctan (cH(t)/c(t)) (4)
The instantaneous frequency of the analytic IMF z(t) is given by
ω(t) = ( )
(5)
Freely accessible database consisting of normal and bruxism EEG signals were used to conduct this
study. The sampling rate of the data is 500 Hz and each signal is of 10 seconds duration. First EMD is
applied to the EEG of two patients of bruxism and two normal EEGs. The following electrode positions in
the frontal plane are considered for the study. They are F4C4, FP2F4, F8T4, FP1F3,F3C3 and F7T3. The
first three IMFs which correlate with Theta, Alpha and Beta activity were considered for analysis purpose.
Since nonlinearity and nonstationarity might exist still, it is further proposed to analyse the signal using
nonlinear analysis techniques. The non linear analysis technique includes calculation of Largest Lyapunov
exponent, Hurst component and correlation dimension. Hilbert transform was applied to the first three
intrinsic modes with the aim of finding instantaneous frequency. The mean amplitude of instantaneous
frequency was also considered along with nonlinear parameters in the detection of bruxism. The values of all
these parameters are tabulated and interpreted to diagnose bruxism.
3. Results and Discussion
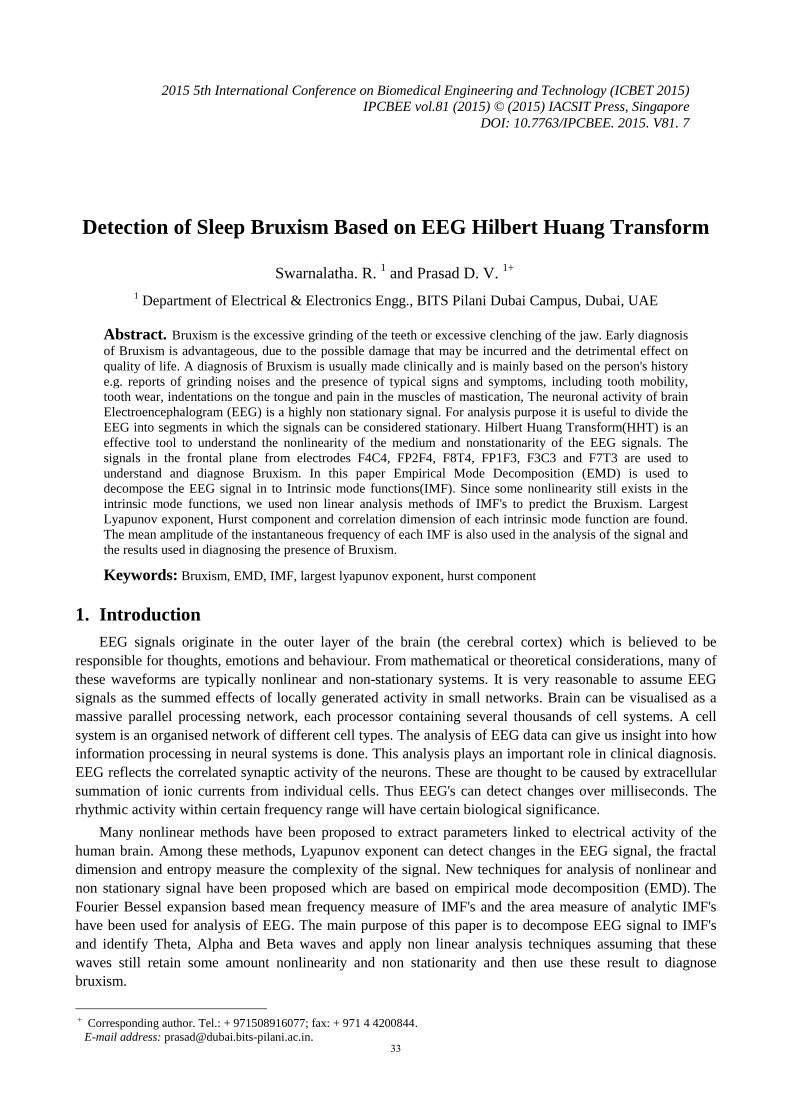
Fig. 1 shows the result of decomposition performed by EMD [9] of a patient1 with known bruxism. The
first mode has higher frequency than the second mode where modes are ordered from highest frequency to
34
lowest. The major components of EEG are seen in the first four modes and lower modes indicate other low
frequency trends in EEG [10], [11].
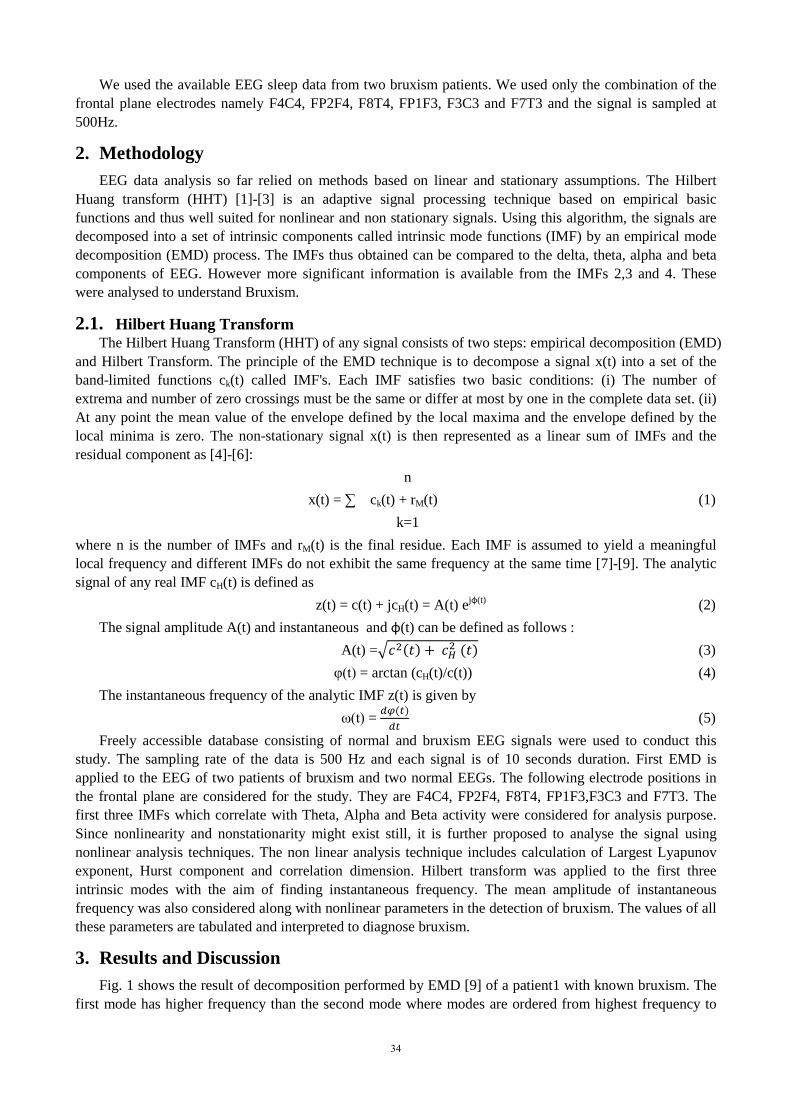
The following figures show the plots of EMDs of two patients with known bruxism. The plot of the
intrinsic mode functions for two electrode positions namely F4C4 and FP2F4 are shown. The first plot
corresponds to the original EEG and the other four IMFs can be related to beta, alpha, theta and delta
components of EEG. The same is repeated for all other electrode position used in this work. Since
nonlinearity may still exist in the intrinsic mode components, it is suggested to use nonlinear analysis
techniques [12]. The Largest Lyapunov component, Hurst component and Correlation dimension [13] were
calculated for the first three intrinsic mode components which were thought to have maximum information
content about existence of bruxism.
Fig. 1: Empirical decomposition of EEG of patient 1 from electrodes F4C4
Hurst Component (HC) quantifies the tendency of a time series to regress strongly to the mean or to
cluster in a direction. H in the range 0.5 -1 indicates a time series with high value will probably
followed by another high value. A value between 0-0.5 indicates switching between high and low
values.
The Largest Lyapunov exponent (LLE) ensures the validity of linear approximation at any time.
The Correlation dimension (CD) is a measure of the dimensionality of the space occupied by a set of
random points.
Fig. 2: Empirical decomposition of EEG of patient 2 from electrodes F4C4
35
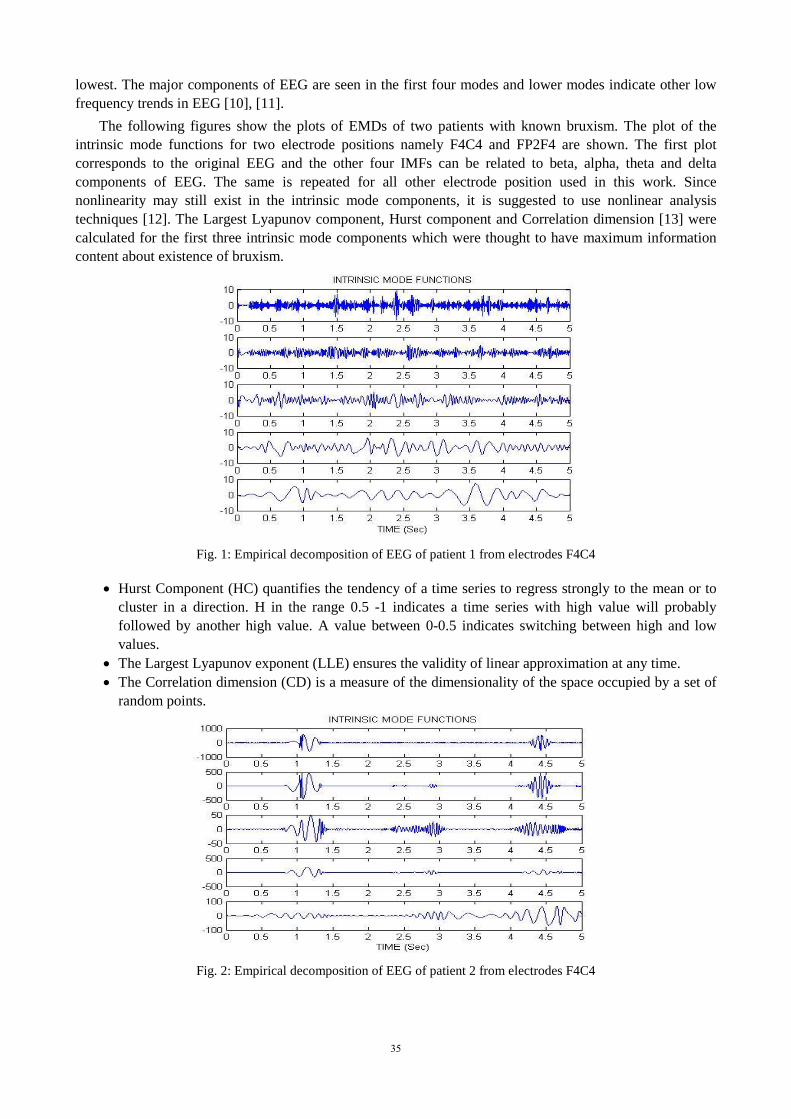
Fig. 3: Empirical decomposition of EEG of patient 1 from electrodes FP2F4
Fig. 4: Instantaneous frequency in IMF2 for patient 1 from electrodes F4C4
Fig. 5: Instantaneous frequency in IMF2 for patient 1 Electrodes FP2F4
36
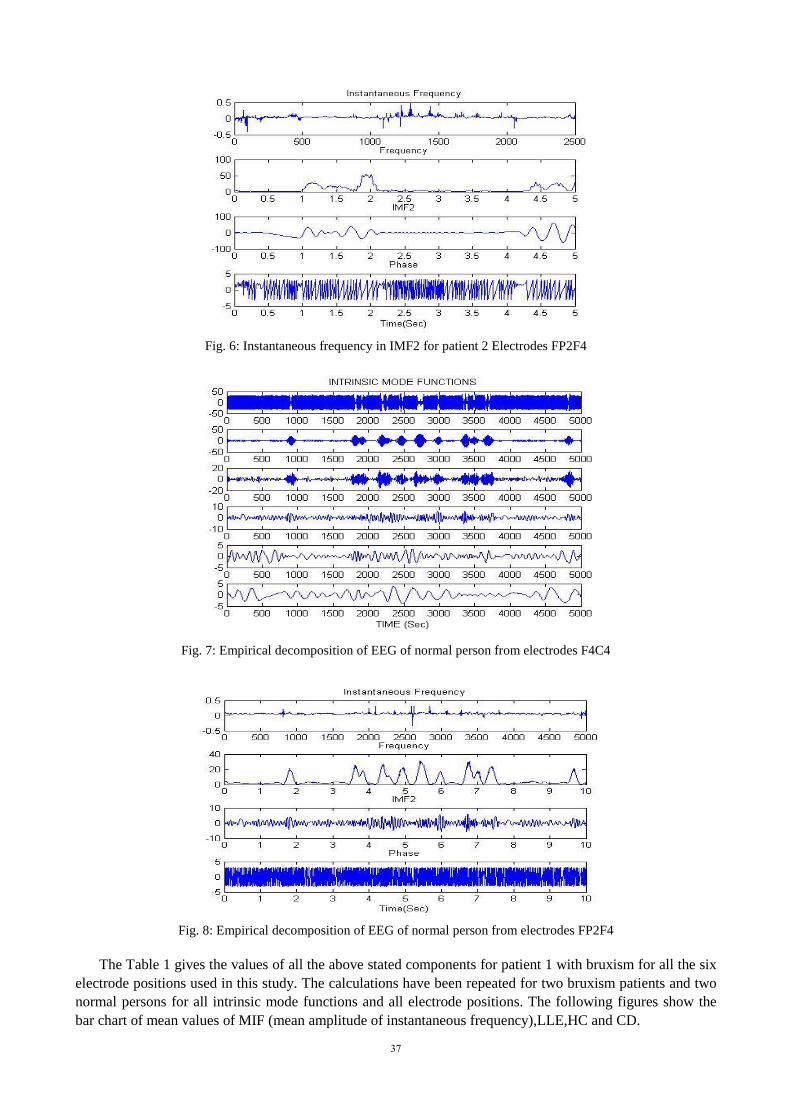
Fig. 6: Instantaneous frequency in IMF2 for patient 2 Electrodes FP2F4
Fig. 7: Empirical decomposition of EEG of normal person from electrodes F4C4
Fig. 8: Empirical decomposition of EEG of normal person from electrodes FP2F4
The Table 1 gives the values of all the above stated components for patient 1 with bruxism for all the six
electrode positions used in this study. The calculations have been repeated for two bruxism patients and two
normal persons for all intrinsic mode functions and all electrode positions. The following figures show the
bar chart of mean values of MIF (mean amplitude of instantaneous frequency),LLE,HC and CD.
37
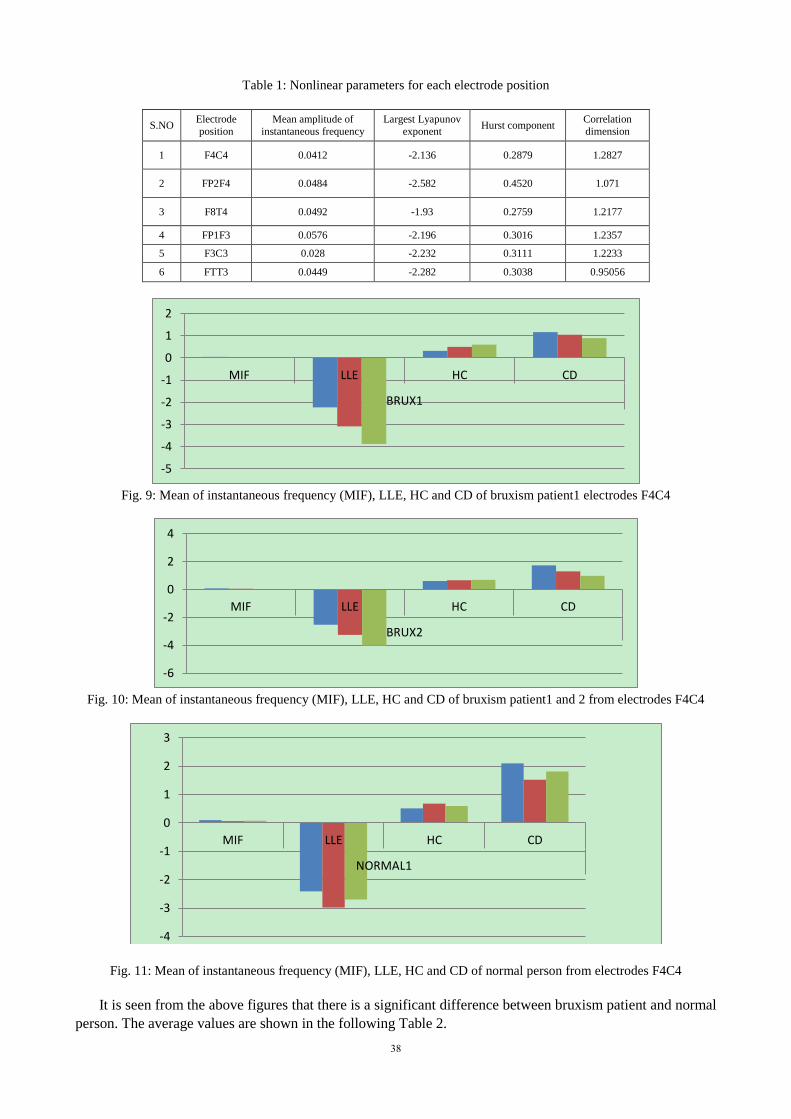
Table 1: Nonlinear parameters for each electrode position
S.NO Electrode
position
Mean amplitude of
instantaneous frequency
Largest Lyapunov
exponent Hurst component
Correlation
dimension
1 F4C4 0.0412 -2.136 0.2879 1.2827
2 FP2F4 0.0484 -2.582 0.4520 1.071
3 F8T4 0.0492 -1.93 0.2759 1.2177
4 FP1F3 0.0576 -2.196 0.3016 1.2357
5 F3C3 0.028 -2.232 0.3111 1.2233
6 FTT3 0.0449 -2.282 0.3038 0.95056
Fig. 9: Mean of instantaneous frequency (MIF), LLE, HC and CD of bruxism patient1 electrodes F4C4
Fig. 10: Mean of instantaneous frequency (MIF), LLE, HC and CD of bruxism patient1 and 2 from electrodes F4C4
Fig. 11: Mean of instantaneous frequency (MIF), LLE, HC and CD of normal person from electrodes F4C4
It is seen from the above figures that there is a significant difference between bruxism patient and normal
person. The average values are shown in the following Table 2.
-5
-4
-3
-2
-1
0
1
2
MIF LLE HC CD
BRUX1
-6
-4
-2
0
2
4
MIF LLE HC CD
BRUX2
-4
-3
-2
-1
0
1
2
3
MIF LLE HC CD
NORMAL1
38
Table 2: Average values of Nonlinear components
MIF LLE HC CD
Patient 1 0.03125 -3.06406 0.47385 1.03445
Patient 2 0.045333 -3.27711 0.650378 1.33046
Normal person 1 0.0818 -2.69558 0.597842 1.8114
Normal person 2 0.070228 2.93067 0.59518 1.782028
From the above table the following conclusions can be drawn,
The mean amplitude of the instantaneous frequency (MIF) is lower in the case bruxism.
The Largest Lyapunov component (LLE) is lower in case of bruxism.
The Hurst component (HC) is lower in patient 1 but higher in patient2.
The Correlation dimension (CD) is lower in case of bruxism.
Thus it can be concluded in case of bruxism the parameters MIF, LLE and CD are clear indicators. Thus
values of MIF < .05, LLE <-3 and CD<1.4 might suggest that the patient is suffering from bruxism.
4. Acknowledgements
The authors would like to thank Prof R N Saha, Director, BITS Pilani Dubai campus for his constant
encouragement and support. We would also like to thank Dr. AB. Chattopadhyay, HOD of EEE department.
We also acknowledge physionet.org for providing EEG data.
5. References
[1] Rami J Oweis, Enas W Abdulhay. Seizure classification in EEG signals utilizing Hilbert-Huang transform,
BioMedical Engineering Online, 2011, 10: 38.
[2] Dennis E.B Tan, Wai Yie Leong, Sleep disorder detection and identification, Journal of Biomedical Science and
Engineering, 2012, vol. 5, pp. 330-340.
[3] Lajos Losonczi, Laszlo Bako, Sandor Tihamer Brassai and Laszlo Ference Marton, Hilbert-Huang Transform used
for EEG signal analysis, The 6th edition of Interdisciplinary in Engineering International Conference, University
of Tirgu Mures, Romanaia, 2012.
[4] Varun Bajaj, Ram Bilas Pachori, Seperation of Rhythms of EEG signals based on Hilbert-Huang Transformation
with Application to seizure detection, ICHIT 2012, LNCS 7425, pp. 493-500.
[5] Yi Lin, Fan Yingle , Li Gu, Sleep stage classification based on EEG Hilbert-Huang Transform, ICIEA, 2009, pp.
3676-3681.
[6] Nilufer Ozdemir, Esen Yildrium, Patient specific seizure prediction system using Hilbert spectrum and Bayesian
networks classfiers, Computational and Mathematical methods in Medicine, vol. 2014.
[7] Neha Soorma, Jaikaran Singh, Mukesh Tiwari, Feature Extraction of ECG signal using HHT algorithm,
International Journal of Engineering Trends and Technology(IJETT), vol. 8, no. 8, 2014.
[8] Chin-Feng Lin, Shah-Wen Yeh, Yu-Yi Chien, Tsung-Ii Peng, A HHT based Tme Frequency analysis scheme in
clinical alholic EEG signals, WSEAS Transactions on Biology and Biomedicine, Issue 10, vol. 5, 2008.
[9] Hassan Sharabaty, Bruno Jammes, Daniel Esteve, EEG analysis using HHT:One step toward automatic drowsiness
scoring, International conference on Advanced Information networking and applications, 2008.
[10] Pachori, R.B, bajaj V, Classification of seizure and nonseizure EEG signals using Empirical mode decomposition,
Computational methods. progr. Biomed, 104, pp. 373-381, 2011.
[11] Huang NE, Zheng Shen and Long Sr, The empirical mode decomposition and the Hilbert spectrum for nonlinear
and nonstationaery time series analysis, Proceedings of the Royal society of London, vol. 454, pp. 903-995, 1998.
[12] Ernesto Pereda, Rodrigo Quian Quiroga, Joydeep Bhattacharya, Nonlinear multivariate analysis of
neurophysiological signals, Progress in Neurobiology 77, 2005, pp. 1–37.
[13] Rajendra Acharya U, Oliver Faust, N. Kannathal, TjiLeng Chuaa, Non-linear analysis of EEG signals at various
sleep stages, Computer Methods and Programs in Biomedicine ,2005, vol. 80, pp. 37—45
39


![Occlusal splints for treating sleep bruxism (tooth grinding) › files › Cochrane_Review_2008._Occlusal_splints… · [Intervention Review] Occlusal splints for treating sleep bruxism](https://static.fdocuments.net/doc/165x107/5f1056697e708231d4489cbf/occlusal-splints-for-treating-sleep-bruxism-tooth-grinding-a-files-a-cochranereview2008occlusalsplints.jpg)


