Detection of photovoltaic installations in RGB aerial imaging
5
DETECTION OF PHOTOVOLTAIC INSTALLATIONS IN RGB AERIAL IMAGING: A COMPARATIVE STUDY. Steven Puttemans * , Wiebe Van Ranst and Toon Goedem´ e EAVISE, KU Leuven - Campus De Nayer, Sint-Katelijne-Waver, Belgium (steven.puttemans, wiebe.vanranst, toon.goedeme)@kuleuven.be KEY WORDS: Photovoltaic Installations, Automated Object Detection, Fraud Detection ABSTRACT: In this work, we compare four different approaches for detecting photovoltaic installations from RGB aerial images. Our client, an electricity grid administrator, wants to hunt down fraud with unregistered illegal solar panel installations by detecting installations in aerial imagery and checking these against their database of registered installations. The detection of solar panels in these RGB images is a difficult task. Reasons are the relatively low resolution (at 25 cm/pixel an individual solar panel only measures about 9 × 7 pixels), the undiscriminating colour properties of the object (due to in-class variance and specular effects) and the apparent shape variability (rotation and skew due to the different roofs slant angles). Therefore, straightforward object segmentation techniques do not yield a satisfying solution, as proven in this paper. We compared four state-of-the-art object detection approaches for this task. First we experimented with a machine learning object detection technique based on pixel-based support vector machine classification. Secondly we developed an approach using MSER based colour segmentation and shape analysis. Finally a dual approach based on object categorization using the boosted cascade classifier technique of Viola & Jones and the aggregate channel features technique of Doll´ ar et al., is introduced, learning a combination of colour and gradient feature based classifiers from a given training set. We successfully evaluate these four different approaches on a fully labelled test set of a 8000 × 8000 pixel, 4 square km zone containing 315 solar panel installations with in total more than 10.000 individual panels. 1. INTRODUCTION Solar panels provide a solution in generating energy from non- polluting resources and therefore placing a solar panel installa- tion is subsidized and encouraged by governments and electricity grid administrators. However due to the given funding and tax re- duction, these ‘greener‘ energy generating alternatives also give raise to malicious fraud. Our client, an electricity grid adminis- trator wants to use the power of computer vision to track down these fraud cases to ensure that no financial benefits are given to people that are not correctly registered at the grid administrator with their solar panel installation. Fully automated solar panel detection in RGB images yields some major challenges, as seen in Figure 1. First of all a solar panel is an object shape with only a few distinct visual features like shape and colour, due to its simple shape and colour distribution. Sec- ondly the images that are freely available on the FGIA portal have a very limited resolution (25cm/pixel) resulting in a solar panel size of only 9 × 7 pixels, which is very little considering the real dimensions are around 1 × 1.5 m. This is clearly visible in Fig- ure 1 (a). Due to the material properties of solar panels, specular reflections tend to change the visual properties of the panels, de- pending on the position of the sun. This could lead to solar pan- * Corresponding author Figure 1. Challenges when dealing with solar panel detection. els occurring as a flat white overexposed part of the image. This difference can be seen in Figure 1 (b) and (b‘). The orientation in which the solar panels are placed also varies (south, south- east, south-west), raising the need of a full 360 ◦ rotational search of the image for object instances. Combined with the different roofs’ slants (30 ◦ , 45 ◦ , 60 ◦ , etc.), panels get optically deformed and thus appear shorter or longer in 2D images, despite the fixed physical size, as seen in Figure 1 (c). Finally solar panels come in different materials (mono- and polycrystalline, full black, etc.) introducing even more intra class variance into the problem. For example, due to the small resolution per panel, full black installa- tions appear as a black square, yielding no visual features to train computer vision techniques, as seen in Figure 1 (d). Our goal is to develop a computer vision based approach that is able to automatically detect solar panels in aerial imagery and re- turn the location of these installations with a high certainty. This in turn can avoid putting in huge amounts of manual labour to manually locate solar panel installations for fraud detection. 2. RELATED WORK The automated analysis of solar panel installations from aerial images using techniques of the computer vision fields, limits it- self to the analysis of solar panel efficiency and defects, using RGB and thermal cameras, as seen in (S´ anchez-Friera et al., 2011; Li and Tsai, 2012; Tsai et al., 2013), while automated solar panel detection and localisation seem to be unexplored. While object detection is a well studied problem in the field of computer vi- sion, many other fields still have not discovered the power of these state-of-the-art techniques in autonomous object detection and localisation. The community of computer vision has however already performed object detection research in the field of aerial imagery, focussing on roads (Hinz and Baumgartner, 2003), build- ings (Mayer, 1999) or vehicles (Gleason et al., 2011), always us- ing state-of-the-art computer vision algorithms and thus giving
Transcript of Detection of photovoltaic installations in RGB aerial imaging

DETECTION OF PHOTOVOLTAIC INSTALLATIONS IN RGB AERIAL IMAGING:A COMPARATIVE STUDY.
Steven Puttemans∗, Wiebe Van Ranst and Toon Goedeme
EAVISE, KU Leuven - Campus De Nayer, Sint-Katelijne-Waver, Belgium(steven.puttemans, wiebe.vanranst, toon.goedeme)@kuleuven.be
KEY WORDS: Photovoltaic Installations, Automated Object Detection, Fraud Detection
ABSTRACT:
In this work, we compare four different approaches for detecting photovoltaic installations from RGB aerial images. Our client, anelectricity grid administrator, wants to hunt down fraud with unregistered illegal solar panel installations by detecting installationsin aerial imagery and checking these against their database of registered installations. The detection of solar panels in these RGBimages is a difficult task. Reasons are the relatively low resolution (at 25 cm/pixel an individual solar panel only measures about9× 7 pixels), the undiscriminating colour properties of the object (due to in-class variance and specular effects) and the apparent shapevariability (rotation and skew due to the different roofs slant angles). Therefore, straightforward object segmentation techniques donot yield a satisfying solution, as proven in this paper. We compared four state-of-the-art object detection approaches for this task.First we experimented with a machine learning object detection technique based on pixel-based support vector machine classification.Secondly we developed an approach using MSER based colour segmentation and shape analysis. Finally a dual approach based onobject categorization using the boosted cascade classifier technique of Viola & Jones and the aggregate channel features techniqueof Dollar et al., is introduced, learning a combination of colour and gradient feature based classifiers from a given training set. Wesuccessfully evaluate these four different approaches on a fully labelled test set of a 8000 × 8000 pixel, 4 square km zone containing315 solar panel installations with in total more than 10.000 individual panels.
1. INTRODUCTION
Solar panels provide a solution in generating energy from non-polluting resources and therefore placing a solar panel installa-tion is subsidized and encouraged by governments and electricitygrid administrators. However due to the given funding and tax re-duction, these ‘greener‘ energy generating alternatives also giveraise to malicious fraud. Our client, an electricity grid adminis-trator wants to use the power of computer vision to track downthese fraud cases to ensure that no financial benefits are given topeople that are not correctly registered at the grid administratorwith their solar panel installation.
Fully automated solar panel detection in RGB images yields somemajor challenges, as seen in Figure 1. First of all a solar panel isan object shape with only a few distinct visual features like shapeand colour, due to its simple shape and colour distribution. Sec-ondly the images that are freely available on the FGIA portal havea very limited resolution (25cm/pixel) resulting in a solar panelsize of only 9× 7 pixels, which is very little considering the realdimensions are around 1 × 1.5 m. This is clearly visible in Fig-ure 1 (a). Due to the material properties of solar panels, specularreflections tend to change the visual properties of the panels, de-pending on the position of the sun. This could lead to solar pan-
∗Corresponding author
Figure 1. Challenges when dealing with solar panel detection.
els occurring as a flat white overexposed part of the image. Thisdifference can be seen in Figure 1 (b) and (b‘). The orientationin which the solar panels are placed also varies (south, south-east, south-west), raising the need of a full 360◦ rotational searchof the image for object instances. Combined with the differentroofs’ slants (30◦, 45◦, 60◦, etc.), panels get optically deformedand thus appear shorter or longer in 2D images, despite the fixedphysical size, as seen in Figure 1 (c). Finally solar panels comein different materials (mono- and polycrystalline, full black, etc.)introducing even more intra class variance into the problem. Forexample, due to the small resolution per panel, full black installa-tions appear as a black square, yielding no visual features to traincomputer vision techniques, as seen in Figure 1 (d).
Our goal is to develop a computer vision based approach that isable to automatically detect solar panels in aerial imagery and re-turn the location of these installations with a high certainty. Thisin turn can avoid putting in huge amounts of manual labour tomanually locate solar panel installations for fraud detection.
2. RELATED WORK
The automated analysis of solar panel installations from aerialimages using techniques of the computer vision fields, limits it-self to the analysis of solar panel efficiency and defects, usingRGB and thermal cameras, as seen in (Sanchez-Friera et al., 2011;Li and Tsai, 2012; Tsai et al., 2013), while automated solar paneldetection and localisation seem to be unexplored. While objectdetection is a well studied problem in the field of computer vi-sion, many other fields still have not discovered the power ofthese state-of-the-art techniques in autonomous object detectionand localisation. The community of computer vision has howeveralready performed object detection research in the field of aerialimagery, focussing on roads (Hinz and Baumgartner, 2003), build-ings (Mayer, 1999) or vehicles (Gleason et al., 2011), always us-ing state-of-the-art computer vision algorithms and thus giving

Figure 2. Example of pixel based colour classification using neu-ral networks as learning tool. (top) original image (middle) pixelclassification result (bottom) cleaned up segmentation.
perfect example cases that can be expanded to solar panel detec-tion and localisation.
While the intuitive way would be to use segmentation based ap-proaches, where the RGB input image is transformed to a colourspace where separating object pixels from background pixels us-ing strict (learned) thresholds is easier, they tend to fail whena wide range of other objects in the images have similar colourranges. Furthermore these techniques only take into account ob-ject colour information. Object categorisation techniques like(Viola and Jones, 2001; Felzenszwalb et al., 2010; Dollar et al.,2009; Dollar et al., 2014) tend to go one step further and use ob-ject properties like colour, shape, texture, etc. to uniquely definefeatures that describe the object class, which are then used to suc-cessfully separate objects from the background.
3. DATASETS
For developing and testing our suggested approaches, we usedthe freely available medium-scale (25cm/pixel resolution) aerialfootage from FGIA (Flanders Geographical Information Agency)covering the grid area of Flanders where our electricity grid ad-minstrator is active. From this publicly available dataset, a set of2500 individual solar panels where manually annotated and a setof more than 150000 random negative samples (containing ev-erything except solar panels) were collected and used to learn themodels used by our state-of-the-art object detection algorithms.
To test the four suggested approaches an aerial image of 2×2 kmof the city centre of Sint-Truiden was obtained. At a resolutionof 25cm/pixel this results in a 8000× 8000 pixel image, which is
up-scaled using a bi-cubic operator to 16000 × 16000 pixels toensure the solar panels are covered by enough pixels per panel.Inside this test image 313 solar panel installations where manu-ally annotated, by drawing polygons around the installations, touse as ground truth when validating the fully automated objectdetection techniques suggested in this work.
The complete dataset, including training data, test data and an-notations can be found for research purposes at http://www.eavise.be/SolarPanelDataset/.
4. SUGGESTED APPROACH
To find an optimal solution for fully automated solar panel detec-tion in aerial images, a comparative study was performed. Inthe following subsections each of the four state-of-the-art ap-proaches, will be explained and discussed in detail. Section 5will then take a closer look at the accuracy and time complexityachieved by each individual technique.
4.1 Pixel based colour classification using support vector ma-chines
Our pixel based colour classification, as seen in Figure 2, uses theinternal colour area of each solar panel (blue-grey colour range)without looking at the bright edges of the panel, in order to en-sure that the pixel colour distribution of the training pixels areseparable in the HSV colour space. We manually collected 1000internal solar panel pixels and 2000 randomly selected non-solarpanel background pixels. Both solar panel and non-solar panelpixels are transformed to the HSV colour space, a space whereseparating colours is easier then inside the RGB colour space.Based on this training data, a support vector machine classifierwith linear kernel is trained, able to autonomously separate solarpanel from non-solar panel pixels.
When a test image is presented to the support vector machineclassifier, each pixel is processed and is given a certainty score,indicating how certain we are that the pixel is actually part of asolar panel installation. This certainty score allows us to set aminimal certainty threshold, generating a binary image as seenin Figure 2. On top of that, binary image opening and closingoperators can be applied to remove noise, followed by contourdetection and contour filling to achieve a cleaner result.
4.2 MSER based colour segmentation and shape analysis
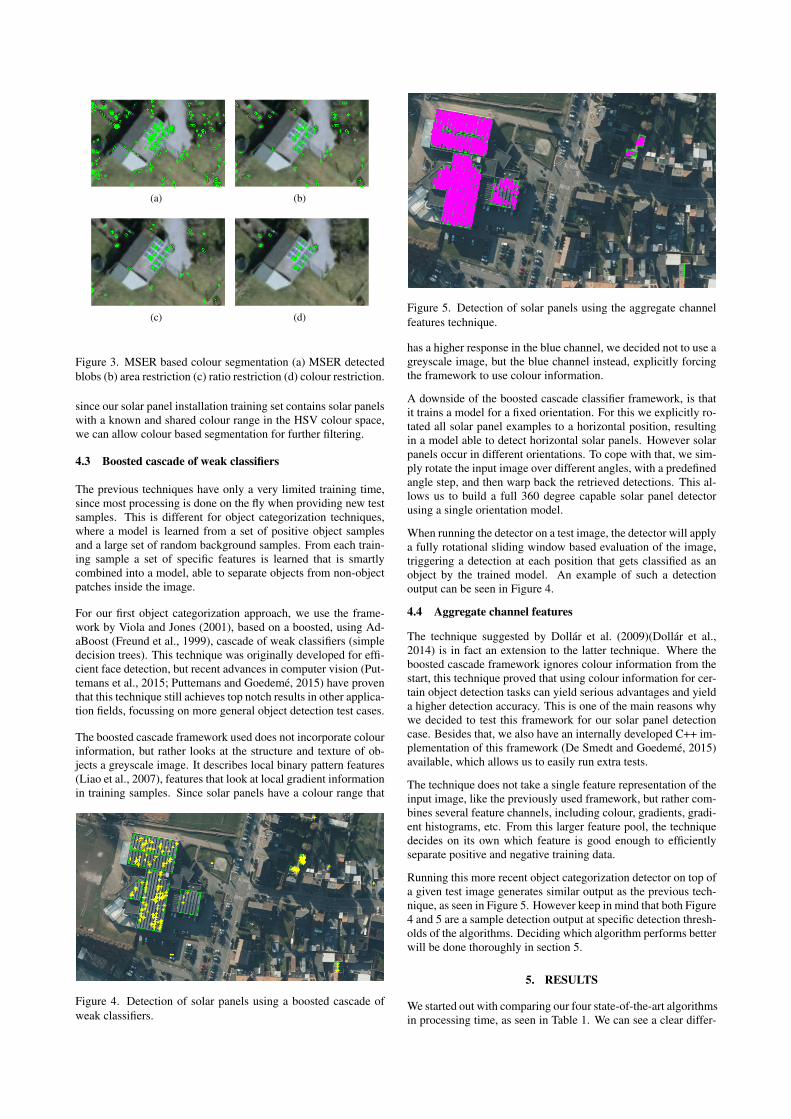
Maximally stable extremal regions (Matas et al., 2004) is a tech-nique used to detect blobs inside a given image. By systemati-cally increasing the threshold on a given greyscale input image,from very sloppy to very strict, we create a set of sequential bi-nary images. Inside those images the algorithm looks for regionsthat stay stable over the different thresholds and then approxi-mates those regions by their fitted ellipse. Due to the higher re-sponse of solar panels in the blue channel compared to the red andgreen channels, we only process the blue channel data, removingthe need to explicitly convert the RGB image to a greyscale im-age. Applying the MSER algorithm generates a selection of blobcandidates, as seen in Figure 3(a). To further filter the obtainedregions, we start by discarding blobs of an incorrect size (seeFigure 3(b)), then look for blobs with a axis ratio that deviatesmaximally 30% of the ideal 1.5 : 1 ratio (see Figure 3(c)) and fi-nally we apply HSV colour segmentation on the remaining blobs,using the technique discussed in subsection 4.1. The known sizerange of the blobs can be explained by the fact that aerial imageryis taken on a constant hight, while the limited ratio deviation isexplained by the fixed physical size of the solar panels. Finally
(a) (b)
(c) (d)
Figure 3. MSER based colour segmentation (a) MSER detectedblobs (b) area restriction (c) ratio restriction (d) colour restriction.
since our solar panel installation training set contains solar panelswith a known and shared colour range in the HSV colour space,we can allow colour based segmentation for further filtering.
4.3 Boosted cascade of weak classifiers
The previous techniques have only a very limited training time,since most processing is done on the fly when providing new testsamples. This is different for object categorization techniques,where a model is learned from a set of positive object samplesand a large set of random background samples. From each train-ing sample a set of specific features is learned that is smartlycombined into a model, able to separate objects from non-objectpatches inside the image.
For our first object categorization approach, we use the frame-work by Viola and Jones (2001), based on a boosted, using Ad-aBoost (Freund et al., 1999), cascade of weak classifiers (simpledecision trees). This technique was originally developed for effi-cient face detection, but recent advances in computer vision (Put-temans et al., 2015; Puttemans and Goedeme, 2015) have proventhat this technique still achieves top notch results in other applica-tion fields, focussing on more general object detection test cases.
The boosted cascade framework used does not incorporate colourinformation, but rather looks at the structure and texture of ob-jects a greyscale image. It describes local binary pattern features(Liao et al., 2007), features that look at local gradient informationin training samples. Since solar panels have a colour range that
Figure 4. Detection of solar panels using a boosted cascade ofweak classifiers.
Figure 5. Detection of solar panels using the aggregate channelfeatures technique.
has a higher response in the blue channel, we decided not to use agreyscale image, but the blue channel instead, explicitly forcingthe framework to use colour information.
A downside of the boosted cascade classifier framework, is thatit trains a model for a fixed orientation. For this we explicitly ro-tated all solar panel examples to a horizontal position, resultingin a model able to detect horizontal solar panels. However solarpanels occur in different orientations. To cope with that, we sim-ply rotate the input image over different angles, with a predefinedangle step, and then warp back the retrieved detections. This al-lows us to build a full 360 degree capable solar panel detectorusing a single orientation model.
When running the detector on a test image, the detector will applya fully rotational sliding window based evaluation of the image,triggering a detection at each position that gets classified as anobject by the trained model. An example of such a detectionoutput can be seen in Figure 4.
4.4 Aggregate channel features
The technique suggested by Dollar et al. (2009)(Dollar et al.,2014) is in fact an extension to the latter technique. Where theboosted cascade framework ignores colour information from thestart, this technique proved that using colour information for cer-tain object detection tasks can yield serious advantages and yielda higher detection accuracy. This is one of the main reasons whywe decided to test this framework for our solar panel detectioncase. Besides that, we also have an internally developed C++ im-plementation of this framework (De Smedt and Goedeme, 2015)available, which allows us to easily run extra tests.
The technique does not take a single feature representation of theinput image, like the previously used framework, but rather com-bines several feature channels, including colour, gradients, gradi-ent histograms, etc. From this larger feature pool, the techniquedecides on its own which feature is good enough to efficientlyseparate positive and negative training data.
Running this more recent object categorization detector on top ofa given test image generates similar output as the previous tech-nique, as seen in Figure 5. However keep in mind that both Figure4 and 5 are a sample detection output at specific detection thresh-olds of the algorithms. Deciding which algorithm performs betterwill be done thoroughly in section 5.
5. RESULTS
We started out with comparing our four state-of-the-art algorithmsin processing time, as seen in Table 1. We can see a clear differ-
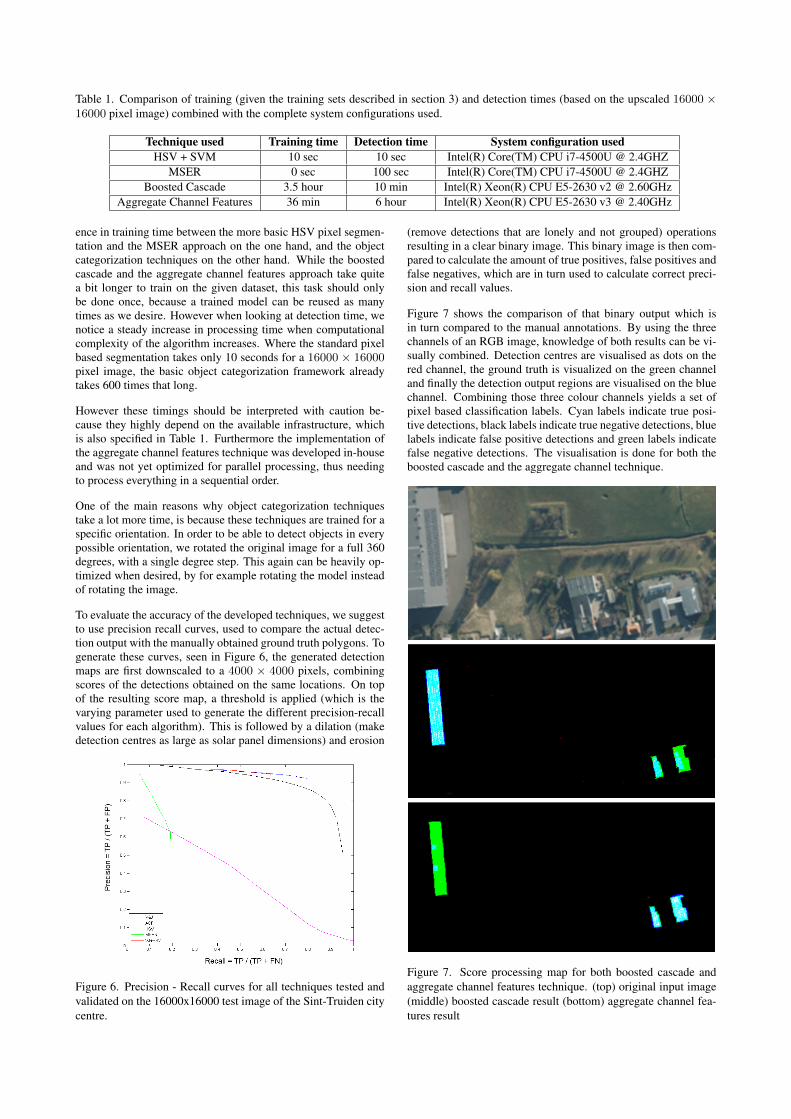
Table 1. Comparison of training (given the training sets described in section 3) and detection times (based on the upscaled 16000 ×16000 pixel image) combined with the complete system configurations used.
Technique used Training time Detection time System configuration usedHSV + SVM 10 sec 10 sec Intel(R) Core(TM) CPU i7-4500U @ 2.4GHZ
MSER 0 sec 100 sec Intel(R) Core(TM) CPU i7-4500U @ 2.4GHZBoosted Cascade 3.5 hour 10 min Intel(R) Xeon(R) CPU E5-2630 v2 @ 2.60GHz
Aggregate Channel Features 36 min 6 hour Intel(R) Xeon(R) CPU E5-2630 v3 @ 2.40GHz
ence in training time between the more basic HSV pixel segmen-tation and the MSER approach on the one hand, and the objectcategorization techniques on the other hand. While the boostedcascade and the aggregate channel features approach take quitea bit longer to train on the given dataset, this task should onlybe done once, because a trained model can be reused as manytimes as we desire. However when looking at detection time, wenotice a steady increase in processing time when computationalcomplexity of the algorithm increases. Where the standard pixelbased segmentation takes only 10 seconds for a 16000 × 16000pixel image, the basic object categorization framework alreadytakes 600 times that long.
However these timings should be interpreted with caution be-cause they highly depend on the available infrastructure, whichis also specified in Table 1. Furthermore the implementation ofthe aggregate channel features technique was developed in-houseand was not yet optimized for parallel processing, thus needingto process everything in a sequential order.
One of the main reasons why object categorization techniquestake a lot more time, is because these techniques are trained for aspecific orientation. In order to be able to detect objects in everypossible orientation, we rotated the original image for a full 360degrees, with a single degree step. This again can be heavily op-timized when desired, by for example rotating the model insteadof rotating the image.
To evaluate the accuracy of the developed techniques, we suggestto use precision recall curves, used to compare the actual detec-tion output with the manually obtained ground truth polygons. Togenerate these curves, seen in Figure 6, the generated detectionmaps are first downscaled to a 4000 × 4000 pixels, combiningscores of the detections obtained on the same locations. On topof the resulting score map, a threshold is applied (which is thevarying parameter used to generate the different precision-recallvalues for each algorithm). This is followed by a dilation (makedetection centres as large as solar panel dimensions) and erosion
Figure 6. Precision - Recall curves for all techniques tested andvalidated on the 16000x16000 test image of the Sint-Truiden citycentre.
(remove detections that are lonely and not grouped) operationsresulting in a clear binary image. This binary image is then com-pared to calculate the amount of true positives, false positives andfalse negatives, which are in turn used to calculate correct preci-sion and recall values.
Figure 7 shows the comparison of that binary output which isin turn compared to the manual annotations. By using the threechannels of an RGB image, knowledge of both results can be vi-sually combined. Detection centres are visualised as dots on thered channel, the ground truth is visualized on the green channeland finally the detection output regions are visualised on the bluechannel. Combining those three colour channels yields a set ofpixel based classification labels. Cyan labels indicate true posi-tive detections, black labels indicate true negative detections, bluelabels indicate false positive detections and green labels indicatefalse negative detections. The visualisation is done for both theboosted cascade and the aggregate channel technique.
Figure 7. Score processing map for both boosted cascade andaggregate channel features technique. (top) original input image(middle) boosted cascade result (bottom) aggregate channel fea-tures result

The precision-recall curves clearly show that object categoriza-tion techniques outperform the other, more basic computer vi-sion techniques. We notice that the boosted cascade techniqueperforms still a bit better than the aggregate channel technique,which indicates that adding extra feature channels like colour andother gradient filters is overkill for solar panel detection. To testthis theory we added HSV pixel based segmentation as a post-processing step to our boosted cascade detector, displayed as thered curve in Figure 6. We see almost no increase in efficiencywhich made us to decide to drop this extra processing step, in or-der to obtain a smaller computational complexity and thus a fasterrunning time.
6. DISCUSSION AND CONCLUSION
Our goal is to compare techniques for automatically detectingphotovoltaic solar panel installations in RGB aerial images, con-sidering the very challenging conditions due to the limited resolu-tion, the limited amount of visual features, the existance of spec-ular reflections and the different orientations of the solar panelobject class.
Using pixel based segmentation for solar panel detection yieldsonly moderate results. In any given test image, it is impossible toonly separate blobs that are pure solar panels, since the colour dis-tribution of the panels, also tends to return in many backgroundpatches. Furthermore there are several solar panel types that tendto deviate from the average colour distribution, like the full blacktype, generating even more missed detections.
Applying smarter feature based techniques, like the MSER basedapproach, seems promising and even yields decent results in spe-cific areas, but still has quite a fast drop in accuracy when con-sidering larger regions where solar panels need to be detected, asseen from the resulting precision-recall curve based on the 2× 2km area of Sint-Truiden.
However, our tests clearly showed that object categorization tech-niques like boosted cascades and aggregate channel features canoutperform more basic techniques with the only downside thattraining data needs to be collected and that the single trainingsetup for building the model takes a bit longer.
We proved that computer vision is a working solution for effi-cient and fully automated solar panel detection in RGB basedaerial imagery for fraud detection. For a fully automated sys-tem, achieving a precision of 93% at a recall of 80% is not bad atall. Certainly if you take into account some considerations. Dueto the heavy deformations a roofs’ slant angle can introduce tothe solar panel object, training multiple models to cope with themissed detections could be a first improvement. Furthermore, weperformed the research on mid resolution images, at 25cm/pixel.However there are already measurements of the same area at aresolution of 8cm/pixel available, which would again yield anaccuracy increase. Since our training set consists mainly of in-dustrial solar panel arrays, it is also quite understandable that themodel is not able to cope with the larger deformations found onsolar panels placed on domestic housing.
Finally one could argue that the fully automated system shouldnot be able to detect 100% of the solar panels with 100% pre-cision. In most set-ups, an operator is still available for slightsemi-automated input. We could provide that percentage of ob-ject that we did not found, or that yield a lower certainty, to theoperator and ask him to define these cases of doubt by manualinspection. This suggested semi-automated approach would stillreduce the manual labour drastically and reduce the time neededto process larger datasets.
As future research based on this paper we suggest to take a closerlook at CNN based detectors Girshick et al. (2014). In manyobject detection tasks they achieve top notch performance andcould thus improve the obtained results.
7. ACKNOWLEDGEMENTS
This work is supported by the KU Leuven, Campus De Nayer,through a scholarship. We would like to thank Infrax, for provid-ing the solar panel datasets and manual annotations.
References
De Smedt, F. and Goedeme, T., 2015. Open framework for com-bined pedestrian detection. In: VISAPP, Vol. 2, pp. 551–559.
Dollar, P., Appel, R. et al., 2014. Fast feature pyramids for objectdetection. TPAMI 36(8), pp. 1532–1545.
Dollar, P., Tu, Z. et al., 2009. Integral channel features. In:BMVC.
Felzenszwalb, P. F., Girshick, R. B. et al., 2010. Cascade objectdetection with deformable part models. In: CVPR, pp. 2241–2248.
Freund, Y., Schapire, R. et al., 1999. A short introduction toboosting. JSAI Journal 14(771-780), pp. 1612.
Girshick, R., Donahue, J. et al., 2014. Rich feature hierarchiesfor accurate object detection and semantic segmentation. In:CVPR, pp. 580–587.
Gleason, J., Nefian, A. et al., 2011. Vehicle detection from aerialimagery. In: ICRA, IEEE, pp. 2065–2070.
Hinz, S. and Baumgartner, A., 2003. Automatic extraction ofurban road networks from multi-view aerial imagery. Journalof Photogrammetry and Remote Sensing 58(1), pp. 83–98.
Li, W.-C. and Tsai, D.-M., 2012. Wavelet-based defect detectionin solar wafer images with inhomogeneous texture. PatternRecognition 45(2), pp. 742–756.
Liao, S., Zhu, X. et al., 2007. Learning multi-scale block local bi-nary patterns for face recognition. In: Advances in Biometrics,Springer, pp. 828–837.
Matas, J., Chum, O. et al., 2004. Robust wide-baseline stereofrom maximally stable extremal regions. Image and visioncomputing 22(10), pp. 761–767.
Mayer, H., 1999. Automatic object extraction from aerial im-agerya survey focusing on buildings. CVIU 74(2), pp. 138–149.
Puttemans, S. and Goedeme, T., 2015. Visual detection andspecies classification of orchid flowers. In: MVA, IEEE,pp. 505–509.
Puttemans, S., Goedeme, T. et al., 2015. Automated walking aiddetector based on indoor video recordings. In: EMBC, IEEE,pp. 5040–5045.
Sanchez-Friera, P., Piliougine, M. et al., 2011. Analysis of degra-dation mechanisms of crystalline silicon pv modules after 12years of operation in southern europe. Progress in photo-voltaics: Research and Applications 19(6), pp. 658–666.
Tsai, D.-M., Wu, S.-C. et al., 2013. Defect detection in solar mod-ules using ica basis images. IEEE Transactions on IndustrialInformatics 9(1), pp. 122–131.
Viola, P. and Jones, M., 2001. Rapid object detection using aboosted cascade of simple features. In: CVPR, Vol. 1, IEEE,pp. I–511.