DETECTION OF ONSET MUSCLE FATIGUE BASED ON JOINT...
42
DETECTION OF ONSET MUSCLE FATIGUE BASED ON JOINT ANALYSIS OF SURFACE ELECTROMYOGRAPHY SPECTRUM AND AMPLITUDE NURUL AIN BINTI MOHAMAD ISHAK A thesis submitted in fulfilment of the requirements for the award of the degree of Doctor of Philosophy (Biomedical Engineering) Faculty of Biosciences and Medical Engineering Universiti Teknologi Malaysia OCTOBER 2017
Transcript of DETECTION OF ONSET MUSCLE FATIGUE BASED ON JOINT...

DETECTION OF ONSET MUSCLE FATIGUE BASED ON JOINT ANALYSIS
OF SURFACE ELECTROMYOGRAPHY SPECTRUM AND AMPLITUDE
NURUL AIN BINTI MOHAMAD ISHAK
A thesis submitted in fulfilment of the
requirements for the award of the degree of
Doctor of Philosophy (Biomedical Engineering)
Faculty of Biosciences and Medical Engineering
Universiti Teknologi Malaysia
OCTOBER 2017

iii
Alhamdullilah,
Dedicate my appreciation to my beloved husband, family, supervisor and friends.

iv
ACKNOWLEDGEMENT
Firstly, I am deeply thankful and immensely grateful to ALLAH s.w.t, for His
endless blessings by giving me this opportunity, the strength and the patience to
complete this thesis successfully.
I also would like to thank my supervisors, Dr. Puspa Inayat Khalid and PM
Dr. Nasrul Humaimi Mahmood, for the guidance, encouragement, constructive
criticism, insightful comments, brilliant ideas, good teaching and advice during this
study. This accomplishment would not have been possible without them. Besides
my supervisors, I would like to extend my sincere gratitude and appreciation to Dr
Mokhtar Harun for his willingness to review my research paper and also thanks to
PM Dr. Robiah Adnan for her willingness and sheer dedication to teach me Statistics.
My sincere thanks also goes to the participants who have involved throughout the
experiment process. Special gratitude goes to all my college friends who have
always assisted me by sharing their knowledge, ideas, and useful tips along this
research process.
Last but not least, I want to express my profound gratitude to my parents,
husband, and son for their understanding, patience, unfailing support and
unconditional love during this research journey. For pushing me further than I
thought I could go. They all kept me going. The completion of this research would
not have been possible without them.
v
ABSTRACT
Many studies have been conducted to track muscle fatigue and to understand
the mechanisms that contribute to the deterioration of muscle performance.
Electromyography fatigue threshold (EMGFT) and Integrated Electromyography
(IEMG) are two techniques that have been applied to determine the Onset of Muscle
Fatigue (OMF) by depending on the percentage force output and amplitude
respectively. Nevertheless, force and amplitude are correlated with one another
during fatigue. Joint Analysis of EMG Spectrum and Amplitude (JASA) is
commonly used to discriminate force-related from fatigue induced EMG changes.
However, the length of signal affects the performance of JASA in discriminating
fatigue signal. Apart from that, JASA has not been used to detect OMF. Thus, the
purpose of this study is to determine the OMF region by applying JASA on the
segmented EMG signal. Surface EMG signals were recorded from 30 college
students while they were performing isometric contractions of Biceps Brachii
muscles for 2 minutes. Each recorded signal was segmented into 15-second time
interval. Root Mean Square (RMS) and Mean Frequency (MNF) were used as the
muscle fatigue indicators. The indicators were extracted from 3-second epoch length
within each segment. A polynomial regression model was applied to describe the
trends of the indicators in a segment. The first segment that simultaneously showed
a decrease in the frequency and an increase in the amplitude of a sEMG signal with
correlation coefficient r ≥ 0.7 was classified as the region where the OMF occurred.
Out of 30 subjects, 20 subjects (67%) either admitted to experience muscle
discomfort and at the same time the OMF region was also detected or vice-versa.
For the other 10 subjects, the OMF region was able to be detected in 90% of them
but due to better endurance levels, they required longer time to experience muscle
discomfort. The temporal-spectral fatigue indicator (Instantaneous Mean Frequency
(iMNF)) was used to determine the reliability of the developed technique. The
decrement of iMNF on the detected OMF region showed high correlation coefficient
(r > 0.6). The subjects were also asked to perform dynamic contractions for 2
minutes. The proposed technique was applied to the recorded signals and the OMF
was detected in 24 subjects. Eighteen of them (72%) acknowledged that they had
experienced muscle discomfort. Fourteen out of 18 subjects felt muscle discomfort
after OMF was detected. The results indicate that muscle discomfort develops
gradually after the onset of muscle fatigue. For handwriting activity, 4 subjects were
asked to write for 5 minutes while the sEMG signals were captured from Flexor
Carpi Radialis muscle (small muscle). Out of 4 subjects, all of them showed an
increment in pen pressure, and 75% of them showed an increment in the writing
speed after detecting OMF region. This study concludes that the proposed technique
is feasible to detect the OMF; not only during isometric contraction but also during
dynamic contraction. The technique also has the potential to be applied to small
muscle contraction.

vi
ABSTRAK
Banyak kajian telah dijalankan bagi mengesan keletihan otot dan seterusnya
bagi memahami mekanisme yang menyebabkan kemerosotan prestasi otot. Tahap
Permulaan Keletihan Elektromiografi (EMGFT) dan Elektromiografi Bersepadu
(IEMG) merupakan dua teknik yang digunakan bagi menentu Permulaan Keletihan
Otot (OMF) berdasarkan perubahan tenaga dan amplitud. Walau bagaimanapun,
semasa keletihan, perubahan dua faktor saling berkait di antara satu sama lain. Bagi
membezakan tenaga yang dikaitkan dengan keletihan yang mendorong kepada
perubahan EMG, Analisis Elektromiografi (EMG) Spektrum dan Amplitud (JASA)
digunakan. Tetapi, prestasi JASA dalam mengesan isyarat keletihan terjejas dengan
pemilihan panjang isyarat yang digunakan. Selain itu, JASA juga jarang digunakan
bagi mengesan OMF. Maka, tujuan kajian ini adalah untuk menentukan kawasan
OMF dengan mempraktiskan JASA pada isyarat EMG bersegmen. Isyarat
permukaan EMG merekodkan 2 minit aktiviti pengecutan isometrik (otot Biceps
Brachii) yang dijalankan ke atas 30 subjek. Setiap isyarat telah dibahagikan kepada
selang masa 15 saat. Punca Min Persegi (RMS) dan Kekerapan Min (MNF)
digunakan sebagai penunjuk bagi keletihan otot. Penunjuk keletihan ini ditentukan
bagi setiap 3 saat dalam segmen. Regresi polynomial telah digunakan bagi
menggambarkan kadar perubahan. Segmen pertama yang menunjukkan penurunan
kekerapan dan peningkatan amplitud dengan pekali korelasi r ≥ 0.7 telah
diklasifikasikan sebagai rantau OMF. Daripada 30 subjek, 20 (67%) subjek
mengakui telah merasa ketidakselesaan otot dan pada masa yang sama kawasan
OMF telah dikesan atau sebaliknya. Baki 10 subjek, kawasan OMF telah berjaya
dikesan pada 90% daripada mereka tetapi atas faktor ketahanan otot yang baik,
tempoh masa yang lama diperlukan sebelum mereka merasa ketidakselesaan otot.
Masa-spektrum penunjuk keletihan (Frekuensi Min Serta-merta (iMNF)) digunakan
untuk menentukan kebolehpercayaan teknik. Penyusutan iMNF di rantau OMF
menunjukkan pekali korelasi yang tinggi (r > 0.6). Subjek juga diminta untuk
melaksanakan kontraksi dinamik selama 2 minit. Dengan mengaplikasikan teknik
yang dicadangkan, OMF telah dikesan di kalangan 24 subjek. Lapan belas daripada
mereka (72%) mengakui mereka memgalami ketidakselesaan otot. Empat belas
daripada 18 subjek merasakan ketidakselesaan otot selepas OMF dikesan.
Keputusan ini menunjukkan ketidakselesaan otot akan berkembang secara pelahan
selepas bermulanya keletihan otot. Untuk aktiviti tulisan tangan, 4 subjek telah
diminta untuk menulis selama 5 minit manakala isyarat sEMG dirakam pada otot
Flexor Carpi Radialis (otot kecil). Daripada 4 subjek, selepas OMF dikesan,
kesemua mereka telah menunjukkan kenaikan tekanan pen, dan 75% menunjukkan
kenaikan dalam kelajuan menulis. Kajian ini menyimpulkan bahawa teknik yang
dicadangkan boleh dilaksanakan untuk mengesan OMF; bukan sahaja semasa
penguncupan isometrik tetapi juga semasa penguncupan dinamik. Teknik ini juga
berpotensi digunakan untuk penguncupan otot kecil.
vii
TABLE OF CONTENTS
CHAPTER TITLE PAGE
DECLARATION ii
DEDICATION iii
ACKNOWLEDGEMENT iv
ABSTRACT v
ABSTRAK vi
TABLE OF CONTENTS vii
LIST OF TABLES xi
LIST OF FIGURES xiii
LIST OF ABBREVIATION xvii
LIST OF SYMBOLS xix
LIST OF APPENDICES xxi
1 INTRODUCTION 1
1.1 Introduction 1
1.2 Background of Study 2
1.3 Problem Statement 5
1.4 Research Objectives 7
1.5 Research Scopes 8
1.6 Research Contribution 8
1.7 Thesis Organisation 9
2 LITERATURE REVIEW 11
2.1 Introduction 11
2.2 Human System 11

viii
2.2.1 Nervous System 12
2.2.2 Muscular System 12
2.2.3 Skeletal System 14
2.3 The Principle of Electromyography (EMG) 15
2.3.1 Surface Electromyography 17
2.3.2 Muscle Fatigue 18
2.3.2.1 Force Production 19
2.3.2.2 Muscle Contraction 20
2.3.2.3 Muscle Performance 20
2.4 Surface Electromyograph 21
2.5 Muscle Fatigue Indicators 23
2.5.1 Time Domain 23
2.5.2 Frequency Domain 26
2.5.3 Time-Frequency Domain 27
2.6 Muscle Fatigue Detection 28
2.6.1 Joint Analysis of Electromyography
Spectrum and Amplitude (JASA) 33
2.7 Summary 34
3 METHODOLOGY 36
3.1 Introduction 36
3.2 Data Collection 38
3.2.1 Subject Recruitment 39
3.2.2 Experimental Setup 40
3.2.3 Fatigue Exercise Protocols 43
3.2.3.1 Isometric Contraction 44
3.2.3.2 Dynamic Contraction 46
3.2.3.3 Handwriting Activity 47
3.3 Signal Processing and Feature Extraction 48
3.3.1 Noise Removal 49
3.3.2 Feature Extraction 50
3.3.2.1 Root Mean Square (RMS) 51
3.3.2.2 Mean Frequency (MNF) 52
3.4 Development of OMF Detection Technique 52

ix
3.4.1 Signal Segmentation 53
3.4.2 Epoch Length Selection 54
3.4.3 Regression Model 55
3.4.4 Statistical Analysis 56
3.4.5 Onset of Muscle Fatigue (OMF) Region
Detection 56
3.5 Performance Evaluation 58
3.5.1 Reliability Assessment 58
3.5.2 Applicability Assessment 60
3.5.2.1 Biceps Curl 60
3.5.2.2 Handwriting Behaviour 60
4 RESULTS, ANALYSIS, AND DISCUSSIONS 63
4.1 Introduction 63
4.2 Participants‟ Demographic Information 63
4.3 Signal Processing 64
4.4 Data Specification 66
4.4.1 Epoch Length 67
4.4.2 Regression Models 69
4.4.3 The Combination of Epoch Length and
Regression Model 72
4.5 Determination of the Onset of Muscle Fatigue
(OMF) Region 74
4.5.1 Group A 76
4.5.2 Group B 84
4.5.3 Group C 86
4.5.4 Group D 87
4.5.5 Relationship between BMI and
Muscle Endurance 88
4.6 Application of Developed Technique 90
4.6.1 Dynamic Contraction 90
4.6.2 Handwriting Activity 92
4.7 Summary 97

x
5 CONCLUSIONS AND FUTURE WORK
RECOMMENDATIONS 99
5.1 Conclusion 99
5.2 Limitation and Drawbacks 101
5.3 Recommendations for Future Works 102
REFERENCE 103
Appendices A-H 115-140

xi
LIST OF TABLES
TABLE NO. TITLE PAGE
2.1 List of EMG machines 21
2.2 Time domain features (Phinyomark, Phukpattaranont,
and Limsakul, 2012a) 24
2.3 Frequency domain features (González-Izal et al., 2012) 26
2.4 Previous studies related to the determination of OMF 29
2.5 Various % MVC used for EMG-force relationship 30
2.6 Four regions of muscle activity based on JASA
(Luttmann, Jäger, and Laurig, 2000) 34
3.1 Criteria to determine the OMF region 57
3.2 Sample of the four regions to analyse the trend of iMNF 60
3.3 The information obtained from Wacom Tablet 61
4.1 Participants‟ demographic information 64
4.2 Distribution of the participants based on BMI category
and gender 64
4.3 Number of data involved in the process of determining
the suitable epoch length 67
4.4 The significant difference (p < 0.05) in σSEE values when
compared in pair 69
4.5 The four groups of study 75
4.6 The r-values for RMS and MNF for Subject 6 79
4.7 The time gap between OMF region and EF region 81
4.8 The r-values for iMNF features (Group A) 83
4.9 The r-values for RMS and MNF for Subject 9 85
4.10 The time of OMF detection 85
4.11 The r-values for iMNF parameter (Group B) 86
xii
4.12 The r-values for RMS and MNF for Subject 11 87
4.13 The time gap between OMF region and EF region for
biceps curl activity of Group A members 92
4.14 The time of OMF detection for Group B 92

xiii
LIST OF FIGURES
FIGURE NO TITLE PAGE
1.1 EMG Fatigue Threshold: (a) Regression analysis of
MNF and (b) Force-slope coefficient graph
(Bouillard, Guével, and Hug, 2011) 4
2.1 Single motor neuron (Jahn, 2015) 12
2.2 Human muscular system (Protrudent, 2016) 13
2.3 Skeletal muscle (Martini, Timmons, and
Tallitsch, 2009) 14
2.4 Action potential 15
2.5 Needle EMG (nEMG) and Surface EMG (sEMG)
(Konrad, 2005) 16
2.6 Recorded muscle signal 16
2.7 Surface electrode configurations: (a) monopolar,
(b) bipolar (NR Sign Inc. 2017) 18
2.8 The shift of the spectral feature when fatigue
(Barandun et al., 2009) 27
2.9 The trend of fatigue indicators (electric activity, MNF,
and MDF) for one subject (Moshou et al., 2005) 32
3.1 The overall process of the methodology 36
3.2 The flow of the data collection process 38
3.3 Subject recruitment 40
3.4 NeuroPrax System 41
3.5 Electrode placement 41
3.6 The tasks and selected muscles 42

xiv
3.7 Studied muscles: (a) Biceps Brachii Muscles
(AnatomyLibrary, 2016), (b) Flexor Carpi Radialis
(FCR) Muscles (Julia, 2015) 42
3.8 2-kg dumbbell 43
3.9 Skin preparation: (a) Electrode placement,
(b) Disposable electrode 44
3.10 Experimental procedure for isometric contraction 45
3.11 Sitting position with elbow fixed at 90-degree 45
3.12 Biceps curl activity: (a) block diagram, (b) half range
of flexion 46
3.13 Experimental procedure for dynamic contraction 47
3.14 The attachment of A5 paper over the surface of digital
graphic tablet 48
3.15 The overall procedure in detecting OMF region 49
3.16 Noise removal procedure 50
3.17 OMF detection technique 53
3.18 2-minute signal divided into the 15-seconds time
intervals 53
3.19 Data specification 54
3.20 15-second filtered signal 57
3.21 Performance evaluation 58
4.1 Raw muscle signal 65
4.2 Filtered signal 66
4.3 Standard Error Estimate (σSEE) for an individual subject
(Subject 22): (a) σSEE for RMS, (b) σSEE for MNF 68
4.4 The Correlation Coefficient (r-values) plotted of RMS
values in each 15-second segment using linear and
polynomial regression models 70
4.5 The difference of r-values between 2 regression
models, linear (blue bars) and polynomial (red bars).
Graph (a) and (b) for Subject 6 and (c) (d)
for Subject 22 71
xv
4.6 The fluctuation of RMS feature in 2-minutes studied
data 72
4.7 r-values for two different epoch length (3-second and
5-second) with polynomial regression model for two
fatigue indicator (a) RMS (b) MNF 73
4.8 Muscle signal form Subject 6 76
4.9 The process of determining the r-values: (a) indicates
the RMS distribution, (b) indicates the performance of
the polynomial regression in 15-second segment
(blue box) 77
4.10 The process of determining the r-values: (a) indicates
the MNF distribution, (b) indicates the performance of
the polynomial regression in 15-second segment
(blue box) 78
4.11 The r-values of RMS and MNF for Subject 6 in
8 segments (1 segment = 15-second). „A‟ region
indicates overcome fatigue; 'B' region indicates force
increase; 'C' region indicates force decrease; region „D‟
indicates fatigue 80
4.12 The r-values of RMS and MNF for Subject 9 in 8
segments (1 segment = 15-second). „A‟ region
indicates overcome fatigue; 'B' region indicates force
increase; 'C' region indicates force decrease; „D‟ region
indicates fatigue 84
4.13 The r-values of RMS and MNF for Subject 11 in 8
segments (1 segment = 15-second). „A‟ region
indicates overcome fatigue; 'B' region indicates force
increase; 'C' region indicates force decrease; region „D‟
indicates fatigue 86
4.14 Distribution of the participants based on BMI category
and groups of study 88
4.15 The distribution of subjects in 2 different muscle
activity, isometric contraction and dynamic contraction 90

xvi
4.16 The r-values of RMS and MNF during handwriting
activity 94
4.17 The changes in mean pen pressure in each 15-second
segment 95
4.18 The changes of mean writing speed in each 15-second
segment 96
xvii
LIST OF ABBREVIATIONS
Ag-AgCI - Disposable Pre-gelled Surface Electromyography
Electrodes
ANN - Artificial Neural Network
BMI - Body Mass Index
BPF - Band-pass Filter
BSF - Band-stop Filter
CMRR - Common Mode Rejection Ratio
CNS - Central Nervous System
CV - Conduction Velocity
CWD - Choi-William Distribution
ECG - Electrocardiogram
EEG - Electroencephalogram
EF - Experiencing Fatigue
EMC - Expected Maximum Contraction
EMG - Electromyography
EMGFT - Electromyography Fatigue Threshold
FCR - Flexor Carpi Radialis
FInsmk - Fatigue Indices
HPF - High-pass Filter
IEMG - Integrated Electromyography
iMNF - Instantaneous Mean Frequency
iRMS - Instantaneous Root Mean Square
JASA - Joint Analysis of Surface Electromyography
Spectrum and Amplitude
LPF - Low-pass Filter
MAV - Mean Absolute Value
MDF - Median Frequency
xviii
MES - Transient Myoelectric Signal
MLPNN - Multi-layer Perception Neural Network
MNF - Mean Frequency
MUAP - Motor Unit Action Potential
MVC - Maximal Voluntary Contraction
nEMG - Needle Electromyography
OMF - Onset of Muscle Fatigue
PSD - Power Spectrum Density
r - Correlation Coefficient
RMS - Root Mean Square
sEMG - Surface Electromyography
SOM - Self-organizing maps
STFT - Short-time Fourier Transforms
TFD - Time-frequency Distribution
TFR - Time-Frequency Representation
UTM - Universiti Teknologi Malaysia
WAMP - Willison Amplitude
WL - Waveform Length
WVD - Wigner-Ville Distribution
ZC - Zero-Crossing
% MVC - Percentage of Maximal Voluntary Contraction
σSEE - Standard Error Estimate

xix
LIST OF SYMBOLS
AvePressure - Average pressure
AveSpeed - Average speed
EMG (t) - Amplitude of muscle signal
f - Frequency
fc - Cut-off frequency
fj - Frequency
FInsmk - Fatigue indices
h (t) - Window function
IEMG - Integrated electromyography
iMNF - Instantaneous mean frequency
MAV - Mean absolute value
MDF - Median frequency
MNF - Mean frequency
N - Length of electromyography signal
n - Number of paired data
Pj - Power spectrum density
P(t,w) - Spectrogram
PSD(f) - Power spectrum density
RMS - Root mean square
Speed15-second - Speed in 15-second
STFT(t,f) - Short-Time Fourier Transforms signal
t - Time
w - Window
WL - Waveform length
WAMP - Willison Amplitude
x - x-coordinate
xi - Electromyography signal

xx
y - y-coordinate
Y - Actual data
Y’ - Predicted data
ZC - Zero-Crossing
∑ - Summation
% - Percentage
│x│ - Absolute value
σest - Standard error estimate value
∫ - Integral
* - Complex conjugate
𝜓 - Wavelet Function

xxi
LIST OF APPENDICES
APPENDIX TITLE PAGE
A Publications 115
B Subject‟s Informations 116
C Epoch Length 118
D Regression Model 126
E Group A 132
F Group B 134
G Group D 136
H Dynamic Contraction 138

1
CHAPTER 1
INTRODUCTION
1.1 Introduction
Muscle fatigue is known as a feeling of weakness or muscle pain or a decline
in muscle performance (Merletti, Rainoldi and Farina, 2004), commonly occurred
when performing repetitive movements for a long period of time. When studying
muscle fatigue, there is no-specific symptom, which means that it has many possible
causes and accompanies many different conditions and illnesses. The mechanism is
different in terms of the activities performed, gender, and the subject‟s physical level
(patient, athlete, or ordinary person), which influenced by the muscle force applied
and endurance level of the individual. Thus, to understand the mechanisms that have
contributed to the decline of the muscle performance, it is crucial to know the Onset
of Muscle Fatigue (OMF) (Enoka and Duchateau, 2008). Basically, the OMF is
known as a starting point where the muscle starts to experience fatigue as soon as the
muscle activity began.
Muscle fatigue is not only about the decline in muscle performance, but also
the decrease in the ability of a muscle to exert force (Vøllestad, 1997; Moshou et al.,
2005); the reduction of force causes the decline in muscle performance (Marson,
2011). Yet, people have ability to manipulate their muscle force while performing
certain activity (Maton, 1981). This has further complicated process of determining
the OMF.
2
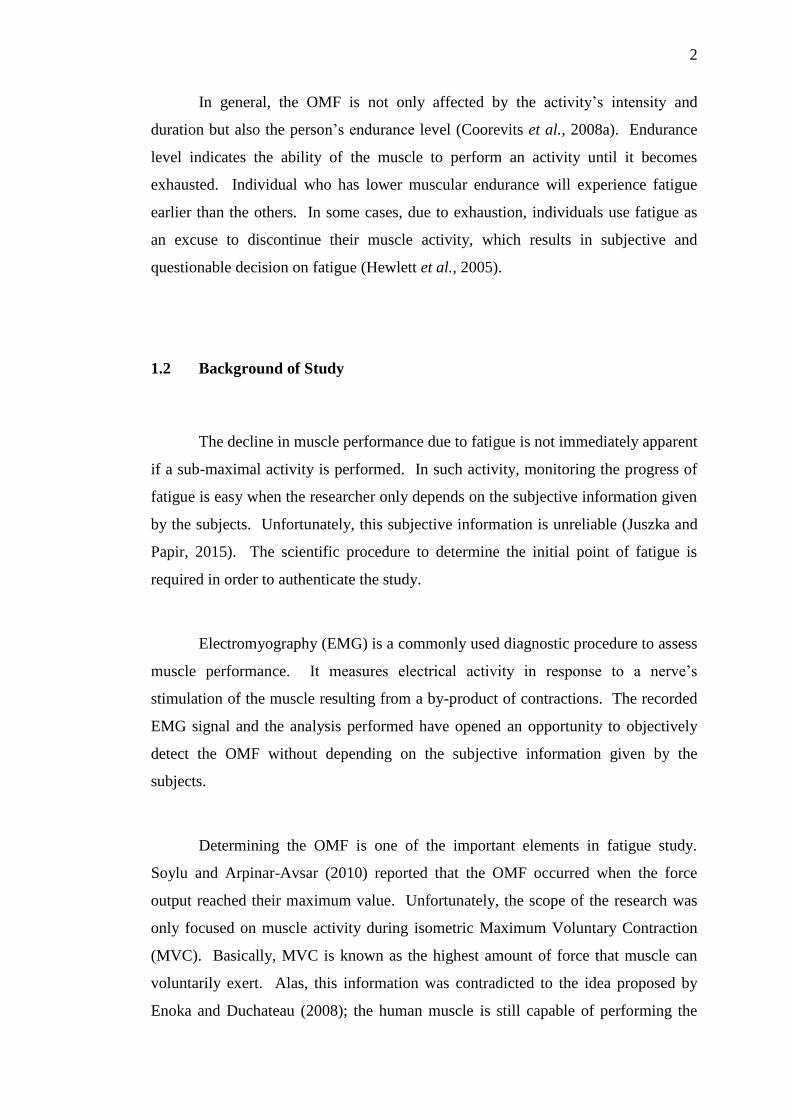
In general, the OMF is not only affected by the activity‟s intensity and
duration but also the person‟s endurance level (Coorevits et al., 2008a). Endurance
level indicates the ability of the muscle to perform an activity until it becomes
exhausted. Individual who has lower muscular endurance will experience fatigue
earlier than the others. In some cases, due to exhaustion, individuals use fatigue as
an excuse to discontinue their muscle activity, which results in subjective and
questionable decision on fatigue (Hewlett et al., 2005).
1.2 Background of Study
The decline in muscle performance due to fatigue is not immediately apparent
if a sub-maximal activity is performed. In such activity, monitoring the progress of
fatigue is easy when the researcher only depends on the subjective information given
by the subjects. Unfortunately, this subjective information is unreliable (Juszka and
Papir, 2015). The scientific procedure to determine the initial point of fatigue is
required in order to authenticate the study.
Electromyography (EMG) is a commonly used diagnostic procedure to assess
muscle performance. It measures electrical activity in response to a nerve‟s
stimulation of the muscle resulting from a by-product of contractions. The recorded
EMG signal and the analysis performed have opened an opportunity to objectively
detect the OMF without depending on the subjective information given by the
subjects.
Determining the OMF is one of the important elements in fatigue study.
Soylu and Arpinar-Avsar (2010) reported that the OMF occurred when the force
output reached their maximum value. Unfortunately, the scope of the research was
only focused on muscle activity during isometric Maximum Voluntary Contraction
(MVC). Basically, MVC is known as the highest amount of force that muscle can
voluntarily exert. Alas, this information was contradicted to the idea proposed by
Enoka and Duchateau (2008); the human muscle is still capable of performing the
3
contraction activity even though it has started feeling fatigue. The idea was
supported by Maton (1981); the muscle fatigue can be detected from the beginning of
the sub-maximal contraction. Moreover, this statement was vindicated in
Electromyography Fatigue Threshold (EMGFT) technique; the threshold value has
been detected before the force reached the MVC value.
Electromyography Fatigue Threshold (EMGFT) is one of the techniques to
determine the starting point of fatigue in respect to the force level (Hendrix et al.,
2009; Hendrix et al., 2010). It is commonly used to distinguish fatigue signal from
the non-fatigue signal (Hendrix et al., 2009). In this technique, the progress of
fatigue is estimated by interpolating a maximal contraction.
Determination of the EMGFT is based on the force output (Bouillard, Guével,
and Hug, 2011). The procedures require the subjects to perform isometric
contraction at different percentages of load, such as 10 %, 20 %, 30 %, and 40 %, in
relation to MVC (Bilodeau et al., 2003). In each load, the behaviour of fatigue
indicators such as Root Means Square (RMS) and Mean Frequency (MNF) are
analysed and projected onto a graph (Figure 1.1(a)). Linear regression between each
fatigue indicator and time for each per cent load is performed to obtain the slope.
Another linear regression is then performed between the slope and its corresponding
load. The y-intercept of the line is described as the EMGFT as shown in Figure
1.1(b).
Unfortunately, some difficulties were observed when depending only on the
MVC value to determine the fatigue threshold. As determination of MVC requires
the subjects to exert their maximum voluntary force, this technique was limited only
to limb muscle (Vøllestad, 1997). Furthermore, MVC is measured during static
contraction. Therefore, the measured MVC value may not picture the maximum
muscle force during dynamic contraction. The amplitude of the muscle signal during
dynamic activity could be higher than the recorded MVC value.

4
Figure 1.1: EMG Fatigue Threshold: (a) Regression analysis of MNF and (b) Force-slope coefficient graph (Bouillard, Guével, and Hug, 2011)
4

5
The activities that involve small muscle movement such as handwriting will
also limit the application of the EMGFT technique (Bouillard, Guével, and Hug,
2011). Estimating MVC for small muscles (muscles for small movements) has been
reported to produce varying ranges of accuracy at different levels of MVC (Young
et al., 2005). This may be due to the fact that the muscles used for small movement
are smaller and thinner than the muscles used for large movement.
Above all, muscle used for small movement and dynamic contraction are also
experiencing fatigue and the OMF for such conditions cannot rely on the method that
requires MVC value.
Ordinarily, the trends of amplitude and spectrum parameters have been used
to study fatigue behaviours. Joint Analysis of Surface Electromyography Spectrum
and Amplitude (JASA) is a method that is used to discriminate force-related from
fatigue induced EMG changes (Luttmann, Jäger, and Laurig, 2000). However,
contradicting results were reported. Since there was no significant trend shown in
spectrum parameters, Moshou et al. (2005) concluded that JASA was not appropriate
for fatigue analysis. On the contrary, Oh, Kim, and Hong (2014) reported that the
observed trends in both spectrum and amplitude parameters can be used to describe
fatigue. These two opposing results lead to further research on the use of JASA.
1.3 Problem Statement
Whenever muscle performances become the subject matter, muscle fatigue is
one of the related topics usually discussed. However, there are few arising issues
when studying this topic such as the detection of the fatigue starting point and the
selection of the muscle to be studied. These critical issues are significant in order to
ensure the validity of the study.
5

6
Learning the OMF is important especially when mechanism changes
afterwards is concerned. There are several techniques that have been used by
researchers to determine the OMF such as EMGFT, force output and integrated EMG
(IEMG) (Maton, 1981; Moshou et al., 2005; Hendrix et al., 2009; Soylu and
Arpinar-Avsar, 2010). For EMGFT, the value of MVC plays an important role in
determining the threshold value. In spite of that, several disadvantages were reported
especially in the studied muscle (limited to limb muscle) (Vøllestad, 1997) and
experimental method (dynamic contraction activity) (Luttmann, Jäger, and Laurig,
2000). Furthermore, Bouillard, Guével, and Hug (2011) had stated that this
technique is inapt to access the muscle function.
According to Soylu and Arpinar-Avsar (2010) and Maton (1981), OMF could
be identified based on the increment of force output and amplitude parameter
(IEMG) respectively. OMF was identified when the force output has reached the
maximum value (Soylu and Arpinar-Avsar, 2010). Nonetheless, this experiment was
performed in maximum contraction activity. On the contrary, Maton (1981)
determined the OMF based on the increment in IEMG. The author reported that the
OMF was detected at the beginning of the sub-maximal contraction. Anyhow,
Luttmann, Jäger, and Laurig (2000) claimed that the increment of amplitude signal
(IEMG) was not the only criteria to determine fatigue, but also the increment of
force. In order to discriminate between force and fatigue, the combination on both
temporal and spectrum parameters are suggested.
JASA introduces four muscle conditions: fatigue, overcome fatigue, force
increase, and force decrease. Although Moshou et al. (2005) stated that JASA was
inappropriate to be applied when studying muscle fatigue, it should be noted that Oh,
Kim, and Hong (2014) and Jonkers et al. (2004) were able to detect fatigue using
JASA. Originally, JASA was used to declare the existence of fatigue signal.
Jonkers et al. (2004) had used JASA to quantify muscle fatigue during the activity of
powering the wheelchair. In this study, the 0.5-seconds of initial and end points of
the muscle signal were used to extract the average of the rectified signal and median
frequency. Based on these two fatigue indicators, the signal was declared as fatigue
signal if the average of the rectified signal gives a positive value and median

7
frequency gives a negative value. However, the procedure was different from
Moshou et al. (2005) and Oh, Kim, and Hong (2014); the regression analysis was
performed on the extracted fatigue indicators, and the trend of the fatigue indicator
were used as the parameters to determine the region in JASA. Although both studies
used similar procedure, the results had shown to be affected by the length of data.
By using a shorter signal (1200-seconds) (Oh, Kim, and Hong, 2014), the regression
analysis can interpret the fatigue-induced EMG trends (spectrum and amplitude)
better; Moshou et al. (2005) on the other hand used a longer signal (3600-seconds).
This comparison shows that the length of data does affect the regression performance
in JASA. In addition, Smith (1997) had highlighted that the segmentation with
similar characteristics is needed especially for a long recording signal. Thus, it is the
intention of this study to apply JASA with specific regression analysis on the
segmented EMG signal to determine the OMF.
1.4 Research Objectives
The objectives of this research are:
i. To detect the onset of muscle fatigue region based on JASA for the
recorded EMG signal from isometric contraction.
ii. To determine the appropriate data to be presented in regression analysis
throughout the segmented signal.
iii. To assess the performance of the proposed technique in detecting the
OMF region for different types of contractions: isokinetic contraction
and small muscle contraction.

8
1.5 Research Scopes
The scopes of this research are divided into three different sections:
participants, experimental setup, and data analysis.
i. Participants: 30 subjects consisted of 15 males and 15 females from
Universiti Teknologi Malaysia (UTM) were selected for this study. The
subjects are right handed and in the age range of 19 to 30 years old.
ii. Experimental setup: three different experiments were conducted- static
activity (isometric contraction), dynamic activity (isokinetic
contraction) and handwriting activity (small muscle contraction). For
static and dynamic activities, a two-kg dumbbell was used as an
instrument. NeuroPrax System was used to record the myoelectric
signal produced by the muscle during the activity. Meanwhile, Wacom
Tablet was used to record the dynamic data produced during
handwriting activity.
iii. Data analysis: Matlab software was used to process and analyze the
recorded data. Excel software was used for statistical analysis.
1.6 Research Contributions
Several techniques have been used by previous researchers in determining
OMF: EMGFT, force output, and amplitude changes. EMGFT uses threshold value to
determine the starting point of fatigue (Hendrix et al., 2009). Meanwhile, Soylu and
Arpinar-Avsar (2010) determined the OMF based on the decrement in maximum
force value. However, these techniques depend on MVC value, which limits the
scope of this study. In terms of amplitude trend, Maton (1981) has used the
increment in IEMG parameter to proclaim the OMF. Despite that, the increment on
the amplitude parameters not only demonstrates fatigue but also force changes.
Therefore, to differentiate between force and fatigue, a new approach was
introduced. Adapting JASA‟s definition for muscle fatigue condition, this technique
9
used the trends of time-domain and frequency domain fatigue indicators to detect the
OMF.
JASA is a method that uses the trend of amplitude and spectral parameters to
identify four regions of muscle activity. The trend of the parameters is used to
decide whether the muscle experiencing fatigue or just adjusting the muscle force
(Luttmann, Jäger, and Laurig, 2000). Moshou et al. (2005) stated that the JASA was
unable to detect fatigue signal (amplitude increase and spectral decrease) during
dynamic contraction. It is important to note that the authors performed regression
analysis on 3600-second signal. It was contradicted to the findings reported in
Oh, Kim, and Hong (2014). By applying regression analysis on 1200-second signals,
the existence of fatigue signal was detected. These two contradicting findings
highlight the effect of signal length during the regression analysis. Thus, by
performing the segmentation on the sEMG signal, this study was able to observe the
trends of the fatigue indicators and consequently validate the JASA‟s capability in
detecting the OMF region.
The application of JASA in detecting the OMF has been extended to sEMG
signal captured during dynamic as well as small muscle contractions. Currently, it is
a convention to detect the OMF in sEMG signal during static, but not during
dynamic contraction and small muscle contraction. The difficulty to obtain the MVC
value has made the process to determine the OMF for small muscle is impossible.
Without requiring MVC value, this proposed technique had provided an opportunity
to objectively assess muscle fatigue due to small muscle contraction from
handwriting activity.
1.7 Thesis Organisation
This thesis is divided into five chapters: introduction, literature review,
methodology, results, analysis and discussions, and conclusion and future works
recommendation.
10
Chapter 1 starts with brief description about muscle fatigue, the importance
of knowing OMF, and limitations of the current methods in determining the OMF.
The objectives and the scopes of this research are then highlighted. This chapter
ends with the research contributions.
Chapter 2 discusses ideas, facts, and the information related to this study.
This chapter consists of 4 subsections: human muscular system, the principle of
EMG and sEMG, sEMG machines and muscle fatigue detection. In each subsection,
the facts and findings from previous researches are discussed.
Chapter 3 explains in detail the methodology applied in this study. This
chapter is divided into 5 subsections: participants, data acquisition, signal processing,
detection of the OMF, and verification. In the first subsection, the characteristics of
the recruited participants are highlighted. Experimental setup and fatigue exercise
protocols are described in the second subsection. The procedures used to analyse the
signals are elaborated in the third subsection. This subsection also specifies the
filtering and parameter extraction (time domain and frequency domain) processes.
The procedures to determine the OMF is clarified in the fourth subsection. The last
subsection explains the procedures to justify the proposed method.
Chapter 4 presents and discusses the results. The appropriate epoch length
and regression model are reported at the beginning of this chapter. The chapter
continues with the analysis on the performance of the JASA technique in detecting
the OMF. This chapter ends with the discussion on the applicability of the proposed
technique to the different types of muscle contraction.
Chapter 5 concludes the findings of the research. The chapter ends with
some suggestions and strategies for future research works in improving the quality of
the proposed technique.
103
REFERENCES
Adegoke, B. O. A. and Babatunde, F. O. (2007). Effect of an exercise protocol on the
endurance of trunk extensor muscles- A randomized control trial. Hong Kong
Physiotherapy Journal. 25: 2-9.
Al-Mulla, M. R., Sepulveda, F., and Colley, M. (2011). Evolved pseudo-wavelet
function to optimally decompose sEMG for automated classification of
localized muscle fatigue. Medical Engineering & Physics. 33: 411-417.
Alizadehkhaiyat, O., Fisher, A. C., Kemp, G. J., Vishwanathan, K., and Frostick, S.
P. (2011). Shoulder muscle activation and fatigue during a controlled
forceful hand grip task. Journal of Electromyography and Kinesiology. 21:
478-482.
Allison, G. T. and Fujiwara, T. (2002). The relationship between EMG median
frequency and low frequency band amplitude changes at different levels of
muscle capacity. Clinical Biomechanics. 17: 464-469.
Anatomylibrary.US. (2016,September 24). Biceps Muscle Anatomy the Biceps
Brachii Muscle Yoganatomy. Retrieved on April 4, 2017, from
http://www.anatomylibrary.us/biceps-muscle-anatomy/biceps-muscle-
anatomy-the-biceps-brachii-muscle-yoganatomy/
Andrade, A. O., Kyberd, P., and Nasuto, S. J. (2008). The application of the Hilbert
spectrum to the analysis of electromyographic signals. Information Sciences.
178: 2176-2193.
Arabadzhiev, T. I., Dimitrov, G.V., and Dimitrova, N.A. (2005). Simulation analysis
of the performance of a novel high sensitive spectral index for quantifying M-
wave changes during fatigue. Journal of Electromyography and Kinesiology.
15: 149-158.

104
Barandun, M., von Tscharner, V., Meuli-Simmen, C., Bowen, V., and Valderrabano,
V. (2009). Frequency and conduction velocity analysis of the abductor
pollicis brevis muscle during early fatigue. Journal of Electromyography and
Kinesiology. 19: 65-74.
Bilodeau, M., Schindler-Ivens, S., Williams, D. M., Chandran, R., and Sharma, S. S.
(2003). EMG frequency content changes with increasing force and during
fatigue in the quadriceps femoris muscle of men and women. Journal of
Electromyography and Kinesiology. 13: 83-92.
BIOPAC System, Inc. BioNomadix 2CH wireless EMG amplifier. Retrieved on
April 22, 2017, from http://www.biopac.com/product/bionomadix-2ch-
wireless
Bottle, E. and Strutton, P. H. (2012). Relationship between back muscle endurance
and voluntary activation. Journal of Electromyography and Kinesiology. 22:
383-390.
Bouillard, K., Guėvel, A., and Hug, F. (2011). The electromyography fatigue
threshold is not a valid tool to assess muscle function. Journal of
Electromyography and Kinesiology. 21: 229-235.
Böl M., Stark H., and Schilling, N. (2011). On a phenomenological model for fatigue
effects in skeletal muscles. Journal of Theoretical Biology. 281: 122-132.
Bruning, J. L. and Kintz, B. L. (1997). Computational Handbook of Statistics (4th
edition). Addison-Wesley Educational Publishers Inc.
Champagne, A., Descarreaux, M., and Lafond, D. (2009). Comparison between
elderly and young males lumbopelvic extensor muscle endurance assessed
during a clinical isometric back extension test. Journal of Manipulative and
Physiological therapeutics. 32(7): 521-526.
Che Hassan, M. Z., Khalid, P. I., Kamaruddin, N. A., and Ishak, N. A. Derivation of
simple muscle fatigue index for Biceps muscle based on surface
electromyography temporal characteristics. Proceeding of Biomedical
Engineering and Sciences (IECBES), 2014 IEEE Conference. 8-10
December. Miri, Malaysia: IEEE, 662-666.
Chua, Y. P. (2013). Mastering research statistics. Malaysia: Mc Graw Hill
Education; 246-282.
105
Cifrek, M., Medved, V., Tonković, S., and Ostojić, S. (2009). Surface EMG based
muscle fatigue evaluation in biomechanics. Clinical Biomechanics. 24: 327-
340.
Cohen, L. (1966). Generalized phase-space distribution. Journal of Mathematical
Physics. 7(5): 781-786.
Coorevits, P., Danneels, L., Cambier, D., Ramon, H., and Vanderstraeten, G.
(2008a). Assessment of the validity of the Biering-Sørensen test for
measuring back muscle fatigue based on EMG median frequency
characteristics of back and hip muscles. Journal of Electromyography and
Kinesiology. 18(6): 997-1005.
Coorevits, P., Danneels, L., Cambier, D., Ramon, H., Druyts H., Karlsson, J. S., De
Moor, G., and Vanderstraeten, G. (2008b). Correlations between short-time
Fourier- and continuous wavelet transforms in the analysis of localized back
and hip muscle fatigue during isometric contractions. Journal of
Electromyography and Kinesiology. 18: 637-644.
De Luca, C. J. (1997). The use of surface Electromyography in Biomechanics.
Journal of Applied Biomechanics. 13: 135-163.
De Luca, C. J. (2002). Introduction to Surface EMG. Surface Electromyography
Detection and Recording. Delsys Incorporated: 1-10.
De Luca, C. J., Gilmore, L. D., Kuznetsov, M., and Roy, S. H. (2010). Filtering the
surface EMG signal: Movement artifact and baseline noise contamination.
Journal of Biomechanics. 43(8): 1573-1579.
Deffieux, X., Hubeaux, K., Lapeyre, E., Jousse, M., Ismael, S. S., Thoumie, P., and
Amarenco, G. (2006). Perineal neuromuscular fatigue. Annales de
réadaptation et de medicine physique. 49: 413-417.
Delsys, Inc. TrignoTM wireless EMG TrignoTM wireless system and smart sensor.
Retrieved on April 22, 2017, from http://www.delsys.com/product/wireless-
emg/
Dimitrova, N. A. and Dimitrov G. V. (2002). Amplitude-related characteristics of
motor unit and M-wave potentials during fatigue. A simulation study using
literature data on intercellular potential changes in vitro. Journal of
Electromyography and Kinesiology. 12: 339-349.

106
Dimitrov, G. V., Arabadzhiev, T. I., Mileva, K. N., Bowtell, J. L., Crichton, N., and
Dimitrova, N. (2006). A. Muscle fatigue during dynamic contraction assessed
by new spectral indices. Medicine & Science in Sports & Exercise. 38(11):
1971-1979.
Dimitrov, G. V., Arabadzhiev, T. I., Hogrel, J. Y., and Dimitrova, N. A. (2008).
Simulation analysis of interference EMG during fatiguing voluntary
contraction. Part Π- Changes in amplitude and spectral characteristics.
Journal of Electromyography and Kinesiology. 18: 35-43.
Doix, A. M., Gulliksen, A., Brændvik, S. M., and Roeleveld, K. (2013). Fatigue and
muscle activation during submaximal elbow flexion in children with cerebral
palsy. Journal of Electromyography and Kinesiology. 23: 721-726.
Eken, M. M., Dallmeijer, A. J., Houdijk, H., and Doorenbosch, C. A. M. (2013).
Muscle fatigue during repetitive voluntary contraction: A comparison
between children with cerebral palsy, typically developing children and
young healthy adults. Gait & Posture. 38: 962-967.
Emge, N., Prebeg, G., Uygur, M., and Jaric, S. (2013). Effects of muscle fatigue on
grip and load force coordination and performance of manipulation tasks.
Neuroscience Letters. 550: 46-50
Englehart, K., Hudgins, B., Parker, P. A., and Stevenson, M. (1999). Classification of
the myoelectric signal using time-frequency based representations. Medical
Engineering and Physics. 21(6-7): 431-438
Enoka, R. M. and Duchateau, J. (2008). Muscle fatigue: what, why and how it
influences muscle function. The Journal of Physiology. 586(1): 11-23.
Figueiredo, A. C. A., Ferreira, J. S., Coelho, R., and Alves, D. (2008). A signal
processing tool to compute and visualize the Choi-Williams distribution and
the Hilbert-Huang transform of nonstationary signals in fusion research.
Fusion Engineering and Design. 83: 354-257.
Gabriel, D. A. (2011). Effects of monopolar and bipolar electrode configurations on
surface EMG spike analysis. Medical Engineering Physics. 33(9): 1079-
1085.
Gabriel, D. A., Lester, S. M., Lenhardt, S. A., and Cambridge, E. D. J. (2007).
Analysis of surface EMG spike shape across different levels of isometric
force. Journal of Neuroscience Methods. 159: 146-152.

107
Georgakis, A., Stergioulas, L. K., and Giakas, G. (2003). Fatigue analysis of the
surface EMG signal in isometric constant force contractions using the
averaged instantaneous frequency. IEEE Transactions on Biomedical
Engineering. 50(2): 262-265.
González-Izal, M., Rodríguez-Carreño, I., Mallor-Giménez, F., Malanda, A., and
Izquierdo, M. (2009). Wavelet indices to assess muscle fatigue during
dynamic contraction. World Academy of Science, Engineering and
Technology. 3(7): 7-21
González-Izal, M., Malanda, A., Navarro-Amézqueta, I., Gorostiaga, E. M., Mallor,
F., Ibañez, J., and Izquierdo, M. (2010a). EMG spectral indices and muscle
power fatigue during dynamic contractions. Journal of Electromyography
and Kinesiology. 20: 233-240.
González-Izal, M., Malanda, A., Gorostiaga, E., and Izquierdo, M. (2010b).
Electromyographic models to assess muscle fatigue. Journal of
Electromyography and Kinesiology. 22: 501-512.
González-Izal, M., Malanda, A., Gorostiaga, E., and Izquierdo, M. (2012).
Electromyographic models to assess muscle fatigue. Journal of
Electromyography and Kinesiology. 22: 501-512.
Grinsell, D. and Keating, C. P. (2014). Peripheral nerve reconstruction after injury: A
review of clinical and experimental therapies. BioMed Research
International. 2014: 1-13
Hasan, N. A. K. A. K., Kamal, H. M., and Hussein, Z. A. (2016). Relation between
body mass index percentile and muscle strength and endurance. The Egyptian
Journal of Medical Human Genetics. 17(4): 367-372.
Hendrix, C. R., Housh, T. J., Johnson, G. O., Mielke, M., Camic, C. L., Zuniga, J.
M., and Schmidt, R. J. (2009). A new EMG frequency-based fatigue
threshold test. Journal of Neuroscience Methods. 181: 45-51.
Hendrix, C. R., Housh, T. J., Johnson, G.O., Mielke, M., Zuniga, J., Camic, C. L.,
and Schmidt, R. (2010). The effect of epoch length on the electromyography
mean power frequency and amplitude versus time relationship.
Electromyography and Clinical Neurophysiol. 50(5): 219-227.
Henneman E. (1957). Relation between size of neurons and their susceptibility to
discharge. Science. 126: 1345-1346.

108
Hewlett, S., Cockshott, Z., Byron, M., Kitchen, K., Tipler, S., Pope, D., and Hehir,
M. (2005). Patients‟ perceptions of fatigue in Rheumatoid Arthritis:
Overwhelming, uncontrollable, ignored. Arthritis & Rheumatism (Arthritis
Care & Research). 53(5): 697-702.
Hof, A. L. (1997). The relationship between electromyogram and muscle force.
Sportverletz Sportschaden. 11(3): 79-86.
Hostens, I and Ramon, H. (2005). Assessment of muscle fatigue in low level
monotonous task performance during car driving. Journal of
Electromyography and Kinesiology. 15: 266-274.
Huysman, M. A., Hoozemans, M. J. M., van der Beek, A. J., de Looze, M. P., and
vam Dieën, J. H. (2008). Fatigue effects on tracking performance and muscle
activity. Journal of Electromyography and Kinesiology. 18: 410-419.
Jahn, A. (2015). The motor unit. Retrieved on April 22, 2017, from
http://www.muaythaischolar.com/motor-unit/.
Jonkers, I., Nuyens, G., Seghers, J., Nuttin, M., and Spaepen, A. (2004). Muscular
effort in multiple sclerosis patients during powered wheelchair manoeuvres.
Clinical Biomechanics. 19: 929-938.
Julia, F. (2015, Jun 16). UpperLimbs. Retrieved on April 22, 2017, from
http://www.studyblue.com/notes/note/n/upper-limbs/deck/14875964.
Juszka, D. and Papir, Z. (2015). A study on order effect in a subjective experiment
on stereoscopic video quality. 2015 Seventh International Workshop on
Quality of Multimedia Experience (QoMEX). 26-29 May. Greece:IEEE.
Kallenberg, L. A. C. and Hermens, H. J. (2008). Behaviour of a surface EMG based
measure for motor control: Motor unit action potential rate in relation to force
and muscle fatigue. Journal of Electromyography and Kinesiology. 18: 780-
788.
Karlsson, S. and Gerdle, B. (2001). Mean frequency and signal amplitude of the
surface EMG of the quadriceps muscle increase with increasing torque- a
study using the continuous wavelet transform. Journal of Electromyography
and Kinesiology. 11: 131-140.
Konrad P. (2005). The ABC of EMG: A Practical Introduction to Kinesiological
Electromyography. USA: Noraxon Inc.
109
Kumar, D. K., Pah, N. D., and Bradley, A. (2003). Wavelet Analysis of Surface
Electromyography to Determine Muscle Fatigue. IEEE Transactions on
Neural Systems and Rehabilitation Engineering. 11(4): 400-406.
Kushki, A., Schwellnus, H., Ilyas, F., and Chau, T. (2011). Changes in kinetics and
kinematics of handwriting during a prolonged writing task in children with
and without dysgraphia. Research in Developmental Disabilities. 32: 1058-
1064.
Lad, U. P., Satyanarayana, P., Shisode-lad, S., Siri C. C., and Kumari, N. R. (2013).
A study on the correlation between the Body Mass Index (BMI), the body fat
percentage, the handgrip strength, and the handgrip endurance in
underweight, normal weight, and overweight adolescents. Journal of Clinical
& Diagnostic Research. 7(1): 51-54.
Linderman, M., Lebedev, M. A., and Erlichman, J. S. (2009). Recognition of
Handwriting from Electromyography. PloS One. 4(8): 1-8.
Liu, J. Z., Brown, R. W., and Yue, G. H. (2002). A dynamical model of muscle
activation, fatigue and recovery. Biophysical Journal. 82(5): 2344-2359.
Ljubisavljević, M., Milanović, S., Radovanović, S., Vukčević, I., Kostić, V., and
Anastasijević, R. (1996). Central changes in muscle fatigue during sustained
submaximal isometric voluntary contraction as revealed by transcranial
magnetic stimulation. Electroencephalography and Clinical
Neurophysiology. 101: 281-288.
Lorenz, T. and Campello, M. (2012). Biomechanics of Skeletal Muscle. In Nordin,
M. and Frankel, V. H. (Ed.) Basic Biomechanics of the Musculoskeletal
System. Philadelphia: Lippincott Williams & Wilkins. 160-165.
Luttmann, A., Jäger, M., and Laurig, W. (2000). Electromyographical indication of
muscular fatigue in occupational field studies. International Journal of
Industrial Ergonomics. 25: 645-660.
Mansour, A., Riad, W., and Moussa, A. (2010). The occupational fatigue in
anaesthesiologists: Illusion or real? Middle East Journal of Anaesthesiology.
20 (4): 529-534.
Marras, W. S. and Davis, K. G. (2001). A non-MVC EMG normalization technique
for the trunk musculature: Part 1. Method development. Journal of
Electromyography and Kinesiology. 11: 1-9.

110
Marson, R. A. (2011). Study of muscular fatigue by EMG analysis during isometric
exercise. Biosignal and Biorobotics Conference (BRC), 2011 ISSNIP. 6-8
January. Brazil: IEEE. 1-4.
Martini, F., Timmons, M. J., and Tallitsch, R. B. (2009). Human anatomy. San
Francisco: Pearson Benjamin Cummings.
Maton, B. (1981). Human Motor Unit Activity during the Onset of Muscle Fatigue in
Submaximal Isometric Isotonic Contraction. European Journal of Applied
Physiology. 46: 271-281
McKinley, M. and O‟Loughlin, V. D. (2012). Human Anatomy. (3rd edition).
America, New York, NY: The McGraw-Hill Companies, Inc.
Mello, R. G. T., Oliveira, L. F., and Nadal, J. (2007). Digital Butterworth filter for
subtracting noise from low magnitude surface electromyogram. Computer
Methods and Programs in Biomedicine. 87: 28-35.
Mendell, L. M. (2005). The size principle: a rule describing the recruitment of
motoneurons. Journal of Neurophysiology. 93: 3024-3026.
Merletti, R., Rainoldi, A., and Farina, D. (2004). Myoelectric Manifestations of
Muscle Fatigue. In: Merletti, R. & Parker, P. A. ed. Electromyography:
Physiology, Engineering, and Noninvasive Applications. Hoboken, New
Jersey: John Wiley & Sons: 233-258.
Mesin, L., Cescon, C., Gazzoni, M., Merletti, R., and Rainoldi, A. (2009). A bi-
dimensional index for selective assessment of myoelectric manifestations of
peripheral and central muscle fatigue. Journal of Electromyography and
Kinesiology. 19: 851-863.
Mista, C. A., Salomoni, S. E., and Graven-Nielsen, T. (2014). Spatial reorganisation
of muscle activity correlates with change in tangential force variability during
isometric contractions. Journal of Electromyography and Kinesiology. 24:
37-45.
Moshou, D., Hostens, I., Papaioannou, G., and Ramon, H. (2005). Dynamic muscle
fatigue detection using self-organizing maps. Applied Soft Computing. 5: 391-
398.
Müller, R., Strässle, K., and Wirth, B. (2010). Isometric back muscle endurance: An
EMG study on the criterion validity of the Ito test. Journal of
Electromyography and Kinesiology. 20: 845-850.
111
NeuroCare Group. Neuro Prax ® EEG-Bio-Neuro feedback system. Retrieved on
April 21, 2017, from http://www.neurocaregroup.com/neuro_prax_eeg.html.
Nikolaidis, P. T. and Ingebrigtsen, J. (2013). The relationship between body mass
index and physical fitness in adolescent and adult male team handball players.
Indian Journal Physiology Pharmacology. 57(4): 361-371.
Noraxon, U.S.A, Inc. Telemyo 2400T G2. Retrieved on April 21, 2017, from
http://www.noraxon.com.product/emg-electromyography/2400t-g2/.
Nordin, M. and Frankel, V. H. (2012). Basic biomechanics of the musculoskeletal
system. (4th
edition). Philadelphia: Lippincott Williams & Wilkins.
NR Sign Inc. (2017). Monopolar vs Bipolar EMG Readings. Retrieved on April 21,
2017, from http://www.nrsign.com/monopolar-vs-bipolar-emg-readings/
Oda, S. and Kida, N. (2001). Neuromuscular fatigue during maximal concurrent
hand grip and elbow flexion or extension. Journal of Electromyography and
Kinesiology. 11: 281-289.
Oh, K. W., Kim, D., and Hong, D. (2014). Performance evaluation of excavator
control device with EMG-based fatigue analysis. International Journal of
Precision Engineering and Manufacturing. 15(2): 193-199.
Oliveira, A. S. C. and Gonçalves, M. (2009). EMG amplitude and frequency
parameters of muscular activity: Effect of resistance training based on
electromyographic fatigue threshold. Journal of Electromyography and
Kinesiology. 19: 295-303.
Oskoei, M. A. and Hu, H. (2008). Support vector machine-based classification
scheme for myoelectric control applied to upper limb. IEEE Transactions on
Biomedical Engineering. 55(8): 1956-1965.
Parush, S., Pindak, V., Hahn-Markowitz, J., and Mazor-Karsenty, T. (1998). Does
fatigue influence children‟s handwriting performance?. Work. 11(3): 307-313.
Phinyomark, A., Phukpattaranont, P., and Limsakul, C. (2012a). Feature reduction
and selection for EMG signal classification. Expert Systems with
Applications. 39: 7420-7431.
Phinyomark, A., Thongpanja, S., Hu, H., Phukpattaranont, P., and Limsakul, C.
(2012b). The Usefulness of Mean and Median Frequencies in
Electromyography Analysis. In: Naik, G. R. ed. Computational Intelligence
in Electromyography Analysis - A Perspective on Current Applications and
Future Challenges. InTech: 195-220.

112
Pincivero, D. M., Green, R. C., Mark, J. D., and Campy, R. M. (2000). Gender and
muscle differences in EMG amplitude and median frequency, and variability
during maximal voluntary contractions of the quadriceps femoris. Journal of
Electromyography and Kinesiology. 10: 189-196.
Plamondon, R. and Djioua, M. (2006). A multi-level representation paradigm for
handwriting stroke generation. Human Movement Science. 25: 586-607.
Potvin, J. R. and Bent, L. R. (1997). A validation of technique using surface EMG
signals from dynamic contraction to quantify muscle fatigue during repetitive
tasks. Journal of Electromyography and Kinesiology. 7(2): 131-139.
Protrudent.info (2016, July 11). Pictures of muscles of the Human Body. Retrieved
on April 21, 2017, from http://www.protrudent.info/pictures-of-muscles-of-
the-human-body/.
Reaz, M. B. I., Hussain, M. S., and Mohd-Yasin F. (2006). Technique of EMG signal
analysis: detection, processing, classification and application. Biological
Procedures Online. 8(1): 11-35.
Redfern, M. S., Hughes, R. E., and Chaffin, D. B. (1993). High-pass filtering to
remove electrocardiographic interference from torso EMG recordings.
Clinical Biomechanics. 8(1): 44-48.
Roman-Liu, D. and Bartuzi, P. (2013). The influence of wrist posture on the time and
frequency EMG signal measures of forearm muscles. Gait & Posture. 37:
340-344.
Roman-Liu, D. and Konarska, M. (2009). Characteristics of power spectrum density
function of EMG during muscle contraction below 30 % MVC. Journal of
Electromyography and Kinesiology. 19: 864-874.
Roscoe, J. T. (1975). Fundamental Research Statistics for the Behavioural Sciences.
(2nd edition). New York: Holt Rinehart and Winston. 163.
Schilling, J. F., Murphy, J. C., Bonney, J. R., and Thich, J. L. (2013). Effect of core
strength and endurance training on performance in college students:
Randomized pilot study. Journal of Bodywork and Movement Therapies. 17:
278-290.
Sejdić, E., Djurović, I., and Jiang, J. (2009). Time–frequency feature representation
using energy concentration: An overview of recent advances. Digital Signal
Processing. 19: 153-183.

113
Smith, S. W. (1997). The Scientist and Engineer‟s Guide to Digital Signal
Processing. United States: California Technical Publishing: 266.
Soylu A. R. and Arpinar-Avsar, P. (2010). Detection of surface electromyography
recording time interval without muscle fatigue effect for biceps brachii
muscle during maximum voluntary contraction. Journal of Electromyography
and Kinesiology. 20: 773-776.
Stashuk, D. (2001). EMG signal decomposition: how can it be accomplished and
used? Journal of Electromyography and Kinesiology. 151-173.
Stergiou, N. (2004). Innovative analyses of human movement- Analytical tools for
human movement research. Champaign, IL: Human Kinetics.
Subasi, A. and Kiymik, M. K. (2010). Muscle fatigue detection in EMG using time-
frequency methods, ICA and neural networks. Journal of Medical Systems.
34(4): 777-785.
Tett, R. P. and Palmer, C. A. (1997). The validality of handwriting elements in
relation to self-report personality trait measures. Personality and Individual
Differences. 22(1): 11-18.
Tkach, D., Huang, H., and Kuiken, T. A. (2010). Study of stability of time-domain
features for electromyographic pattern recognition. Journal of
NeuroEngineering and Rehabilitation. 7(21): 1-13.
Troiano, A., Naddeo, F., Sosso, E., Camarota, G., Merletti, R., and Mesin L. (2008).
Assessment of force and fatigue in isometric contractions of the upper
trapezius muscle by surface EMG signal and perceived exertion scale. Gait
& Posture. 28: 179-186.
Trontelj, J. V., Jabre, J., and Mihelin, M. (2004). Needle and wire detection
techniques. In Merletti, R. and Parker, P. A. (ed). Electromyography:
Physiology, Engineering, and Noninvasive Applications. Canada: John Wiley
Sons, Inc., Publication: 27-46
Vera-Garcia, F. J., Moreside, J. M., and McGill, S. M. (2010). MVC techniques to
normalize trunk muscle in healthy women. Journal of Electromyography and
Kinesiology. 20: 10-16.
Vøllestad, N. K. (1997). Measurement of human muscle fatigue. Journal of
Neuroscience Methods. 74: 219-227.

114
Williams, D. M., Sharma, S., and Bilodeau, M. (2002). Neuromuscular fatigue of
elbow flexor muscles of dominants and non-dominants arms in healthy
humans. Journal of Electromyography and Kinesiology. 12: 287-294.
Wilson, K. J. W. (1988). Introduction to the body as a whole. In Wilson, K. J. W.
(Ed.) Ross and Wilson Anatomy and Physiology in Health and Illness. (6th
edition). (pp. 2-3). Edinburgh: English Language Book Society.
Young, R., Gutnik, B., Moran, R. W., and Thomson, R. W. (2005). The effect of
effleurage massage in recovery from fatigue in the adductor muscles of the
thumb. Journal of Manipulative and Physiological Therapeutics. 28(9): 696-
701.