Detection of Failure Mechanisms of Tool Steels by means of ...
125
Detection of Failure Mechanisms of Tool Steels by means of Acoustic Emission Technique by Eva Martínez González Supervised by: Dr. Jordi Romeu Garbí A Thesis submitted for the Degree of Doctor of Philosophy of Mechanical Engineering in the Escola Universitària d’Enginyeria Tècnica Industrial de Barcelona, Mechanical Engineering Department Universitat Politècnica de Catalunya (UPC) September, 2013
Transcript of Detection of Failure Mechanisms of Tool Steels by means of ...

Detection of Failure Mechanisms of Tool Steels by means of Acoustic Emission
Technique
by
Eva Martínez González
Supervised by:
Dr. Jordi Romeu Garbí
A Thesis submitted for the
Degree of Doctor of Philosophy of Mechanical Engineering
in the
Escola Universitària d’Enginyeria Tècnica Industrial de Barcelona,
Mechanical Engineering Department
Universitat Politècnica de Catalunya (UPC)
September, 2013

‘In theory, theory and practice are the same
In practice, they are not’
Albert Einstein

I
TABLE OF CONTENTS
Table of contents …………………………………………………………………………
Abstract ………………………………………………………………………………...…
Acknowledgments ………………………………………………………………………..
Glossary of symbols ……………………………………………………………………...
List of figures ……………………………………………………………………………
List of tables ……………………………………………………………………………
Chapter 1: Introduction …………………………………………………………………..
1.1. Introduction …………………………………………………………..…
1.1.1. Fracture mechanisms of cold-work tool steels ………………….
1.1.2. Conventional methods for the failure mechanisms study ……….
1.1.3. Acoustic emission ……………………………………………….
1.1.3.1. Overview ……………………………………………….
1.1.3.2. AE technology …………………………………………
1.1.3.3. Characteristics of AE technology ……………………...
1.2. Research objectives ……..........................................................................
1.3. Justification ……………………………………..….................................
1.4. Thesis overview …………………………………………………………
I
V
VII
IX
XII
XVII
1
1
3
6
8
8
10
12
13
14
15

TABLE OF CONTENTS
II
1.5. References …...………………………………………………………….
Chapter 2: Characterization of tool steels by three-point bending test …………………..
2.1. Introduction ……………………………………………………………..
2.2. Analysis of fracture resistance of tool steels by means of AE ……….....
2.2.1. Introduction ……………………………………………………
2.2.2. Experimental procedure …………………………………………
2.2.2.1. Specimens ……………………………………………...
2.2.2.2. Monitored AE flexion fracture test …………………….
2.2.2.3. Test procedure …………………………………………
2.2.3. Results and discussion ………………………………………….
2.2.4. Conclusions ……………………………………………………
2.2.5. References ……………………………………………………….
2.3. Filtering of acoustic emission signals for the accurate identification of
fracture mechanisms in three–point bending tests ………………………
2.3.1. Introduction ……………………………………………………...
2.3.2. AE sources in the three-point bending test ……………………...
2.3.3. De-noise filtering process ……………………………………….
2.3.4. Method …………………………………………………………..
2.3.4.1. Experimental procedure ……………………………….
2.3.4.2. Specimens ……………………………………………...
2.3.4.3. AE Measurements ………………………………………...
2.3.5. Results and discussion …………………………………………
2.3.6. Conclusions ……………………………………………………...
2.3.7. References ……………………………………………………….
16
19
19
22
22
22
22
23
24
25
29
30
31
31
33
35
38
39
39
40
41
47
48

TABLE OF CONTENTS
III
2.4. Discrimination of fracture phenomena by means of AE ……………….
2.4.1. Introduction ……………………………………………………..
2.4.2. Experimental procedure ……………………………………….
2.4.2.1. Materials …………………………………….
2.4.2.2. Specimens ……………………………………………...
2.4.2.3. Microstructural inspection and fracture tests …………
2.4.2.4. AE monitoring …………………………………………
2.4.2.5. AE noise signals ……………………………………….
2.4.2.6. Analysis of AE waveforms ……………………………..
2.4.3. Results …………………………………………………………...
2.4.3.1. Microstructural analysis…………….
2.4.3.2. Identification of characteristic AE signal patterns in
bending test of 1.2379 under monotonic loading ……...
2.4.3.3. Relationship between AE signals and micro-damage
during bending tests of 1.2379 under monotonic
loading …………………………………………………
2.4.3.4. Relationship between AE signals and micro-damage
during bending tests of HWS under monotonic loading .
2.4.4. Discussion ……………………………………………………….
2.4.5. Conclusions ……………………………………………………...
2.4.6. References ……………………………………………………….
Chapter 3: Damage induced by spherical indentation test and detected by AET ….........
3.1. Introduction …………………………………………………………..
3.2. Spherical indentation …………………………………………………
51
51
51
51
52
53
54
55
56
56
56
57
59
62
65
67
68
69
69
72
TABLE OF CONTENTS
IV
3.3. Experimental method …………………………………………………
3.3.1. Materials ………………………………………………………
3.3.2. Specimens …………………………………………………….
3.3.3. Spherical indentation …………………………………………
3.3.4. Acoustic emission …………………………………………….
3.3.5. Filtering noises ………………………………………………..
3.4. Results and discussion ………………………………………………..
3.4.1. Damage induced by spherical indentation ……………………
3.4.2. Acoustic emission results …………………………………….
3.5. Conclusions …………………………………………………………..
3.6. References ……………………………………………………………
Chapter 4: Conclusions and contributions ……………………………………………….
4.1. Conclusions …………………………………………………………..
4.2. Contributions …………………………………………………………
Chapter 5: Future developments …………………………………………………………
5.1. Future developments directly related with the presented research …....
5.2. Other future developments ……………………..……………………...
5.2.1. Incipient cracks in gear teeth …………………………………
5.2.2. Biomaterials…………………………………………………….
74
74
76
76
77
78
79
79
80
87
88
93
93
94
97
97
101
101
102

V
ABSTRACT
This thesis is focused on the calibration of the Acoustic Emission (AE) technique to detect
and identify damage mechanisms in tool steels. The AE measurement procedure has been
calibrated for two mechanical tests: fracture test (three-point bending test) and indentation test
(spherical indentation).
Fracture tests cause cracks due to tensile stress. The damage begins with the nucleation of
cracks (cracking carbides and local plastic deformation) and afterwards, the cracks spread
through the metallic matrix following the broken carbides. This research proposes a filtering
process to detect each stage of fracture: the cracking of carbides (nucleation), the stage where the
crack passes through to the steel matrix and final catastrophic failure.
Spherical indentation tests enable the creation of a more complex distribution of stresses in an
affected part of the specimen. Applying low level loads, an elastic field was created in the
specimen under the ball indenter. Nevertheless, AE activity was detected in this elastic field, and
these signals were related to the breaking of carbides located in the zone of maximum shear
stress. An important feature of this test is that the cracking of carbides takes place without plastic
deformation, and therefore the damage signals were clearly identified with carbide breakage.
ABSTRACT
VI
In both tests, carbide breakage was confirmed by means of AE as the cause of nucleation of
cracks in tool steels. AE made it possible to identify the carbide breakage and the propagation of
cracks through the metallic matrix and predict the final fracture of the specimen in bending tests.
This thesis proposes a new acquisition and filtering configuration in fracture tests to eliminate
spurious signals due to contact damage between the specimen and machine supports, as a
methodology for identifying different damage mechanisms in small-sized specimens based on
certain AE waveform features. From the standpoint of research into materials, coupling the
proposed AE setup in each test significantly improves the tests, since it permits the evolution of
the damage to be identified during the loading cycle. The laboratory results obtained endorse the
possible use of AE in preventive maintenance in the tool-shaping industry.

VII
ACKNOWLEDGMENTS
Firstly, I would like to express my gratitude to Dr. Jordi Romeu, director of my thesis and
chief of the Laboratori of Acoustic and Mechanical Engineering (LEAM), for his continued
support and help in the fulfillment and finalization of this research work. Your insistence and
encouragement have been essential during this time, and I thank you for your never-ending
knowledge, motivation and attention. I appreciate that a few years ago you invited me to be part
of your research group. Thank you for all the conversations that we have had, they always helped
me to see another point of view.
I would also like to acknowledge the CTM (Technological Center of Materials) the
opportunity to work in their facilities. And especially to the people I have had the pleasure to
work with. I would like to express my gratitude to Dr. Daniel Casellas, chief of the Materials
Technology Area at the CTM for his trust in me and in the Acoustic Emission technique. I would
like to thank my colleagues in experimentation at the CTM, with very different scaled points of
view: ‘nano’ in case of Nuria Cuadrado, ‘micro’ of Dra. Giselle Ramirez and ‘macro’ of Dra.
Ingrid Picas. Notably, I would thank novel Dra. Ingrid Picas, who spent with me most of the
hours in the lab. We shared the hardest moments of experimentation, those in which the hours
pass without any results, and the best moments when we understood the ‘talk’ of carbides.

ACKNOWLEDGMENTS
VIII
I appreciate José Martínez Jecquier of NDT Ingenieros S.A. for the conversations about
acoustic emission and the required equipment. Thank you for your time, patient and support
whenever I need them. Also, I would like to express my gratitude to Dr. Adrian Pollock of
Mistras Group, who responded to an unusual request, who helped me in a bad moment and
shared with me his passion for acoustic emission. Thank you for taking time to help me and tell
me who is who in the small family of AE.
I want to thank my fellows of the EUETIB, with whom I share my day to day. They always
encouraged me to advance with the thesis listening to me in my bad and good moments.
Finally, I would like to thank all those numerous people, whose names are not mentioned, but
whose support is greatly appreciated. All these people alien to my professional world that now
they know what Acoustic Emission is.
Sincere thanks to all of you,
Eva Martinez

IX
GLOSSARY OF SYMBOLS
a Radius of contact between ball indenter and specimen in spherical indentation test
A Amplitude
AE Acoustic emission
AET Acoustic emission technique
AHSS Advanced high strength steels
AFi,j(k) Average amplitude in the frequency domain of the signal, where i where i is related
with the time segment, j with the origin of the source and k defines the frequency
segment.
AR Aspect ratio
ARi Amplitude ratio i, is the ratio of AT2,j to AT3,j
ATi,j Average amplitude in the time domain of signals, where i where i is related with the
time segment and j with the origin of the source.
CLSM Confocal laser scanning microscope
CM Confocal microscope
CNTS Counts
D Duration
Dmax Maximum diameter

GLOSSARY OF SYMBOLS
X
Dmin Minimum diameter
DDT Duration discrimination time
DT Destructive testing
E Young’s modulus
ECD Equivalent diameter
En Energy
f Frequency
Feα Alpha iron or ferrite
Fe3C Iron carbide or cementite
FHCDT First hit discrimination time
Hi,j Refers to a classification of the signals, where i is related with the time segment and j
with the origin of the source.
HRC Hardness Rockwell C
HV1 Hardness Vickers
k Define the frequency segment of a signal
K1C Fracture toughness of carbides
LEFM Linear elastic fracture mechanism
NDT Non-destructive testing
OM Optical microscope
p Indentation stress
p0 Mean contact pressure
pγ Indentation stress that generate plastic deformation
P Load
Pc Critical load

GLOSSARY OF SYMBOLS
XI
Pγ Load at yield point
PM Powder metallurgy
r0 Radius of circular cracks in spherical indentation test
R Indenter ball radius
ReT Rearm time
RMS Root mean square
RT Rise Time
S1 Sensor 1
S2 Sensor 2
S3 Sensor 3
SBRj Spectral Bands Ratio i, is the ratio of AFi,j(1) to AFi,j(2) for i=1
SF Shape factor
t Time
Thr Threshold
TSi Time segment i
wt% Weight percent
ε Strain
σ Applied normal stress
σR Bending strength
σRC Carbide tensile fracture stress
τ Applied shear stress
τRC Carbide shear fracture stress
υ Poisson’s ratio
ψ Sphericity
XII
LIST OF FIGURES
Figure 1.1. Schematic representation of a tool steel fracture: (a) schema of the material
composition (carbides embedded in the metallic matrix), (b) cleavage of a carbide, (c) and (d)
crack of more carbide, (e) propagation of a crack in the metallic matrix following the cracked
carbides and (f) final fracture of the specimen. ……………………………………………….. 4
Figure 1.2. Schematic representation of: (a) intergranular and (b) transgranular cracks. ……. 5
Figure 1.3. Schematic principle of AE wave detection: 1. Stimulus; 2. Growing discontinuity
(AE source); 3. Structure or specimen; 4. AE waves; 5. AE transducer; 6. Pre-amplifier; 7.
Output signal. ……………………………………………………………………………….... 11
Figure 2.2.1. Diagram of the experimental setup (three-point bending test). ………….…..... 24
Figure 2.2.2. Bending test results, steel DIN 1.239. Blue line: stress vs. time; red points: EA
signals vs. time. ......................................................................................................................... 25
Figure 2.2.3. Bending test results, steel UNIVERSAL. Blue line: stress vs. time; red points: EA
signals vs. time. ………………………………………………………………………………. 25
Figure 2.2.4. Example of broken carbides observed by means of CM in the tensile stressed
surface of DIN 1.2379 specimens. …………………………………………………………... 27

LIST OF FIGURES
XIII
Figure 2.2.5. Example of broken carbides observed by means of CM in the tensile stressed
surface of UNIVERSAL specimens. ……………………………………………………...…. 27
Figure 2.2.6. Broken carbides, plastically deformed areas and small cracks in the matrix can be
identified by means of CM in the tensile stressed surface of specimens: (a) DIN 1.2379 at stress
of 2100 MPa and (b) UNIVERSAL at 2800 MPa. …………………………………………... 28
Figure 2.3.1. AE signal features. …………………………………………………………..… 32
Figure 2.3.2. Experimental setup of the three-point bending test: (a) Image of the mounted
specimen and (b) schematic setup. ………………………………………………………...… 33
Figure 2.3.3. Measured signal waveform with time segment definition. …………………… 36
Figure 2.3.4. Block diagram of the analysis of acquired data. ………………………………. 38
Figure 2.3.5. SBRj vs AT1,j crossplot, classified for each zone, during the three-point bending test
for two steels: (a) DIN 1.2379 and (b) DIN 55Cr3. ………………………………………….. 42
Figure 2.3.6. (a) SBRj vs AT1,j crossplot with applied filter for DIN 1.2379 specimen (Green hits
originated in zone I, yellow in zone II and red in zone III during the three-point bending test) and
(b) cumulative hits during the bending test comparing raw data without filtering (n-line) with
filtered data (l-line). ……………………………………………………………………….... 43
Figure 2.3.7. Microscope images of the maximum tensile surface (a) at 790 MPa without
breakage of carbides and (b) at 900 MPa applied stress. …………………………………….. 44
Figure 2.3.8. (a) Cumulative hits during the bending test comparing raw data without filtering
(n-line) with filtered data (l-line) and (b) amplified detail of figure (a). …………………... 45
Figure 2.3.9. Confocal images of the contact surface of some DIN 1.2379 specimens at rod
contact area: (a) practically non-existent damage in specimen P3, (b) specimen-P4 presents some
damage (c) and (d) specimen-P2 presents severe damage and low damage in each rod
respectively. ………………………………………………………………………………….. 46

LIST OF FIGURES
XIV
Figure 2.3.10. Cumulative hits originating in zones II and III and maximum stress during a
three-point bending test of DIN 1.2379 specimens: (a) specimen P3 (practically non-existent
damage) and (b) specimen P2 with different damage severity in the contact with lower rolling
supports. …………………………………………………………………………………….... 47
Figure 2.4.1. Schema of the samples used in this study. ……………………………………. 53
Figure 2.4.2. (a) Stepwise loading to final fracture of the sample, σR. (b) Schema of the
micrographically inspected zone of samples. ………………………………………………... 54
Figure 2.4.3. Experimental set-up for the AE monitored bending test. …………………...… 55
Figure 2.4.4. (a) Waveform produced by a Hsu-Nielsen source (when the graphite enclosed in a
lead pencil breaks). (b) Zoom of the initial cycles of this artificial source. …………………. 56
Figure 2.4.5. Microstructure of the studied tool steels: (a) 1.2379 and (b) HWS. …………... 57
Figure 2.4.6. Cumulated number of hits in function of the stress applied during the bending test
and the location of the signals at the sample surface (the x axis (X-Loc.) refers to the position of
the signal with respect to the center of the specimen, the y axis refers to the applied stress and the
z axis to the cumulated number of registered hits). ………………………………………….. 58
Figure 2.4.7. (a) Number of hits vs. peak frequency (Fmax) for the two signals registered; (b)
Cumulated number of hits vs applied stress during a monotonic bending test in which two
different types of AE signals could be identified. ………………………………………….... 59
Figure 2.4.8. Applied stress and AE signal results (in terms of the cumulated number of hits) of
monotonic stepwise tests in 1.2379 vs time. (a) 800 MPa. (b) 2200 MPa and (c) 2600 MPa. .. 61
Figure 2.4.9. Images of the micro-structure of 1.2379: (a) 800 MPa, (b)-(c) 2200 MPa and (d)
2600 MPa. ……………………………………………………………………………………. 62
Figure 2.4.10. Applied stress and AE signal results (in terms of the cumulated number of hits) of
monotonic stepwise tests in HWS vs. time: (a) 3300 MPa and (b) 4100 MPa. ……………… 63

LIST OF FIGURES
XV
Figure 2.4.11. Images of the microstructure of HWS: (a) loaded at 3300 MPa, and (b)-(c) loaded
until 4100 MPa. ………………………………………………………………………………. 64
Figure 3.1. Hertzian contact of sphere on flat specimen. Deformations are exaggerated for
clarity. a is the contact radius, r0 is the crack radius at the surface of the specimen, R is the radius
of the ball indenter and P is the indentation load. ………………………………………….... 73
Figure 3.2. Schematic of the evolution in the deformed zone under the indentation for: (a) p0 =
pγ, (b) p0 > pγ and (c) p0 >> pγ. ……………………………………………………………….. 74
Figure 3.3. Backscatter diffraction images showing the carbides identified in the
microstructure. ……………………………………………………………………………….. 75
Figure 3.4. Schematic diagram for spherical indentation test. ………………………………. 78
Figure 3.5. Spherical indentation stress-strain curve for plastic transition.Figure 3.6. Remnant
indentation depth profiles and imprints in cold work tool steel. Specimens sputter-coated with
gold. ………………………………………………………………………………………….. 79
Figure 3.7. Waveforms and FFT of different events: (a) an event during loading, (b) an event
during unloading the specimen and (c) continuous type signals that appear when the load
exceeds the elastic field; these signals are related with plastic deformation. ………………... 81
Figure 3.8. Indentations Pmax = 3000N. (a) Indentation 3B (b) Indentation 5B. Green points
correspond to sensor 1 (S1) and red points to sensor 2 (S2). ……………………………….... 83
Figure 3.9. Indentations Pmax = 5000N. (a) Specimen 7A (b) Specimen 8A. Green points
correspond to sensor 1 (S1) and red points to sensor 2 (S2). ……………………………….... 84
Figure 3.10. Schematic deformation-microfracture damage in tool steel. The volume element is
subjected to compressive stress –σ1 and –σ3 along the contact axis below the spherical indenter.
The shear stresses (arrows) initiate the breakage of carbides. ……………………………….. 85
Figure 3.11. Images of the microstructure of the indented plane up to 3000 N (indentation 5B):
(a) White carbides correspond to M7C3 and (b) darker ones to MC. ……………………….... 87
LIST OF FIGURES
XVI
Figure 5.1. Cumulative AE counts vs. fatigue cycles during the fatigue three-bending test. .. 99
Figure 5.2. (a) Micro-indentation test monitored by means of AE and (b) Nano-indentation test
by means of AE. ……………………………………………………………………………... 100
Figure 5.3. Some pictures of a laboratory punch monitored by means of AE. …………….. 100
Figure 5.4. (a) Simulated fatigue crack in the tooth of gear, (b) fatigue crack in the tooth due to a
test and (c) set-up configuration of the fatigue tests with gear teeth monitored by AE. ….... 102
Figure 5.5. (a) Tested coupons, (b) real strain vs. stress of a coupon, (c) tensile test of a pork rib
monitored by acoustic emission and (d) detail of the AE sensors attached to the rib. …..…. 103

XVII
LIST OF TABLES
Table 2.2.1. Chemical and mechanical properties of DIN1.2379 and UNIVERSAL. …….... 23
Table 2.3.1. Chemical and mechanical properties of DIN1.2379 and 55Cr3. …………….... 40
Table 2.3.2. Acquisition and post-processing parameters. …………………………………... 41
Table 2.4.1. Main allowing elements in the chemical composition of DIN1.2379 and HWS (in
weight percent %). ………………………………………………………………………….... 52
Table 2.4.2. Heat treatment applied to the studied materials and obtained hardness, bending
strength (σR) and fracture toughness (K1C). ………………………………………………….. 52
Table 3.1. Main alloying elements in the chemical composition of the studied steel (in weight
percent %). ………………………………………………………………………………….... 74
Table 3.2. Mean carbides size and geometry in terms of ECD, Dmin, Dmax, AR, ψ and SF. …. 76
Table 3.3. Load and stress values at which AE burst signals appears for four indentations up to
3000 N and four up to 5000 N. ………………………………………………………………. 82
Table 3.4. Fracture stress of carbides: tensile fracture stress (σRC) and shear fracture stress (τRC).
……………………………………………………………………………………………….... 86


1
Chapter 1: Introduction and overview
1.1. Introduction
Tool steels are widely used in the manufacture of tools for punching, cutting, shaping,
stamping, cold extruding, etc. These are repeatedly subjected to high stress during service. These
steels must exhibit very high strength, hardness and wear resistance. These properties are
antagonistic with high fracture resistance or toughness. Thus, tool steels are very sensitive to
fracture if stresses during service or manufacture exceed those which the microstructure can
support.
Hardness
Tool steels are, in general, high carbon content steels that are hardened by heat treatment
consisting of quenching and tempering. Higher steel hardness is obtained by quenching in the
martensite phase, which is a supersaturated solution of alpha-iron (Feα). They are usually alloyed
with other elements to improve their mechanical properties. In the quenching treatment the
alloyed elements form carbides [1-3].

Chapter 1
2
Carbides are very hard substances embedded in the mass of the steel in form of precipitations.
The presence of carbides in the steel structure is ensured when the content of dissolved carbon in
austenite increases above the required solubility limit for subsequently forming enough
martensite during the hardening treatment. The supersaturated carbon solution diffuses to form
other carbides during tempering. By adding alloying elements such as chromium, molybdenum,
vanadium, tungsten, titanium, etc., the iron carbide (Fe3C) is transformed into other harder
carbides. The level of hardness depends on the nature of the carbides present.
Wear resistance
Another important feature of tools is the period of time during which their working parts are
maintained in good condition. Therefore, it is crucial to delay the progressive wear of tools in
service. Wear resistance is a difficult phenomenon to analyze given the large number of
influencing factors, for example:
− the amount of carbides present in the steel structure,
− hardness after quenching and tempering,
− the type of friction (dry or wet) between the tool and the material being worked,
− the frictional coefficient between both materials,
− the distribution, hardness, shape and volume of carbides.
Toughness
Toughness means the ability of the material to absorb energy and undergo plastic deformation
without fracturing. This energy, in the case of tools, has to be compensated more elastically than
plastically, to prevent permanent deformations. This accuracy means that heavy-duty tools have
a higher yield point if they have to work under important loads.

Introduction and Overview
3
The toughness depends on the structure and chemical composition of the steel. A high carbon
content and a large amount of carbides implies high hardness and wear resistance, but
significantly reduces toughness after heat treatment.
1.1.1. Fracture mechanisms of cold-work tool steels
Material fracture is the separation of the solid into two or more parts. Tool steels are very
sensitive to fracture if the stresses exceed those which the microstructure can endure. The
fracture process can be divided into three stages:
i) crack formation (nucleation),
ii) crack growth (propagation) and
iii) final fracture.
The fracture can be ductile or fragile. Both are produced when the stress exceeds the
maximum resistance of the material, but the damage mechanisms occurring prior to the fracture
are different. Normally, the fractured surfaces show a combined ductile and brittle fracture.
A ductile fracture is characterized by generalized plastic deformation preceding the final
fracture. The cracks advance slowly while the applied stress is increased (established cracks).
Some of the energy from stress concentrations at the crack tips is dissipated by plastic
deformation before the crack propagates. Due to that, this fracture presents great energy
absorption. By contrast, brittle fracture is characterized by rapid crack propagation without any
appreciable plastic flow previous to fracture and the energy absorption is very scant.
A ductile fracture is a strain-controlled fracture that occurs due to the deformation-induced
nucleation and growth of micro-voids around the hard particles. The ductile fracture resistance of

Chapter 1
4
tool steels tends to be low due to the high hardness of the martensitic matrix obtained during the
heat treatment and the large density of carbides, as is stated above, are very hard and brittle
particles built into the tool steel microstructure. Operating loads within the recommended limits
and below the proportional tensile or shear strength of properly process tool steels do not initiate
ductile fracture. However, factors such as overloads, stress concentrations, surface flaws or the
non-uniform distributions of coarse carbides may significantly reduce the resistance of a tool
steel and this type of fracture can appear.
A brittle fracture is a stress-controlled fracture that occurs with little or no plastic
deformation. Frequently, the stresses that cause a brittle fracture are well below those expected
to form ultimate tensile strengths. A brittle fracture may be initiated by cleavage cracks in the
hard particles or in their boundaries, which in turn lead to unstable cleavage crack propagation in
matrix structures with low toughness (Figure 1.1).
Figure 1.1. Schematic representation of a tool steel fracture: (a) schema of the material composition
(carbides embedded in the metallic matrix), (b) cleavage of a carbide, (c) and (d) cracks of more carbides,
(e) propagation of a crack in the metallic matrix following the cracked carbides and (f) final fracture of
the specimen.
(a) (b) (c)
(d) (e) (f)

Introduction and Overview
5
Moreover, polycrystalline metal fractures may be transgranular or intergranular (Figure 1.2),
depending on whether the crack propagates through the grains or follows their boundaries [4].
Figure 1.2. Schematic representation of: (a) an intergranular crack and (b) a transgranular crack.
Intergranular fractures are related to the size of the grains, with phosphorous segregation on
the austenitic crystals boundaries and precipitation of cementite in the grain boundaries. Thus, in
the heat treatment it is desirable to obtain a fine grain austenitic matrix and a homogeneous
dispersion of carbides. In tool steels, and other high carbon steels, the most common mechanism
of brittle fracture is intergranular cracking along the austenitic grain boundaries initiated in the
broken carbide or in its decohesion (Figure 1.2(a)).
Therefore, the fracture resistance of these materials is related to the size of the dispersed
particles in the martensitic matrix. Two types of particles which influence the fracture are:
carbides and inclusions (nonmetallic elements that are introduced into the steelmaking process).
Their large size, high densities or non-homogeneous distribution contribute to premature failure
of the tools. The size and shape of these particles also play an important role in resistance, for
example, elongated particles or flattened shapes introduce anisotropy into the properties of steel
[5,6]. Likewise, irregular shapes can act as stress concentrators.
(a) (b)

Chapter 1
6
1.1.2. Conventional methods for the failure mechanisms study
To improve the mechanical performance of materials and components a study of fracture
mechanics is important. With this aim, several mechanical tests can be performed. These tests
are classified into Destructive Tests (DT)) and Non-Destructive Tests (NDT), depending on
whether the specimen is modified or not during the test, respectively. Normally, both are
required in combination for the study of a material.
Some of the most common NDT are listed below with their limitations [7]:
− Visual inspection, microscopy and surface analysis. It can be relatively easy to apply if the
expected defect is on the previously polished surface of the specimen. But it is more difficult
when the flaw is inside the specimen, and this must be cut so that the flaw appears on the
new free surface.
− Liquid penetrants: This technique reveals discontinuities open to the surfaces of solid and
nonporous materials. Indications of a wide variety of discontinuity sizes can be found
regardless of the configuration of the test object and regardless of the discontinuity
orientation. The liquid penetrants seep into various types of minute surface openings by
capillary action. The cavities of interest may be very small and often invisible to the naked
eye.
− Electromagnetic methods based on the electromagnetic properties of a material. These
techniques are widely used for identification or differentiation purposes in a wide variety of
physical, structural and metallurgical conditions in electrically-conductive ferromagnetic
and non-ferromagnetic metals.
− Radiographic Testing. This is based on the test object’s attenuation of penetrating radiation
– either electromagnetic radiation with a very short wavelength or particulate radiation (X-

Introduction and Overview
7
rays, gamma rays and neutrons). Different portions of an object absorb different amounts of
penetrating radiation due to differences in density and variations in the thickness of the test
object with differences in absorption characteristics caused by variation in composition. This
variation in the attenuation of the penetrating radiation can be monitored by detecting the
nonattenuated radiation that passes through the object. It is a very costly inspection method.
− Ultrasonic testing. In this technique ultrasonic wave beams are introduced into a material for
the detection of surface and subsurface discontinuities. These waves travel through the
material with some energy loss (attenuation) and are reflected and refracted at the interfaces.
The echoes are then analyzed to define and locate discontinuities.
All these methods can be combined with destructive testing to inspect the damage occurring
in the material. Depending on the mechanical test and inspection method, two situations can
arise:
a) The specimen must be modified to inspect and evaluate the damage. In this case, only the
final flaw can be evaluated but not its evolution.
b) The specimen can be inspected without being destroyed (for example, for surface flaws or
using techniques that allow the interior of the material to be inspected). In this case, it is
possible to load the specimen, stop the test, evaluate the damage generated and re-load it
again to repeat the strategy as often as necessary to ascertain the evolution of the flaws during
the test. Obviously, it is a long and arduous process.
Another NDT method which is not as common is the Acoustic Emission (AE) method. It is
based on the detection of stress waves produced by sudden internal changes in stressed materials.
The sudden movement generates waves that radiate out into the test object and can be detected
on the surface of the specimen. This technique is ideally applied during a controlled loading test

Chapter 1
8
since the increasing flaws are the source of the stress waves; thus it is possible to identify the
flaws in the sites where they are produced.
1.1.3. Acoustic Emission
1.1.3.1. Overview
In many technical articles or commercial presentations, AE is described as a new technique.
In actual fact, very few technologies can be advertised as “new”, and most of them have been
known and used since ancient times in a primeval state. The novelty probably lies in the increase
in present knowledge, the way in which these technique are applied or the areas in which they
are actually used. This is the case of AE, which is apparently a new emerging technique within
NDT. But it has been used and known since the earliest civilizations which used it as a
forecasting tool. It is logical, since many natural phenomena are audible; for example, water in
freezing, earthquakes or a broken branch, etc. Probably, one of the first practical uses of AE was
made by pottery makers to assess the structural stability of ceramic pieces, paying attention to
the sounds emitted during the cooling process in the even.
The first documented observation of AE in metal was during twinning of pure tin as early as
2600 b.C. The first text documenting this phenomenon was written by the Arabian philosopher
and alchemist Abu Musa Yabir al-Sufi Hayyan (721-815 a.C.); his latinized name was Gerber.
His publication describes that tin (Jupiter) emits a loud noise, and he also described iron (Mars)
as “sounding much” during forging [8].
Historic texts exhibit many references and observations of this phenomenon, but the first
modern technique studies date from 1950, when the German engineer Joseph Kaiser presented
his thesis at Munich University [9]. He studied the sounds produced in metallic materials

Introduction and Overview
9
submitted to tension. In his thesis, he presented the work now known as “Kaiser Effect” [10], a
fundamental principle in the study of damage to materials. Since then, different works, studies
and publications have been written due to the large number of applications and situations
permitting the use of this technique. Between 1960 and 1980, despite equipment limitations,
several pioneer researchers such as Dunegan [11], Pollock, Wadley, Scruby, Birchon, Schofield,
Beattlie, Proctor, Harris and Ono issued considerable scientific production in order to make
progress in this field [12]. Some of them, who are currently still active, are members of working
groups on AE and specialized journal editors. The works that they have written are currently
being revised due improved equipment which permits the forwarding and validation of the
previous theories.
But it is from the late 1990s that AE was reborn through the emergence of a number of
interesting research studies in this field from different areas. The growing interest in AE is due,
in part, to the significant advances that have taken place in microelectronics and computer-
assisted analysis techniques in recent years. Powerful storage technologies and the analysis of
big data are necessary.
There are several lines of research related to AE with important scientific production. On
reviewing the technical publications of recent years, interest is distributed into the following
areas:
− Development of sensors, equipment and acquisition systems.
− Research and application of AE in the study of materials (metals, polymers, composites,
ceramics, construction materials, biomaterials, etc.)
− Search for new applications and the adequacy of their techniques: biomedical engineering,
medical diagnosis of certain conditions, etc.

Chapter 1
10
− Large structures: bridges, railway structures, pressure vessels, etc.
− Study of AE waves.
− Application of AE as a preventive maintenance tool in machines or in their elements.
1.1.3.2. The AE technology
The term ‘acoustic emission’ is used to define both a physical phenomenon and an NDT
technology. AE is commonly defined as transient elastic waves produced by a sudden
redistribution of stress within in a material [13]. When a structure is subjected to an extreme
external stimulus (change in pressure, load, temperature, etc.), internal modifications take place
(such as the growth of cracks, local plastic deformation, corrosion, phase transformations, etc.).
These sources (events) release energy in the form of stress waves into the material, which then
propagates as an elastic wave through the material.
For instance, if a pencil is slightly submitted to bending until fracture, the fracture of wood
fibers can be perfectly heard. The noise is caused by the stress waves that propagate through
wood and air. In this case, the waves are generated at frequencies within the audible range. There
are some even less audible acoustic emission examples, such as wood fracture, ice cracking,
tearing of paper, etc. Normally, AE signals are inaudible. Rapid stress-releasing events generate
a spectrum of stress waves starting at 0 Hz which usually fall off at several MHz. The most
interesting sources released energy of between 1 kHz and 1 MHz [14].
AE or AET (Acoustic Emission Technique) such as NDT is based in this phenomenon. In this
test, waves generated by an AE source are detected by means of the appropriate sensors attached
to the surface that convert the surface movements into electrical signals. With the right

Introduction and Overview
11
equipment and setup, motions with the accuracy of picometers (10 -12 pm) can be detected.
Figure 1.3 shows a schematic principle of the technique.
Figure 1.3. Schematic principle of AE wave detection: 1. Stimulus; 2. Growing discontinuity (AE
source); 3. Structure or specimen; 4. AE waves; 5. AE transducer; 6. Pre-amplifier; 7. Output signal.
The three major uses of the AE technique are: i) source location, ii) characterizing of
materials (mechanical performance and damage evaluation) and iii) health monitoring of
structures and machines [15-18].
AE can be related to an irreversible release of energy and it can also be generated from
sources not involving material failure, including friction, cavitations and impact.
Other NDT (radiography, ultrasounds, eddy currents, etc.) detect geometrical discontinuities,
introducing some form of energy into the studied structure. In contrast, in AE the self-generating
flaws emit stress waves that can be detected at a certain distance by the appropriate sensors, and
the characteristics of the acquired signals are useful evaluating the damage that is occurring
within the material.

Chapter 1
12
1.1.3.3. Characteristics of the AE technology
The principal characteristics of the AET are as follows:
− It is a ‘passive’ technique; the flaw itself generates the AE wave that can be detected. One of
the most advantages of AE is this point, since it permits the test to be executed with
minimum effects on the service of the studied part, since no energy is introduced into the
system.
− It detects distant AE sources; the maximum distance depends on the material properties.
− It is sensible to the growth of flaws and changes in the material structure, instead of the
presence of geometric flaws.
− It is non-invasive.
− It can be applied during service.
− It permits the location of growing discontinuity.
And the main limitations of the technique are:
− As the flaw itself generates the AE signals, their intensity cannot be controlled and the test is
unrepeatable.
− Stable discontinuities do not generate AE signals, and so they are undetected by AET.
− Some materials do not emit AE when the previous load applied is exceeded; this is an
important phenomenon known as the Kaiser Effect [9-10].
− This method is very sensitive to process noises; before attempting an AE test it is essential to
eliminate the unwanted signals.

Introduction and Overview
13
1.2. Research objectives
The main objective of this thesis is to calibrate the methodology for detecting initiation and
propagation damage and cracks in tool steel specimens by means of AE. For the purpose of
adapting the AE technique to the study of mechanical behavior in tool steels, the cracks in the
specimens are induced by two loading conditions using: i) fracture (three-point bending) tests
and ii) spherical indentation tests. Both are normal mechanical tests for the study of fragile
materials. AE must be useful in detecting initial damage in the specimen and the critical damage
stage that provokes its fracture. This main objective is based on some partial objectives referred
in the following paragraphs.
An obstacle for the successful and regular use of the AE method in mechanical tests is noise
discrimination. The working conditions of the test machines produce AE signals that are not
related to the degradation of the specimen but they are detected by the AE equipment. Unwanted
noise, which is associated with the moving parts of the machines and the hydraulic loading
system of the test machines, must be systematically distinguished from sounds associated with
specimen damage.
A second difficulty that must be resolved in this thesis is related to the small dimensions of
the specimens. The mechanical tests are performed with very small specimens due to the high
resistance of the studied materials, where the location AE techniques and the discrimination of
the signals are confused due to the quasi-instant quantity of wave reflections that are added to the
signal. The thesis proposes a methodology for acquiring and analyzing the signals that
minimizes the effects of the waveform distortions.
Chapter 1
14
The results reported in this research will provide a technical basis for the effectiveness of the
AE method as a complementary diagnosis method during the laboratory testing of these tool
steels which will allow the tests results to be fine-tuned.
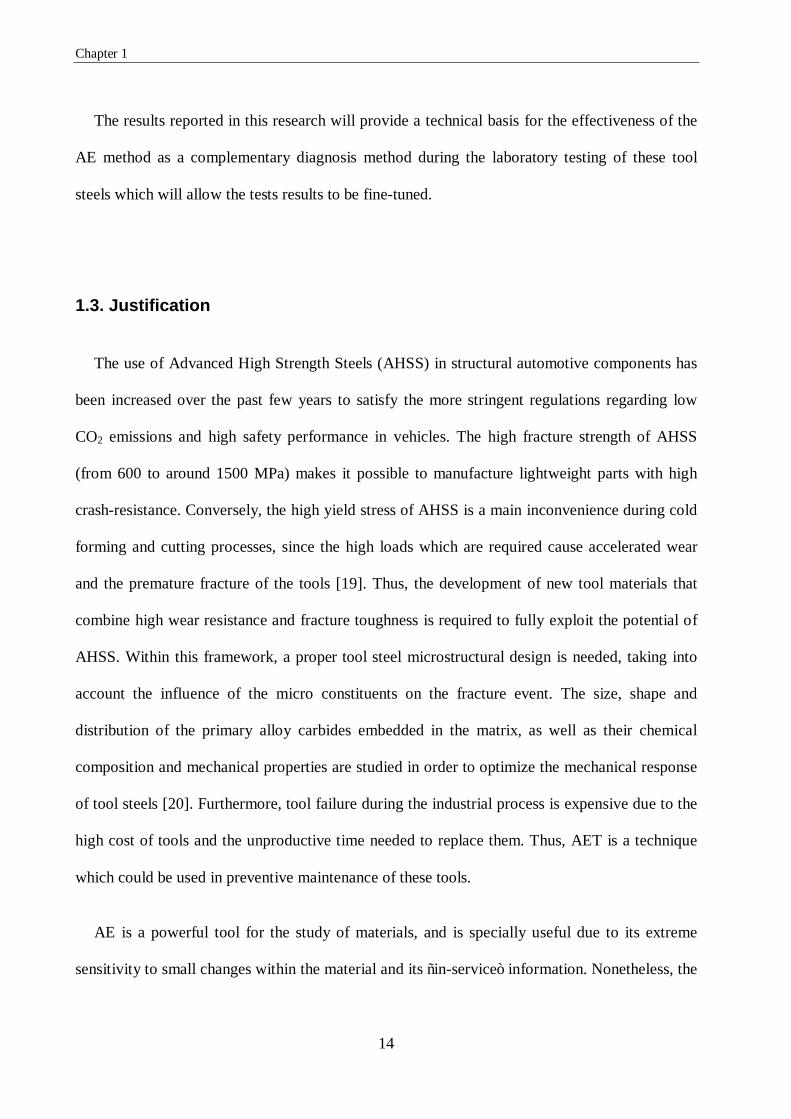
1.3. Justification
The use of Advanced High Strength Steels (AHSS) in structural automotive components has
been increased over the past few years to satisfy the more stringent regulations regarding low
CO2 emissions and high safety performance in vehicles. The high fracture strength of AHSS
(from 600 to around 1500 MPa) makes it possible to manufacture lightweight parts with high
crash-resistance. Conversely, the high yield stress of AHSS is a main inconvenience during cold
forming and cutting processes, since the high loads which are required cause accelerated wear
and the premature fracture of the tools [19]. Thus, the development of new tool materials that
combine high wear resistance and fracture toughness is required to fully exploit the potential of
AHSS. Within this framework, a proper tool steel microstructural design is needed, taking into
account the influence of the micro constituents on the fracture event. The size, shape and
distribution of the primary alloy carbides embedded in the matrix, as well as their chemical
composition and mechanical properties are studied in order to optimize the mechanical response
of tool steels [20]. Furthermore, tool failure during the industrial process is expensive due to the
high cost of tools and the unproductive time needed to replace them. Thus, AET is a technique
which could be used in preventive maintenance of these tools.
AE is a powerful tool for the study of materials, and is specially useful due to its extreme
sensitivity to small changes within the material and its “in-service” information. Nonetheless, the

Introduction and Overview
15
technique has not been widely used in the study of tool steels. It is therefore necessary to address
the applicability of the technique in these materials.
This research presents an experimental application of the AE method for identifying fracture
mechanisms in tool steels during fracture and contact tests.
Bending tests permit the application of a controlled load to the specimen in order to damage
it. During the test the specimen is submitted to tensile stress. Applying different loads, damage
severity in the specimen can be controlled. The three-point bending test is useful because the
maximum tensile stress is produced on one of the surfaces of the specimen. It permits the
observation of the side with the most damage in the microscopy, and it is not necessary to cut the
specimen to observe the broken carbides, possible plasticity or incipient cracks. This test makes
it possible to correlate the AE signals obtained with the observed damage in the specimen for
different load levels.
With the spherical indentation test, an elastic field is generated in the specimen. It is thus
possible to crack some carbides without propagating cracks within the material. This enables the
isolation of the carbide crack from other mechanisms.
1.4. Thesis overview
The remainder of this thesis is organized into six chapters which are briefly described in the
following lines:

Chapter 1
16
− Chapter one is an introduction to the thesis. It contains general information about tool steels
damage mechanisms and their detection. The objectives and justification of this thesis are
also presented.
− Chapter two is related to steel characterization by means of the three-point bending test.
This chapter is subdivided in three parts: i) identification of initial damage in specimens
with a typical AE setup, ii) experimental procedure for eliminating background noise and
problems due to reflections and iii) the results of identifying the damage mechanism,
including the identification of nucleation and crack growth by the steel matrix, and
demonstration of the order in which they occur and the stress level that takes place.
− Chapter three explains the results obtained with a spherical indentation test to identify the
cracking of carbides due to shear stress.
− Chapter four contains a discussion of the key findings in this study.
− Chapter five presents suggestions for future research.
1.5. References
[1] Martínez Baena, M.A. and Palacios, J.M.; Algunas consideraciones sobre los aceros de
herramientas, su utilización y tratamiento térmico. Tratamientos Térmicos, Nr.83, pp. 34-
47, June 2006.
[2] Donald R. Askeland. Ciencia e ingeniería de los materiales. Ed. Paraninfo, 2001. ISBN
9788497320160.
[3] William D. Callister Jr. Materials science and engineering: an introduction. 8th ed. John
Wiley & Sons Ltd., 2009. ISBN-10: 0470419970.

Introduction and Overview
17
[4] F.J. Gil Mur and J.M. Manero Planella. Metalografia. Barcelona: Edicions UPC, 2005.
ISBN: 8483018047.
[5] Okolovich, G.A.; Tool steels for cold working dies. Metal science and heat treatment, Vol.
48, Nr. 5, pp. 233-239, 2006.
[6] G.A. Roberts, G. Krauss and R. Kennedy. Tool steels. 5th ed. Metal Park (OH, USA): ASM
International, 1998. ISBN: 978-0-87170-599-0. pp. 325-327.
[7] Gary L. Workman and Patrick C. Moore (eds.). Nondestructive testing Handbook, volume
10. 3th ed. Columbus (OH, USA): ASNT, 2012. ISBN: 978-1-57117-187-0.
[8] Drouillard, T.F.; A history of acoustic emission. Journal of Acoustic Emission. Vol. 14.
Nr. 1, pp. 1-34, 1996.
[9] Kaiser, J. Untersuchungen uber das auftreten gerauschen beim zugersuch (An
investigation into the occurrence of noises in tensile test or a study of acoustic phenomena
in tensile test). PhD. Dissertation Technische Hoschuschule Munchen. Munich (Germany).
[10] PATENSCHRIFT Nr. 852771 (1952) “Materialprüfverfahren”. Dr. Ing. Joseph Kaiser.
[11] Dunegan, H.L.; Harris, D.O.; Tetelman, A.S.; Detection of fatigue crack growth by
acoustic emission techniques. Materials Evaluation. Vol. 28, Nr. 10, pp. 221-227, Oct.
1970.
[12] Halford, K.M. and Worden, K.; Special issue guest editorial on acoustic emission. Journal
of Strain Analysis, Vol. 40, Nr. 1, Editorial, 2005.
[13] CEN. EN 13554:2002 Non-destructive testing. Acoustic emission. General principles.
April 2002.
[14] Scruby, C.B.; An introduction to acoustic emission. Journal of Physics E: Scientific
Instruments. Vol. 20, Nr. 8. pp. 946-953, 1987.

Chapter 1
18
[15] Ono, K.; Current understanding of mechanism of acoustic emission. Journal of Strain
Analysis. 2005, Vol. 40, Nr. 1, pp. 1-15, 2005.
[16] Christian U. Grosse and Masayasu Ohtsu (eds.) Acoustic emission testing. Basics for
research-application in civil engineering. Germany. Springer: 2008. ISBN: 978-3-540-
69895-1.
[17] Steel, J.A. and Reuben, R.L.; Recent developments in monitoring of engines using
acoustic emission. Journal of Strain Analysis. Vol. 40, Nr. 1, pp.45-57, 2005.
[18] Sikorska, J.Z. and Mba, D.; Challenges and obstacles in the application of acoustic
emission to process machinery; Proceedings of the Institution of Mechanical Engineers,
Part E: Journal of Process Mechanical Engineering, Vol. 222, pp. 1-19, February 2008.
[19] Advanced High Strength Steel (AHSS) Application Guidelines Version 3. International
Iron & Steel Institute. Committee on Automotive Applications, 2005. Online at
www.worldautosteel.org
[20] Casellas, D.; Caro, J; Molas, S.; Prado, J.M.; Valls, I.; Fracture and toughness of carbides
in tool steels evaluated by nanoindentation. Acta Materialia, Vol. 55, Nr. 13, pp.4277-
4286, August 2007.

19
Chapter 2: Characterization of tool steels by three-point bending test
2.1. Introduction
The interaction between the two main constituents of tool steel microstructures: the primary
carbides and the metallic matrix, determines their mechanical properties and hereby, the
performance of tools working in industrial applications. A proper comprehension of micro-
mechanical mechanism leading to damage in the microstructure prior to failure comprises the
identification, localization and quantification of the phenomena being involved in the process
when a certain load is applied.
Carbides play an important role determining the mechanical response of these steels since
they act as fracture initiation sites. Cracks nucleate form broken primary carbides and grow
through the metallic matrix until they attain the critical size for failure [1,2]. Thus, an increase of
carbides mechanical properties is expected to raise fracture and fatigue resistances of tool steels.
This is why Casellas et al. [3] used nanoindentation techniques to determine the mechanical
properties (i.e. hardness, Young’s Modulus and fracture toughness) of primary carbides
embedded in several tool steels. However, as shown by Picas et al. [4], the fracture strength of
carbides not only depends on their mechanical properties, but also on their shape, arrangement

Chapter 2
20
and presence of internal defects. Accurate data on the primary carbides fracture strength in tool
steels will bring valuable knowledge to light, concerning the global mechanical response of
tools. The onset stresses for crack nucleation and growth in tool steel microstructures are rather
unknown. To fill this gap of knowledge, this research has used the AE technique during fracture
tests (three-point bending tests) in order to cope with the difficulty to identify the applied stresses
related to the nucleation and growth of cracks. The three-point bending tests permits easily
visualize by microscopy the most stressed surface; this is an advantage over the tensile test
which has been more widely monitored by AE.
Fukaura et al. [5] and Yokoi et al. [6] are amongst the few authors who employed this
technique to determine the progression of internal damage in tool steels. Fukaura [5] applied AE
to determine the stress level at which carbides start to break in a tensile test. Their work showed
the relationship between the characteristic AE wave parameters and material damage evolution.
The main problem of their work was to relate the AE information with damage in the specimen;
since during tensile tests damage occurs inside the specimen. However, as these authors
indicated, the use of relatively low frequency sensors (375 kHz) might have had introduced some
limitations that could have been avoided by the bending test to their predominant frequency, and
correlated continuous low frequency signals to plastic deformation events, while sudden high
frequency signals to fracture events. Yokoi [6] determine that carbide cracking could
successfully be detected by AE; in his work, the signals started at a certain applied load and the
event rates continually increased until reaching the fracture stress. These authors stated that no
continuous AE signals existed but that numerous burst emission at close intervals were recorded
instead. Yamada and Wakayama [7] observed a rapid increase in cumulative AE energy prior to
the final fracture of cermets samples and attributed this phenomenon to the to the main crack
formation. They also distinguished two types of AE signals: one was a burst-type signal with

Characterization of tool steels by three-point bending tests
21
high frequency and the other was a low frequency and continuous-type signal. The former was
considered to be emitted form micro-cracking while the latter was due to plastic deformation of
the binder phase.
The following sections of this chapter show the results obtained during three-point bending
tests monitored by AE. Each of the sections presents a point of view of the problem, showing the
results in sequential order as the research advanced. Section 2.2 shows the simplest monitored
procedure of bending test in order to identify the initial damage and its evolution. Section 2.3
proposes a new AE filtering process and procedure for monitoring the three-point bending tests
that permits to refine the results. Finally, section 2.4 present a classification of AE signals that
permits to identify different damage mechanism during the bending test.

Chapter 2
22
2.2. Analysis of fracture resistance of tool steels by means of AE
2.2.1. Introduction
Aimed to a better understanding the role of the microstructural constituents (primary carbides
and metallic matrix) in the fracture mechanisms of tool steels, this section is focused on the
application of AE in monotonic bending tests to determine the stress levels at which damage
appears.
2.2.2. Experimental procedure
2.2.2.1. Specimens
Two commercially available tool steels were selected: DIN 1.2379 (equivalent to AISI D2)
and a tool steel named as UNIVERSAL (developed by ROVALMA S.A.). The chemical
composition of both can be found in Table 2.2.1. The DIN 1.2379 tool steel shows a ledeburitic
microstructure with primary carbides formed during solidification by the eutectic reaction ⇒ γ +
M7C3 [8]. In UNIVERSAL steel two types of primary carbides are present, one type is M7C3 but
shows higher Vanadium and Tungsten content than those found in DIN 1.2379, and the second
type is MC Vanadium rich and shows increased hardness and toughness values compared to the
other types. Properties of these carbides can be found in reference [3]. Carbides in DIN 1.2379
have elongated shapes and are dispersed in the matrix forming bands along the forging direction.
In the meanwhile, primary carbides of UNIVERSAL steel are more equiaxed and
homogeneously distributed in the matrix [1].

Characterization of tool steels by three-point bending tests
23
Table 2.2.1. Chemical and mechanical properties of materials DIN1.2379 and UNIVERSAL
Steel C Cr Mo V W HRC
1.2379 1.5 - 1.6 11.0 - 12.0 0.6 - 0.8 0.9 - 1.0 - 60 - 62
UNIVERSAL 0.9 – 1.2 6.8 - 8.5 - 2.5 – 3.0 1.1 – 1.4 60 - 62
Prismatic specimens with dimensions 50x8x6 mm were extracted from forged billets, with the
longitudinal axis parallel to the forging direction. The obtained samples were heat treated by
quenching in oil and tempering up to a hardness of 60 - 61 HRC (heat treatments can be found
scheduled in [3]).
2.2.2.2. Monitored AE flexion fracture test.
A three point bending test was used to evaluate the mechanical behavior of specimens. The
surface exposed to tensile stress was grinded and polished, and the edges were rounded in order
to avoid stress concentration effects. Tests were carried out in a universal testing machine in air
at room temperature and the load rate was fixed at 1 mm/s.
Two small magnetic AE sensors were disposed alongside the specimens in order to detect the
AE signals. The sensors had a fixed resonance frequency of 700 kHz (VS700D, Vallen System
Gmbh). Two pre-amplifiers with a gain 34dB of the same brand were used (EAP4). Signals were
recorded and analysed using the Vallen System Gmbh AMSY5 analyser. During the
measurements, digital filters of 95-850 kHz were applied.

Chapter 2
24
Figure 2.2.1. Diagram of the experimental setup.
2.2.2.3. Test procedure.
For each type of tool steel, several bending tests were first carried out up to the end (breakage
of the specimen) in order to define the typical AE signal pattern in the fully run test. Later, the
tests were paused upon significant changes of the AE signals. However, a maximum load of 70%
of the material fracture strength was applied so as to prevent the sensors from being damaged as
a consequence of the sudden specimen break. DIN 1.2379 and UNIVERSAL characteristic
fracture strength values were determined by Picas et al. and can be found in [1]. At each halt, the
surface subjected to tensile loading was examined by means of Optical and Confocal Microscopy
(OM and CM) to identify the potential sources in the microstructure responsible for the detected
changes in AE signals.
S2 S1
Span, 40 mm
P
Pre- Amplifiers
(34 dB)
AE signal
Filters Amplifiers
AE signal Analyzer and
Event Detector +
Computer Data Storage
Post-Processor Polish face
S1 – AE sensor 1 S2 – AE sensor 2
Characterization of tool steels by three-point bending tests
25
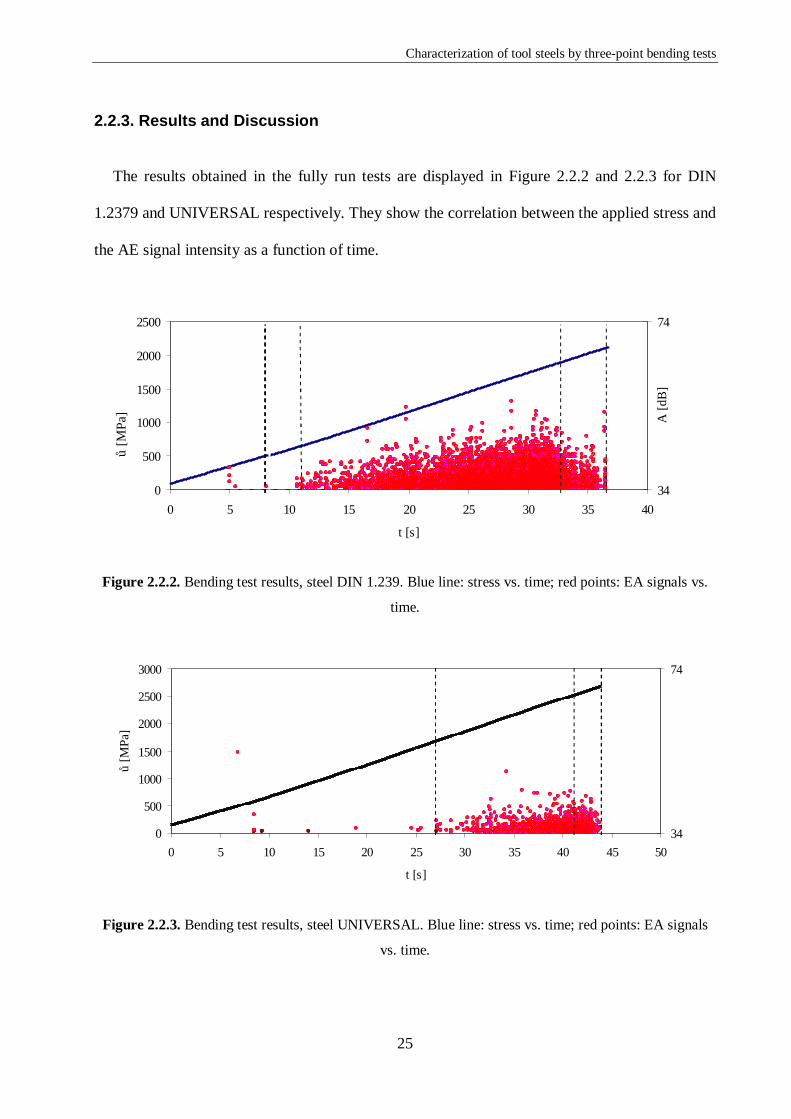
2.2.3. Results and Discussion
The results obtained in the fully run tests are displayed in Figure 2.2.2 and 2.2.3 for DIN
1.2379 and UNIVERSAL respectively. They show the correlation between the applied stress and
the AE signal intensity as a function of time.
0
500
1000
1500
2000
2500
0 5 10 15 20 25 30 35 40
t [s]
34
74
A [d
B]
Figure 2.2.2. Bending test results, steel DIN 1.239. Blue line: stress vs. time; red points: EA signals vs.
time.
0
500
1000
1500
2000
2500
3000
0 5 10 15 20 25 30 35 40 45 50
t [s]
σ [M
Pa]
34
74
Figure 2.2.3. Bending test results, steel UNIVERSAL. Blue line: stress vs. time; red points: EA signals
vs. time.
σ [M
Pa]

Chapter 2
26
Both DIN 1.2379 and UNIVERSAL show a similar pattern with regard to the captured AE
signals. Three different zones can be distinguished:
First zone
During the first stage of the test, AE signals are almost inexistent. The reason is that the
material is under elastic deformation and neither the carbides nor the matrix show fracture or
plastic deformation. In other words, once the noise is filtered out, the absence of AE signals can
be associated with material linear behavior.
Nonetheless, the detection of a few isolated AE signals could presumably be caused by the
fracture of some carbides or a material chip off due to polishing; even though no certainty can be
given at this point.
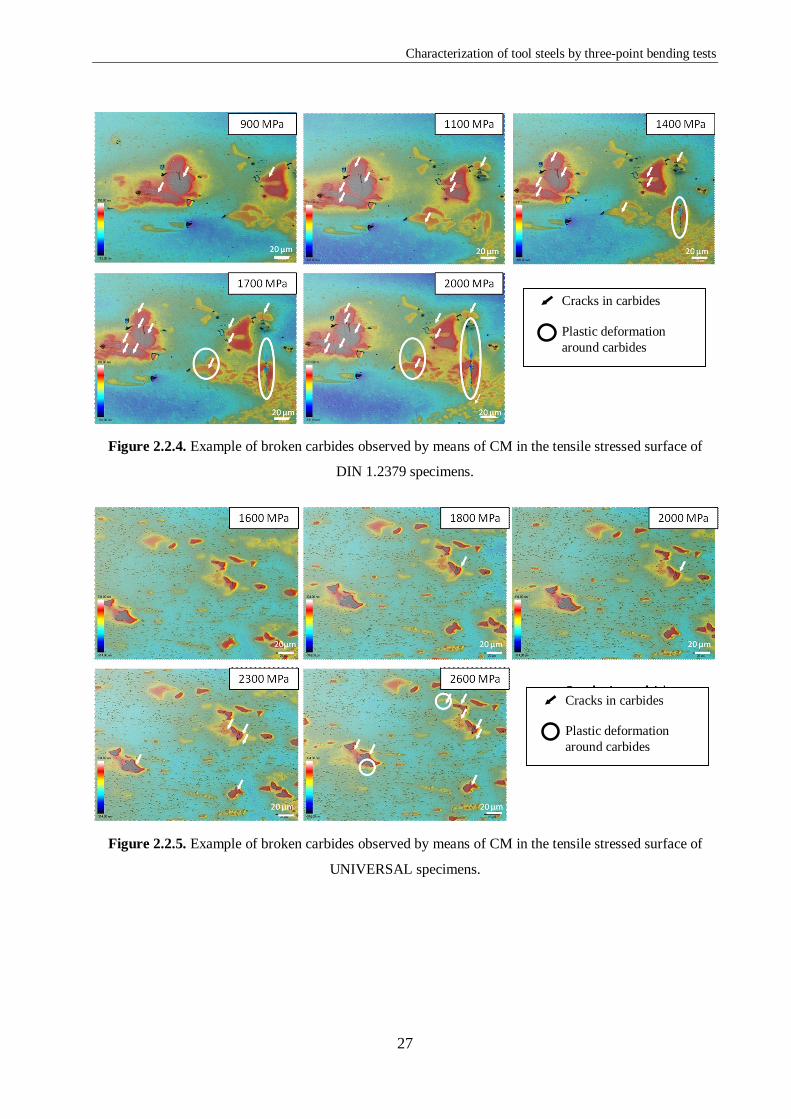
Second zone
In this zone appear the first AE signals. In the DIN 1.2379 they start at approximately 11 s
and in the UNIVERSAL at 27 s, which correspond to a stress level of 640 MPa and 1700 MPa
respectively. The signals increase gradually in intensity and abruptly in number. During this
stage, several broken carbides can be discerned in the steels microstructure. As shown in Figure
2.2.4 and 2.2.5 for DIN 1.2379 and UNIVERSAL respectively, the amount of broken carbides
increases considerably with the rising stress. In some cases a small area of plastic deformation
appears.
Characterization of tool steels by three-point bending tests
27
Figure 2.2.4. Example of broken carbides observed by means of CM in the tensile stressed surface of
DIN 1.2379 specimens.
Figure 2.2.5. Example of broken carbides observed by means of CM in the tensile stressed surface of
UNIVERSAL specimens.
Cracks in carbides Plastic deformation around carbides
Cracks in carbides Plastic deformation around carbides
Chapter 2
28
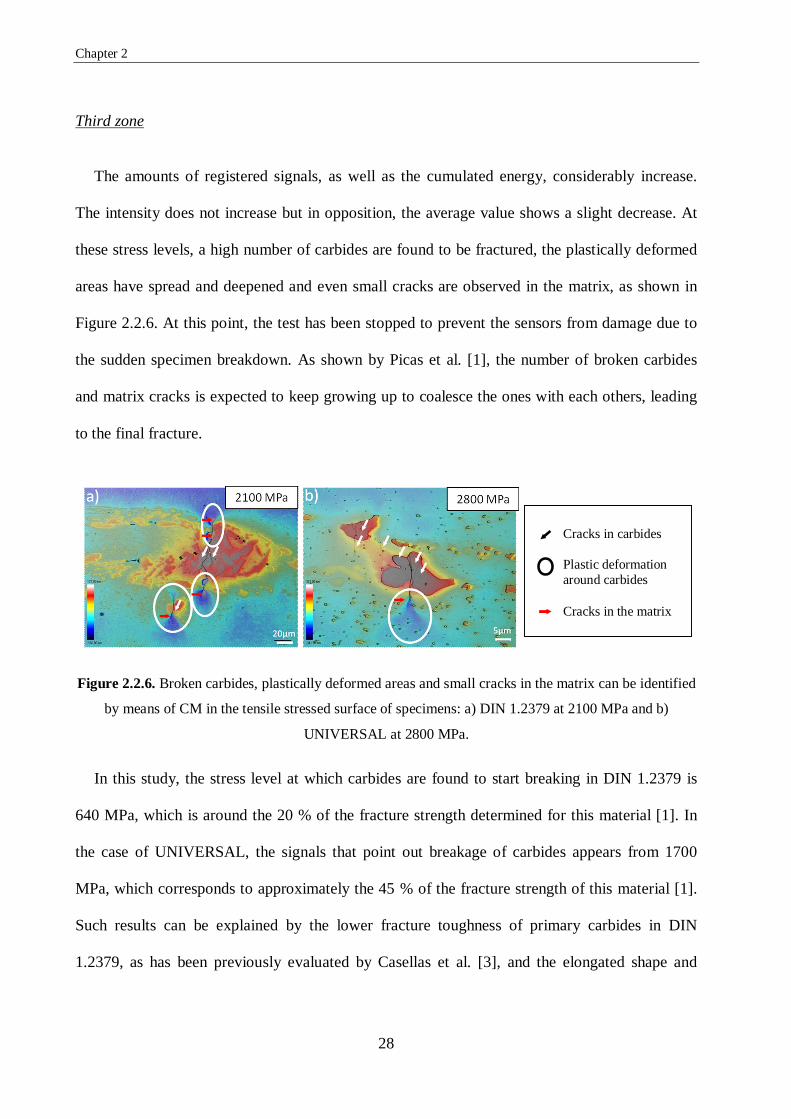
Third zone
The amounts of registered signals, as well as the cumulated energy, considerably increase.
The intensity does not increase but in opposition, the average value shows a slight decrease. At
these stress levels, a high number of carbides are found to be fractured, the plastically deformed
areas have spread and deepened and even small cracks are observed in the matrix, as shown in
Figure 2.2.6. At this point, the test has been stopped to prevent the sensors from damage due to
the sudden specimen breakdown. As shown by Picas et al. [1], the number of broken carbides
and matrix cracks is expected to keep growing up to coalesce the ones with each others, leading
to the final fracture.
Figure 2.2.6. Broken carbides, plastically deformed areas and small cracks in the matrix can be identified
by means of CM in the tensile stressed surface of specimens: a) DIN 1.2379 at 2100 MPa and b)
UNIVERSAL at 2800 MPa.
In this study, the stress level at which carbides are found to start breaking in DIN 1.2379 is
640 MPa, which is around the 20 % of the fracture strength determined for this material [1]. In
the case of UNIVERSAL, the signals that point out breakage of carbides appears from 1700
MPa, which corresponds to approximately the 45 % of the fracture strength of this material [1].
Such results can be explained by the lower fracture toughness of primary carbides in DIN
1.2379, as has been previously evaluated by Casellas et al. [3], and the elongated shape and
Cracks in carbides Plastic deformation around carbides Cracks in the matrix

Characterization of tool steels by three-point bending tests
29
arrangement in bands (in which local stresses can be higher) of carbides in DIN 1.2379, as has
been stated by Picas et al [1].
Some of the results presented here show agreement with those obtained by Yamada and
Wakayama [7] with Ti(C,N)-based cermets. Basically, two types of AE signals can be identified:
a high frequency burst-type signal and a lower frequency continuous type. The first type could
be attributed to the carbide micro-cracking processes while the continuous type could be related
to plastic deformation in the matrix. Although this theory is consistent with the results obtained
in this study, additional research is required to ascertain these correlations.
2.2.4. Conclusions
According to the experimental results obtained by means of coupling AE to bending tests, and
the microstructural observation of two different tool steels, the following conclusions can be
drawn:
− AE is an appropriate experimental tool to detect carbide cracking in tool steels microstructure.
− An experimental relationship has been established between the fracture of carbides and the
obtained AE signal. The stress levels at which carbides were broken were determined by AE
and experimentally confirmed by microstructural inspection.
− The tool steel with the highest broken carbide content induces the highest quantity of AE
signals with more temporal dispersion.

Chapter 2
30
2.2.5. References
[1] Picas, I.; Cuadrado, N.; Casellas, D., Goez, A.; Llanes, L.; Microstructural effects on the
fatigue crack nucleation in cold work tool steels, Procedia Engineering, Fatigue 2010, April
2010, Vol.2, Nr.1, pp. 1777-1785.
[2] Berns, H.; Broeckmann, C.; Weichert, D.; Fracture of hot formed ledeburitic tool steels.
Engineering Fracture Mechanics, Nov. 1997, Vol.58, Nr. 4, pp. 311-325.
[3] Casellas, D.; Caro, J.; Molas, S.; Prado, J.M.; Valls, I.; Fracture toughness of carbides in
tool steels evaluated by nanoindentation. Acta Materalia, Aug. 2007, Vol. 55, Nr. 13, pp.
4277-4286.
[4] Picas, I; Hernandez, R; Casellas, D; Valls, I; Strategies to increase the tool performance in
punching operations of UHSS. R. Kollek (Ed.), 2010, Proc IDDRG, Graz, Austria 325-334.
[5] Fukaura, K., Ono, K.; Acoustic emission analysis of carbide cracking in tool steels. Jorurnal
of Acoustic Emission, 2001, Vol.19, pp.91-99.
[6] Yokoi, D.; Tsujii, N.; Fukaura, F.; Effects of tempering temperatures and stress amplitude
on low-cycle fatigue behavior of a cold work tool steel. Materials Science Research
International, Vol. 9, 216-222.
[7] Yamada, K. and Wakayama, S., AE monitoring of microdamage during flexural fracture of
cermets. Proceedings EURO PM2009- Hardmetals & Cermets, 247-252.
[8] Metals Handbook – Metallography, Structures and Phase Diagrams, ASM International,
Vol. 8, p.402, USA 1978.

Characterization of tool steels by three-point bending tests
31
2.3. Filtering of acoustic emission signals for the accurate identification of
fracture mechanisms in three-point bending tests
2.3.1. Introduction
In order to characterize the mechanical behavior of a material, monitoring the test with AE
becomes a tool for understanding what is happening to the material throughout the whole test.
However, acquired AE signals depend on several factors such as the type of mechanical test, the
material under consideration and its type of damaging mechanisms, surface roughness, etc.
Moreover, these signals are usually contaminated by background noise that can be classified
according to its origin: the one inherent to the measurement chain (including both mechanical
and electrical origin) and the one that appears as a consequence of the mechanical process being
evaluated. Any noise, despite its origin, impairs the correlation between the failure mechanism
and AE data. Therefore, the interpretation of the AE signals may produce an erroneous
evaluation of the real damage. As a result, it is essential to apply some kind of filter in the
acquisition and analysis of data, especially in the case of seeking the incipient origins of flaws.
Some methods have been proposed to extract the signals related to relevant sources of AE
based on: i) time domain features [1,2], ii) frequency domain features [2,3] or iii) localization of
the origin of the AE signal and relating this position with a possible real source of damage [4, 5].
In all cases, the filtering process uses characteristics of the waveform (Figure 2.3.1) as: duration
(D), amplitude (A), energy (En), rise time (RT), frequency (f), etc., or a combination of them. It is
accepted that damage signals are of higher amplitude and higher frequency than those relative to
noise, which, in general, present lower amplitude, more duration, higher rise time and more
absolute energy/signal strength than a crack or damage signal [5]. As a result, most of the usual

Chapter 2
32
filtering processes are based on these general features of the signals [1-3]. However, when AE is
attempted on a laboratory scale, on small specimens, the waveform is overly deformed due to the
reflections produced in the surfaces and the results of the filters are less effective than in big
structures.
Figure 2.3.1. AE signal features.
Many research studies on damage mechanisms for fragile materials use the bending test to
identify the beginning of each damage mechanism [6-10] (for example, in tool steels, cracking of
carbides, decohesion between carbides and the metallic matrix, plastic deformation, growth of
cracks, etc.). The bending test generates damage in a small area of the stressed specimen’s
surface that can be controlled by microscopy, but it is difficult to detect the beginning of the
damage mechanism with precision. The use of this test in a stepwise loading mode and
comparing the AE signals with the observed damaged surface with a microscope facilitates the
relating of the signal’s features with the mechanism that generates them [10,11]. However, AE
signals caused by the deformation of the specimen at the upper and lower supports (background
noise due to the mechanical process) have the potential of masking the AE signals related to the
RiseTime
Duration, D
Counts, CNTS
Threshold, Thr
Energy, En
Am
plitu
de, A
Time, t
Characterization of tool steels by three-point bending tests
33
damage mechanism; therefore preventing the detection of the applied stress at which the fracture
mechanism takes place.
The purpose is to develop a signal filtering process capable to discriminate between AE
signals emitted by natural damage mechanisms in specimens from others caused by the
interaction of the specimen with the supports necessary to carry out the mechanical test. This
enables to filter all AE signals not related to the damage mechanisms under investigation. The
novelty of this type of filtering is that it extracts information only from the first cycles of the
signals instead of from their whole length. The filtering process is applied to a three-point
bending test of a cold work tool steel DIN 1.2379 in order to determine the onset stresses for the
acting damaging mechanisms involved in the fracture process.
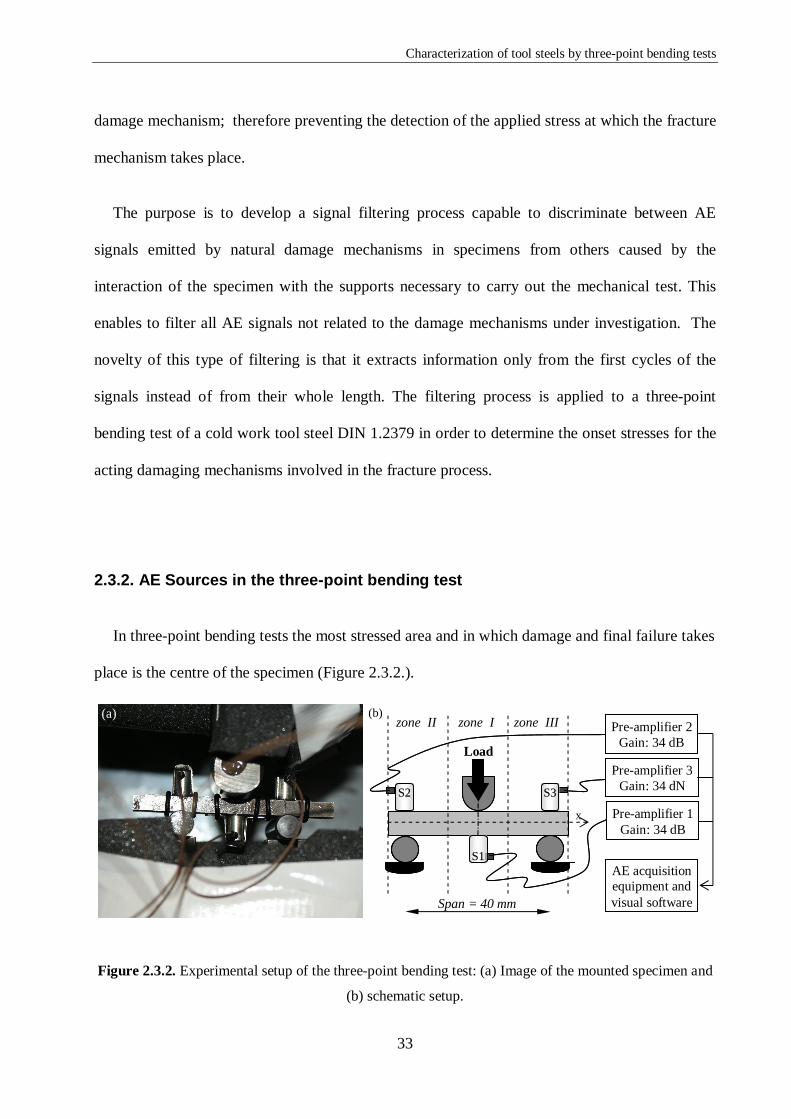
2.3.2. AE Sources in the three-point bending test
In three-point bending tests the most stressed area and in which damage and final failure takes
place is the centre of the specimen (Figure 2.3.2.).
Figure 2.3.2. Experimental setup of the three-point bending test: (a) Image of the mounted specimen and
(b) schematic setup.
x
S3S2
Load
S1
zone II
S3S3S2S2
S1
Pre-amplifier 2 Gain: 34 dB
Pre-amplifier 3 Gain: 34 dN
Pre-amplifier 1 Gain: 34 dB
(a) zone I zone III
Span = 40 mm
AE acquisition equipment and visual software
(b)

Chapter 2
34
However, the AE signals emitted by natural damage generated in the microstructure as a
result of the mechanical test are affected by both the background noise due to the measurement
chain and the mechanical process.
The background noise related to the measurement chain in this kind of test can be reduced by
using general measures conventionally employed in AET. These measures include the careful
assembly of the acquisition system, which involves protecting the sensors, fixing the cables to
avoid that they move and selecting the correct threshold to limit the quantity of signals reaching
the sensors. Another common practice consists in applying a low frequency filter with the aim of
cutting out vibration and machine noises.
Mechanical process background noise is mainly due to the high contact pressure at the
specimen surface directly in contact with the supports of the bending fixture. These zones in the
specimen can be severely damaged during the test, and they also generate AE signals. This
spurious noise can be eliminated with a lineal location processor. In figure 2.2.2, the signals
produced in zone II or III correspond mainly to this type of noise. The main problem occurs in
the zone of interest (zone I), where the generated AE signals have two next damage origins: i)
the contact pressure between the upper central support and the specimen (noise signals) and ii)
the stress state induced in bending (signals of interest). The elimination of this kind of spurious
signal has been attempted by different AE filtering processes, such as:
a) To raise the threshold before or during the test. This procedure is not valid if the
measurement deals with the nucleation of incipient cracks in the microstructure, because the
energy released is very low [12] and valid AE signals could be excluded.
b) To study the relationship between the duration and amplitude of the signals. Swangson filters
define some combinations of values to identify noise signals [11,13]. It is a filter strongly

Characterization of tool steels by three-point bending tests
35
dependent on the threshold and the waveform. In small specimens, the distorted waveforms
make these filters unsuitable.
c) The use of master-slave or guard technique. Master sensors are mounted near the source of
interest and enclosed by others called slaves or guard sensors. If any signal arrives first to a
guard sensor, it is rejected [14]. This is useful only if the source of the signals is isolated.
d) Some studies are based on frequency domain features in order to determine the damage
severity or to identify different damage mechanisms [10,15], but they are not used to filter
background noise (except low frequencies or noises with clear frequency predominance). In
the case of small specimens, multiple reflections produce change of modes that distort the
characteristics of the frequency domain.
2.3.3. De-noise filtering process
Although during the test, possible sources of background noise were identified and isolation
mechanisms were applied (as detailed in Method section 2.3.4), the raw data acquired still
contain noise signals. The de-noise process developed in this thesis deals with the elimination of
the AE signals which are emitted by: i) residual environmental noise (measurement chain noises)
and ii) AE signals related with the contact between supports and the specimen (mechanical
process noise). As mentioned before, the waveforms in small laboratory specimens are quickly
distorted, especially if they are made of a metallic material with low attenuation (Figure 2.3.3).

Chapter 2
36
Figure 2.3.3. Measured signal waveform with time segment definition.
Therefore, the use of parameters related to AE wave shapes could be confusing to classify
signals. Taking into account the small size of the specimens used in this study (as shown in
section 2.3.4.2), only the very first cycles of the waveform carry information about the source
(the rest of cycles must be discarded as they are affected by boundary reflections). This initial
segment of waves is defined as TS1 (Figure 2.3.3) and its features were analyzed to identify the
main characteristics of signals originated in zones II or III (Figure 2.3.2), corresponding to
damage due to supports and specimen surfaces. Then, the signals originated in the central area of
the specimen (zone I) with similar characteristics to those of zones II and III were eliminated.
This filter leaves AE signals exclusively related to micro-structural damage generated as a result
of the applied load during the bending test. Figure 2.3.4 presents a schematic diagram of the
filtering applied in this work and the algorithm is summarized as follows:
• Time segment definition: Each signal is divided into three time segments (Figure 2.3.3): i)
Signal segment 1, TS1, ii) signal segment 2, TS2, with a length of three times TS1, with the
TS3.j
TS2.j
TS1.j
Characterization of tool steels by three-point bending tests
37
aim to include the peak amplitude of the signal, and iii) signal segment 3, TS3, including
the full length of the signal excluding pre-trigger. TS2 and TS3 are used to clearly identify
burst from continuous signal types. Continuous signal types are related to background
noise and plasticity mechanism [16].
• Origin of hits: Using linear location algorithms, the hits are classified according to their
origin in the range of zones I, II and III (Figure 2.3.2). The location in the x-zone is an
event builder constructed with an x-sensor defined as normal and others defined as guard
sensors. The velocity of propagation and the distances between sensors are detailed in
Method section 2.3.4.
• Initial classification of the signals: according to the time segment definition and signal
origin, the signals are defined as Hi,j where i = 1…3 refers to the time segment and j =
1…3 refers to the origin of the signal.
• Time domain features: the average amplitude of each time segment (ATi,j) for all signals is
obtained by the Root Mean Square (RMS) method.
• FFT features:
i) Two frequency segments (k) were defined between 95 – 450 kHz (k = 1) and 450 – 850
kHz (k = 2); in accordance with the sensor response.
ii) AFi,j(k): average amplitude in the frequency domain of the signal.
• Definition of decision variables:
i) Amplitude Ratio (ARi) defined as the ratio of AT2,j to AT3,j; to identify burst type signals
from continuous ones.
ii) Spectral Bands Ratio (SBRj): is the ratio of AFi,j(1) to AFi,j(2) for i=1. This indicator
allows the clustering of signals according to the energy distribution in the frequency
segments previously defined.

Chapter 2
38
• Criteria for discrimination of the measurement chain for background noise: to reject signals
which present a continuous waveform. In this particular case, after observation, the
threshold of ARi > 6 dB gives good results.
• Classifying damage mechanism: Identify appropriate features capable of clustering signals.
For this study: the correlation between SBRj and AT1,j.
Figure 2.3.4. Block diagram of the analysis of acquired data.
2.3.4. Method
The filtering process is applied to the acquisition data obtained in a monotonic three-point
bending test. To correlate and identify AE signals with specimen damage a Confocal Microscope
(CM) is used to inspect the microstructure of the samples.
Hi,j
( )3,i
2,ij,ii AT
ATHAR =
ARi > 6
AFi,j (k)
( ))2()1(
,1
,1,
j
jjij AF
AFHSBR =
SBR1 = SBR2 AT1,1 = AT1,2
Genuine Hits
Measurement of chain background
noise
Mechanical process
background noise
NO
YES

Characterization of tool steels by three-point bending tests
39
2.3.4.1. Experimental procedure
The three-point bending test is carried out in a universal testing machine with a constant span
length of 40 mm using an articulated fixture to minimize torsion effects. The displacement rate
applied was 0.1 mm/min and the test took place at room temperature. The set-up is schematized
in Figure 2.3.2.
2.3.4.2. Specimens
Cold work tool steel DIN 1.2379 specimens were used. They had a prismatic shape (length =
50 mm, width = 8 mm and thickness = 6 mm) with the forging direction oriented parallel to the
long axis of specimens. Samples were mechanically ground and their corners were rounded to
avoid stress concentration and remove any defect introduced during sample preparation. The face
subject to tensile stress during the bending test was carefully polished to a mirror finish using
colloidal silica particles measuring approximately 40 nm.
The goal of the three-point bending test coupled to AE analysis in this tool steel is to obtain
accurate data regarding damaging mechanisms at the initial stage of fracture. Picas et al. [17]
reported that breakage of primary carbides determines the onset for crack nucleation and
propagation in tool steels under monotonic conditions. Thus, AE signals emitted by carbide
failures were sought. In order to verify that the breakage of carbides generates different signals
with respect to those caused by contact pressure at upper and lower supports, the three-point
bending test was also performed with a spring steel DIN 55Cr3 . This is a martensitic steel with
no large primary carbides embedded as in DIN 1.2379, that is why no AE activity was expected
related to their breakage. The chemical composition and hardness of 1.2379 and 55Cr3 are
summarized in Table 2.3.1.

Chapter 2
40
Table 2.3.1. Chemical and mechanical properties of tested materials: 1.2379 and 55Cr3.
Steel C Cr Mo V Mn HRC
1.2379 1.5 - 1.6 11.0 - 12.0 0.6 - 0.8 0.9 - 1.0 - 60 - 62
55Cr3 0.55 0.85 - - 0.85 43 - 45
2.3.4.3. AE Measurements
Figure 2.3.2(b) shows the AE acquisition set-up. The equipment was an AMSY-5 (Vallen
System, GmbH) equipped with four channels and connected to a computer with VisualAE
software (Vallen System, GmbH). The test was monitored using three small resonant-type
sensors firmly attached to the specimen. One sensor (S1) was mounted in the center of the tensile
face, and the other two (S2 and S3) were on the opposite side. All of them were aligned with the
three supports of the bending fixture. The sensors present a resonant frequency centered on 700
kHz, but their response is relatively flat until 450 kHz and between 550 to 800 kHz. To
guarantee enough acoustic transmission, silicone grease was introduced between the plate of the
sensor and the surface of specimen. The three (central and roller) supports were covered with a
PVC film with a thickness of 0.15 mm, to minimize the frictional noises with the specimen
during the test.
Some preliminary measurements of the background noise were conducted in order to
determine the threshold level. In this case, four sensors were attached to the specimen and the
upper anvil assembly. As AE activity was detected with amplitudes below 30 dB, the threshold
level was fixed at 34 dB.
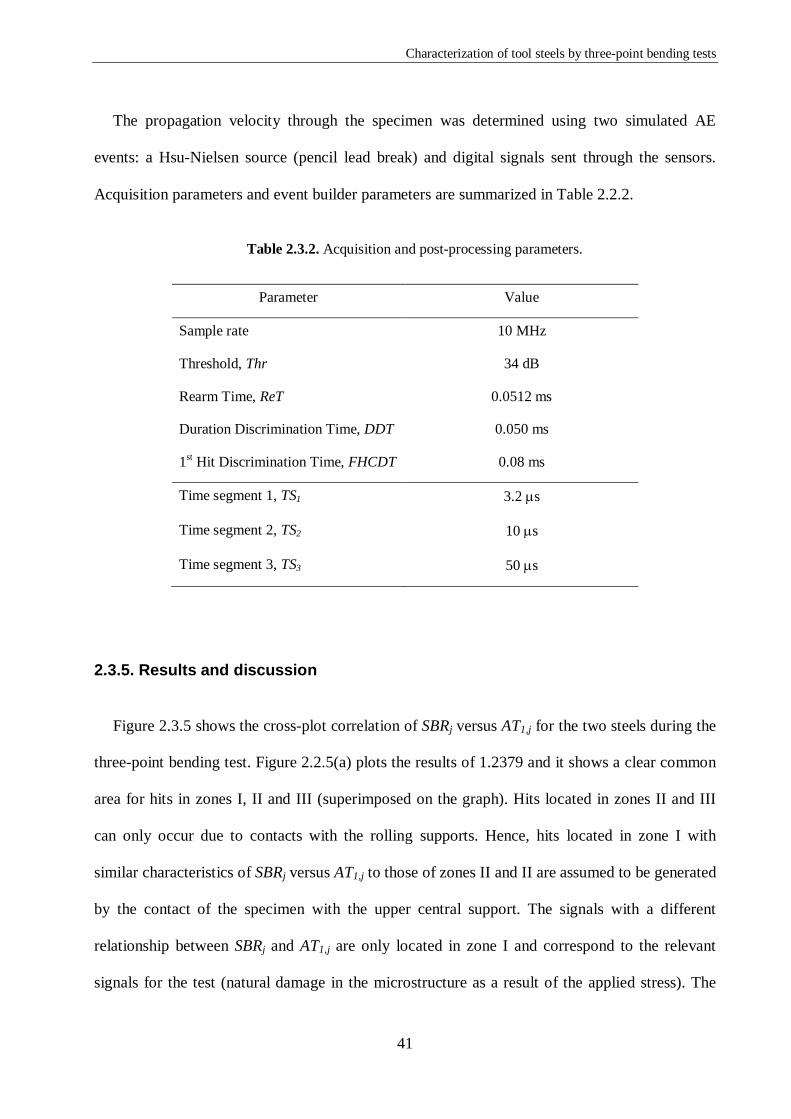
Characterization of tool steels by three-point bending tests
41
The propagation velocity through the specimen was determined using two simulated AE
events: a Hsu-Nielsen source (pencil lead break) and digital signals sent through the sensors.
Acquisition parameters and event builder parameters are summarized in Table 2.2.2.
Table 2.3.2. Acquisition and post-processing parameters.
Parameter Value
Sample rate 10 MHz
Threshold, Thr 34 dB
Rearm Time, ReT 0.0512 ms
Duration Discrimination Time, DDT 0.050 ms
1st Hit Discrimination Time, FHCDT 0.08 ms
Time segment 1, TS1 3.2 µs
Time segment 2, TS2 10 µs
Time segment 3, TS3 50 µs
2.3.5. Results and discussion
Figure 2.3.5 shows the cross-plot correlation of SBRj versus AT1,j for the two steels during the
three-point bending test. Figure 2.2.5(a) plots the results of 1.2379 and it shows a clear common
area for hits in zones I, II and III (superimposed on the graph). Hits located in zones II and III
can only occur due to contacts with the rolling supports. Hence, hits located in zone I with
similar characteristics of SBRj versus AT1,j to those of zones II and II are assumed to be generated
by the contact of the specimen with the upper central support. The signals with a different
relationship between SBRj and AT1,j are only located in zone I and correspond to the relevant
signals for the test (natural damage in the microstructure as a result of the applied stress). The

Chapter 2
42
sources of these hits are carbide breakage and crack nucleation and propagation from them. The
events located in zone II and III with higher amplitude (80-85 dB) correspond to the movement
of the supports due to the displacement of the load device when the test was finished (encircled
in Figure 2.3.5(a)).
Figure 2.3.5. SBRj vs AT1,j crossplot, classified for each zone, during the three-point bending test for
two steels: (a) DIN 1.2379 and (b) DIN 55Cr3.
The spring steel specimens were employed to check the results of the clustering process, as
shown in Figure 2.3.5(b). The located hits in each zone of the specimen have similar
characteristics in reference to the relationship between SBRj and AT1,j. In this case, the
(b)
Spec
tral B
ands
Rat
io, S
BR
(a)
Spec
tral B
ands
Rat
io, S
BR
Average Amplitude, AT1 [dB]

Characterization of tool steels by three-point bending tests
43
predominant source of AE was that generated by contact pressure between supports and
specimens surface. Nevertheless, a larger quantity of hits was located in zone I (Figure 2.3.5(b))
–central support was double force that the rolling supports and some damage occurred in the
center of the specimen that was related to plastic deformation taking place in the microstructure.
The similar results for both steels, with one common mechanism of damage, permit the
identification of the characteristics of the contact pressure damage signals. So, the relationship
SBRj - AT1,j becomes an indicator of damage in the supports during the bending test.
Figure 2.3.6. (a) SBRj vs AT1,j crossplot with applied filter for DIN 1.2379 specimen (Green hits
originated in zone I, yellow in zone II and red in zone III during the three-point bending test) and (b)
cumulative hits during the bending test comparing raw data without filtering (n-line) with filtered data
(l-line).
Having identified the characteristics of the signals corresponding to damage generated at
contacting points of the surface, signals measured in 1.2379 steel with identical features of
55Cr3 steel were removed (Figure 2.3.6) from the raw data. Figure 2.3.8(a) presents cumulative
hits that first arrived to S1 during the test and compares results for un-filtered (n-line) and
Spec
tral B
ands
Rat
io, S
BR
Average Amplitude, AT1 [dB]
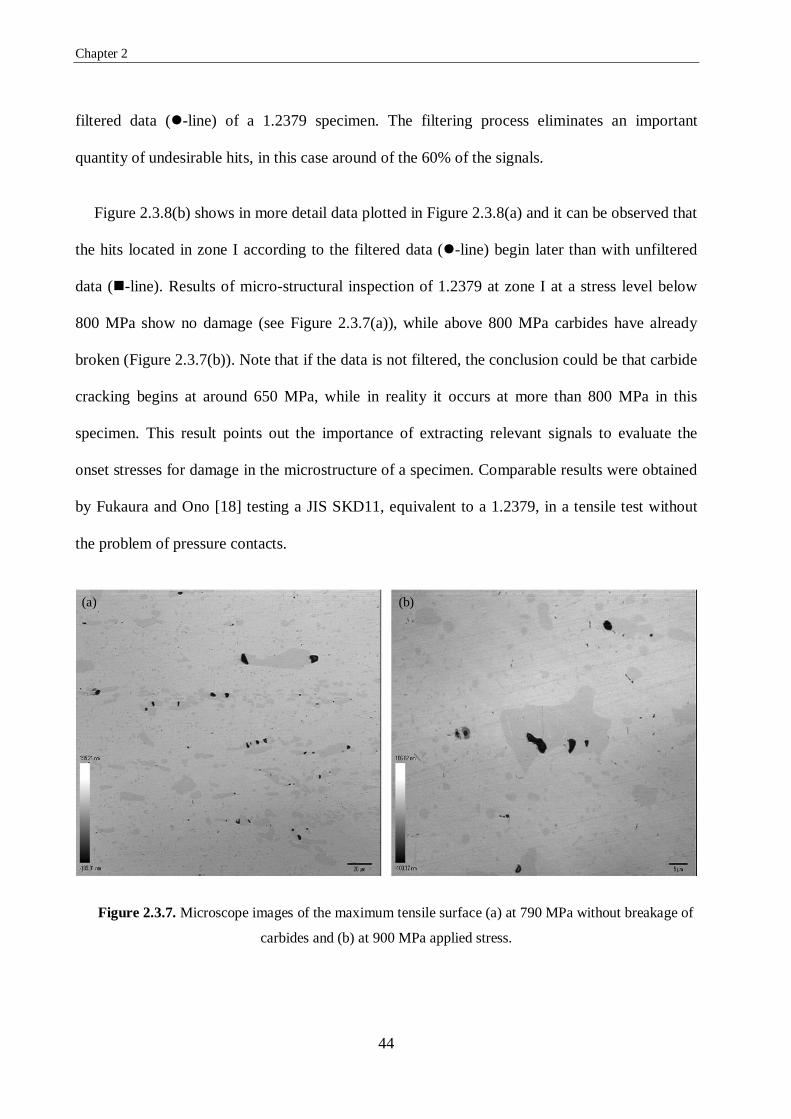
Chapter 2
44
filtered data (l-line) of a 1.2379 specimen. The filtering process eliminates an important
quantity of undesirable hits, in this case around of the 60% of the signals.
Figure 2.3.8(b) shows in more detail data plotted in Figure 2.3.8(a) and it can be observed that
the hits located in zone I according to the filtered data (l-line) begin later than with unfiltered
data (n-line). Results of micro-structural inspection of 1.2379 at zone I at a stress level below
800 MPa show no damage (see Figure 2.3.7(a)), while above 800 MPa carbides have already
broken (Figure 2.3.7(b)). Note that if the data is not filtered, the conclusion could be that carbide
cracking begins at around 650 MPa, while in reality it occurs at more than 800 MPa in this
specimen. This result points out the importance of extracting relevant signals to evaluate the
onset stresses for damage in the microstructure of a specimen. Comparable results were obtained
by Fukaura and Ono [18] testing a JIS SKD11, equivalent to a 1.2379, in a tensile test without
the problem of pressure contacts.
Figure 2.3.7. Microscope images of the maximum tensile surface (a) at 790 MPa without breakage of
carbides and (b) at 900 MPa applied stress.
(a) (b)
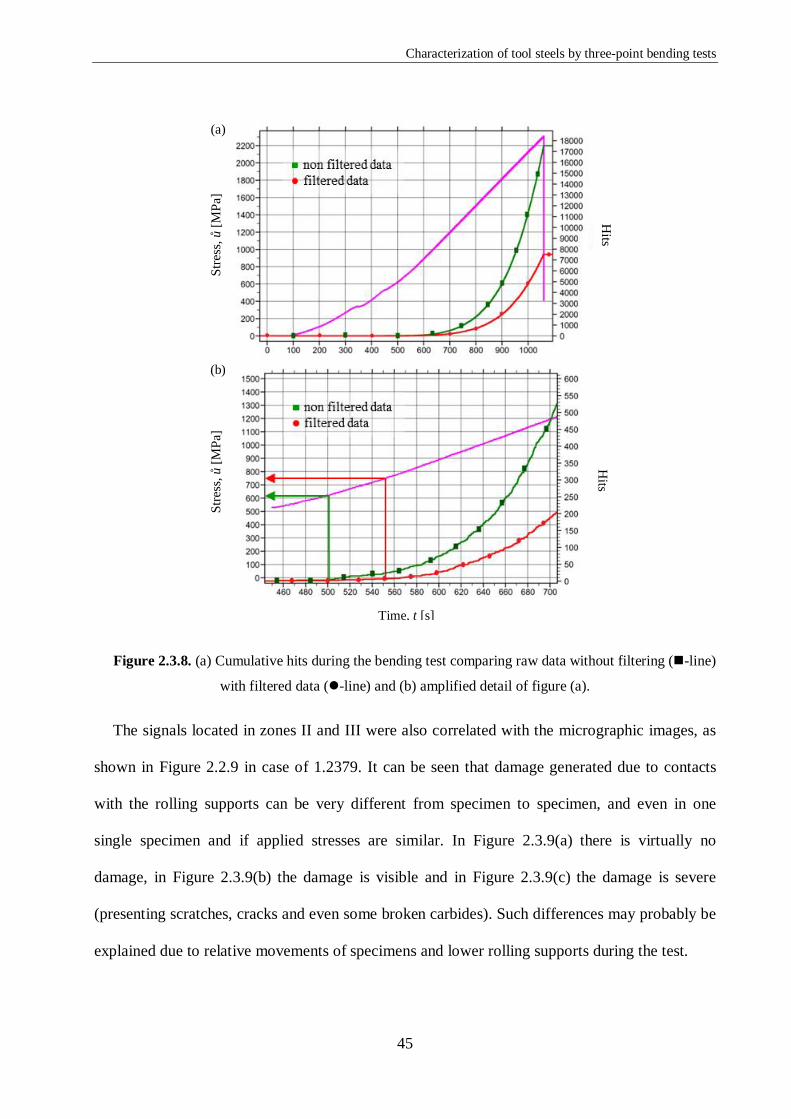
Characterization of tool steels by three-point bending tests
45
Figure 2.3.8. (a) Cumulative hits during the bending test comparing raw data without filtering (n-line)
with filtered data (l-line) and (b) amplified detail of figure (a).
The signals located in zones II and III were also correlated with the micrographic images, as
shown in Figure 2.2.9 in case of 1.2379. It can be seen that damage generated due to contacts
with the rolling supports can be very different from specimen to specimen, and even in one
single specimen and if applied stresses are similar. In Figure 2.3.9(a) there is virtually no
damage, in Figure 2.3.9(b) the damage is visible and in Figure 2.3.9(c) the damage is severe
(presenting scratches, cracks and even some broken carbides). Such differences may probably be
explained due to relative movements of specimens and lower rolling supports during the test.
Stre
ss, σ
[MPa
]
Time, t [s]
Hits
(a)
Stre
ss, σ
[MPa
]
(b)
Hits

Chapter 2
46
Figure 2.3.9. Confocal images of the contact surface of some DIN 1.2379 specimens at rod contact
area: (a) practically non-existent damage in specimen P3, (b) specimen-P4 presents some damage (c) and
(d) specimen-P2 presents severe damage and low damage in each rod respectively.
Figure 2.3.10 shows the cumulative unfiltered hits that reach S2 and S3 first for two different
specimens. In both cases the cumulative number of hits increases exponentially during linear
load increase. At the beginning of the tests, with low loads, there is no damage to the specimen
and practically no hits are getting to sensors S2 or S3. When damage is generated in the surface
of the specimen in contact with rolling supports, some hits appear and grow continually until the
load is removed. Moreover, the total number of hits in these sensors is related to the severity of
the damage induced in the specimen. Specimen P3 presented low damage on the contact surface
(Figure 2.3.9(a)) and similar results were observed in both contact surfaces in zone II and III.
(a) DIN1.2379 Specimen P3 (σ = 2429 MPa) (b) DIN1.2379 Specimen P4 (σ = 2200 MPa)
(c) DIN1.2379 Specimen P2 (σ = 2524 MPa), Left rod (d) DIN1.2379 Specimen P2 (σ=2524 MPa) Right rod

Characterization of tool steels by three-point bending tests
47
The number of hits related to contact damage is presented in cumulative form in Figure
2.3.10(a). S1 and S2 present equal behavior and a similar total number of hits. Instead, specimen
P2 presents two different behaviors at the contact area; at one area (in zone II) severe contact
damage were observed (Figure 2.3.9(c)), while at the other roller support contact area there is
almost no damage (Figure 2.3.9(d)). The sensor mounted at the closest position to this damaged
surface was S2 with more than 400 hits (Figure 2.3.10(b)), while signals with first arrival to S3,
mounted near the non-damaged surface, only presented 60 hits. It allows stating that there is a
strong relationship between this cluster of signals and the observed contact damage.
Figure 2.3.10. Cumulative hits originating in zones II and III and maximum stress during a three-point
bending test of DIN 1.2379 specimens: (a) specimen P3 (practically non-existent damage) and (b)
specimen P2 with different damage severity in the contact with lower rolling supports.
2.3.6. Conclusions
The technique of acoustic emission measurements has been successfully applied to detect and
identify the fracture mechanisms in steels with high hardness levels (higher than 44 HRC, as a
tool steel and a spring steel) by means of three-point bending test. The main difficulty from the
AE measurements point of view is the coexistence of useful AE signals generated during the
Stre
ss, σ
[MPa
]
Hits
Time, t [s]
Stre
ss, σ
[MPa
]
Hits
Time, t [s]

Chapter 2
48
fracture events with spurious signals related to damage in the contact surfaces of the specimen
with upper central and lower supports that do not account for the specimen fracture process.
Specifically, it is found that the signal caused by the damage induced by the supports is stronger
at the beginning than that caused by the cracking of carbides and crack propagation, which is the
real fracture mechanism in the studied steels. The coexistence of both signals seriously hampers
the proper identification and evaluation of the fracture mechanisms.
Aimed at overcoming such uncertainty, a filtering protocol is proposed based on the first
segment of the waveform, which detects and filters the AE signal distortions caused by
reflections. Taking advantage of the characteristics of frequency features, the proposed filtering
analysis provides the main parameters only for the first segment of time. The analysis permits to
successfully identify the different origins of AE signals generated during the bending test that
are: background noises, damage at the contact area between the specimen and the supports and
the fracture process leading to specimen failure. The filtering process is applied to the analysis of
fracture mechanisms in a tool steel. It allows for an accurate determination of the stress level that
triggers carbide cracking, that is 800 MPa for the studied DIN 1.2379 steel. Such value was
experimentally confirmed by surface inspection of tested samples. The use of unfiltered signals
would erroneously set this carbide fracture stress level at 650 MPa, which represents an error of
close to 20%. It would give bad data to tool steel makers for the microstructural design of tool
steels and induce to misunderstandings to the tool user when trying to correlate the
micromechanical properties of the tool steel to the macroscopic behavior of industrial tools.
2.3.7. References
[1] Volodin, T.V.; Khasanov, O.L.; Konovalov, S.V.; Volodin, V.L. and Zuev, L.B.; Acoustic
emission in steel failure. Steel in Translation, 2010, Vol. 40, Nr. 12, pp. 1041-1046.

Characterization of tool steels by three-point bending tests
49
[2] Hrairi, M.; Statistical signal processing and sortinf for acoustic emission monitoring of
high-temperature pressure components. Experimental Techniques, 2009, Vol. 33, Nr. 5,
pp. 35-43.
[3] Surgeon, M. and Wevers, M.; Modal analysis of acoustic emission signals from CFRP
laminates. Non-Destructive Testing & Evaluation International (NDT&E International) ,
1999, Vol. 32, pp. 311-322.
[4] Richard D. Finlayson. Acoustic emission testing, Handbook of non-destructive evaluation.
New York (USA). McGraw-Hill: 2000.
[5] Sison, M.; Duke Jr., J.C.; Lozev, M.G. and Clemeña, G.G.; Analysis of acoustic emission
from a steel bridge hanger. Research in Nondestructive Evaluation, 1998, Vol.10, 123-145.
[6] Hall, D.J.; Booth, S. and Evans, W.T.; Use of acoustic emission to identify oxide fracture
modes. Materials Science and Technology; 1990, Vol. 6, pp. 53-55.
[7] Kaphle, M.R.; Tan, A.; Thambiratnam, D.; Chan, T.H.T.; Damage quantification
techniques in acoustic emission monitoring. In WCEAM2011 6thWorld Congress
Engineering Asset Management, 2nd – 5th October, 2011, Cincinatti, OH, USA.
[8] Trebacz, H. and Zdunek, A.; Three-point bending and acoustic emission study of adult rat
femora after immobilization and free remobilization. Journal of Biomechanics, 2006, Vol.
36, pp. 237-245.
[9] Han, Z.; Luo, H.; Cao, J.; Wang, H.; Acoustic emission during fatigue crack propagation
in a micro-alloyed steel and welds. Materials Science and Engineering A (Structural
Materials: Properties, Microstructure and Processing), Sept. 2011, Vol. 528, Nr. 25-26,
pp. 7751-7756.

Chapter 2
50
[10] Martinez-Gonzalez, E.; Picas, I.; Casellas, D.; Romeu, J.; Analysis of fracture resistance of
tool steels by means of acoustic emission. Journal of Acoustic Emission. 2010, Vol. 28, pp.
163-169.
[11] ElBatanouny, M.K.; Larosche, A.; Mazzoleni, P.; Ziehl, P.H.; Matta, F.; Zappa, E.;
Identification of cracking mechanisms in scaled FRP reinforced concrete beams using
acoustic emission. Experimental Mechanics, 2012, pp. 1-14.
[12] Pollock, A.; Material brittleness and the energetics of acoustic emission. Proceedings of
the SEM annual conference (Society of Experimental Mechanics Inc.). June 7-10, 2010,
Indianapolis, Indiana (USA).
[13] Fowler, T.J.; Blessing, J.A.; Conlisk, P.J.; Swangson, T.L.; The MONOPAC system.
Journal of Acoustic Emission. 1989, Vol. 8, Nr. 3, pp. 1-8.
[14] Miller, R.K. and McIntire, P.; Nondestructive testing handbook: acoustic emission.
Columbus (OH, USA). ASNT: 1987, pp.24.
[15] Nam, K. and Mal, A.; Characteristics of elastic waves generated by crack initiation in
aluminium alloys under fatigue loading. Journal of Materials Research. June 2001, Vol.
16, Nr. 6, pp. 1745-1751.
[16] Wevers, M. and Lambrights, K.; Applications of acoustic emission for SHM: a review.
Encyclopedia of structural health monitoring (Encyclopedia of SHM). John Wiley & Son,
Ltd., 2009.
[17] Picas, I.; Cuadrado, N.; Casellas, D., Goez, A.; Llanes, L.; Microstructural effects on the
fatigue crack nucleation in cold work tool steels, Procedia Engineering (Proc.Eng.),
Fatigue 2010, April 2010, Vol.2, Nr.1, pp. 1777-1785.
[18] Fukaura, K. and Ono, K. Acoustic emission analysis of carbide cracking in tool steels. .
Journal of acoustic emission. 2001, Vol. 19, pp. 91-99.

Characterization of tool steels by three-point bending test
51
2.4. Discrimination of different fracture phenomena by means of AE
2.4.1. Introduction
From the standpoint of section 2.3, this section is focused on the detection in real time of the
elastic wave signals generated during monotonic three point bending tests, and which can be
related to initiation and growth of cracks in the microstructure. In order to classify the different
signal spectrum characteristics generated by tool steels of different microstructural features, this
study deals with two tool steels with different size, geometry and distribution of primary carbides
in the metallic matrix.
2.4.2. Experimental procedure
2.4.2.1. Materials
Two different cold work tool steels were considered in this study. The first type is a
conventional ledeburitic high-carbon, high-chromium tool steel DIN 1.2379 (AISI D2). The
second is a special grade of cold work tool steel developed by ROVALMA S.A., named HWS,
which in comparison to the aforementioned 1.2379 has lower carbon and chromium content but
more vanadium. 1.2379 is obtained by ingot metallurgy routes while HWS is produced by
powder metallurgy (PM). The main alloying elements found in their chemical composition are
shown in Table 2.4.1.

Chapter 2
52
Table 2.4.1. Main allowing elements in the chemical composition of the studied steels (in wt%).
Steel C Cr Mo V W
1.2379 1.5 - 1.6 11.0 - 12.0 0.6 - 0.8 0.9 - 1.0 -
HWS 0.9 - 1.2 6.8 – 8.5 - 2.5 – 3.0 1.1 – 1.4
Prismatic samples were extracted from forged and annealed commercial bars parallel to the
forging direction. Heat treatment was applied to the samples of each material in order to get a
hardness level of 60 – 62 HRC, as summarized in Table 2. The bending strength, σR, of these
materials was reported by Picas et al. [1], and the fracture toughness, KIC, was determined as
specified in the ASTM E 399-90 standard. These values are also shown in Table 2.4.2.
Table 2.4.2. Heat treatment applied to the studied materials and obtained hardness, bending
strength (σR) and fracture toughness (K1C).
Steel Austenitizing
(quench in oil)
Tempering HRC σR [MPa] [1] K1C [MPa·m1/2]
1.2379 1050 ºC for 30 min 550 ºC for 2 h (x2) 60 - 62 2847 ± 96 28
HWS 1060 ºC for 35 min 540 ºC for 2 h (x3) 60 - 62 4382 ± 111 21
2.4.2.2. Specimens
Samples dimensions were w = 8 mm, h = 6 mm and l =120 mm (Figure 2.4.1). Samples were
mechanically ground and their corners were rounded to avoid stress concentrations and to
remove any defects introduced during sample preparation. Faces subject to tensile stress during
three point bending tests were carefully polished to a mirror-like finish using colloidal silica
particles with approximately 40 nm sizes.

Characterization of tool steels by three-point bending test
53
lh
r
Polished face
x
0
r
w
Figure 2.4.1. Schema of the samples used in this study.
2.4.2.3. Microstructural inspection and fracture tests
Microstructural inspection of the samples was carried out using a Field Emission Scanning
Electron Microscope (FE-SEM). Fracture tests were performed by means of three point bending
tests with a constant span length of 40 mm in a universal testing machine, using an articulated
fixture to minimize torsion effects. The applied displacement rate was 0.01 mm/min. 5 samples
of each material were monitored until final fracture, while 3 samples were analyzed by means of
stepwise loading, as illustrated schematically in Figure 2.4.2(a). After each load step, the surface
subjected to tensile loading (Figure 2.4.2(b)) was examined by means of Confocal Microscopy
(CM) in order to relate each type of AE characteristic signal pattern to the generated damage in
the microstructure.
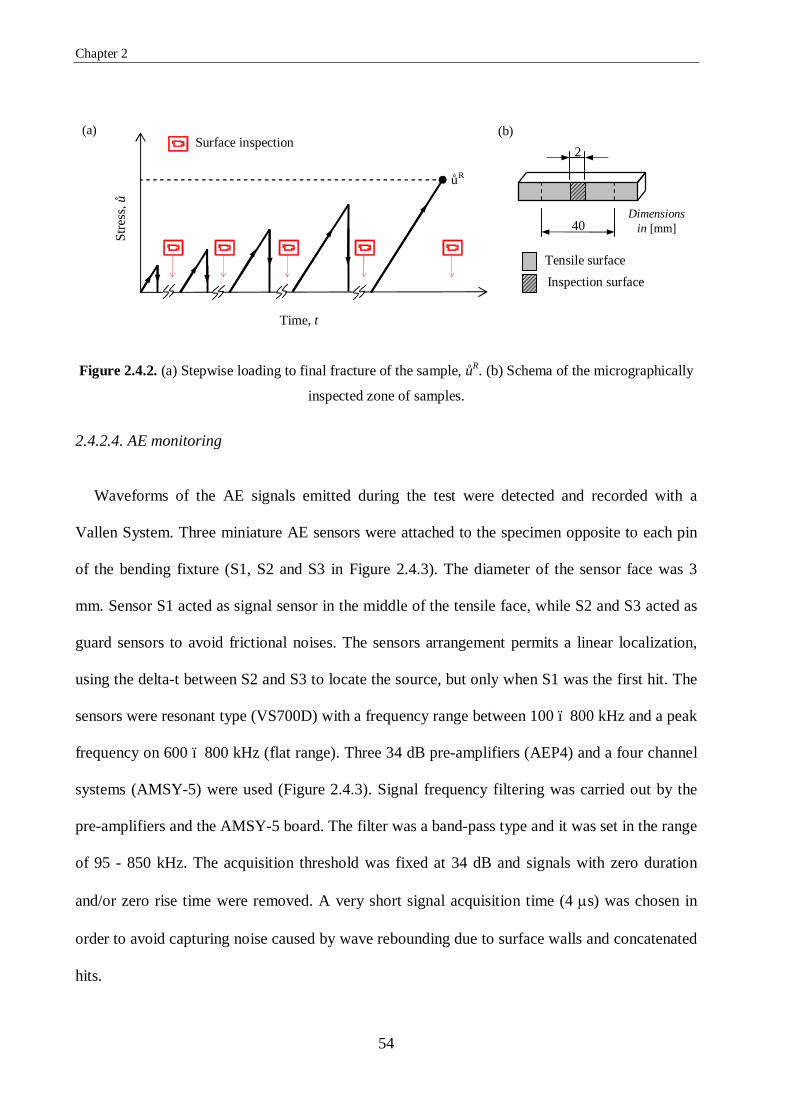
Chapter 2
54
Figure 2.4.2. (a) Stepwise loading to final fracture of the sample, σR. (b) Schema of the micrographically
inspected zone of samples.
2.4.2.4. AE monitoring
Waveforms of the AE signals emitted during the test were detected and recorded with a
Vallen System. Three miniature AE sensors were attached to the specimen opposite to each pin
of the bending fixture (S1, S2 and S3 in Figure 2.4.3). The diameter of the sensor face was 3
mm. Sensor S1 acted as signal sensor in the middle of the tensile face, while S2 and S3 acted as
guard sensors to avoid frictional noises. The sensors arrangement permits a linear localization,
using the delta-t between S2 and S3 to locate the source, but only when S1 was the first hit. The
sensors were resonant type (VS700D) with a frequency range between 100 – 800 kHz and a peak
frequency on 600 – 800 kHz (flat range). Three 34 dB pre-amplifiers (AEP4) and a four channel
systems (AMSY-5) were used (Figure 2.4.3). Signal frequency filtering was carried out by the
pre-amplifiers and the AMSY-5 board. The filter was a band-pass type and it was set in the range
of 95 - 850 kHz. The acquisition threshold was fixed at 34 dB and signals with zero duration
and/or zero rise time were removed. A very short signal acquisition time (4 µs) was chosen in
order to avoid capturing noise caused by wave rebounding due to surface walls and concatenated
hits.
40
Time, t
Stre
ss, σ
σR
2
Dimensions in [mm]
Tensile surface Inspection surface
Surface inspection (a) (b)

Characterization of tool steels by three-point bending test
55
Figure 2.4.3. Experimental set-up for the AE monitored bending test.
2.4.2.5. AE noise signals
The three channels detected signals from very small events in the sample as the load increased
during the test. AE sources were linearly localized with respect to the center of the sample (x
axis in Figure 2.4.1 and Figure 2.4.3) by their different capturing times in the sensors. The
acquired signals came from three main sources: (a) friction, (b) damage in those zones of the
specimen directly subjected to the contact pressures exerted by the bending fixture pins and (c)
damage at the center of the tensile face of the specimen as a result of the stresses applied.
Sources (a) and (b) were removed during analysis as they were related to noise phenomena
following the procedure described in section 2.3.3. Only (c) signals were taken into account,
directly reflecting the evolution of damage in the microstructure. The area of interest comprised
the interval from x = -15 mm to x = 15 mm (Figure 2.4.3). Any AE signal not located in this
interval was filtered out using linear location. Recording exclusively events located in this
S2
Span, 40 mm
S1
x
Pre- Amplifiers
(34 dB)
AE signal
Filters Amplifiers
AE signal Analyzer and
Event Detector +
Computer Data Storage
Post-Processor Polish face

Chapter 2
56
interval, the delta-t between S2 and S3 was used to locate the source but only when S1 was the
first hit.
2.4.2.6. Analysis of AE waveforms
According to Fukaura and Ono [2], the waveforms related to cracks in carbides and cracks in
the matrix can hardly be distinguished because they both correspond to crack opening types.
Classifying the sources of AE signals by means of standard signal features; i.e. amplitude, rise
time, duration, etc., was not possible in this work because waveforms were highly distorted
already after a few micro-seconds (see the example in Figure 2.4.4 produced by a pencil lead
break on the specimen surface). Such distortions were caused by reflections, changes of modes,
etc., specially accentuated due to the small specimen dimensions and the low attenuation of the
material.
Figure 2.4.4. (a) Waveform produced by a Hsu-Nielsen source (when the graphite enclosed in a lead
pencil breaks). (b) Zoom of the initial cycles of this artificial source.
2.4.3. Results
2.4.3.1. Microstructural analysis
Am
plitu
de, A
[mV
]
Am
plitu
de, A
[mV
]
(a) (b)
Time, t [µs] Time, t [µs]

Characterization of tool steels by three-point bending test
57
In Figure 2.4.5 the microstructure of the steels studied can be observed. The microstructure of
1.2379 was markedly anisotropic, with large carbide stringers forming bands in the metallic
matrix (Figure 2.4.5(a)). The primary carbides of this steel were rather large and had irregular
morphologies. HWS showed the typical microstructure of PM steels with very small spherical
carbides distributed in the matrix with no preferred orientation (Figure 2.4.5 (b)).
Figure 2.4.5. Microstructure of the studied tool steels: (a) 1.2379 and (b) HWS.
2.4.3.2. Identification of characteristic AE signal patterns in bending tests of 1.2379 under
monotonic loading
Fig. 2.4.6 shows AE results from the bending tests under monotonic loading for 1.2379. This
diagram plots the cumulative number of hits as a function of the stress applied and the location
of each signal on the sample surface (with respect to the centre of the sample). As can be seen,
the highest amount of signals was generated at the centre of the sample (x = 0, where the applied
stress was the highest during the three point bending test), and the quantity of emitted signal
continuously increased with the applied stress.

Chapter 2
58
Figure 2.4.6. Cumulated number of hits in function of the stress applied during the bending test and
the location of the signals at the sample surface (the x axis (X-Loc.) refers to the position of the signal
with respect to the center of the specimen, the y axis refers to the applied stress and the z axis to the
cumulated number of registered hits).
A closer examination of the AE signals allowed them to be classified into two categories
depending on the characteristics of their spectra. As shown in Figure 2.4.7(a), the first type of
signal (Type 1) had a peak frequency (Fmax) centered at 280 kHz, while the Fmax of the second
type (Type 2) was around 660 kHz. Figure 2.4.7(b) shows that at the beginning of the test, no AE
activity was detected. At a certain applied stress level, a Type 1 AE signals started to be recorded
(l-line). These were burst-type signals, and the hit rate increased along with the applied stress.
Later, as the stress increased, Type 2 signals started to appear (n-line). These signals also
increased in number with the applied stress, but at the moment of final fracture they were less
numerous than the Type 1 signals.

Characterization of tool steels by three-point bending test
59
Figure 2.4.7. (a) Number of located hits on the interest length of specimen vs. peak frequency (Fmax) for
the two signals registered; (b) Cumulated number of hits vs applied stress during a monotonic bending
test in which two different types of AE signals could be identified.
2.4.3.3. Relationship between AE signals and micro-damage during bending tests of 1.2379
under monotonic loading
Stepwise bending tests made it possible to inspect the tensile surface of the samples at
different increasing stress levels, and to correlate the registered AE data (specifically, the two
different identified signal types) with the micro-damage observed in the microstructure.
Peak frequency, Fmax [kHz]
Hits
(a)
(a)
(b)
Stre
ss, σ
[MPa
]
Time, t [s]

Chapter 2
60
Figure 2.4.8(a) shows the cumulated number of hits as a function of the applied stress, during
the first step in the loading. This test was stopped at 800 MPa, as soon as the first signals were
detected. These signals answered to the same pattern as those of Type 1 identified before.
However, no damage could be observed at the sample surface, as shown in Figure 2.4.9(a); likely
something happened at the microstructure but it could not be detected yet.
The next test was stopped at 2200 MPa, when a higher quantity of AE signal was detected.
Practically all signals responded to the Type 1 characteristics previously identified, and a few
Type 2 signals were first detected (Figure 2.4.8(b)). In this case, the first cracks were observed in
the microstructure and they were located at primary carbides (Figures 2.4.9(b) and 2.4.9(c)).
However despite many carbides being broken, none of the cracks thus nucleated were observed
to have started propagating through the metallic matrix surrounding the broken carbide.
The last load step at 2600 MPa revealed a notable increase of Type 2 signals, even though the
number of Type 1 signals had not ceased to increase (Figure 2.4.8(c)), along with the number of
broken carbides in the sample. Inspection of the surface made it possible to observe that some
cracks had now propagated through the metallic matrix (Figure 2.4.9(d)).
Drawing on these results, the Type 1 and Type 2 AE signals were related to different damage
mechanisms occurring in 1.2379 samples as the applied stress increased. The Type 1 signals
corresponded to the breakage of carbides in the microstructure, i.e. nucleation of cracks, while
the Type 2 signals were produced by the subsequent propagation of these cracks through the
metallic matrix.
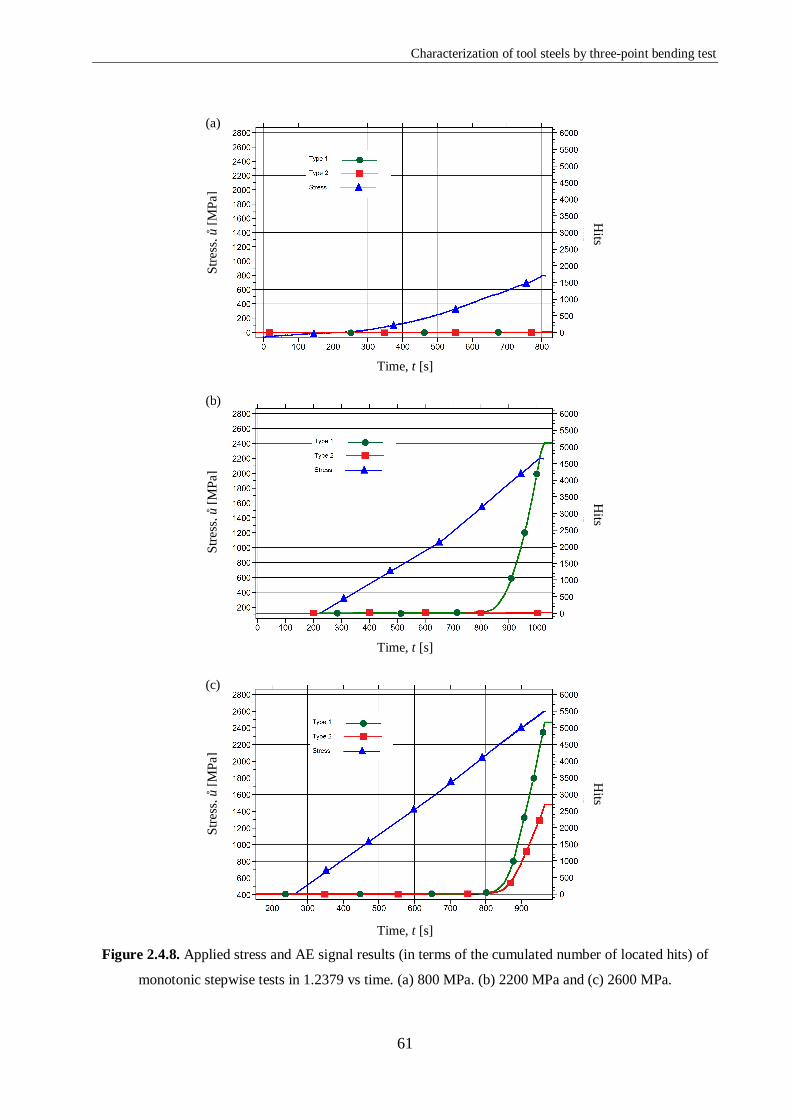
Characterization of tool steels by three-point bending test
61
Figure 2.4.8. Applied stress and AE signal results (in terms of the cumulated number of located hits) of
monotonic stepwise tests in 1.2379 vs time. (a) 800 MPa. (b) 2200 MPa and (c) 2600 MPa.
Time, t [s]
Time, t [s]
Time, t [s]
Stre
ss, σ
[MPa
] St
ress
, σ [M
Pa]
Stre
ss, σ
[MPa
]
(a)
(b)
(c)
Hits
Hits
Hits
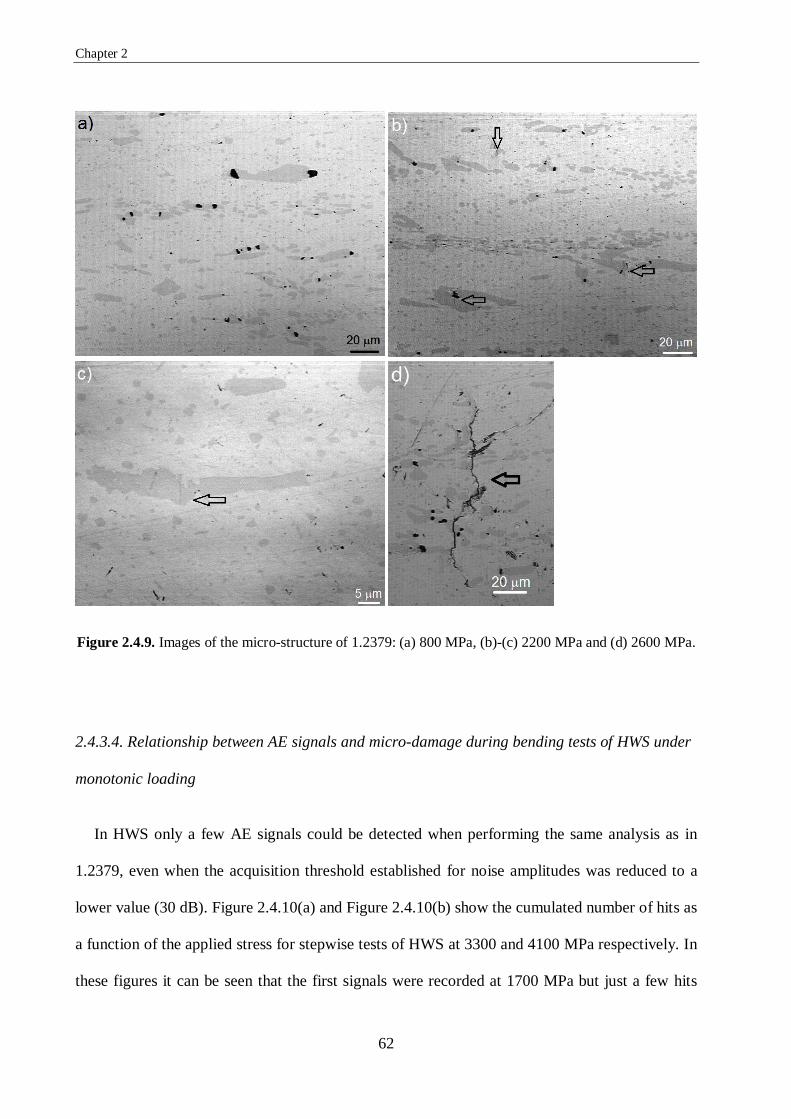
Chapter 2
62
Figure 2.4.9. Images of the micro-structure of 1.2379: (a) 800 MPa, (b)-(c) 2200 MPa and (d) 2600 MPa.
2.4.3.4. Relationship between AE signals and micro-damage during bending tests of HWS under
monotonic loading
In HWS only a few AE signals could be detected when performing the same analysis as in
1.2379, even when the acquisition threshold established for noise amplitudes was reduced to a
lower value (30 dB). Figure 2.4.10(a) and Figure 2.4.10(b) show the cumulated number of hits as
a function of the applied stress for stepwise tests of HWS at 3300 and 4100 MPa respectively. In
these figures it can be seen that the first signals were recorded at 1700 MPa but just a few hits

Characterization of tool steels by three-point bending test
63
were detected and they were mostly Type 1 signals. With only these small amounts of signals
being detected, and given the very small microstructural size of HWS, no cracks could be
observed on the surface at 3300 MPa (as shown in Figure 2.4.11(a)). However, when the load
was increased to 4100 MPa, there were just a very few small cracks nucleated in the
microstructure, both at broken primary carbides and at inclusion particles, as shown in Figures
2.4.11(b) and 2.4.11(c).
Figure 2.4.10. Applied stress and AE signal results (in terms of the cumulated number of located hits) of
monotonic stepwise tests in HWS vs. time: (a) 3300 MPa and (b) 4100 MPa.
Time, t [s]
Time, t [s]
Stre
ss, σ
[MPa
] H
its St
ress
, σ [M
Pa]
Hits
(b)
(a)
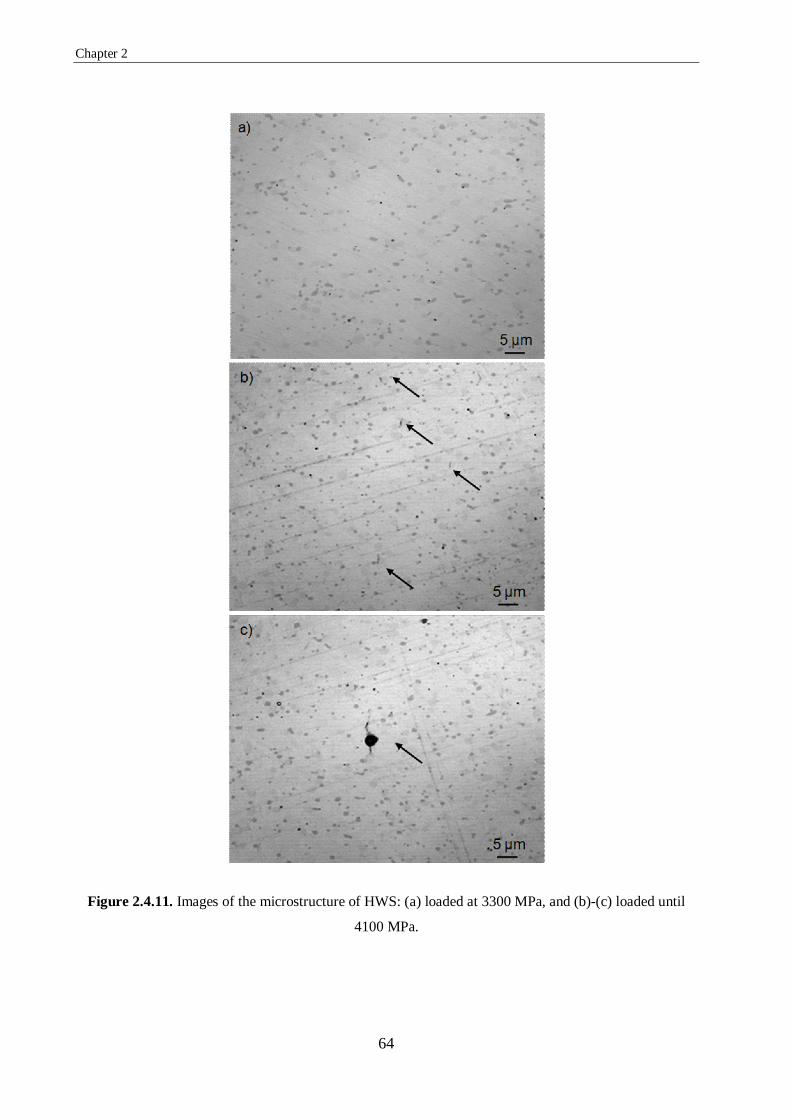
Chapter 2
64
Figure 2.4.11. Images of the microstructure of HWS: (a) loaded at 3300 MPa, and (b)-(c) loaded until
4100 MPa.

Characterization of tool steels by three-point bending test
65
2.4.4. Discussion
The data shown above these lines demonstrated that the AE technique, coupled to the bending
tests under monotonic conditions, was able to provide accurate information regarding the acting
micro-mechanical and damage mechanisms of 1.2379, the ingot metallurgic steel. In this case,
the nucleation and propagation of cracks in the microstructure was well identified by means of
two different types of AE signals reporting respectively, the breakage of carbides in the
microstructure, i.e. the nucleation of cracks, and the moment when these cracks left the carbide
and grew through the metallic matrix, i.e. the propagation of cracks. Therefore, this technique
provided a unique and very accurate tool to determine the threshold stresses at which carbides
started to break and thus, the stresses at which the first cracks were nucleated.
In case of HWS, the PM steel, it was found that even though the first signals started at 1700
MPa, only very few hits were registered compared to the high amounts obtained with 1.2379.
These signals corresponded to the Type 1 previously defined and therefore, in correlation to what
it was observed in 1.2379, some cracks were expected to have nucleated in the microstructure.
However, no damage could be identified on the surface until a stress of about 4000 MPa was
applied. At that moment, very small cracks were detected in primary carbides and inclusions. It
is worth pointing out that practically no Type 2 signals were recorded before the final fracture of
the sample, nor any propagation of cracks. This meant that the very high fracture resistance of
HWS was mainly due to the contribution of a very high resistance to crack nucleation, but that
the propagation of the nucleated cracks to final fracture took place very rapidly (in a very brittle-
like manner).

Chapter 2
66
In order to shed light on these phenomena, especially on the differences between the two
steels, the concepts of Linear Elastic Fracture Mechanics (LEFM) were used. A basic equation of
LEFM is shown in Eq. 2.4.1, where K is the acting stress intensity factor, Y a geometrical
correction factor calculated after Newman and Raju [3], σ the applied stress and a the crack
length:
aYK ⋅⋅= σ (Eq. 2.4.1)
Under such high applied stresses, as those sustained by HWS (e.g. 4000 MPa), it is reasonable
to say that even if a very small crack is nucleated at a carbide in the microstructure (with an a
value of 5 μm for example), K of this crack can already attain values close to those of the
fracture toughness of the material, KIC, and hence, fracture may be imminent (for a = 5 μm, σ =
4000 MPa and Y = 1.2, K = 11 MPa·m1/2 while KIC is 21 MPa·m1/2). Furthermore many cracks
are nucleated at such stress levels and thus, coalescence of these cracks is prone to occur and
rapidly lead to fracture.
In 1.2379 the first cracks were nucleated at much lower stress values (e.g. 1500 MPa) in the
large primary carbides embedded in this steel (higher a values, e.g. 15 μm), but as shown in
Table 2, the KIC of 1.2379 is higher than that of HWS (28 vs 21 MPa·m1/2 respectively). Thus,
cracks may propagate to longer lengths before critical failure takes place (K assuming a = 15 μm,
σ = 1500 MPa and Y = 1.2 is equal to 7 MPa·m1/2 and KIC 28 MPa·m1/2), and they would be
easier to be identified both by visual inspection of the surface and by means of AE techniques. In
addition, the much larger primary carbides of 1.2379 compared to HWS would lead to the
propagation of a relatively large number of cracks on the surface (where the stresses during the
three points bending test are maxima) instead of perhaps only a single crack inside the material
(as could have been the case if there were a sufficiently large inclusion in the interior of an HWS

Characterization of tool steels by three-point bending test
67
sample). Therefore, cracks in 1.2379 would always be observed by surface inspections, while
those of HWS would not.
In any case, the results obtained in the present study suggested that further work should be
devoted to characterizing the fracture phenomena in steels with very fine microstructures, such
as powder metallurgy tool steels. The findings of this investigation were not enough to clarify
whether cracks really nucleated in the microstructure of this PM steel at stresses around 1700
MPa, or whether the AE technique introduced in this work was insufficient to identify the initial
stress level for crack nucleation in HWS samples.
Only a very little AE activity was detected in the tests on HWS steel, and this has been related
to the small sizes of the nucleated cracks. This brings to mind the question whether the HWS
steel may have been producing events that were below the detection threshold of the system..
Further improvements to the present work will consider the use of sensors specially adapted for
low amplitude signals in the testing of HWS, so that even smaller events in the microstructure
can be captured and analyzed.
2.4.5. Conclusions
The coupling in this study of AE and CM techniques with bending fracture tests provided
helpful results for understanding in great detail the failure mechanisms of tool steels under such
applied loading, as well as the interactions of their microstructural constituents. An ingot
metallurgy steel and a powder metallurgy steel, analyzed by this means, had very different
microstructural features such as the size, geometry and distribution of the primary carbides
embedded. In the first of the tool steels studied, DIN 1.2379, two different AE signal wave

Chapter 2
68
patterns were identified during a fracture test. With the help of CM, these signals were
respectively assigned to crack nucleation in primary carbides (Type 1), and the propagation of
these cracks through the metallic matrix (Type 2). The second of the studied materials, HWS
steel manufactured by powder metallurgy, had a very fine microstructure with very small
carbides distributed homogeneously in the matrix. In this steel, some Type 1 AE signals started
to be detected at a certain applied load, but no damage could be observed at the surface of the
sample until much higher applied stresses were applied. Type 2 AE signals were practically
nonexistent in this material moreover, no propagating cracks were observed with CM. A fracture
mechanics analysis made it possible to understand why such different behaviors were observed
in these two materials. However, further work is required to rationalize the AE observations in
HWS, and for that, new and more sensitive tests are planned in order to ensure a more accurate
characterization of the phenomena taking place in the microstructure.
2.4.6. References
[1] Picas, I.; Hernández, R.; Casellas, D.; Valls, I.; Strategies to increase the tool performance
in punching operations of UHSS. Proceedings of the IDDRG Conference, Graz (Austria),
2010, pp. 325-334.
[2] Fukaura K, Ono K (2001) Acoustic emission analysis of carbide cracking in tool steels. J.
Acoustic Emission 19:91-9
[3] Newman JC, Raju IS (1984) Stress intensity factor equations for cracks in three
dimensional finite bodies subjected to tension and bending loads. NASA Technical
Memorandum 85793.

69
Chapter 3: Damage induced by spherical indentation test
3.1. Introduction
Failure detection in tools is a fundamental issue in manufacturing processes, as their
premature failure is one of the most important factors – and directly reflected – in the price of
manufactured parts. Thus, understanding fracture events in tools is crucial for foreseeing tool
lifetime and further developing tool steels with an improved mechanical performance [1,2].
Spherical indentation, also known as Hertzian indentation [3, 4], is a widely-applied test due
its experimental simplicity and the small sample volume required for the study of contact
mechanics. The spherical indentation technique allows the simulation of a typical “blunt” in-
service condition [5], where the stress field distribution beneath the contact may be similar to
those observed in shaping tools. The advantage of spherical indentation over other sharp
indentations is the complete evolution of damage modes, as a progressive transition from initial
elastic to final full plastic contact. This behavior makes the Hertzian indentation technique a
useful tool in assessing damage mechanisms (e.g. cracks) which may occur in the elastic field,
plastic field or the transition between both.

Chapter 3
70
Furthermore, indentation tests can be monitored by means of AE as a useful in-service
damage detection technique [6,7]. The AE technique is based on capturing on the surface of a
specimen or component the transient elastic waves that are generated when a release of energy is
produced within a material caused by a structural alteration, such as a crack or a dislocation [8].
This technique is the most common way of on-line monitoring of brittle coating failure in
Scratch and Micro-Indentation testing [9,10]. However, most commercially-available
instruments present poor information since they only supply an integrated RMS signal, which is
sensitive to friction and poses difficulties in detecting low-medium elastic energy events that
occur [9], for instance, carbide cracking in tool steels.
Spherical indentation tests monitored by AE have been widely used in different materials to
identify the typical cone or radial cracks produced by the test [4]. It is the first fracture
mechanism that occurs during the Hertzian loading of brittle materials. Ceramics have been
analysed by AE to detect the initiation and propagation of ring cracks [11-13]. The behavior and
failure mechanisms of coated samples with different substrate and coating mechanical properties
have been studied by means of AE [9,14] and even metal foams for the automotive and
aerospace industry [15]. In general, all these studies deal with homogeneous materials; Padture
[16] presents the different crack propagation between the homogeneous and heterogeneous
structure of silicone carbide when fatigue spherical contact is applied. Nevertheless, Guiberteau
et al. [17] performed AE-monitoring on a spherical indentation test to investigate the effect of
grain size in deformation and microfracture in polycrystalline alumina. The results reveal
differences from an ideally brittle response which are associated with the generation of a
deformation-microfracture damage zone in the confined region of strong compression and shear
stresses beneath the indenter. The fully-developed damage zone is made up of an accumulation
of microstructurally-discrete events, each consisting of some kind of intergrain shear faulting

Damage induced by spherical indentation test
71
accompanied by intergrain microcracking. This cumulative damage zone is quite different from
the continuous Hertzian cone fracture that occurs in the weak tensile region outside the contact
circle in classically homogeneous brittle materials. The results also confirmed that higher size
grain ceramics are more sensitive to these micro-fractures by shear stress.
Tool steels have a non-homogeneous microstructure, and carbide cracking is the origin of
cracks in these steels. Thus, obtaining information about carbide cracking during the indentation
test prior to the appearance of cracks in the metallic matrix would be efficient in studying tool
behavior. Some works have studied the mechanical properties of tool steels and coated tool steels
by spherical indentation and other indentations methods [18-22]. Most of them focus on
detecting cracks and not on microscopic damage such as broken carbides or precipitates. For this
purpose, micro- or nano- indentation tests are performed which break them by directly applying
the load on the carbide; see, for example, references [23,24]. To the best of the authors’
knowledge, the fracture detection of these hard particles by AE produced during spherical
indentation has not yet been analysed. In the previous chapter, AE monitoring on three-point
bending tests have been performed to determine the stress level at which primary carbides of
some cold-work tool steels begin to break. In that chapter, the carbide cracking mechanism was
due to tensile stress. Although the information obtained is useful for studying the properties of
carbides, tool-shaping is subject to more complex loading conditions [25] more similar to that
obtained by Hertzian indentation.
This chapter describes an AE-instrumented spherical indentation test to identify the breakage
of carbides while the indentation stress remains lower the radial crack stress. According to the
results obtained in other materials [26,27], carbide fractures are expected due to the shear stress

Chapter 3
72
produced under the indenter contact. The article assesses the contact response of commercial tool
steel under monotonic load up to 3000 N (elastic field) and 5000 N (plastic field).
3.2. Spherical indentation test
The problem of elastic contact between two bodies has been widely studied in literature [4,28-
30] due to the interest of such theoretical and practical applications. Considering a frictionless
contact of a rigid material sphere with a radius R, at normal load P, on a flat continuum specimen
(Figure 3.1), if the load reaches a critical value Pc, circular cracks with a radius r0 (slightly larger
than radius a of the contact between the ball and the material) are formed. The field is initially
elastic. From a critical load, circumferential or cone cracks on the specimen surface (“brittle
mode”) or a subsurface deformation zone (“plastic mode”) appear. This research is focused on
the subsurface damage and therefore the basic features of the stress fields associated with this
region are outlined here.
The test makes it possible to follow the entire evolution of damage modes, as a progressive
transition from initial elasticity to plasticity (Figure 3.2). When an elastic sphere is pressed
against the surface of an elastic material, the maximum shear stress of the specimen occurs at the
axis of the load at a depth of ≈0.5·a below the contact surface (Figure 3.1):
0max ·48.0 p=τ (Eq. 3.1)

Damage induced by spherical indentation test
73
Figure 3.1. Hertzian contact of sphere on flat specimen. Deformations are exaggerated for clarity. a is the
contact radius, r0 is the crack radius at the surface of the specimen, R is the radius of the ball indenter and
P is the indentation load.
In an elastic–plastic material, yielding first occurs below the surface where the shear stress is
maximum. At this point, when the yield is incipient, the applied load P is identified with the
yield load PY and the Hertzian solution still holds [3] (Figure 3.2). In small application loads the
tool steel response could be assumed as having an elastic or “pseudo-elastic” behavior because it
exhibited a total recovery in depth penetration upon unloading. Within this context, the basic
Hertzian solution was used to predict the linear elastic relation of the indentation stress-strain
curve using the following equation [4]:
=Ra
·s·π·4
E·3p0 (Eq. 3.2)
where: E is the Young´s modulus of the cold-work tool steel and s is a dimensionless
coefficient ( ( ) ( ) ( )[ ]'EE'υ1υ1169s 22 += and υ and υ’ are the material and indenter
Poisson´s ratio, and E’ is the Young’s modulus indenter. Eq.3.2 is the fundamental equation of
a
R
P
specimen
r0
plastic deformation cone cracks

Chapter 3
74
the Hertzian theory relating indentation stress (p0) and indentation strain (a/R) in the elastic
range.
Figure 3.2. Schematic of the evolution in the deformed zone under the indentation for: (a) p0 = pγ, (b) p0
> pγ and (c) p0 >> pγ.
3.3. Experimental method
3.3.1. Material
Commercial cold-work tool steel was selected for the study. It is a ledeburitic steel obtained
by ingot metallurgy routes. The main elements forming founded in its chemical composition are
shown in Table 3.1. Heat treatment was applied to the samples in order to obtain a hardness level
of 60 – 62 HRC. This steel presents considerable toughness and a remarkably high compressive
strength together with good wear resistance.
Table 3.1. Main alloying elements in the chemical composition of the studied steel (in weight percent %).
C Cr Mo V W Others
1.2 – 1.3 8.0 – 9.0 2.0 – 3.0 1.0 – 1.5 - + Nb +Al
P
P (a)
P
(b)
P (c)

Damage induced by spherical indentation test
75
This steel presented a total percentage of 7.9 % primary carbides of the following types:
6.10% are M7C3, 0.80% are MC and 1.00% are M6C (see Figure 3.3). In Table 3.2 the mean
carbide sizes and morphologies are shown for M7C3, MC and M6C. The size distribution of the
primary carbides was determined by means of image analysis using a minimum of 15 images.
Backscatter detection was employed to contrast carbides and metallic matrix and classify
carbides with different chemical compositions. Images were randomly taken at 500X. The size of
primary carbides was determined in terms of the equivalent diameter, ECD, minimum diameter,
Dmin and maximum diameter, Dmax. The ECD is the diameter of a circle that has an area equal to
the area of the carbide. Dmin and Dmax of a particle for angles in the range 0º through 179º with
step width 1º. The morphology was assessed by means of the aspect ratio, AR, sphericity, ψ, and
shape factor, SF. AR is the maximum ratio of width and height of a bounding rectangle of the
particle. Sphericity is described as the ‘roundness of the particle by using central moments, being
1 for a spherical particle while for all other particles it is smaller than 1. More information about
these values and how they were measured can be found in [31].
10 μm
M7C3
MCM6C
Figure 3.3. Backscatter diffraction images showing the carbides identified in the microstructure.

Chapter 3
76
Table 3.2. Mean carbides size and geometry in terms of ECD, Dmin, Dmax, AR, ψ and SF.
Carbide ECD [μm] Dmin [μm] Dmax [μm] AR ψ SF
M7C3 11.2 ± 0.7 10.3 ± 6.6 21.6 ± 13.0 2.5 ± 1.2 0.2 ± 0.2 0.3 ± 0.2
MC 7.8 ± 2.8 7.3 ± 3.1 13.7 ± 4.9 2.2 ± 1.1 0.3 ± 0.2 0.3 ± 0.2
M6C 1.0 ± 0.7 0.8 ± 0.7 1.3 ± 1.3 1.7 ± 0.7 0.4 ± 0.3 0.9 ± 0.3
3.3.2. Specimens
Prismatic specimens of dimensions 40x30x20 mm were grinded and polished on one side
(indentation face).
3.3.3. Spherical indentation
Indentation tests under monotonic conditions were performed in a servohydraulic testing
machine (MTS Landmark 370.02 100Hz) and were focused on obtaining the indentation stress-
strain curves and determining the critical load for the damage emergence at the sub-surface of
steel. In doing so, normal loads (P), between 3000 N and 5000 N, were imposed by means of
trapezoidal waveform at a loading rate of 20 N·s-1 and applying the full test force during 20 s.
The indenter was a sphere of AISI 52100 steel with a curvature radius of 14 mm. Indenter
properties correspond to: 758 ± 13 HV1 hardness, 210 GPa Young’s modulus and 0.33 Poisson
ratio. The indenter balls were continually inspected and, if required, replaced to avoid the
flattening in the contact area.
Contact radius a at each given load P was estimated from the residual impression
measurement. The transition from elastic to plastic deformation was experimentally estimated by

Damage induced by spherical indentation test
77
applying low loads (between 2000 and 5000 N) on the surface of specimens sputter-coated with
gold, and employing only the residual imprints obtained from an indenter with a curvature radius
of 14 mm. In this case, although elastic recovery causes the depth of the residual imprint to be
different from the one existing when fully loaded, the radius of the contact impression remains
virtually unchanged [3]. Thus, the contact radius can be measured from the imprint in gold
coated specimens after unloading through confocal Laser scanning microscopy (CLSM).
In addition, to visualise the residual depth, emergence profiles were acquired by means of
confocal microscopy (Sensofar Plµ 2300). Metallographic characterisation was done by means
of a sequential polishing process, from the surface of the residual imprint to the sub-surface
damage.
3.3.4. Acoustic Emission
Commercial AE equipment (by Vallen Systeme Gmbh.) was used for signal detection and
analysis. Two small magnetic AE sensors were secured to the specimens in order to detect the
AE signals (Figure ). The sensors were the resonant type (VS700 D) with a frequency range of
between 100 – 800 kHz and a peak frequency of 600 – 800 kHz (flat range). Two pre-amplifiers
with a gain 34 dB of the same brand were used (EAP4). The signals were recorded and analysed
using a four-channel analyser system (AMSY-5). The system allowed waveform detection and
storage.
The position of the sensors was finally established on the lateral side of the specimen (Figure
3.4), where the signal-to-noise ratio was highest. Sensors attached to the upper flat side of the
specimen were less sensitive and more influenced by frictional noise.

Chapter 3
78
Figure 3.4. Schematic diagram for spherical indentation test.
3.3.5. Filtering noise
The test environment was noisy, and the AE signals were usually weak. Consequently, noise
identification and valid signal discrimination is critical for successful AE results [32,33]. The
most important source of unwanted signals was the hydraulic system of the testing machine
(flow noise, friction and vibration of the valves), and they were transmitted to the specimen
through the gripping system. Physical filtering was performed covering the gripping parts in
contact with specimen with PVC film. Additionally, digital filters of 95 – 850 kHz were applied
in order to eliminate most of the mechanical noises of the servohydraulic system.
Some preliminary measurements of the background noise were conducted in order to
determine the threshold level. The sensors were attached to the specimen and AE activity was
detected with amplitudes below 43 dB; thus, the threshold level was fixed at 46 dB.
Specimen
Spherical Indenter
Sensor 1 Sensor 2

Damage induced by spherical indentation test
79
3.4. Results and Discussion
3.4.1. Damage induced by spherical indentation
Figure 3.5 shows the indentation stress-strain curve, showing both the experimental and
theoretical (Eq. 2) results obtained using the measured contact radius (a), the experimental
indentation stress or mean contact pressure (p0) and strain (ε) where p0 equals P/πa2 and ε equals
a/R, [28].
Figure 3.5. Spherical indentation stress-strain curve for plastic transition.
As the load increases above PY, the yield zone expands and this relationship can change
radically. The value of Pγ is found by measuring the impressions profile of the specimens
sputter-coated with gold for different loads until plastic deformation, if any. Figure 3.6 illustrates
the evolution of the impression profile for the tool steel. In this case, the tool steel surface was
deformed elastically at low indentation pressure, and as the stress increased, the residual depth
0
0.5
1
1.5
2
2.5
3
3.5
0 0.01 0.02 0.03 0.04 0.05 0.06 0.07
Indenta tion st ress , p
0
(G Pa)
Indentation strain, a/r
Elastic Curve(Hertzian Theory)Experimental data
Indentation strain, a/r
Inde
ntat
ion
stre
ss, p
0 [G
Pa]
py

Chapter 3
80
was evidenced. Transition from elastic to plastic deformation was observed at stresses of ~2.4
GPa, similar to other cold-worked tool steels reported in previous studies [34].
1,0 1,5 2,0 2,5 3,0 3,5 4,0 4,5 5,0-1,0-0,8-0,6-0,4-0,20,00,20,4
1,0 1,5 2,0 2,5 3,0 3,5 4,0 4,5 5,0-1,0-0,8-0,6-0,4-0,20,00,20,4
1,0 1,5 2,0 2,5 3,0 3,5 4,0 4,5 5,0-1,0-0,8-0,6-0,4-0,20,00,20,4
distance (mm)
5000N
Dep
th (µ
m)
4000 N
3000 N
Figure 3.6. Remnant indentation depth profiles and imprints in cold work tool steel. Specimens sputter-
coated with gold.
Following the results obtained, two different load condition indentations were decided: a
maximum load of 3000 N to remain within the elastic range with total recovery and a second test
up to 5000 N to ensure the appearance of permanent deformation. Under these conditions, the
physical damage mechanisms expected in this material are carbide breakage, plastic deformation
and/or crack nucleation or propagation in the metallic matrix [26,27].
3.4.1. Acoustic emission results
The waveforms shown in Figure 3.7 give information about the events that take place in the
material. When a crack occurs within the material, quasi-instantaneous explosion-like energy
releases propagating stress waves in all direction. Figure 3.7(a) and Figure 3.7(b) show the

Damage induced by spherical indentation test
81
waveform of events occurring during the loading and unloading of indentation tests respectively.
The waveforms present a short duration and thus they are clear discrete burst hits, as shown in
Figure 3.7(a) and 3.7(b), which indicate the existence of well-defined local instabilities in the
material. Only when the test load exceeds 3000 N do some low amplitude continuous signals
appear which are related to the plastic deformation process (Figure 3.7(c)).
Figure 3.7. Waveforms and FFT of different events. (a) an event during loading, (b) an event during
unloading the specimen and (c) continuous type signals that appear when the load exceeds the elastic
field; these signals are related with plastic deformation.
(a)
(b)
(c)
Am
plitu
de, A
[mV
] A
mpl
itude
, A [m
V]
Am
plitu
de, A
[mV
]
Time, t [µs] Frequency, f [kHz]
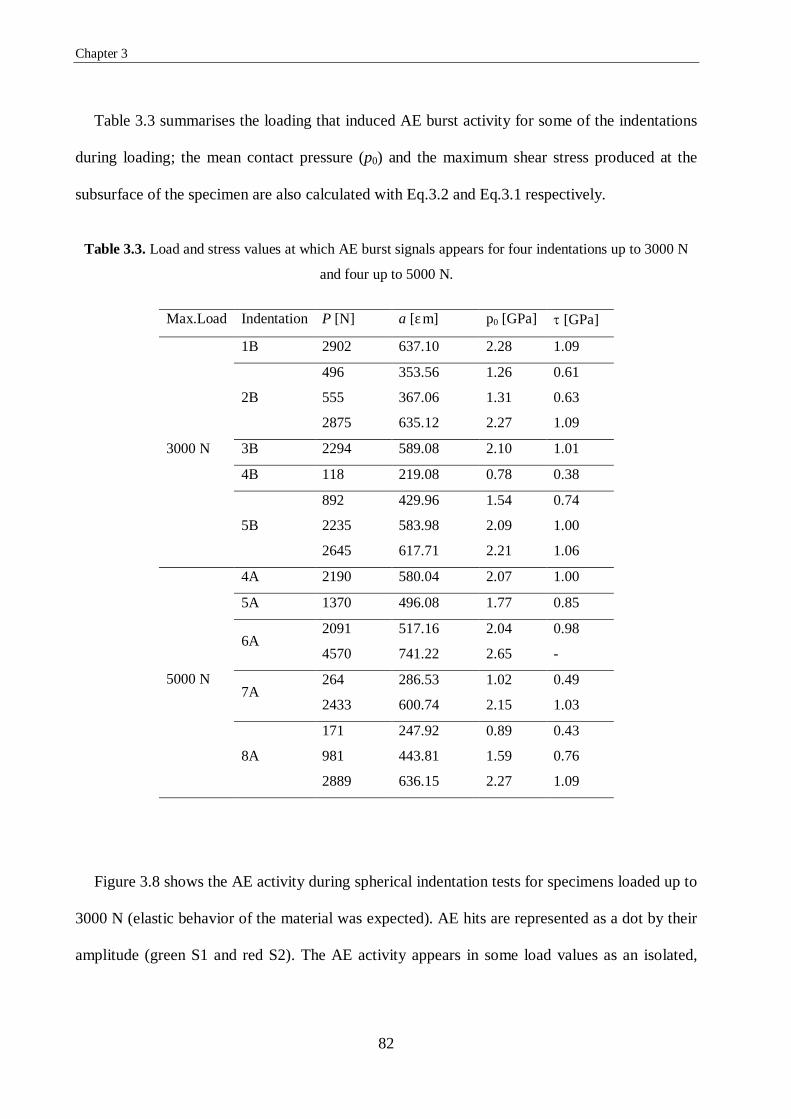
Chapter 3
82
Table 3.3 summarises the loading that induced AE burst activity for some of the indentations
during loading; the mean contact pressure (p0) and the maximum shear stress produced at the
subsurface of the specimen are also calculated with Eq.3.2 and Eq.3.1 respectively.
Table 3.3. Load and stress values at which AE burst signals appears for four indentations up to 3000 N
and four up to 5000 N.
Max.Load Indentation P [N] a [μm] p0 [GPa] τ [GPa]
3000 N
1B 2902 637.10 2.28 1.09
2B
496 353.56 1.26 0.61
555 367.06 1.31 0.63
2875 635.12 2.27 1.09
3B 2294 589.08 2.10 1.01
4B 118 219.08 0.78 0.38
5B
892 429.96 1.54 0.74
2235 583.98 2.09 1.00
2645 617.71 2.21 1.06
5000 N
4A 2190 580.04 2.07 1.00
5A 1370 496.08 1.77 0.85
6A 2091 517.16 2.04 0.98
4570 741.22 2.65 -
7A 264 286.53 1.02 0.49
2433 600.74 2.15 1.03
8A
171 247.92 0.89 0.43
981 443.81 1.59 0.76
2889 636.15 2.27 1.09
Figure 3.8 shows the AE activity during spherical indentation tests for specimens loaded up to
3000 N (elastic behavior of the material was expected). AE hits are represented as a dot by their
amplitude (green S1 and red S2). The AE activity appears in some load values as an isolated,

Damage induced by spherical indentation test
83
rapid event clearly detected by both sensors. These signals are burst type, as figure 7(a), and they
appear in all the tested specimens during loading.
Figure 3.8. Indentations Pmax = 3000N. (a) Indentation 3B (b) Indentation 5B. Green points correspond to
sensor 1 (S1) and red points to sensor 2 (S2).
Figure 3.9 shows some results obtained for loads up to 5000 N. In this case, plastic
deformation is present in the material. The AE activity detected can be classified into two types:
i) burst type signals, as in Figure 3.7(a) and 3.7(b); and ii) continuous AE activity of long
duration and low amplitude (Figure 3.7(c)), which appears at loads higher than 3000 N and it
remains during the full test load. This behavior may be related to the plastic deformation of the
material due to the absence of this AE activity for loads below the plastic yielding onset, as
shown in Figure 3.8. Also, some AE activity was found during the unloading. The most
important effect produced by the change in the stress component corresponds to the damage
mechanisms. Studman and Field [35] observed the presence of ‘radial cracks’ in the periphery of
the indentation print in carbon steels. They were attributed to hoop stresses. In fact, the authors
deduced from experimental tests that these stresses tend to be higher during unloading. In the
same way, Abudaia et al. [36] support this theory with experimental tests and a finite element
model. Thus, during unloading, the stress field changes and may provoke more carbide cracking.
Am
plitu
de, A
[mV
]
(a)
Load, P [N]
Am
plitu
de, A
[mV
]
(b)
Time, t [s] Time, t [s]
Load, P [N]

Chapter 3
84
Another possibility for these unloading signals is that the carbide damage is produced during
loading without emitting AE due to the compression field, and during unloading the stress
relaxation permits the release of AE energy.
Figure 3.9. Indentations Pmax = 5000N. (a) Specimen 7A (b) Specimen 8A. Green points correspond to
sensor 1 (S1) and red points to sensor 2 (S2).
Differences in events detection between loads could be related to the influence of
microstructural features since they determine the amount of stresses magnified in the carbide
region with respect to macroscopically-applied stress [37]. Hence, the fracture strength of the
carbides, σRC, of this steel can vary quite a lot because of the presence of carbides of different
sizes, shapes, morphologies and arrangements.
Picas [31] measured the fracture strength of primary carbides, σRC, in this steel and the values
are summarised in Table 3.4. To determine the fracture stress, some prismatic specimens were
submitted to stepwise bending tests, inspecting the tensile surface in each step. Thus, this stress
value is assumed to correspond to the fracture strength of carbides under monotonic tensile
loading. In this regard, σRC of M7C3 and MC carbides are 500 – 700 MPa and 1300 – 1500 MPa
respectively. The shapes of the M7C3 carbides are rather irregular and their size is quite high.
Am
plitu
de, A
[mV
]
(a)
Load, P [N]
Am
plitu
de, A
[mV
]
(b)
Time, t [s] Time, t [s]
Load, P [N]

Damage induced by spherical indentation test
85
The MC carbides are rounder and more regular than the M7C3, and that is why they show a
higher σRC. The M6C were too small and it was impossible to break them.
The AE burst-signals obtained correspond to carbide breakage, but in this case their fracture
is produced by shear stress, not by tensile stress. If a volume element is considered beneath the
contact surface, this is submitted to hydrostatic stresses. Figure 3.10 schematises the Hertzian
field in this zone, and -σ1 and -σ2 represent the principal compression stresses. These components
are generally unequal, thus a shear stress component acts on planes inclined to the principal axis,
attaining a maximum value ½·( σ1- σ3). As was previously reported, the maximum shear stress in
the Hertzian field occurs at ≈0.5·a below the contact surface and its value is defined in Eq.3.1.
This maximum shear stress is calculated for each load that produces AE for each specimen in
Table 3.3.
Figure 3.10. Schematic deformation-microfracture damage in tool steel. The volume element is subjected
to compressive stress –σ1 and –σ3 along the contact axis below the spherical indenter. The shear stresses
(arrows) initiate the breakage of carbides.
-σ1 -σ1
-σ3
-σ3

Chapter 3
86
Therefore it is impossible to compare the applied maximum shear stress, τ, during spherical
indentations with the carbide fracture stress, σRC. Hence, the fracture shear stress of these
carbides, τRC, is estimated based on the fracture tensile stress, σRC. With this aim, following the
failure theory of von Mises [38] τRC :
RCRC στ ·23
= (Eq. 3.3)
Table 3.4 presents σRC and the estimated τRC. The expected τRC for M7C3 are 0.43 – 0.61 GPa
and 1.1 – 1.3 GPa for MC. Observing the shear stress level related to AE during the loading
(Table 3.3) it can be concluded that the AE signals are related to the breakage of both primary
carbides caused by the shear stress produced on the subsurface of the specimen..
Table 3.4. Fracture stress of carbides: tensile fracture stress, σRC, and shear fracture stress, τRC.
Carbide σRC [MPa] τRC [MPa]
M7C3 600 ± 100 520 ± 87
MC 1400 ± 100 1212 ± 87
After unloading, the samples were cut and sequentially polished to inspect the indented
surface. Figure 3.11 shows the microscopic images of two indentation samples loaded up to 3000
N. In the images the M7C3 and the MC carbides can be seen; the first ones are the big white ones
and the smaller darker ones are the MC carbides. These samples were loaded up to 3000 N and
AE activity appeared during loading. Both images show cracks in both carbides (represented as
white arrows for M7C3 and black for MC).

Damage induced by spherical indentation test
87
Figure 3.11. Images of the microstructure of the indented plane up to 3000 N (indentation 5B): (a) White
carbides correspond to M7C3 and (b) darker ones to MC.
3.4. Conclusions
According to the experimental results obtained by means of coupling AE to spherical
indentation tests, and the microstructural observation, the following conclusions can be drawn:
- AE is a useful tool for on-line incipient damage during spherical indentation tests. Thus,
Hertzian tests monitored by AE enables the carbide breakage to be detected while the
metallic matrix is under the elastic or plastic field, before the appearance of radial cracks
on the surface of the specimen.
- Incipient damage in the microstructure was detected by AE. This technique was used to
detect cracks during the indentation test and also allows the nucleation of these cracks to
be detected.
- The stress levels at which the carbides were broken were determined by AE. These
stresses were correctly correlated by the calculated/estimated fracture stress of carbides,
in the case of M7C3 and MC.
(a) (b)

Chapter 3
88
- When an elastic field was generated by spherical indentation, the initial damage in tool
steels is due to the carbide breakage caused by shear stress produced below the
indentation contact.
- Incipient plastic deformation in the specimens was detected, and continuous AE signals
were related with plasticity.
3.5. References
[1] Advanced High Strength Steel (AHSS). Application Guidelines. Version 4.1. International
Iron & Steel Institute. Committee on Automotive Applications, June 2009.
www.worldautosteel.org.
[2] Picas, I.; Hernandez, R.; Casellas, D.; Valls, I.; Strategies to increase the tool performance
in punching operations of UHSS. R. Kollek (Ed.), Proc IDDRG, Graz, Austria (2010), pp.
325-334.
[3] L. Johnson: Contact Mechanics, Cambridge University Press, Cambridge, United
Kingdom, 1985.
[4] Lawn, B.R.; Indentation of ceramics with spheres: a century after Hertz. Journal of the
American Ceramic Society, Vol. 81 (1998), pp.1977–1994.
[5] Lawn, B.R. and Wilshaw, T.R.; Indentation fracture: principles and applications. Journal
of Materials Science, Vol. 10, Nr. 161, pp. 1049-1081, June 1975.
[6] Padture, N.P. and Lawn, B.R.; Toughness properties of a silicon carbide with an in-situ
induced heterogeneous grain structure. Journal of the American Ceramic Society, Vol. 77,
Nr. 10, pp. 2518-2522, Oct. 1994.

Damage induced by spherical indentation test
89
[7] Faisal, N.H.; Ahmed, R.; Reuben, R.L.; 2011; Indentation testing and its acoustic emission
response: applications and its emerging trends. Vol. 56, Nr. 2, pp. 98-142, March 2011.
[8] Scruby, C.B.; An introduction to acoustic emission; Journal of Physics E: Scientific
Instruments; 1987, Vol.20; Nr.8; pp.946-953; doi: 10.1088/0022-3735/20/8/001.
[9] von Stebut, J.; Lapostolle, F.; Bucsa, M.; Vallen, H.; Acoustic emission monitoring of
single cracking events and associated damage mechanism analysis in indentation and
scratch testing; Surface and Coatings Technology, Vol. 116-119, pp. 160-171, Sept. 1999.
[10] von Stebut, J.; Multi-mode scratch testing – A European standards, measurements and
testing study. Surface and Coatings Technology, Vol. 200, Nr. 1-4 Special Issue; pp. 346-
350, October 1, 2005.
[11] Wereszczak, A.A. and Johanss, K.E.; Spherical indentation of SiC, in Advances in
Ceramic Armor II: Ceramic Engineering and Science Proceedings, 2008, Vol. 27, Issue 7
(eds. L. Prokurat, A. Wereszczak and E. Lara-Curzio), John Wiley & Sons, Inc., Hoboken,
NJ, USA. Doi: 10.1002/9780470291368.ch4
[12] Bouras, S.; Zerizer, I.; Gheldane, F; Bouazza, M.T.; Bouzabata, B.; Study of the resistance
to crack propagation in alumina by acoustic emission. Ceramics International, Vol. 34, pp.
1857-1865, 2008.
[13] Wereszczak, A.A.; Daloz, W.L.; Strong, K.T.; Jadaan, O.M.; Effect of Indenter Elastic
Modulus on Hertzian Ring Crack Initiation in Silicon Carbide. International Journal of
Applied Ceramic Technology, 2011, Vol.8, pp. 885–894. doi: 10.1111/j.1744-
7402.2010.02522.x
[14] Gallego, A.; Gil, J.F.; Vico, J.M.; Ruzzante, J.E.; Piotrkowki, R.; Coating adherence in
galvanizad steel assessed by acoustic emission wavelet ananlysis. Scripta materialia;
2005, Vol.52, pp. 1069-1074.

Chapter 3
90
[15] Kádár, C.; Chmelik, F.; Lendvai, J.; Bacsán, N.; Rajkovits, Z.; Acoustic emission response
of metcomd b foams during indentation. Kovové Materiály, Vol. 42, Nr. 4, pp.265-274,
2004.
[16] Padture, N.P. and Lawn, B.R.; Contact fatigue of a silicon carbide with a heterogeneous
grain structure. Journal of the American Ceramic, 1995, Vol. 78, Nr.6, pp. 1431-1438.
[17] Guiberteau, F.; Padture, N.P.; Lawn, B.R.; Effect of grain size on hertzian contact damage
in alumina. Journal of American Ceramic Society, Vol. 77, Nr. 7, pp. 1825-1831, July
1994.
[18] Nolan, D.; Leskovsek, V.; Jencko, M.; Estimation of fracture toughness of nitride
compound layers on tool steel by application of the Vickers indentation method. Surface &
Coatings Technology, Vol. 201, Nr. 1-2, pp. 182-188, Sept. 2006
[19] Verleene, A.; Dubar, M.; Dubar, L.; Dubois, A.; Oudin, J.; Determination of a hardening
behavior law for a cold forging TiN-coated tool steel. Surface and Coatings Technology,
Vol.127, Nr. 1, pp. 52-58, May 2000
[20] Attar, F. and Johannesson, T.; Adhesion evaluation of thin ceramic coatings on tool steel
using the scratch testing technique. Surface and Coatings Technology, Vol. 78, Nr. 1-3, pp.
87-102, Jan. 1996.
[21] Larsson, M.; Olson, M.; Hedenqvist, P.; Hogmark, S.; Mechanisms of coating failure as
demonstrated by scratch and indentation testing of TiN coated HSS. Surface Engineering,
Vol. 16, Nr. 5, pp. 436-444. 2000
[22] Lai, F.D. and Wu, J.K.; Structure, hardness and adhesion properties of CrN films deposited
on nitrided and nitrocarburized SKD 61 tool steels. Surface and Coatings Technology, Vol.
88, Nr. 1-3, pp. 183-189, Jan. 1997.

Damage induced by spherical indentation test
91
[23] Casellas, D.; Caro, J.; Molas, S.; Prado, J.M.; Valls, I.; Fracture toughness of arbides in
tool steels evaluated by nanoindentation; Acta Materalia; August 2007; Vol.55; Nr. 13;
pp.4277-4286.
[24] Dyjak, P. and Singh R.P.; Acoustic emission analysis of nanoindentation-induced fracture
events. Experimental Mechanics, 2006, Vol. 46, pp. 333-345. DOI 10.1007/s11340-006-
7303-x.
[25] Hernandez, R.; Riera, M.D.; Casellas, D.; Valls, I.; Casas, B.; Prado, J.M.; Tool steel
selection for cold forming of high strength steels based. Materials Science and Technology
(MS&T). Automotive: Advanced High-Strenth and other speciality sheet steels products
for automotive industry. Detroit (Michigan, USA), September 2007, pp. 235-243.
[26] Stachowiak, G.W. and Batchelor, A.W.; Engineering tribology, 3rd edition, Ed. Elsevier
Butterworh-Heinemann, Burlington, MA, USA, 2005, (pp.571-593).
[27] Mishnaevsky Jr., L.; Lippmann, N.; Schmander, S.; Micromechanisms and modeling of
crack initiation and growth in tool steels: role of primary carbides. Zeitschrift fuer
metallkunde/Materials Research and Advaccned Techniques, Vol. 94, Nr. 6, pp. 676-681,
June 2003.
[28] Fischer-Cripps, A.C. and Lawn, B.R.; Indentation stress-strain curves for ‘quasi-ductile’
ceramics. Acta materialia, Vol. 44, Nr.2, pp. 519–527, Feb.1996.
[29] Zhang, H. and Fang, Z.Z.; Characterization of quasi-plastic deformation of WC–Co
composite using Hertzian indentation technique. International Journal of Refractory
Metals & Hard Materials, Vol.26, Nr.2, pp. 106–114, March 2008.
[30] Tarrés, E.; Ramírez, G.; Gaillard, Y.; Jiménez-Piqué, E.; Llanes, L.; Contact fatigue
behavior of PVD-coated hardmetals. International Journal of Refractory Metals & Hard
Materials, Vol. 27, pp. 323–331, 2009.

Chapter 3
92
[31] Picas Anfrús, Ingrid. Mechanical behavior of tools for shearing Ultra High-Strength Steels:
influence of the microstructure on fracture and fatigue micro-mechanisms of tool steels
and evaluation of micro-mechanical damage in tools. PhS. Dissertation. Universitat
Politecnica de Catalunya, 2012. http://hdl.handle.net/10803/112059
[32] Huang, M.; Jiang, L.; Liaw, P.K.; Brooks, C.R.; Seeley, R. ; Klarstrom, D.L.; Using
acoustic emission in fatigue and fracture materials research, Journal of Materials, Vol.50,
Nr.11 (web publication) (1998).
[33] Martinez-Gonzalez, E.; Picas, I.; Romeu, J.; Casellas, D.; Filtering of acoustic emission
signals for the accurate identification of fracture/ mechanisms in bending tests. Materials
Transactions, Vol. 54, Nr. 7, pp. 1087-1094, 2013.
[34] Ramirez, G.; Mestra, A.; Casas, B.; Valls, I.; Martinez, R.; Bueno, R.; Góez, A.; Mateo,
A.; Llanes, L.; Influence of substrate microstructure on the contact fatigue strength of
coated cold-work tool steels. Surface and Coatings Technology, Vol.206, pp.3069-3081,
2012.
[35] Studman, C.J. and Field, J.E.. The indentation of hard metals: the role of residual stresses.
Journal of Materials Science, Feb. 1977, Vol. 12, Nr.2, pp. 215-218.
[36] Abudaia, F.B.; Evans, J.T.; Shaw, B.A.; Spherical indentation fatigue cracking. Materials
Science and Engineering A, Vol.391, pp. 181-187, 2005.
[37] Rammerstorfer, F.G.; Plankensteiner, A.F.: Fischer, A.D.; Antretter, T.; Hierarchical
models for simulating the mechanical behavior of heterogeneous materials: an approach to
high speed tool steels. Materials Science and Engineering A, Vol.259, pp. 73-84, 1999.
[38] L. Ortiz Berrocal. Resistencia de materiales. Ed. Mc.Graw-Hill (3rd ed.), 2007. ISBN 978-
84-481-5636-6.

93
Chapter 4: Conclusions and Contributions
4.1. Conclusions
In this research AE measurements were successfully applied to detect and identify damage
mechanisms in tool steels. The AE measurement procedure has been calibrated for two
mechanical tests: fracture test (three-point bending test) and indentation test (spherical
indentation).
The fracture tests provoke cracks due to tensile stress. The damage starts with the nucleation
of cracks (cracking carbides and local plastic deformation) and afterwards, the cracks grow
through the metallic matrix following the broken carbides. The purpose of the research is to
present a filtering process that will detect each stage of the fracture: the carbide crack
(nucleation), the stage where the crack passes through to the steel matrix and the eventual
catastrophic failure.
The spherical indentation tests for the creation of a more complex distribution of stresses in
an affected part of the specimen. An elastic field was created in the specimen under the ball
indenter applying low level loads. Nevertheless, AE activity was detected in this elastic field,

Chapter 4
94
and these signals were related to the breaking of carbides in the zone of maximum shear stress.
An important feature of this test is that the carbide crack is produced without plastic
deformation, so the damage signals were clearly identified with the carbide breakage.
Successful AE monitoring must always recognize the presence of noise (extraneous or
interfering acoustic signals carrying no relevant data in relation to the investigated process). In
both tests the identification of noise sources was essential, and they were isolated or inhibited.
4.2. Contributions
A new acquisition and filtering configuration in fracture tests to eliminate spurious signals due
to contact damage between the specimen and the machine supports
In the three-point bending test, the damage mechanisms of interest induced by flexion were
also accompanied by another kind of damage due to the test configuration. The high contact
pressure between the supports and the specimen surface cause contact damage. This secondary
effect is difficult to isolate using classical localization methods if the dimensions of specimen are
small, due to the proximity between this mechanism and the ones in question (in the center of the
specimen, they occur exactly on the opposite sides of the width). Specifically, it is found that the
signal caused by the damage induced by the supports is stronger at the beginning than the one
caused by the cracking of carbides and crack propagation, which is the real fracture mechanism
in the steels under study. The coexistence of both signals seriously hampers the correct
identification and evaluation of the fracture mechanisms. A new filtering method is presented to
eliminate the signals related with the contact damage of the raw data.

Conclusions and Contributions
95
Identification of different damage mechanisms in specimens with small dimensions
AE waveforms have information about the source that generates it and the medium through
which they travel. The small dimensions of specimens produce interfered waveforms that are
difficult to interpret. Many reflections of the stress waves are added to the signal in an almost-
instantaneous way. Proper interpretation of the AE response during the test was difficult using
the whole waveform features. A new analysis of acquired data based on frequency features of the
very first cycles of each waveform is proposed in this thesis to classify the different sources of
the signals. This classification makes it possible to identify different the signal sources. Thus, it
is possible to follow the evolution of the damage mechanisms, which one appears first and at
which level of load it appears. The AE results obtained for different tool steels in this thesis
confirm the previous works that identify carbide breakage as the cause of the nucleation of
cracks in these steels; the growth of these cracks through the metallic matrix has also been
identified.
Early identification of carbide breaking
AE monitoring of the mechanical tests, both the fracture and the spherical indentation, permits
more precise information to be obtained about the damage that takes place. Superimposing AE
with the stress-strain data provides accurate information about the precise instant at which an
event takes place. Thus, in these tests it is possible to identify the stress level at which the
carbides start to break more accurately than with other conventional techniques.

Chapter 4
96
Results of mechanical tests monitored by means of AE
In both the monitored tests, spherical indention and bending tests, the tool steels presented the
breakage of carbides as an incipient damage stage even during the elastic field. Thus, very initial
damage occurs in the specimen during the elastic range, and therefore when the specimen is
unloading the recovery of the microstructure is not complete, as might be expected. The
importance of this point is that during correct loading in-service, tools can present micro-
damages which may act as the origin of fatigue cracks.
Reduction of tasks and time in mechanical fracture research
The tool steels under study are very fragile materials. The calibration of an AE system
coupled to the fracture test permits the previous prediction of the fracture of the specimen. From
the standpoint of materials research, this is a significant improvement in the fracture test.
Following the acquired AE signals, the test can be stopped as soon as the first damage occurs, in
order to analyze the microstructure in the microscopy or the evolution of cracks can be studied
using the AE information. This makes it possible to stop the fracture test in each jump of the
crack and photograph or analyze it and then continue loading the specimen. This procedure was
used during the experiment to obtain the microscopic images of a crack in its final stages,
maintaining the specimen integrity.
The same improvement may be useful in the case of the indentation test, as the AE
indentations can be used in unloading the test, to obtain specimens with very incipient damage or
with the first induced cracks.
97
Chapter 5: Future developments
5.1. Future developments directly related to the presented research
The usefulness of AE for the further study of tool steels has been proved. In this thesis, the
study of the behavior of these materials was focused on monotonic loads. However, the response
that they exhibit when subjected to varying stresses (fatigue) is necessary in order to continue to
improve knowledge about the matter.
A predictive maintenance tool using AE could be designed for performance tools. In the
automotive industry, for example, performance tools such as punches are crucial parts of the
manufacturing process. Currently, AHSS are used to shape these tools and the fragility of these
steels referred to above leads to unexpected failures in tools which stop production. In-service
monitoring could control the crack length in the tools by means of the AE signal features,
allowing for the planned maintenance and changing of tools. It should be noted that all these
tools operate under cyclic loading.
Some fatigue tests have been conducted during this study. Three-point bending tests were
performed with cyclic loading. The aims of these tests were to find a relationship between the

Chapter 5
98
crack length and AE signal features and prevent the catastrophic failure of the specimen. Some
previous results were obtained, and they are consistent with the results presented by other
authors in some materials (including some steels). The set-up of these tests required many hours,
and some difficulties arose which should be overcome. Mainly, two problems were detected: i)
excessive cycling frequency due to the characteristics of the testing machine and ii) the high
randomness of the specimen behavior. Some specimens endured only a few minutes of testing
while others resisted for hours. Also, the cracks were difficult to follow since they appeared at
any point of the tensile surface. This is because grinding small defects acting as a stress
concentrator and constitutes the origin of the crack. It would therefore be necessary to repeat the
test with notched specimens to control the evolution of the crack from a known point.
In ductile steels, some authors have associated the crack length with the signal counts.
Relating some feature of the acquired signals with the length of cracks in tool steels would make
it possible to predict the number of cycles remaining to reach the critical length of the crack (in
accordance with Paris’s law). With AE activity, this predictive law can be easily applied from
the instant that crack appears and it may therefore be useful for predicting the fracture of the
specimen.

Future developments
99
Figure 5.1. Cummulative AE counts versus fatigue cycles during the fatigue three-bending test.
Coupling the AE to the mechanical test allows accurate information to be obtained in real
time about the material behavior that would not otherwise be possible, as has been demonstrated
in the fracture and spherical indentation test. Consequently, using AE during other common
mechanical tests could be a useful tool to ensure the accuracy of the test results. During this
research work, the AE technique was applied to micro- and nano- indentation tests and scratch
tests. The results are preliminary, but they seem interesting. Continuing with these tests, it is
necessary to improve and adapt the signal filtering process, lowering the threshold level to detect
very incipient changes in the material.
Stage 1 Stage 2 St. 3 C
ount
s
Nucleation crack 1
Nucleation crack
Propagation crack
Catastrophic failure
Fatigue cycles (x104 cycles)
Cou
nts

Chapter 5
100
Figure 5.2. (a) Micro-indentation test monitored by means of AE and (b) Nano-indentation test by
means of AE.
A future development is to apply the AET to the predictive maintenance of tools. Some very
preliminary tests have been done in laboratory punches.
Figure 5.3. Some pictures of a laboratory punch monitored by means AE.
(a) (b)

Future developments
101
5.2. Other future developments
AE is useful for detecting changes in the material while they occur. This characteristic enables
it to be applied in different fields where incipient damage must be detected. Two lines of future
work are highlighted below, as they have now been started with successful results:
− Incipient cracks in gear teeth.
− Biomaterials.
5.2.1. Incipient cracks in gear teeth
The first application is the detection of cracks in mobile parts of machines. Some work has
been carried out to detect incipient cracks in the tooth of a gear loading by variable bending in
laboratory tests (mimicking the behavior of a tooth in service). Although the work is at an early
stage, the start of the crack can be thus detected with sensors mounted on the gear and on the
shaft that supports it. Progressing in this way, and studying the transmission paths of AE waves,
the detection sensors could be removed from the gear. The purpose would be the failure
detection of mobile parts by mounting the AE sensors on the fixed parts of the machine such as
the bearing supports or the machine casing. This would mean an advance in the preventive
maintenance of gearboxes or machine elements which are expected to fail, for the purpose of
planning their replacement or repair.
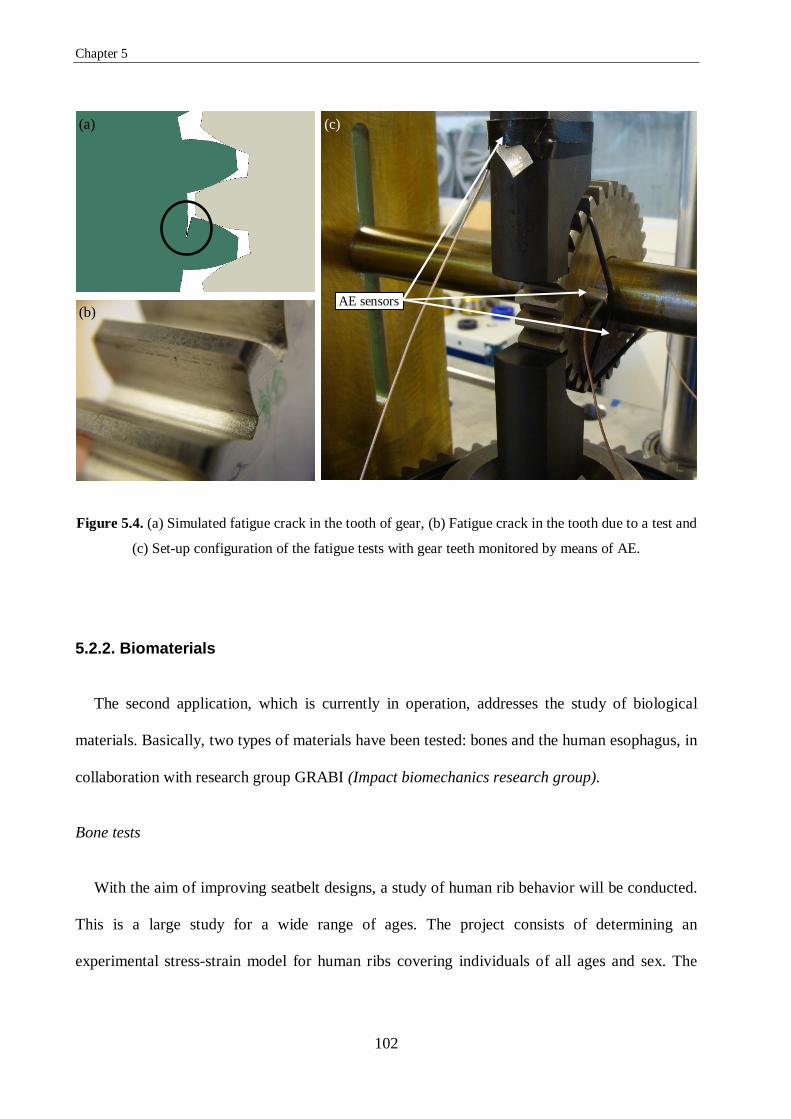
Chapter 5
102
Figure 5.4. (a) Simulated fatigue crack in the tooth of gear, (b) Fatigue crack in the tooth due to a test and
(c) Set-up configuration of the fatigue tests with gear teeth monitored by means of AE.
5.2.2. Biomaterials
The second application, which is currently in operation, addresses the study of biological
materials. Basically, two types of materials have been tested: bones and the human esophagus, in
collaboration with research group GRABI (Impact biomechanics research group).
Bone tests
With the aim of improving seatbelt designs, a study of human rib behavior will be conducted.
This is a large study for a wide range of ages. The project consists of determining an
experimental stress-strain model for human ribs covering individuals of all ages and sex. The
AE sensors
(b)
(c) (a)

Future developments
103
experimental procedure consists of: tensile tests applied to coupons (small specimens of cortical
bone extracted from the rib) and three-point bending tests applied to whole human ribs. The
deflections are obtained from the images of a high-speed camera filming the tests and the force
using load cells. The complex bone formation process makes difficult to detect the incipient fiber
breakage from the stress-strain curve. For this purpose, the tests are monitored by AE. The AE
activity allows the level of stress (or force) that causes damage to the rib to be identified.
Currently, these tests have been performed on pork ribs and the positive results obtained
encourage us to continue with human ribs.
Figure 5.5. (a) Tested coupons, (b) real strain vs. stress of a coupon, (c) tensile test of a pork rib
monitored by acoustic emission and (d) detail of the AE sensors attached to the rib.
AE sensors
(c)
(a)
(d)
Real Strain (video analysis)
Stre
ss [M
Pa]
(b) Coupon test

Chapter 5
104
Esophagus tests
Stenosis is the obstruction of a human duct. In the case of esophagus stenosis, keloids grow
on the internal walls of the esophagus which block the esophageal transit. In the most severe
cases, the internal opening may be less than one millimeter in diameter. The treatment in such
cases consists of inserting a plastic cone or a balloon into the esophagus to break these fibers and
reopen the duct. The lack of knowledge about the resistance of the esophagus is a problem in
therapy. Physicians can only rely on their experience and intuition during this process. In some
cases, mechanical treatment may damage the healthy part of the esophagus. In these particular
cases, 50% of the patients die, since the surgery needed to repair it is very complicated and
normally there is not enough time.
With the aim of studying the resistance of the esophagus and improving treatment results,
David Sanchez Molina is writing his doctoral thesis about this topic. At present some of the tests
have been monitored with AE, and the positive results indicate that the cracking of the fibers in
this tissue can be detected by means of AE. Future work will be developed in this field.
Figure 5.6. Tensile testing of an esophagus monitored by AE.
AE sensors