Detection of Explosive Compounds Using Photosystem II ... · instrumentation that is too complex...
28
1 Corresponding author; e-mail: [email protected] (V. Zazubovich), Department of Physics, Concordia University, 7141 Sherbrooke St. W, Montreal, Quebec H4B 1R6, Canada; phone: (1-514)-848-2424 #5050; fax: (1-514)-848-2828. 2 Current Address: Biosensors Laboratory, Institute of Microbial Technology, CSIR, Sector 39 A, Chandigarh 160036, India Detection of Explosive Compounds Using Photosystem II -based Biosensor Vijayender Bhalla 2 , Xin Zhao and Valter Zazubovich 1 Department of Physics and Department of Chemistry and Biochemistry, Concordia University, 7141 Sherbrooke St. West, Montreal, Quebec H4B 1R6, Canada Abstract The efficacy of a Photosystem II (PS II) -based biosensor for the detection of explosive compounds has been explored. The idea is based on the close similarities in the chemical structures of the widespread explosives and herbicides, with the latter known to inhibit functioning of the PS II by attaching to the binding site of the Q B mobile plastoquinone electron acceptor. The gold screen-printed electrodes (Au-SPE) functionalized with PS II -enriched particles were used for the detection of explosives in a droplet biosensor configuration. A crude preparation of PS II produced from spinach leaves, known as BBY particles, was employed to modify the Au-SPE working electrode employing BSA- glutaraldehyde-based immobilization procedure. Inhibition of the PS II functioning was detected by photo-electrochemical measurements in the presence of a mediator (either non-native quinone or ferricyanide). The biosensor was highly responsive to herbicides (as expected) as well as to picric acid, with limits of detection in the nanomolar range, but trace detection of trinitrotoluene (TNT) was not effective. The detection limit for picric acid was 25 nM as compared to ~400 nM for TNT with duroquinone mediator. Low affinity of PS II to TNT has been corroborated by means of DCPIP assay; possible reasons for low affinity are discussed. Keywords: Photosystem II, Herbicides, picric acid, TNT, Screen-printed electrode.
Transcript of Detection of Explosive Compounds Using Photosystem II ... · instrumentation that is too complex...

1 Corresponding author; e-mail: [email protected] (V. Zazubovich), Department of Physics, Concordia University, 7141 Sherbrooke St. W, Montreal, Quebec H4B 1R6, Canada; phone: (1-514)-848-2424 #5050; fax: (1-514)-848-2828. 2 Current Address: Biosensors Laboratory, Institute of Microbial Technology, CSIR, Sector 39 A, Chandigarh 160036, India
Detection of Explosive Compounds
Using Photosystem II -based Biosensor
Vijayender Bhalla2, Xin Zhao and Valter Zazubovich
1
Department of Physics and Department of Chemistry and Biochemistry, Concordia
University, 7141 Sherbrooke St. West, Montreal, Quebec H4B 1R6, Canada
Abstract
The efficacy of a Photosystem II (PS II) -based biosensor for the detection of explosive
compounds has been explored. The idea is based on the close similarities in the chemical
structures of the widespread explosives and herbicides, with the latter known to inhibit
functioning of the PS II by attaching to the binding site of the QB mobile plastoquinone
electron acceptor. The gold screen-printed electrodes (Au-SPE) functionalized with PS II
-enriched particles were used for the detection of explosives in a droplet biosensor
configuration. A crude preparation of PS II produced from spinach leaves, known as
BBY particles, was employed to modify the Au-SPE working electrode employing BSA-
glutaraldehyde-based immobilization procedure. Inhibition of the PS II functioning was
detected by photo-electrochemical measurements in the presence of a mediator (either
non-native quinone or ferricyanide). The biosensor was highly responsive to herbicides
(as expected) as well as to picric acid, with limits of detection in the nanomolar range, but
trace detection of trinitrotoluene (TNT) was not effective. The detection limit for picric
acid was 25 nM as compared to ~400 nM for TNT with duroquinone mediator. Low
affinity of PS II to TNT has been corroborated by means of DCPIP assay; possible
reasons for low affinity are discussed.
Keywords: Photosystem II, Herbicides, picric acid, TNT, Screen-printed electrode.
2
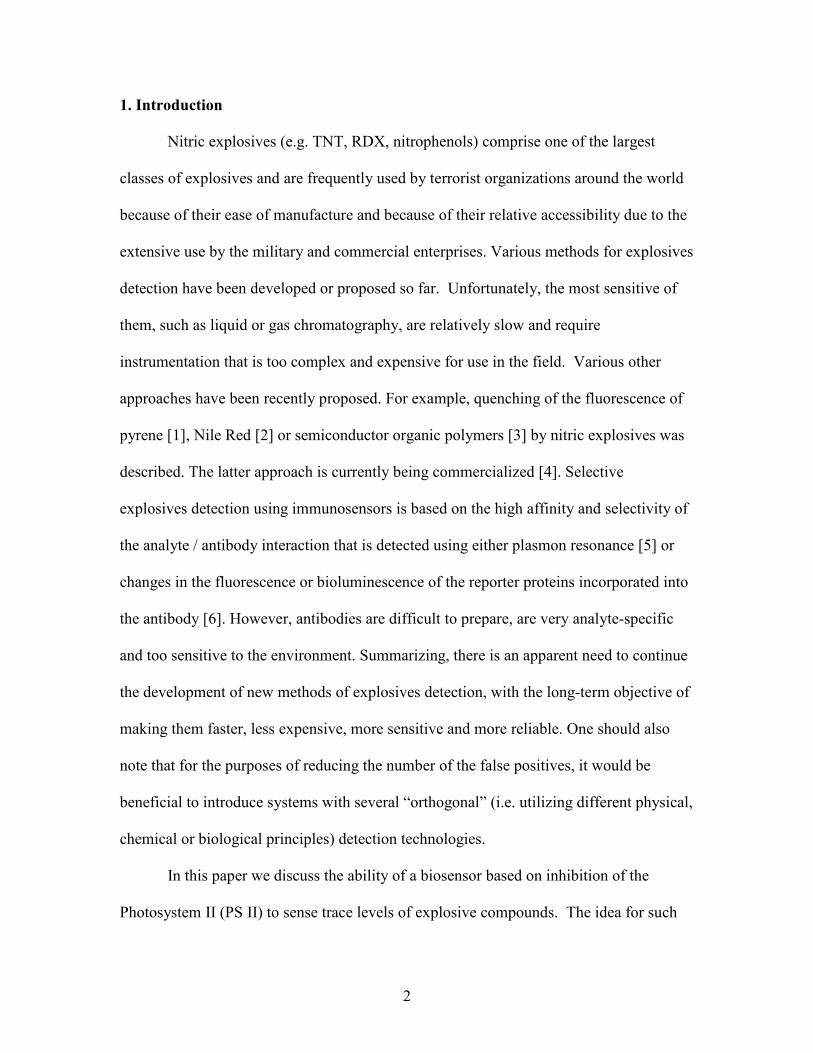
1. Introduction
Nitric explosives (e.g. TNT, RDX, nitrophenols) comprise one of the largest
classes of explosives and are frequently used by terrorist organizations around the world
because of their ease of manufacture and because of their relative accessibility due to the
extensive use by the military and commercial enterprises. Various methods for explosives
detection have been developed or proposed so far. Unfortunately, the most sensitive of
them, such as liquid or gas chromatography, are relatively slow and require
instrumentation that is too complex and expensive for use in the field. Various other
approaches have been recently proposed. For example, quenching of the fluorescence of
pyrene [1], Nile Red [2] or semiconductor organic polymers [3] by nitric explosives was
described. The latter approach is currently being commercialized [4]. Selective
explosives detection using immunosensors is based on the high affinity and selectivity of
the analyte / antibody interaction that is detected using either plasmon resonance [5] or
changes in the fluorescence or bioluminescence of the reporter proteins incorporated into
the antibody [6]. However, antibodies are difficult to prepare, are very analyte-specific
and too sensitive to the environment. Summarizing, there is an apparent need to continue
the development of new methods of explosives detection, with the long-term objective of
making them faster, less expensive, more sensitive and more reliable. One should also
note that for the purposes of reducing the number of the false positives, it would be
beneficial to introduce systems with several “orthogonal” (i.e. utilizing different physical,
chemical or biological principles) detection technologies.
In this paper we discuss the ability of a biosensor based on inhibition of the
Photosystem II (PS II) to sense trace levels of explosive compounds. The idea for such

3
sensor is inspired by recent progress in the development of inexpensive and sensitive
herbicide biosensors based on photosynthetic reaction centers (RC). Since using PS II for
herbicides detection was proposed more than 20 years ago [7] this subject has been
explored extensively [8-15]. It is important to note that the chemical structures of nitric
explosives are fairly similar to those of the herbicides detectable by these biosensors
(Figure 1); moreover, nitric explosives are known to be strong electron acceptors. Thus,
detection of explosives by natural photosynthetic RC-based sensors seems quite
promising. Photosystem II is a trans-membrane protein complex responsible for the water
splitting and oxygen evolution; it is a part of the electron transfer chain in photosynthesis.
In PS II sunlight energy is utilized for charge separation starting with the formation of
P680+−Pheo-. The electron then travels from the pheophytin to immobile plastoquinone
QA to mobile plastoquinone QB. The latter accepts two electrons (and two protons),
transforms to quinol and carries the electrons away. P680 is re-reduced by electrons
originating from water. The mechanism of inhibition of photosynthetic reaction centers
by herbicides in vivo involves herbicide molecules attaching to the QB binding site and
preventing plastoquinone from binding. The exposure of the PS II-based biosensor to the
inhibitor results in a decrease of the photoinduced current in an electrical circuit
containing the photosynthetic reaction centers, as the mediator (replacement for
plastoquinone) cannot bind to the QB site. [Suggested location of Figure 1]
Detection of TNT and picric acid will be considered in this manuscript. Herbicide
data obtained with the same biosensor will be reported for comparison. Picric acid (2,4,6-
trinitrophenol) is a yellow crystalline solid, easily soluble in water. It was widely
employed as an explosive during the World War I. It is also used for various laboratory
4
purposes, such as staining biological samples and preservation of specimen. Some optical
sensors for the detection of picric acid have been reported [16-19]. The first evidence of
picric acid being an inhibitor of photosynthetic electron transport in Photosystem II (PS
II) has been reported a while ago [20]. TNT is used in organic synthesis but is best known
as an explosive material with convenient handling properties. Among the commonly used
methods for detection of TNT are spectrophotometric [21,22], immunoassay [5,23] and
electrochemical [24]. TNT is a very strong electron acceptor and this property was used
recently for detection employing quenching of photoluminescence of polysiloles [25].
The solubility of TNT in water is about 100 mg/L at room temperature [26]. TNT is
known to inhibit the growth of the plants and to affect PS II fluorescence [27], although
the exact mechanism of these effects was not elucidated.
2. Materials and methods
2.1 Reagents
All chemicals except TNT were purchased from Sigma-Aldrich; TNT was
purchased from ChemService, USA. Organic baby spinach leaves were obtained from
local food retailers.
2.2 Isolation of PS II-containing particles
The BBY particles (in honor of Berthold, Babcock and Yocum [28]) are PS II-
enriched membrane fragments. They are obtained by treating thylakoids with Triton X-
100 and centrifugation and are mostly devoid of Photosystem I (PS I). Note that the
hydrophobic mediator may travel within the remaining membrane to reach its binding

5
site. The oxygen evolving capacity is also preserved. The particles were isolated from
spinach leaves according to [29]. All the steps of extraction were carried out in dim green
light at low temperature (samples on ice or procedure in cold room). The leaves were
washed, depetiolated and then ground with blender in homogenising buffer (20 mM MES
(2-(N-morpholino)ethanesulfonic acid), pH 6.0, 15 mM NaC1, 5 mM CaC12). After
filtering through cheesecloth (16 layers) the material was centrifuged for 10 min at
10,000 g. Pellet (containing chloroplasts) was resuspended in homogenising buffer to a
concentration of 2 mg Chl/ml. The chlorophyll concentration was determined by the
method of Arnon [30]. Triton X-100 solution was added to a final concentration of 25
mg/mg Chl. After 15 min of gentle stirring the suspension was centrifuged for 25 min at
40,000 g. The particles were resuspended in homogenising buffer supplemented with 0.4
M sucrose, then centrifuged for 5 min at 2,000 g to remove starch, then sedimented once
more for 25 min at 40,000 g. The prepared particles were stored at −70 °C until used. The
oxygen evolution activity as measured by DCPIP (Dichlorophenolindophenol; see
Section 2.5) assay for BBY sample was ∼90 (µmol/mg Chl/h).
A different protocol, not involving enriching the samples with PS II was
employed for comparison. Deveined spinach leaves were crushed in a blender with
homogenizing buffer. The homogenate was filtered through cheesecloth and the filtrate
was centrifuged for 2 min at 2500 g at 4 °C. The resulting pellet was then resuspended in
the homogenising buffer diluted 20 times. This step was used to lyse the chloroplast
membranes. The resulting solution was then crushed in a Wheaton mixer and centrifuged
for 3 min at 3500 g. The resulting pellet contained the purified membranes. They were
then resuspended in a measuring buffer (15 mM MES, pH 6.5, containing 0.5 M

6
mannitol, 0.1 M NaCl, 5 mM MgCl2, and 5.10-5 M chloramphenicol) to obtain a final
concentration of chlorophyll-containing thylakoid membrane fragments between 2 and 3
mg/ml.
2.3. Biosensor preparation
The screen-printed electrodes were purchased from DropSens Inc. (model DRP-
220). The electrode assembly consists of a gold working electrode (with the area of ~13
mm2), a graphite counter-electrode and an Ag/AgCl reference electrode. The choice of
the immobilization technique was based on its ability to preserve the biological sample in
its active form for long periods of time. The procedure for bovine serum albumin (BSA)-
glutaraldehyde matrix-based immobilization was similar to that described earlier
[7,8,11,31-34]. Briefly, a 10 % solution of BSA in measuring buffer was mixed with
equal amount of BBY particles. For cross-linking purpose a 10 % glutaraldehyde solution
was added to make a final glutaraldehyde concentration of 0.3 %. 2.5 µl of the mixture
was spread over the working electrode and incubated for 30 min at 4 oC for the matrix
formation. The entrapment of BBY particles in a BSA-glutaraldehyde resulted in a very
stable matrix formation on top of the central / working screen-printed electrode. The
immobilized photosynthetic material was visible as a green deposition on the electrodes.
The electrodes functionalized with PS II were stored at −20 °C until used.
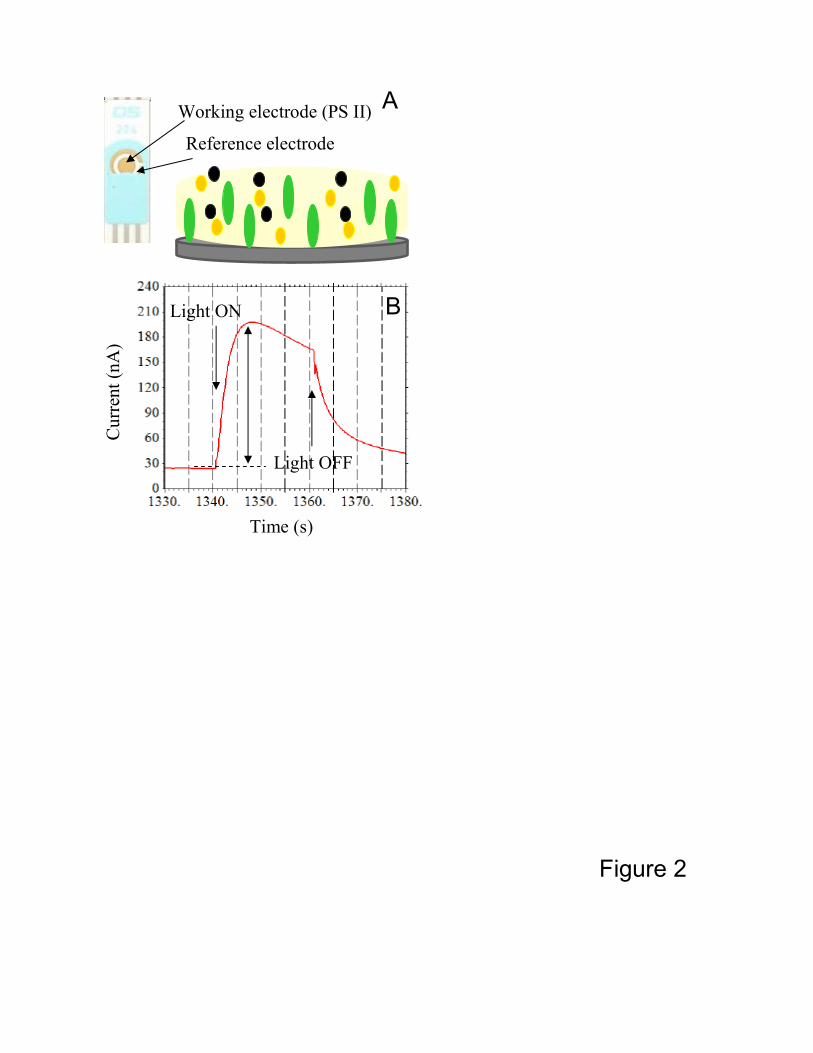
The schematics of the biosensor are presented in Figure 2A. [Suggested location of Fig.2]
2.4 Photo-electrochemical measurements
7
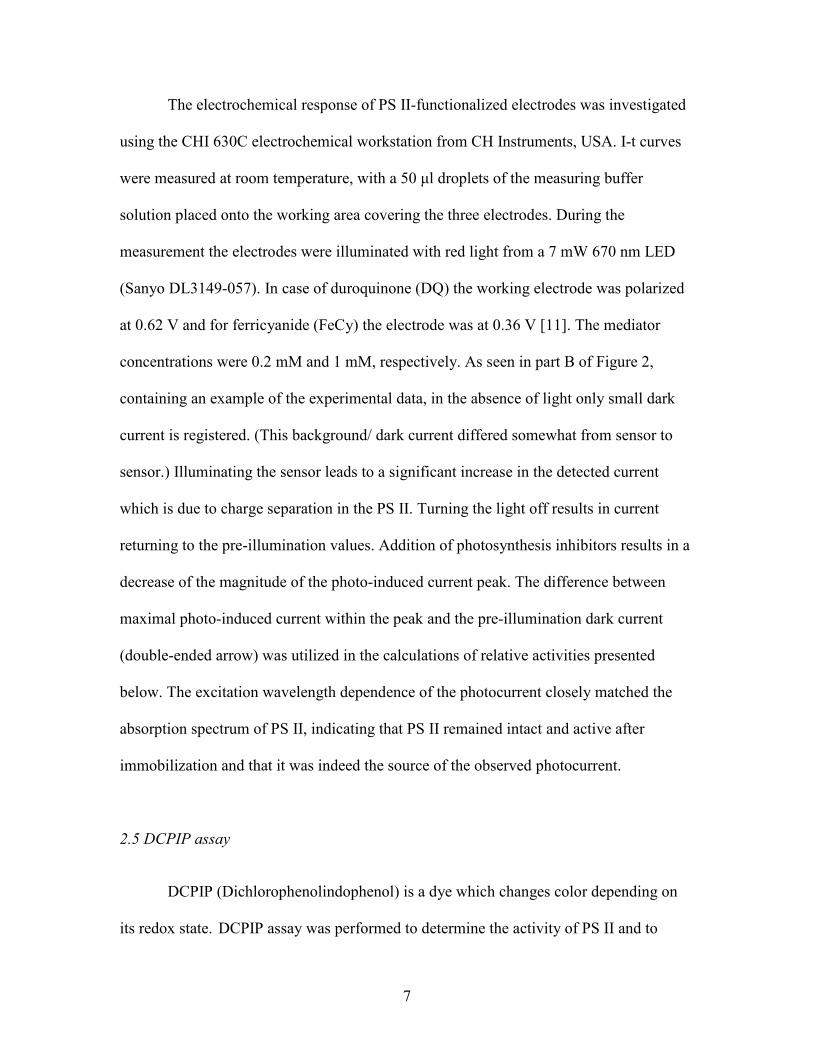
The electrochemical response of PS II-functionalized electrodes was investigated
using the CHI 630C electrochemical workstation from CH Instruments, USA. I-t curves
were measured at room temperature, with a 50 µl droplets of the measuring buffer
solution placed onto the working area covering the three electrodes. During the
measurement the electrodes were illuminated with red light from a 7 mW 670 nm LED
(Sanyo DL3149-057). In case of duroquinone (DQ) the working electrode was polarized
at 0.62 V and for ferricyanide (FeCy) the electrode was at 0.36 V [11]. The mediator
concentrations were 0.2 mM and 1 mM, respectively. As seen in part B of Figure 2,
containing an example of the experimental data, in the absence of light only small dark
current is registered. (This background/ dark current differed somewhat from sensor to
sensor.) Illuminating the sensor leads to a significant increase in the detected current
which is due to charge separation in the PS II. Turning the light off results in current
returning to the pre-illumination values. Addition of photosynthesis inhibitors results in a
decrease of the magnitude of the photo-induced current peak. The difference between
maximal photo-induced current within the peak and the pre-illumination dark current
(double-ended arrow) was utilized in the calculations of relative activities presented
below. The excitation wavelength dependence of the photocurrent closely matched the
absorption spectrum of PS II, indicating that PS II remained intact and active after
immobilization and that it was indeed the source of the observed photocurrent.
2.5 DCPIP assay
DCPIP (Dichlorophenolindophenol) is a dye which changes color depending on
its redox state. DCPIP assay was performed to determine the activity of PS II and to

8
confirm the low inhibition effect of TNT on PS II (in the absence of the BSA-
glutaraldehyde matrix). Reduction of DCPIP by PS II was monitored by following a
decrease in DCPIP absorbance at 592 nm. The assay buffer contained 20 mM Tricine, pH
7.5, 0.2 mM sucrose, 3 mM MgCl2 and 10 mM KCl. Absorption spectra were measured
with a Cary 5000 UV-VIS-NIR spectrophotometer at 22 °C.
3. Results and discussion
Quality of the PS II preparation is of crucial importance for biosensor
performance. Both intact thylakoids [7,8,32,34,35] and PS II-enriched BBY particles
[10,11,31] have been used in electrochemical cells and herbicide biosensors. At low
temperature (4 oC) and in the dark both BBY particles [31] and thylakoid membranes
[36] can be stored for hundreds of hours. At room temperature the half-life of the
immobilized BBY particles and thylakoids is reduced to tens of hours [10,11,34]. Our
biosensor exhibited approximately 35% decrease of the photocurrent within 7 hours.
Thus, the stability of our biosensor is slightly better than that reported in [11]. Somewhat
reduced lifetime of the screen-printed electrode biosensor as compared to [10,34] is
ascribed to release of Ag+ ions from the reference electrode [11]. The performance of
biosensors employing both types of PS II preparations was explored. Biosensor with
thylakoid membrane fragments exhibited slower response and longer recovery time as
well as poorer signal-to-noise ratio as compared to the sensor with BBY particles. Thus,
BBY preparation was selected as better suited for biosensor applications. In case
ferricyanide (FeCy) was used as a mediator, large residual activity at high inhibitor
concentrations was observed due to the nonspecific nature of the FeCy binding, i.e. FeCy

9
most probably can accept electrons from sites other than the QB site. This result is in
agreement with [11]. Therefore, DQ was considered a preferred mediator, as better
dynamic range results in somewhat better limits of detection. Nevertheless, data obtained
with FeCy as a mediator is still reported for comparison.
3.1 Detection of explosives and herbicides
In vivo the herbicides compete with the QB plastoquinone for its binding site on
the D1 protein thus leading to disruption of electron transfer from QA to QB and further
along the electron transfer chain. In our experiments binding of the herbicide or explosive
molecule to the QB site prevents the mediator from accepting electrons from the site and
hence the process of electron transfer from PS II to the mediator and from the mediator to
the electrode is stalled. The detection is based on the decrease of the photocurrent in the
presence of analyte. A baseline current change value was first obtained without the
addition of any analyte. Then the effect of introducing additional droplets per se has been
explored. A droplet (50 µl) of measuring buffer containing the mediator was allowed to
spread over the electrodes covered with immobilized PS II and the photocurrent
generated from the biosensor was measured with the illumination time of 20 sec after 15
min of incubation. This process was repeated with new droplets to ascertain the behavior
in photocurrent response over a period of time. Addition of new droplets without any
inhibitor did not lead to any changes beyond the slow natural decay of the photosynthetic
protein material over time.
For measurements of the effect of the herbicides or explosives the biosensor was
subjected to a droplet containing the analyte and mediator in measuring buffer, and the
10
light-induced current change was measured after 15 min. This incubation time has been
judged necessary in case of BSA-glutaraldehyde immobilization as the analyte molecule
has to diffuse to its binding site and that process is slow for gel-matrix system [13].
Before applying next, higher, concentration of the analyte, the sensor was washed with
measuring buffer. Alternatively, a fresh sensor was used to obtain the response at a
particular analyte concentration. On starting the measurements with a fresh biosensor the
steady state current was higher and the photocurrent signal measurements showed higher
standard deviations during the first 25-30 min of the measurement. This may be referred
to as a preconditioning phase. Thereafter the signal was largely stable over a period of 3
hours during which the different analyte concentrations could be tested using 15 min
incubation time.
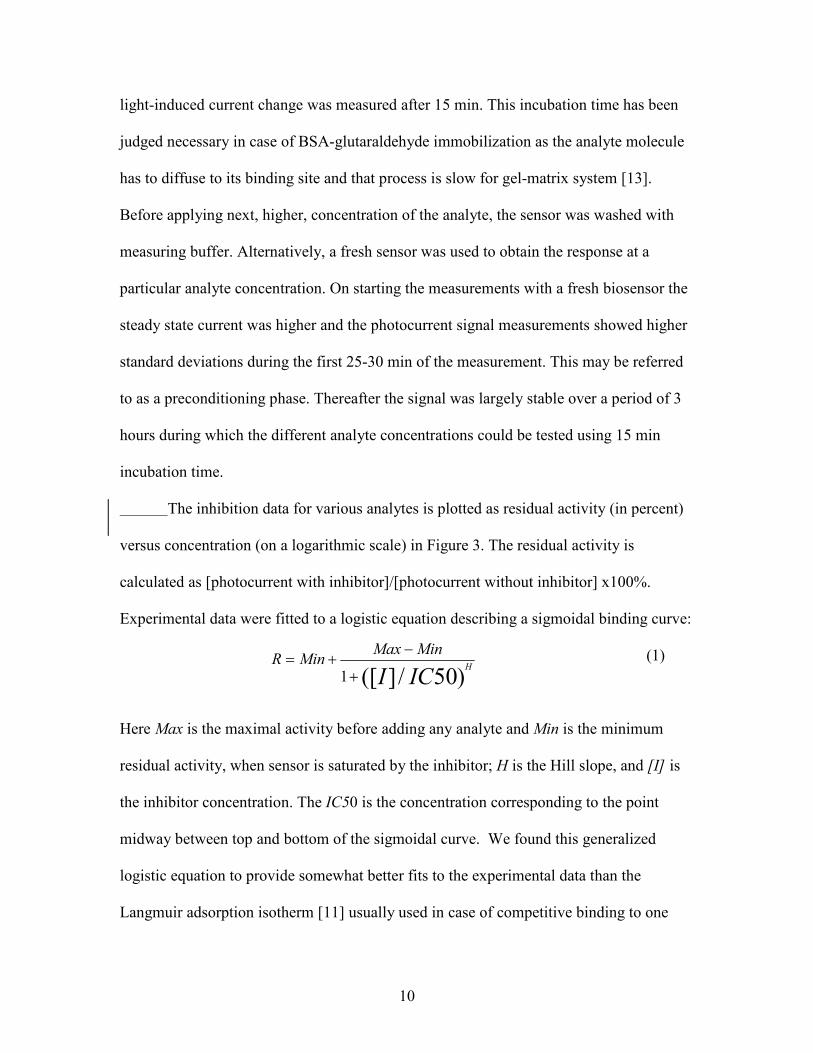
The inhibition data for various analytes is plotted as residual activity (in percent)
versus concentration (on a logarithmic scale) in Figure 3. The residual activity is
calculated as [photocurrent with inhibitor]/[photocurrent without inhibitor] x100%.
Experimental data were fitted to a logistic equation describing a sigmoidal binding curve:
(1)
Here Max is the maximal activity before adding any analyte and Min is the minimum
residual activity, when sensor is saturated by the inhibitor; H is the Hill slope, and [I] is
the inhibitor concentration. The IC50 is the concentration corresponding to the point
midway between top and bottom of the sigmoidal curve. We found this generalized
logistic equation to provide somewhat better fits to the experimental data than the
Langmuir adsorption isotherm [11] usually used in case of competitive binding to one
)50/]([1 ICIH
MinMaxMinR
+
−+=

11
site. Equation 1 is equivalent to that of [11] for H=1 and Min=0 and has been used
previously by other authors, for example in [35]. Although the value of H is quite
sensitive to various measurement errors and usually is not used to make quantitative
inferences, in principle H values smaller than one may indicate the presence of several
binding sub-sites in the same domain. The limit of detection, LOD, is the concentration
upon measuring which one can tell with certainty (usually 99% confidence interval is
employed) that the analyte is indeed present; it was calculated as
H
MinMaxICLOD
/1
6.26.2
50
−−
=σ
σ (2)
which, again, is reduced to expression from [11] for H=1 and Min=0. The factor of 2.6
corresponds to 99% confidence interval. Figure 3 shows the experimental data obtained
with DCMU herbicide (3-(3,4-dichlorophenyl)-1,1-dimethylurea), picric acid and TNT,
and their fits using Equation 1. As can be seen from the Figure 3 the biosensor is highly
responsive to classical herbicides such as DCMU (as expected) and only slightly less
responsive to picric acid. Essentially, the sigmoidal curve shifts towards higher
concentrations for picric acid, and shifts still further for TNT (note the different
concentration ranges in different frames of Figure 3). The range of recognition extends up
to almost 10 µM for DCMU, but for the picric acid the results exhibit low S/N ratio for
concentrations higher than 1 µM, which affects the recognition range. In case of TNT the
biosensor shows almost no inhibition of photocurrent for concentrations up to ~1 µM, but
inhibition effect becomes apparent upon further increasing the TNT concentration. The
inhibition is almost complete for a saturated solution of TNT (∼5.10-4 M). Note that due
to poor solubility of TNT in water the location of the lower plateau of the sigmoidal
curve (Min in Eqs. 1 and 2) is somewhat ambiguous. The values reported in this work
12
were obtained constraining the fits to Min being equal to residual activity at maximal
TNT concentration. Such constraining seems justified as for other analytes Min was not
zero. On the other hand, allowing Min to decrease to zero results in approximately 1.5-
fold increase in respective IC50 and LOD. The biosensor was also employed to detect
another nitric explosive, tetryl (2,4,6-trinitrophenylmethylnitramine). Although tetryl
inhibited the functioning of the PS II at very low concentrations, ~10 nM (not depicted),
the data scatter was large and the effect was not fully reversible, possibly indicating
permanent damage to the PS II. Thus it is not clear if the mechanism of inhibition by
tetryl involves QB site binding. (The effect of TNT was reversible, see below.)
[Suggested location of Figure 3]
Table 1 summarizes the data on the limits of detection (LOD) IC50 and other fit
parameters for various substances. The LOD for DCMU was comparable to values
previously reported in BSA-glutaraldehyde matrix [11], and better than in [35]. The LOD
for picric acid previously reported using luminescence quenching method is 2 µM [36]
and by fluorescence emission of hexaphenysilole-chitosan film ∼21 nM [37]. Thus, the
present detection limits for picric acid of 25 nM (with DQ) and 29 nM (with FeCy, data
not shown) constitute a significant improvement over that for luminescence quenching,
and is comparable to that of the fluorescence detection method. Interestingly, the LOD
for picric acid is significantly better than that reported in [11] for several nitrophenolic
herbicides, indicating that BSA-glutaraldehyde matrix does not impede diffusion of picric
acid to such a degree. The LOD and IC50 observed for picric acid in this work fall into
the same range as observed for nitrophenolic herbicides using Clark electrode [10]. The

13
IC50 value observed in this work is also in reasonable agreement with 0.15 µM reported
in [20]. [Suggested location of Table 1]
The poor limit of detection observed for TNT suggests that TNT binding to the
QB site is weak. Alternatively, low sensitivity to TNT may be attributed to low
permeability of the BSA-glutaraldehyde matrix to TNT. DCPIP assay was employed to
test the latter possibility. In case of the intact electron transfer chain the introduction of
DCPIP interrupts the passage of electrons between PS II and PS I, most likely by
accepting electrons from the reduced mobile plastoquinone after it leaves the PS II
complex. In our experiment, when the duroquinone is displaced by the inhibitor and not
reduced, the subsequent reduction of DCPIP is impossible. Measurements involving
DCPIP were performed with BBY particles in suspension, without BSA-glutaraldehyde
gel matrix present. Results quantitatively similar to those shown in Figure 3C were
observed that clearly indicate that the choice of a matrix system does not pose significant
limitations to the interaction of TNT with the herbicide binding site of the PS II. The
question may also be posed if the inhibition of PS II by TNT is accompanied by some
permanent damage to the PS II. When saturated solution of TNT (i.e. the maximum
concentration possibly achievable in the experiments on whole plants, [27]), was
employed, the photocurrent was reduced to ~10 % of the maximal value. Washing the
electrode surface with the buffer solution completely (although gradually) restored the
magnitude of the photocurrent. Thus, binding of TNT to PS II is reversible and no
permanent damage to PS II occurs.
.
3.2 Possible mechanism of DCMU, TNT and picric acid binding at the QB Site

14
The PS II-based biosensor shows high inhibition effect for classical herbicides
such as DCMU, the effect slightly decreases for picric acid and is strongly reduced for
TNT. The occurrence of a methyl group in TNT instead of hydroxyl group could pose
significant limitations to the ability of TNT to bind to the QB site, as sufficient number of
hydrogen bonds may not be formed. To test these ideas AutoDock 4 software [38,39 ] has
been employed for modeling of the docking of the above ligands to the QB binding site.
AutoDock takes into account dispersion-repulsion, electrostatics, hydrogen bonds and
desolvation terms. QB plastoquinone was removed from the cyanobacterial PS II complex
structure (pdb code 3BZ1 [40]; the high-resolution structure of PS II from spinach is not
available) using PyMol to allow for modeling of binding of herbicides and explosives to
the empty QB site. The latter was defined as the vicinity of the following D1 residues:
HIS 215, PHE 255, SER 264 and PHE 265 which are most involved in herbicide binding
according to mutation studies ([41] and references therein). These residues, along with
MET 214, LEU 218, ALA 251 and LEU 271 comprise the QB site according to structure
data [40,42]. Surprisingly, the calculated binding affinities of all of the compounds
studied are comparable and are not correlated with their ability to inhibit electron transfer
in our biosensor. The optimal positions of DCMU, picric acid and TNT in the QB binding
pocket are depicted in Figure 4. Note that TNT still appears to form hydrogen bonds with
the QB pocket residues. As discussed above with respect to the DCPIP experiment, the
BSA-glutaraldehyde matrix does not limit the accessibility of the QB site to TNT. We are
left with several non-trivial possibilities. First, one could argue that the native membrane,
present in both biosensor and DCPIP experiments and for both BBY particles and
thylakoid membrane particles not enriched with PS II, adversely affects the accessibility
15
of the QB binding site to TNT. Alternatively, one could suggest the presence of an
alternative site for TNT docking, with very high affinity, and with binding to this site not
affecting electron transport. In both cases the effective concentration of TNT experienced
by the QB site would be significantly lower than TNT concentration in solution. With
respect to the second mechanism we note that a TNT binding site with similar affinity has
been discovered on the CP43 protein of PS II by accident in the course of our modeling
study. However, a site with the affinity just comparable to that of the QB site cannot alone
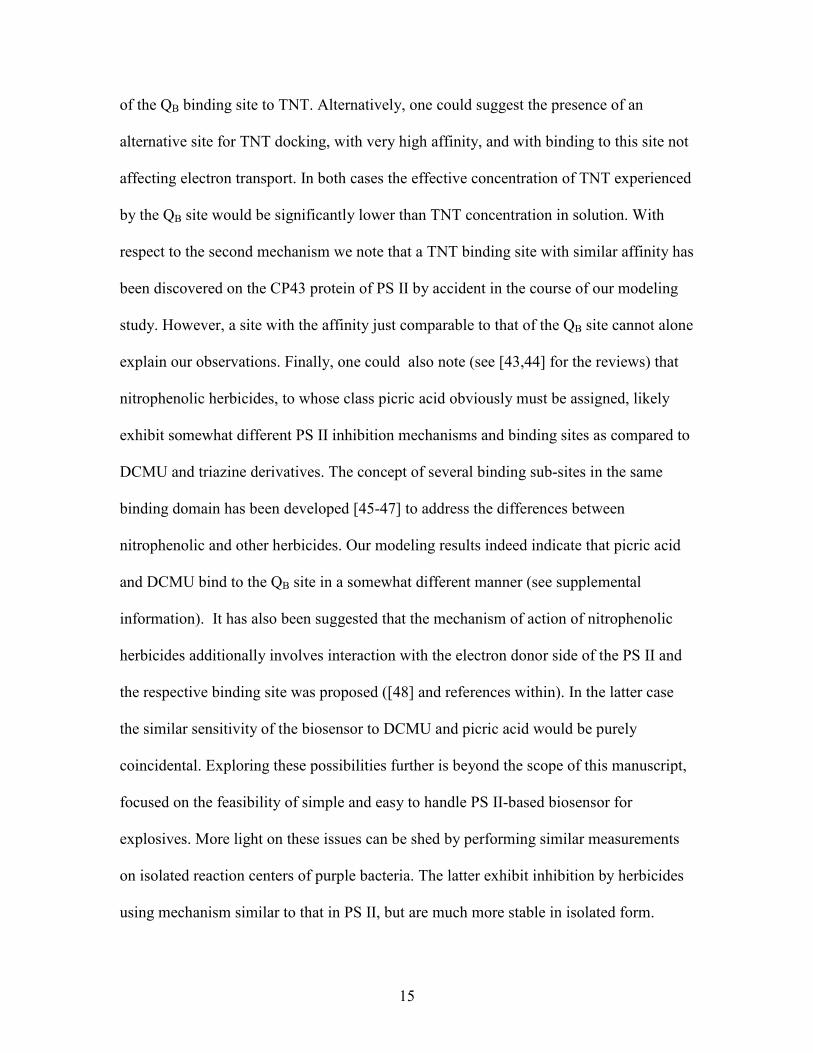
explain our observations. Finally, one could also note (see [43,44] for the reviews) that
nitrophenolic herbicides, to whose class picric acid obviously must be assigned, likely
exhibit somewhat different PS II inhibition mechanisms and binding sites as compared to
DCMU and triazine derivatives. The concept of several binding sub-sites in the same
binding domain has been developed [45-47] to address the differences between
nitrophenolic and other herbicides. Our modeling results indeed indicate that picric acid
and DCMU bind to the QB site in a somewhat different manner (see supplemental
information). It has also been suggested that the mechanism of action of nitrophenolic
herbicides additionally involves interaction with the electron donor side of the PS II and
the respective binding site was proposed ([48] and references within). In the latter case
the similar sensitivity of the biosensor to DCMU and picric acid would be purely
coincidental. Exploring these possibilities further is beyond the scope of this manuscript,
focused on the feasibility of simple and easy to handle PS II-based biosensor for
explosives. More light on these issues can be shed by performing similar measurements
on isolated reaction centers of purple bacteria. The latter exhibit inhibition by herbicides
using mechanism similar to that in PS II, but are much more stable in isolated form.

16
4. Conclusions
An application of a biosensor based on Photosystem II-enriched BBY particles
from spinach leaves and inexpensive commercially available screen-printed electrodes to
detection of various photosynthesis inhibitors is described. The biosensor with BBY
particles immobilized with BSA-glutaraldehyde is capable of detecting not only the
herbicides, as earlier reported in the literature, but also some explosives. While picric
acid was detected in concentrations similar to those of the widespread herbicides (and
with similar concentration dependence likely indicating QB site binding), the limit of
detection for TNT is significantly higher (worse). Thus, from the viewpoint of explosives
detection, the PS II-based biosensor reported in this work, although not impressive as a
stand-alone device for TNT detection, could be employed as one component of the
“orthogonal” detection schemes involving several methods of detection based on
different physical, chemical or biological principles. The screen-printing technology
allows for the mass production of identical low-cost disposable biosensor components of
such schemes (these components, once prepared, can be stored at low temperatures for
extensive periods of time until used). It is important to point out that this sensor is
intended for early warning applications and as such is not capable of distinguishing
between different explosives if they are present in unknown concentrations. Similar
statement can be made concerning application of the PS II-based biosensors for herbicide
detection [7-15]. The present biosensor also may be employed in environmental
protection and pharmaceutical applications for rapid screening of picric acid in water
samples [18,19]. Determination of the reasons for low sensitivity of the PS II-based
17
biosensor to TNT requires extended research, including that involving isolated bacterial
reaction centers as well as other types of explosives resembling different classes of
herbicides (e.g. RDX explosive versus atrazine herbicide).
Acknowledgments:
Authors are thankful to Drs. Cameron Skinner and Laszlo Kalman of Concordia
University and Dr. Sandro Carrara, EPFL, Lausanne, Switzerland, for useful discussions.
The funding has been provided by NSERC under Strategic Grants Program, Safety and
Security. We acknowledge Defense R&D Canada, RCMP, CBSA and CATSA as
supporting organizations.

18
Vitae: Valter Zazubovich
Valter Zazubovich received his Ph.D. in condensed matter physics from the University of Tartu, Estonia, in 1999. His graduate work focused on impurity center spectroscopy in amorphous and incommensurate solids. He then joined the group of Professor Gerald J. Small at Iowa State University. There he explored energy and charge transfer processes and pigment-protein interactions in photosynthetic chlorophyll-protein complexes. Since 2005 Dr. Zazubovich is a faculty member of Concordia University in Montreal, Canada. His research interests include spectroscopic manifestations of primary processes of photosynthesis and of protein dynamics, as well novel bio- and biomimetic sensors for explosives detection. Vitae: Vijayender Bhalla
Vijayender Bhalla obtained his Ph.D. in bio-nanotechnology jointly from CSIO and Panjab University in Chandigarh, India, in 2006. His graduate research on DNA-based biomolecular electronics was supervised by Dr. Lalit Bharadwaj. After graduating Vijayender first joined the group of Dr. Bruno Samori at the University of Bologna, and later moved to Montreal to join Valter Zazubovich at Concordia. Currently Dr. Bhalla is a Pool Scientist at the Biosensors Laboratory, Microbial Research Institute in Chandigarh. His research is focused on development of label-free immunosensors for herbicides detection.
Vitae: Xin Zhao
Xin Zhao obtained her B.Sc. and M. Sc. degrees in Chemistry from the University of Tianjin, China, under supervision of Dr. Yang Qui Hua. Her research project was devoted to the studies of nano-perovskite photocatalysts. In 2008 Xin joined Concordia Department of Chemistry and Biochemistry as a graduate student and since then has been involved in the development of biosensors for explosives detection under supervision of Dr. Zazubovich. She was awarded another M. Sc. degree in 2010.

19
References
[1] J. V. Goodpaster, V. L. McGuffin, Anal. Chem. 73 (2001) 2004.
[2] K. Albert, J. D. R. Walt, Anal. Chem. 72 (2001) 1947.
[3] J. S. Yang, T. M. Swager, J. Am. Chem. Soc. 120 (1998) 5321.
[4] A. Rose, Z. Zhu, C. F. Madigan, T. M. Swager, B. Vladimir, Nature 434 (2005) 876.
[5] R. D. Shankaran, K. V. Gobi, T. Sakai, K. Matsumoto, K. Toko, N. Miura, Biosens.
Bioelectron. 20 (2005) 1750.
[6] R. S. Burlage, K. Everman, D. Patek, 1999, U.S. Patent 5,972,638.
[7] R. Carpentier, S. Lemieux, M. Mimeault, M. Purcell, D. C. Goetze, Bioelectrochem.
Bioenerg. 22 (1989) 391.
[8] D. Laberge, J. Chartrand, R. Rouillon, R. Carpentier, Env. Toxicol. Chem. 18 (1999)
2851.
[9] M. T. Giardi, M. Koblízek, J. Masojídek, Biosens. Bioelectron. 16 (2001) 1027.
[10] M. Koblízek, J. Masojídek, J. Komenda, T. Kucera, R. Pilloton, A. K. Mattoo, M. T.
Giardi, Biotech. Bioeng. 60 (1998) 664.
[11] M. Koblízek, J. Malý, J. Masojídek, J. Komenda, T. Kucera, M. T. Giardi, A. K.
Mattoo, R. Pilloton, Biotech. Bioeng. 78 (2002) 110.
[12] J. Maly, A. Masci, J. Masojidek, M. Sugiura, R. Pilloton, Anal. Letts. 37 (2004)
1645.
[13] J. Maly, B. J. Maly, C. Di Meo, M. De Francesco, A. Masci, J. Masojidek, M.
Sugiura, A. Volpe, R. Pilloton, Bioelectrochem. 63 (2004) 271.
[14] A. Tibuzzi, G. Pezzotti, T. Lavecchia, G. Rea, M. T. Giardi, Sens. Transducers 88
(2008) 9.

20
[15] M. Campàs, R. Carpentier, R. Rouillon, Biotechnol. Adv. 26 (2008) 370.
[16] C. Jian, W. R. Seitz, Anal. Chim. Acta. 237 (1990) 265.
[17] H. H. Zeng, K. M. Wang, R. Q. Yu, Talanta 40 (1993) 1569.
[18] C. G. Niu, Z. Z. Li, X. B. Zhang, W. Q. Lin, G. L. Shen, R. Q. Yu, Anal. Bioanal.
Chem. 372 (2002) 519.
[19] X. Yang, C. G. Niu, G. L. Shen, R. Q. Yu, Analyst 126 (2001) 349.
[20] W. Oettmeier, K. Masson, Eur. J. Biochem. 122 (1982) 163.
[21] E. Ercag, A. Uzer, R. Apak, Talanta 78 (2009) 772.
[22] E. Ercag, A. Uzer, R. Apak, Analytica Chimica Acta 505 (2004) 83.
[23] J. Wannlund, M. Deluca, Anal. Biochem. 122 (1982) 385.
[24] J. Wang, R. K. Bhada, J. Lu, D. MacDonald, Anal. Chim. Acta. 361 (1998) 85.
[25] H. Sohn, R. M. Calhoun, M. J. Sailor, W. C. Trogler, Angew. Chem. Int. Ed., 113
(2001) 2162.
[26] K. S. Ro, A. Venugopal, D. D. Adrian, D. Constant, K. Qaisi, K. T. Valsaraj, L. J.
Thibodeaux, D. Roy, J. Chem. Eng. Data, 41 (1996) 758.
[27] N. D. Ali, D. Dewez, P.Y. Robidoux, R. Popovic, Ecotoxicology 15 (2006) 437.
[28] D. A. Berthold, G. T. Babcock, C. F. Yocum, FEBS Lett., 134 (1981) 231.
[29] P. J. van Leeuwen, M. C. Nieveen, E. J. van de Meent, J. P. Dekker, H. J. Gorkom,
Photosyn. Res. 28 (1991) 149-153.
[30] D. I. Arnon, Plant Physiol. 24 (1949) 1.
[31] R. Carpentier, S. Lemieux, Appl. Biochem. Biotechnol. 15 (1987) 107.
[32] S. Lemieux, R. Carpentier, Photochem. Photobiol. 48 (1988) 115.
[33] D. Laberge, R. Rouillon, R. Carpentier, Enz. Microb. Technol. 26 (2000) 332.

21
[34] C. Loranger, R. Carpentier, Biotechnol. Bioeng. 44 (1994) 178.
[35] F. Bettazzi, L. Laschi, M. Mascini, Anal. Chim. Acta 589 (2007) 14.
[36] J. Lu, Z. Zhang, Anal. Chim. Acta. 318 (1996) 175.
[37] G. He, H. Peng, T. Liu, M. Yang, Y. Zhang, Y. Fang, J. Mater. Chem. 19 (2009)
7347.
[38] G. M. Morris, D. S. Goodsell, R. S. Halliday, R. Huey, W. E. Hart, R. K. Belew, A.
J. Olson, J. Comp. Chem. 19 (1998) 1639.
[39] R. Huey, G. M. Morris, A. J. Olson, D. S. Goodsell, J. Comp. Chem. 28 (2007)
1145.
[40] A. Guskov, J. Kern, A. Gabdulkhakov, M. Broser, A. Zouni, W. Saenger, Nature
Struct. Mol. Biol. 16 (2009) 334.
[41] E. P. Fuerst, M. A. Norman, Weed Science 39 (1991) 458
[42] K. N. Ferreira, T. M. Iverson, K. Maghlaoui, J. Barber, S. Iwata, Science 303 (2004)
1831.
[43] J. J. S. van Rensen, Physiol. Plant. 54 (1982) 515.
[44] W. Draber, K. Tietjen, J. F. Kluth, A. Trebst, Angew. Chem. Int. Ed. 30 (1991)
1621.
[45] A. Trebst, W. Draber, in Advances in Pesticide Science, Part 2, Pergamon, Oxford,
1979, p.223.
[46] A. Trebst, Methods Enyzmol. 69 (1980) 675.
[47] C. J. Arntzen, C. L., Ditto, P. E. Brewer, Proc. Natl. Acad. Sci., USA, 76 (1979)
278.
[48] O. Kaminskaya, V. A. Shuvalov, G. Renger, Biochemistry 46 (2007) 1091.
22
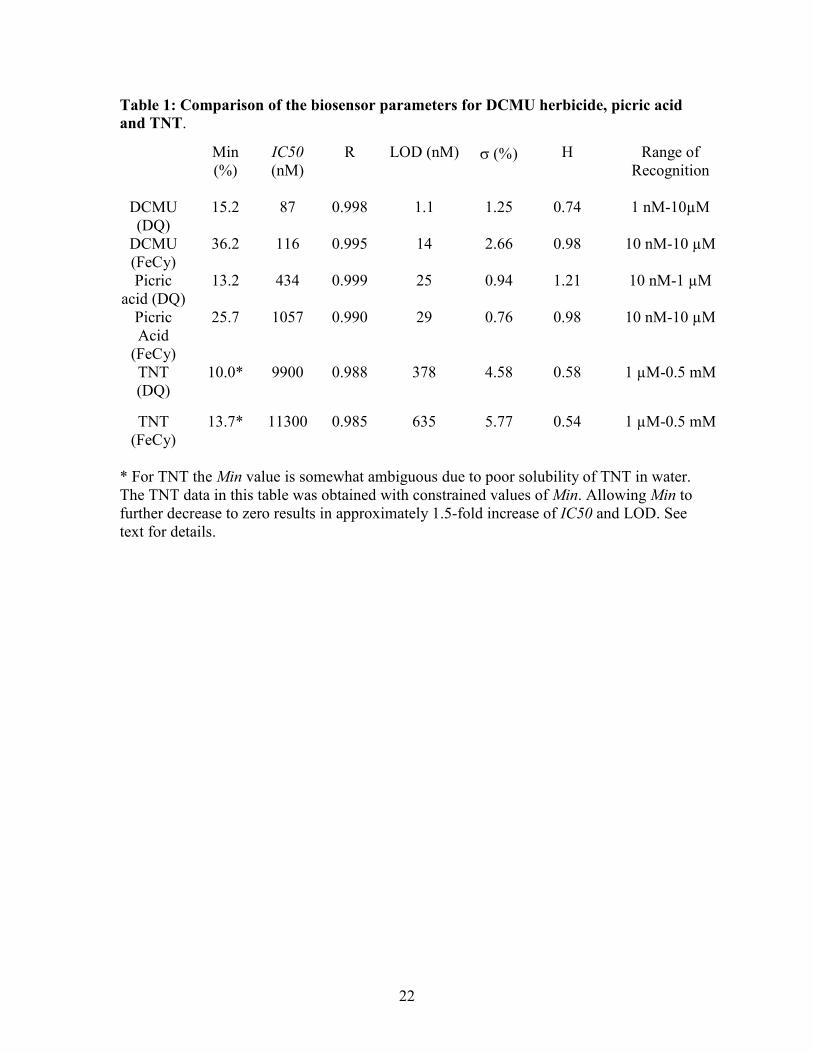
Table 1: Comparison of the biosensor parameters for DCMU herbicide, picric acid
and TNT.
* For TNT the Min value is somewhat ambiguous due to poor solubility of TNT in water. The TNT data in this table was obtained with constrained values of Min. Allowing Min to further decrease to zero results in approximately 1.5-fold increase of IC50 and LOD. See text for details.
Min (%)
IC50 (nM)
R LOD (nM) σ (%) H Range of Recognition
DCMU (DQ)
15.2 87 0.998 1.1 1.25 0.74 1 nM-10µM
DCMU (FeCy)
36.2 116 0.995 14 2.66 0.98 10 nM-10 µM
Picric acid (DQ)
13.2 434 0.999 25 0.94 1.21 10 nM-1 µM
Picric Acid
(FeCy)
25.7 1057 0.990 29 0.76 0.98 10 nM-10 µM
TNT (DQ)
10.0* 9900
0.988 378 4.58 0.58 1 µM-0.5 mM
TNT (FeCy)
13.7* 11300
0.985 635 5.77 0.54 1 µM-0.5 mM

23
Figure captions:
Figure 1. Chemical structures of some herbicides and explosive compounds. A: DCMU
(3-(3,4-dichlorophenyl)-1,1-dimethylurea); B: phenolic herbicide DNOC, 4,6-dinitro-o-
cresol; C: picric acid, 2,4,6- trinitrophenol and D: TNT, 2,4,6-trinitrotoluene.
Figure 2. A: The schematics of the biosensor. Vertically elongated green ellipses: PS II-
containing particles; yellow circles: BSA; black circles: mediator. B: Representative
signal (in the absence of any inhibitor). Illumination of the biosensor results in the
photocurrent peak. The magnitude of the peak is indicated by a double-ended arrow. In
the presence of the inhibitor the peak magnitude is reduced.
Figure 3. Residual activity of the BBY particle-based biosensor for DCMU (A), picric
acid (B) and TNT (C) versus inhibitor concentration. DQ was used as a mediator. In
Frame C data from separate experiments is combined.
Figure 4. Orientation of DCMU (A), picric acid (B) and TNT (C) molecules in the QB
binding site of the PS II according to AutoDock modeling. The inhibitor molecule is
depicted in sticks. Yellow dashed lines represent the hydrogen bonds; the numbers
associated with these bonds are their lengths in Ǻ.
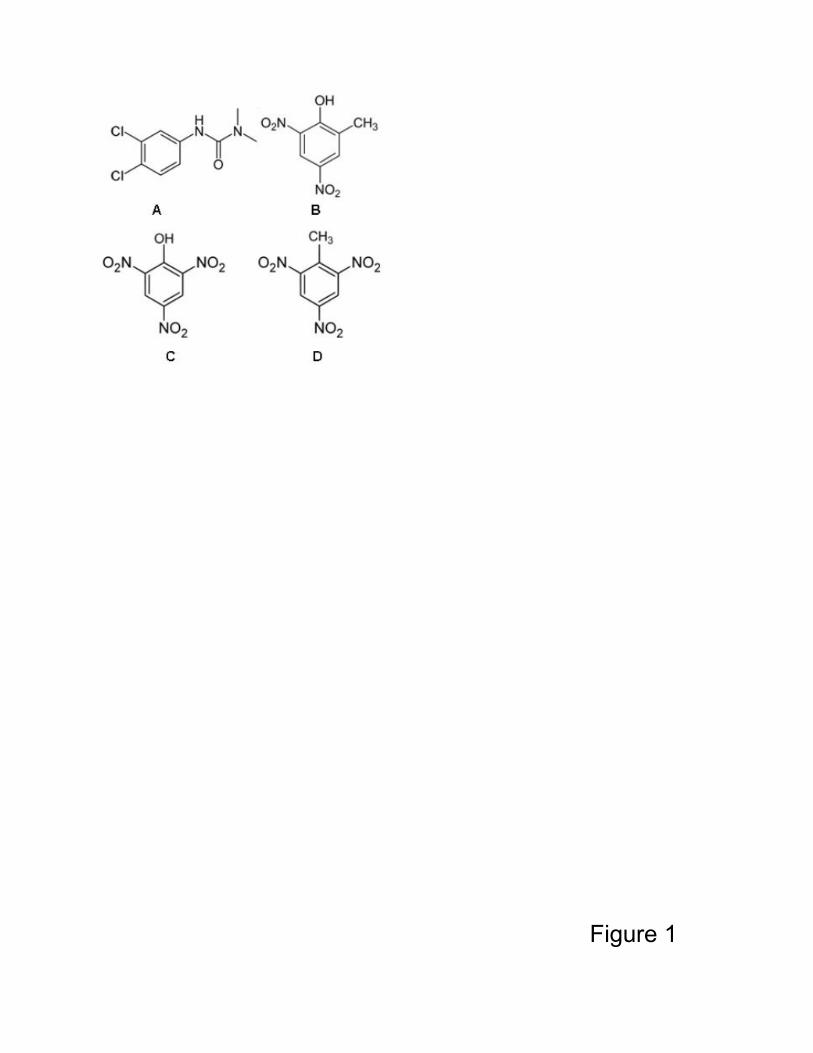
Figure 1
Working electrode (PS II)
Reference electrode
Figure 2
Time (s)
Curren
t (nA)
Light ON
Light OFF
A
B

Figure 3
Concentration (nM)
Residual A
ctivirty
(%)
101 103 1050
20
40
60
80
100
10-2 100 102 1040
20
40
60
80
100
100 101 102 103 1040
20
40
60
80
100
A
B
C
DCMU
Picric Acid
TNT

Figure 4
PHE 265
2.5
A: DCMU
B: Picric Acid
PHE 265
2.7
HIS 215
2.7
C: TNT
PHE 265
2.7
HIS 2152.7

Valter Zazubovich
Vijayender Bhalla
Xin Zhao