Detecting and describing stability and change in COVID-19 ...
22
RESEARCH ARTICLE Detecting and describing stability and change in COVID-19 vaccine receptibility in the United Kingdom and Ireland Philip Hyland 1 , Fre ´de ´ rique Vallières 2 , Todd K. Hartman 3 , Ryan McKay 4 , Sarah Butter ID 5 *, Richard P. Bentall 5 , Orla McBride 6 , Mark ShevlinID 6 , Kate Bennett 7 , Liam Mason 8 , Jilly Gibson-Miller 5 , Liat LevitaID 5 , Anton P. Martinez 5 , Thomas V. A. Stocks 5 , Thanos Karatzias 9 , Jamie Murphy 6 1 Department of Psychology, Maynooth University, Maynooth, Ireland, 2 Trinity Centre for Global Health, Trinity College Dublin, Dublin, Ireland, 3 Sheffield Methods Institute, University of Sheffield, Sheffield, England, 4 Department of Psychology, Royal Holloway, University of London, London, England, 5 Department of Psychology, University of Sheffield, Sheffield, England, 6 School of Psychology, Ulster University, Ulster, Northern Ireland, 7 School of Psychology, University of Liverpool, Liverpool, England, 8 Clinical, Education & Health Psychology, University College London, London, England, 9 School of Health and Social Care, Edinburgh Napier University, Edinburgh, Scotland * [email protected] Abstract COVID-19 continues to pose a threat to global public health. Multiple safe and effective vac- cines against COVID-19 are available with one-third of the global population now vacci- nated. Achieving a sufficient level of vaccine coverage to suppress COVID-19 requires, in part, sufficient acceptance among the public. However, relatively high rates of hesitance and resistance to COVID-19 vaccination persists, threating public health efforts to achieve vaccine-induced population protection. In this study, we examined longitudinal changes in COVID-19 vaccine acceptance, hesitance, and resistance in two nations (the United King- dom and the Republic of Ireland) during the first nine months of the pandemic, and identified individual and psychological factors associated with consistent non-acceptance of COVID- 19 vaccination. Using nationally representative, longitudinal data from the United Kingdom (UK; N = 2025) and Ireland (N = 1041), we found that (1) COVID-19 vaccine acceptance declined in the UK and remained unchanged in Ireland following the emergence of approved vaccines; (2) multiple subgroups existed reflecting people who were consistently willing to be vaccinated (‘Accepters’: 68% in the UK and 61% in Ireland), consistently unwilling to be vaccinated (‘Deniers’: 12% in the UK and 16% in Ireland), and who fluctuated over time (‘Moveable Middle’: 20% in the UK and 23% in Ireland); and (3) the ‘deniers’ and ‘moveable middle’ were distinguishable from the ‘accepters’ on a range of individual (e.g., younger, low income, living alone) and psychological (e.g., distrust of scientists and doctors, conspiracy mindedness) factors. The use of two high-income, Western European nations limits the gen- eralizability of these findings. Nevertheless, understanding how receptibility to COVID-19 vaccination changes as the pandemic unfolds, and the factors that distinguish and charac- terise those that are hesitant and resistant to vaccination is helpful for public health efforts to achieve vaccine-induced population protection against COVID-19. PLOS ONE PLOS ONE | https://doi.org/10.1371/journal.pone.0258871 November 3, 2021 1 / 22 a1111111111 a1111111111 a1111111111 a1111111111 a1111111111 OPEN ACCESS Citation: Hyland P, Vallières F, Hartman TK, McKay R, Butter S, Bentall RP, et al. (2021) Detecting and describing stability and change in COVID-19 vaccine receptibility in the United Kingdom and Ireland. PLoS ONE 16(11): e0258871. https://doi. org/10.1371/journal.pone.0258871 Editor: Jun Tanimoto, Kyushu Daigaku, JAPAN Received: July 23, 2021 Accepted: October 6, 2021 Published: November 3, 2021 Peer Review History: PLOS recognizes the benefits of transparency in the peer review process; therefore, we enable the publication of all of the content of peer review and author responses alongside final, published articles. The editorial history of this article is available here: https://doi.org/10.1371/journal.pone.0258871 Copyright: © 2021 Hyland et al. This is an open access article distributed under the terms of the Creative Commons Attribution License, which permits unrestricted use, distribution, and reproduction in any medium, provided the original author and source are credited. Data Availability Statement: All data files relating to this manuscript are available from the C19PRC Study Open Science Framework page (https://osf. io/ugwdz/files/).
Transcript of Detecting and describing stability and change in COVID-19 ...

RESEARCH ARTICLE
Detecting and describing stability and change
in COVID-19 vaccine receptibility in the United
Kingdom and Ireland
Philip Hyland1, Frederique Vallières2, Todd K. Hartman3, Ryan McKay4, Sarah ButterID5*,
Richard P. Bentall5, Orla McBride6, Mark ShevlinID6, Kate Bennett7, Liam Mason8,
Jilly Gibson-Miller5, Liat LevitaID5, Anton P. Martinez5, Thomas V. A. Stocks5,
Thanos Karatzias9, Jamie Murphy6
1 Department of Psychology, Maynooth University, Maynooth, Ireland, 2 Trinity Centre for Global Health,
Trinity College Dublin, Dublin, Ireland, 3 Sheffield Methods Institute, University of Sheffield, Sheffield,
England, 4 Department of Psychology, Royal Holloway, University of London, London, England,
5 Department of Psychology, University of Sheffield, Sheffield, England, 6 School of Psychology, Ulster
University, Ulster, Northern Ireland, 7 School of Psychology, University of Liverpool, Liverpool, England,
8 Clinical, Education & Health Psychology, University College London, London, England, 9 School of Health
and Social Care, Edinburgh Napier University, Edinburgh, Scotland
Abstract
COVID-19 continues to pose a threat to global public health. Multiple safe and effective vac-
cines against COVID-19 are available with one-third of the global population now vacci-
nated. Achieving a sufficient level of vaccine coverage to suppress COVID-19 requires, in
part, sufficient acceptance among the public. However, relatively high rates of hesitance
and resistance to COVID-19 vaccination persists, threating public health efforts to achieve
vaccine-induced population protection. In this study, we examined longitudinal changes in
COVID-19 vaccine acceptance, hesitance, and resistance in two nations (the United King-
dom and the Republic of Ireland) during the first nine months of the pandemic, and identified
individual and psychological factors associated with consistent non-acceptance of COVID-
19 vaccination. Using nationally representative, longitudinal data from the United Kingdom
(UK; N = 2025) and Ireland (N = 1041), we found that (1) COVID-19 vaccine acceptance
declined in the UK and remained unchanged in Ireland following the emergence of approved
vaccines; (2) multiple subgroups existed reflecting people who were consistently willing to
be vaccinated (‘Accepters’: 68% in the UK and 61% in Ireland), consistently unwilling to be
vaccinated (‘Deniers’: 12% in the UK and 16% in Ireland), and who fluctuated over time
(‘Moveable Middle’: 20% in the UK and 23% in Ireland); and (3) the ‘deniers’ and ‘moveable
middle’ were distinguishable from the ‘accepters’ on a range of individual (e.g., younger, low
income, living alone) and psychological (e.g., distrust of scientists and doctors, conspiracy
mindedness) factors. The use of two high-income, Western European nations limits the gen-
eralizability of these findings. Nevertheless, understanding how receptibility to COVID-19
vaccination changes as the pandemic unfolds, and the factors that distinguish and charac-
terise those that are hesitant and resistant to vaccination is helpful for public health efforts to
achieve vaccine-induced population protection against COVID-19.
PLOS ONE
PLOS ONE | https://doi.org/10.1371/journal.pone.0258871 November 3, 2021 1 / 22
a1111111111
a1111111111
a1111111111
a1111111111
a1111111111
OPEN ACCESS
Citation: Hyland P, Vallières F, Hartman TK, McKay
R, Butter S, Bentall RP, et al. (2021) Detecting and
describing stability and change in COVID-19
vaccine receptibility in the United Kingdom and
Ireland. PLoS ONE 16(11): e0258871. https://doi.
org/10.1371/journal.pone.0258871
Editor: Jun Tanimoto, Kyushu Daigaku, JAPAN
Received: July 23, 2021
Accepted: October 6, 2021
Published: November 3, 2021
Peer Review History: PLOS recognizes the
benefits of transparency in the peer review
process; therefore, we enable the publication of
all of the content of peer review and author
responses alongside final, published articles. The
editorial history of this article is available here:
https://doi.org/10.1371/journal.pone.0258871
Copyright: © 2021 Hyland et al. This is an open
access article distributed under the terms of the
Creative Commons Attribution License, which
permits unrestricted use, distribution, and
reproduction in any medium, provided the original
author and source are credited.
Data Availability Statement: All data files relating
to this manuscript are available from the C19PRC
Study Open Science Framework page (https://osf.
io/ugwdz/files/).

Introduction
The rapid development of safe and effective vaccines against Coronavirus Disease (COVID-
19) represents one of the greatest collaborative scientific achievements of our lifetime. As of
August 2021, four vaccines have been authorised by the European Medicines Agency, three
have been authorized for emergency use by the United States Food and Drug Administration,
and 99 are undergoing clinical trials on humans [1]. Just under five billion vaccines doses have
been administered, globally, meaning that 31% of the world’s population have been vaccinated
and it is estimated that 75% of the world’s population will be vaccinated by February 2021 [2].
Sufficient uptake of COVID-19 vaccines not only requires the coordinated action of govern-
ments, communities, and individuals alike to ensure adequate vaccine delivery (e.g., via pro-
duction, logistics, procurement, financing, and service delivery components of the health
system), but also to ensure vaccine receptibility.
COVID-19 vaccine acceptance rates across the world range from lows of 24% in Kuwait
and 44% in Lebanon to highs of 88% in China and 91% in India [3–5]. Concurrently, rising
rates of vaccine hesitancy, whereby an individual delays or refuses vaccination despite the
availability of inoculation services [6], remains one of the greatest global health threats listed
by the World Health Organization [7]. As the term implies, however, vaccine hesitancy is not
immutable, and individual attitudes towards a specific vaccine can change over time as a func-
tion of a wide-range of interdependent individual, social, and vaccination-specific factors [8,
9] including, but not limited to, perceptions of susceptibility to pathogen exposure [10], sever-
ity of illness [11], perceived vaccine safety and efficacy [11, 12], and recency of vaccine devel-
opment [13]. Accordingly, some have suggested that vaccine hesitancy is better conceptualised
as existing on a continuum and bookended by ‘decliners’ and ‘accepters’, or those who
completely reject or accept all vaccines, respectively [14]. Levels of COVID-19 vaccine accept-
ability have fluctuated considerably throughout the pandemic. Most recent data from the
global survey of knowledge, attitudes, and practices around COVID-19 (KAP COVID-19)—
which has reached over 1.7 million people in 67 countries across as many as 19 waves of data
collection in some contexts—indicates that only 63% of individuals would accept a COVID-19
vaccine as of the 31st of January 2021 [15]. Encouragingly, however, these same data suggest
that willingness to be vaccinated has increased in nations that have successfully launched
COVID-19 vaccination programmes (e.g., the United Kingdom [UK]).
Previous work carried out by our group, the COVID-19 Psychological Research Consor-
tium, found that resistance to COVID-19 vaccination in the UK and the Republic of Ireland is
associated with distrust of experts and authority figures (i.e., scientists, health care profession-
als, and government), stronger religious, conspiratorial, and paranoid beliefs, a higher internal
locus of control, preference for hierarchically structured and authoritarian societies, anti-
migrant views, lower levels of agreeableness, conscientiousness, and emotional stability [16].
Similarly, the ‘attitude roots’ model of science rejection proposes that conspiratorial beliefs,
disgust sensitivity, trait reactance—as a motivational state that arises when people feel that
their behavioural freedom has been threatened or taken away [17]—and hierarchical world-
views are central to understanding individual differences in vaccine resistant attitudes [18–21].
Thus, understanding the individual factors, including psychological dispositions, that predict
whether vaccine hesitant individuals change their minds about COVID-19 vaccination, as well
as the factors that might predict a move towards acceptance or resistance over time is para-
mount, albeit currently less well understood [9].
In light of these existing gaps, the current study was planned with three primary objectives.
The first was to examine changes in COVID-19 vaccine acceptance, hesitance, and resistance
in the Irish and UK adult populations across four time periods (Waves) during the first nine
PLOS ONE COVID-19 vaccine receptibility in the UK and Ireland
PLOS ONE | https://doi.org/10.1371/journal.pone.0258871 November 3, 2021 2 / 22
Funding: UK Research and Innovation/Economic
and Social Research Council funding for the UK
strand of this study was obtained in May 2020
(grant number ES/V004379/1) and awarded to
RPB, TKH, LL, JGM, MS, JM, OM, KB and LM. The
Irish strand of this study was funded by the Health
Research Board and the Irish Research Council
under the COVID-19 Pandemic Rapid Response
Funding Call [COV19-2020-025] awarded to PH.
The funders had no role in study design, data
collection and analysis, decision to publish, or
preparation of the manuscript.
Competing interests: The authors declare the
following financial interests/personal relationships
which may be considered as potential competing
interests: Richard Bentall reports financial support
was provided by UK Research and Innovation.
Philip Hyland reports financial support was
provided by Health Research Board. This does not
alter our adherence to PLOS ONE policies on
sharing data and materials.

months of the global pandemic. We have previously reported on the changes in these popula-
tions across the first three waves of the survey (i.e., March-April, April-May, and July-August
2020) [22]; however, as these data were obtained prior to the development of safe and effective
vaccines for COVID-19, our focus in this study is on changes from Wave 3 (July/August 2020)
to Wave 4 (November/December 2020) when populations transitioned from having to con-
template a hypothetical vaccine to considering an actual, available vaccine.
Understanding that people’s willingness to accept a COVID-19 vaccine may fluctuate over
time, our second objective was to determine if there were multiple groups in each sample with
distinct probabilities of accepting a COVID-19 vaccine over time. We hypothesised that there
would be two stable groups in each sample: one representing people with consistently high
probabilities of accepting a COVID-19 vaccine (‘Accepters’), and the other representing people
with consistently low probabilities of accepting a COVID-19 vaccine (‘Deniers’). Additionally,
we expected to identify a group (or groups) in each sample with fluctuating probabilities of
accepting a COVID-19 vaccine; a group that have often been termed the movable middle.
Finally, we sought to identity key sociodemographic and psychological factors that were
associated with belonging to any group that was not consistent in their acceptance of a
COVID-19 vaccine. Our intention with the second and third objectives was to develop a com-
prehensive understanding of the people who were not consistent in their willingness to accept a
COVID-19 vaccine so that targeted and effective public health strategies could be developed to
reach those who can still change their minds.
Material and methods
Participants and procedures
This study is based on data from the Irish and UK strands of the COVID-19 Psychological
Research Consortium (C19PRC) study. The C19PRC study was established to track the social,
political, economic, and mental health effects of the COVID-19 pandemic on society. Data for
this study were collected at four assessment points during the first nine months of the
COVID-19 pandemic. Wave 1 data were collected in the UK between March 23rd and 28th,
2020, and in Ireland between March 30th and April 5th, 2020. These dates coincided with the
initial public health lockdown measures in the respective countries. Wave 2 data were collected
in the UK from April 22nd to May 1st, 2020, and in Ireland from April 30th to May 19th, 2020.
Wave 3 data were collected in the UK from July 9th to July 23rd, 2020, and in Ireland from July
16th to August 8th, 2020. Finally, Wave 4 data were collected in the UK from November 25th to
December 22nd, 2020, and in Ireland from December 2nd to December 22nd, 2020.
The UK and Irish samples were collected using a non-probability Internet panel survey
design. The survey research company Qualtrics was employed to recruit participants from tra-
ditional, actively managed, double-opt-in research panels via email, SMS, or in-app notifica-
tions. Inclusion criteria for both samples were that respondents were aged 18 years or older,
residing in the UK or Ireland, respectively, and capable of completing the survey in English.
Ethical approval was granted by the research ethics committees at the University of Sheffield
(Reference number: 033759), Ulster University (Reference number: 230320), and Maynooth
University (Reference number: SRESC-2020-2402202). Participants were remunerated by
Qualtrics, and informed electronic consent was obtained from all participants. Quota sampling
methods were used at Wave 1 to generate samples that represented the general adult popula-
tions of both nations. In the UK, the sample was recruited to match known population quotas
for sex, age, and income distributions. In Ireland, the sample was recruited to match known
population quotas for sex, age, and regional distribution. Further details regarding the UK and
Irish samples, including evidence of their representativeness, are presented elsewhere [23–25].
PLOS ONE COVID-19 vaccine receptibility in the UK and Ireland
PLOS ONE | https://doi.org/10.1371/journal.pone.0258871 November 3, 2021 3 / 22

As described in an earlier study [16], power analyses to determine optimal sample sizes
were calculated to detect common mental health disorders such as Major Depressive Disorder
and Posttraumatic Stress Disorder. Sample size calculations were performed to detect a disor-
der with a 4% prevalence rate, with a precision of 1%, and 95% confidence levels. This resulted
in a required sample size of 1,476. As Qualtrics could only guarantee a sample size of 1,000 par-
ticipants in Ireland, this was set as the target sample size in Ireland. Holding all other parame-
ters in the sample size calculation equal, this sample size resulted in a precision of 1.21%.
Given the substantially larger population of the UK and thus the availability of a larger pool of
potential participants, we set a target sample size of 2,000 people.
At Wave 1, the sample size in the UK was 2,025 and 1,041 in Ireland. The sociodemo-
graphic characteristics for both samples at Wave 1 are reported in Table 1. In the UK, the
recontact rate was 69% (n = 1406) at Wave 2, 58% (n = 1166) at Wave 3, and 63% (n = 1271) at
Wave 4. Those who responded at each wave significantly differed (p< .05) from non-respond-
ers on a range of sociodemographic variables including being older, male, living with fewer
adults, higher income earners, born in the UK, not living in a city, having a post-secondary
education, and not having a suspected or confirmed COVID-19 infection.
In Ireland, the recontact rate was 49% (n = 506) at Wave 2, 51% (n = 534) at Wave 3, and
40% (n = 416) at Wave 4. Respondents significantly differed (p< .05) from non-responders by
being older, more likely to have been born in Ireland, not living in a city, to have a pre-existing
health condition, and not having a suspected or confirmed COVID-19 infection. Management
of missing data is outlined in the data analysis section.
Materials
COVID-19 vaccination status. In the UK and Irish samples, participants were asked the
following question at Waves 1, 2, and 3: ‘If a new vaccine were to be developed that could pre-
vent COVID-19, would you accept it for yourself?’ At Wave 4, participants in both samples
were asked: ‘Multiple vaccines for COVID-19 have now been developed. Will you take a vac-
cine for COVID-19 when it becomes available to you?’ The response options at all times were
‘Yes’, ‘Maybe’, and ‘No’. Those who answered ‘Yes’ were classified as ‘vaccine accepting’, those
who responded ‘Maybe’ were classified as ‘vaccine hesitant’, and those who responded ‘No’
were classified as ‘vaccine resistant’.
Sociodemographic, political, and health indicators (Measured at Wave 1). The sociode-
mographic, political, and health indicator variables used in this study were identical to those
utilized in our previous study [16], and all are listed in Table 1. For analytical purposes, several
of these variables were recoded. Living location was recoded to represent city dwelling vs. non-
city dwelling; education status was recoded to represent post-secondary education vs. non-
post-secondary education; employment status was recoded to represent unemployed vs. all
other options; and religion was recoded to represent any religious identification vs. atheist or
agnostic. Additionally, due to limited numbers in various subgroups, ethnicity was recoded to
represent self-identified Irish ethnicity vs. non-Irish ethnicity in the Irish sample.
Psychological indicators (Measured at Wave 1). Personality traits. The Big-Five Inven-
tory (BFI-10) [26] measures the traits of openness to experience, conscientiousness, extraver-
sion, agreeableness, and neuroticism. Each trait is measured by two items using a five-point
Likert scale that ranges from ‘strongly disagree’ (1) to ‘strongly agree’ (5). Higher scores reflect
higher levels of each personality trait, and Rammstedt and John [26] reported good reliability
and validity for the BFI-10 scale scores. Internal reliability coefficients are not provided as this
scale measures each trait using only two items, and it is well documented that coefficient alpha
is inappropriate and meaningless for two-item scales [27].
PLOS ONE COVID-19 vaccine receptibility in the UK and Ireland
PLOS ONE | https://doi.org/10.1371/journal.pone.0258871 November 3, 2021 4 / 22

Table 1. Sociodemographic characteristics of the Irish and UK samples.
Ireland (N = 1041) % UK (N = 2025) %
Sex Sex
Female 51.5 Female 51.7
Male 48.2 Male 48.3
Age Age
18–24 11.1 18–24 12.1
25–34 19.2 25–34 18.8
35–44 20.6 35–44 17.4
45–54 15.9 45–54 20.2
55–64 21.0 55–64 17.2
65+ 12.2 65+ 14.2
Born in Ireland 70.7 Born in UK 90.6
Region of Ireland Region of UK
Leinster 55.3 England 86.9
Munster 27.3 Scotland 7.8
Connacht 12.0 Wales 3.1
Ulster 5.4 Northern Ireland 2.3
Ethnicity Ethnicity
Irish 74.8 White British/Irish 85.5
Irish Traveller 0.3 White non-British/Irish 5.7
Other White background 17.3 Indian 2.0
African 1.9 Pakistani 1.3
Other Black background 0.3 Chinese 0.9
Chinese 0.4 Afro-Caribbean 0.6
Other Asian 3.2 African 1.3
Mixed Background 1.8 Arab 0.1
Bangladeshi 0.3
Other Asian 0.5
Living location Living location
City 24.5 City 24.6
Suburb 18.1 Suburb 28.2
Town 26.8 Town 30.6
Rural 28.8 Rural 16.5
Highest Education Highest Education
No qualification 1.2 No qualifications 2.9
Finished mandatory schooling 6.4 O-level/GCSE or similar 19.0
Finished secondary school 22.4 A-level or similar 18.1
Undergraduate degree 22.5 Diploma 5.6
Postgraduate degree 19.8 Undergraduate degree 28.2
Other technical qualification 27.9 Postgraduate degree 15.6
Technical qualification 9.3
Other 1.3
2019 income 2019 income
0-€19,999 24.6 £0-£15490 20.2
€20,000-29,999 21.3 £15,491-£25,340 20.2
€30,000-€39,999 19.5 £25,341-£38,740 19.0
€40,000-€49,999 12.7 £38,741-£57,930 20.2
€50,000+ 21.9 £57,931+ 20.2
(Continued)
PLOS ONE COVID-19 vaccine receptibility in the UK and Ireland
PLOS ONE | https://doi.org/10.1371/journal.pone.0258871 November 3, 2021 5 / 22

Locus of control. The Locus of Control Scale (LoC) [28] measures internal (e.g., ‘My life is
determined by my own actions’) and external locus of control. The latter has two components,
‘Chance’ (e.g., ‘To a great extent, my life is controlled by accidental happenings’) and ‘Powerful
Others’ (e.g., ‘Getting what I want requires pleasing those people above me’). Each subscale
was measured using three questions and a seven-point Likert scale that ranges from ‘strongly
disagree’ (1) to ‘strongly agree’ (7). Higher scores reflect higher levels of each construct. The
internal reliabilities of the Internal and Chance subscale scores in the Irish sample were slightly
lower than desirable (α = .67 &.63, respectively) but somewhat stronger for the UK sample (α= .71 &.70, respectively), while those for the Powerful Others subscale scores were good in
both samples (Ireland: α = .78; UK: α = .85).
Table 1. (Continued)
Ireland (N = 1041) % UK (N = 2025) %
Employment status Employment status
Full-time (self)/employed 43.3 Full-time (self)/employed 48.8
Part-time (self)/employed 15.7 Part-time (self)/employed 15.0
Retired 15.0 Retired 16.5
Unemployed 8.4 Unemployed 11.7
Student 6.3 Student 4.7
Unemployed (disability or illness) 5.6 Unemployed (disability or illness) 3.4
Unemployed due to COVID-19 5.7
Religious identification Religious identification
Christian 69.8 Christian 50.4
Muslim 1.6 Muslim 3.0
Jewish 0.2 Jewish 0.8
Hindu 1.1 Hindu 0.6
Buddhist 0.6 Buddhist 0.8
Sikh 0.1 Sikh 0.5
Other religion 3.8 Other 6.0
Atheist 15.3 Atheist 25.4
Agnostic 7.5 Agnostic 12.5
Lone adult in household Lone adult in household
Yes 18.4 Yes 22.4
Children in the household Children in the household
Yes 39.7 Yes 29.2
Physical health problem 16.7 Physical health problem 15.4
Pregnant 4.0 Pregnant 3.8
COVID-19 infection—self 2.3 COVID-19 infection—self 2.4
COVID-19 infection—other 6.7 COVID-19 infection—other 5.5
Mental health treatment 33.0 Mental health treatment 32.0
Voting behaviour Voting behaviour
Fine Gael 17.4 Conservative Party 42.0
Fianna Fail 11.9 Labour Party 28.4
Sinn Fein 22.8 Liberal Democrats 10.3
Green Party 5.4 Green Party 5.0
Labour Party 3.8 Other nationalist parties 5.1
Other left-wing parties 6.1 Other unionist parties 3.3
Independent 8.1 Other party 2.8
Did not vote 24.5 Did not vote 4.2
https://doi.org/10.1371/journal.pone.0258871.t001
PLOS ONE COVID-19 vaccine receptibility in the UK and Ireland
PLOS ONE | https://doi.org/10.1371/journal.pone.0258871 November 3, 2021 6 / 22

Analytical/reflective reasoning. The Cognitive Reflection Task (CRT) [29] is a three-item
measure of analytical reasoning where respondents are asked to solve logical problems
designed to hint at intuitively appealing but incorrect responses. The response format was
multiple choice with three foil answers (including the hinted incorrect answer), as recom-
mended by Sirota and Juanchich [30]. The internal reliabilities of the CRT scores in the Irish
and UK samples were α = .67 and α = .69, respectively.
Altruism. The Identification with all Humanity scale (IWAH) [31] is a nine-item scale.
Respondents are asked to respond to three statements with reference to three groups; people
in my community, people from Ireland/ the UK, and all humans everywhere. The three state-
ments were presented to respondents separately for each of the three groups, as follows: (1)
How much do you identify with (feel a part of, feel love toward, have concern for) . . .? (2)
How much would you say you care (feel upset, want to help) when bad things happen to . . .?
And, (3) When they are in need, how much do you want to help. . .? Response scale ranged
from 1 ‘not at all’ to 5 ‘very much’. Higher scores reflect greater identification with others, care
for others, and a desire to help others. The internal reliabilities of each subscale of the IWAH
in both the Irish and UK samples were excellent (identification with others α = .79 &.81; care
for others α = .88 &.89; desire to help others α = .86 &.88, respectively).
Conspiracy beliefs. The Conspiracy Mentality Scale (CMS) [32] measures conspiracy
mindedness using five items with each scored on an 11-point scale (1 = ‘Certainly not 0%’ to
11 = ‘Certainly 100%’). Items include, ‘I think that many very important things happen in the
world, which the public is never informed about’, and ‘I think that there are secret organiza-
tions that greatly influence political decisions’. The internal reliability of the CMS in both the
Irish and UK samples was good (α = .84 &.85, respectively).
Paranoia. The five-item persecution subscale from the Persecution and Deservedness Scale
was used [33]. Participants rate their agreement with statements such as “I’m often suspicious
of other people’s intentions towards me” and “You should only trust yourself.” Response
options ranged from ‘strongly disagree’ (1) to ‘strongly agree’ (5) with higher scores reflecting
higher levels of paranoia. The psychometric properties of the scale scores have been previously
supported [34], and the internal reliability in both the Irish and UK samples was good (α = .83
&.86, respectively).
Trust. Respondents were asked to indicate the level of trust they have in political parties,
Parliament, the government, the police, the legal system, scientists, and doctors and other
health professionals. Responses were scored on a five-point Likert scale ranging from ‘do not
trust at all’ (1) to ‘completely trust’ (5). For this study, responses to the first five institutions
were summed to generate a total score for ‘trust in the state’. Responses to the final two ques-
tions were summed to generate a total score for ‘trust in scientists and doctors/health
professionals’.
Authoritarianism. The Very Short Authoritarianism Scale [35] includes six items assessing
agreement with statements such as: ‘It’s great that many young people today are prepared to
defy authority’ and ‘What our country needs most is discipline, with everyone following our
leaders in unity’. All items were scored on a five-point Likert scale ranging from ‘strongly dis-
agree’ (1) to ‘strongly agree’ (5), with higher scores reflecting higher levels of authoritarianism.
The internal reliability of the scale scores in the Irish sample was lower than desirable (α = .58)
but somewhat stronger for the UK sample (a = .65).
Social dominance. Respondents’ levels of social dominance orientation were assessed using
the eight-item Social Dominance Scale [36]. Respondents were asked the extent to which they
opposed/favoured statements such as: ‘An ideal society requires some groups to be on top and
others to be on the bottom’; ‘Some groups of people are simply inferior to other groups’; and
‘We should do what we can to equalize conditions for different groups’. Responses were scored
PLOS ONE COVID-19 vaccine receptibility in the UK and Ireland
PLOS ONE | https://doi.org/10.1371/journal.pone.0258871 November 3, 2021 7 / 22

using a 5-point Likert scale ranging from 1 ‘Strongly oppose’ to 5 ‘Strongly Favour’. Ho and
colleagues demonstrated that the scale had good criterion and construct validity [36]. The
internal reliability of the scale scores in both the Irish and UK samples was good (α = .79 &.82,
respectively).
Attitude towards migrants. Two items assessing respondents’ attitudes towards migrants
were taken from the British Social Attitudes Survey 2015 [37]. These were, (1) ‘Would you say
it is generally bad or good for the UK’s economy that migrants come to the UK from other
countries?’ (scored on a 10-point scale ranging from 1 ‘extremely bad’ to 10 ‘extremely good’),
and (2) ‘Would you say that the UK’s cultural life is generally undermined or enriched by
migrants coming to live here from other countries?’ (scored on a 10-point scale ranging from
1 ‘undermined’ to 10 ‘enriched’). These items were phrased appropriately for use with the Irish
sample.
Data analysis
The first objective was assessed by means of structural equation modelling (SEM). A SEM
approach was used so that missing data could be most effectively managed using full informa-
tion robust maximum likelihood estimation (MLR) [38]. This approach is helpful because it
means that all available information at Wave 1 is used to estimate missingness at future waves,
thus ensuring minimal loss of statistical power or sample representativeness. This method of
estimation can also handle non-normally distributed variables [39]. This analytic process
involved three steps. First, a ‘null’ model was specified where the proportions (e.g., in vaccine
acceptance, hesitance, and resistance—all are estimated individually) at Waves 1–4 were con-
strained to be equal. Second, an ‘alternative’ model was specified where the proportions were
freely estimated at each wave. These models differed by three degrees of freedom and significant
differences in model fit were tested using a loglikelihood ratio test (LRT), which follows a chi-
square (χ2) distribution. Third, post-hoc pairwise comparisons were tested using a Wald χ2 test.
The second objective was assessed using latent class analysis (LCA). Responses to the ques-
tion about willingness to accept a COVID-19 vaccine (0 = Yes, 1 = Maybe, 2 = No) at Waves
1–4 were used as the observed indicators in the model. To understand the probability of con-
sistent acceptance of a COVID-19 vaccine across time, we focused our interpretations on the
probability of the first response (i.e., ‘Yes’) within each class. Models with one to six classes
were estimated in the Irish and UK samples using MLR. To avoid solutions based on local
maxima, 500 random starting values and 50 final stage optimizations were used. The relative
fit of these models was compared using three information theory based fit statistics: the Akaike
Information Criterion (AIC) [40], the Bayesian Information Criterion (BIC) [41] and the sam-
ple size adjusted Bayesian Information Criterion (ssaBIC) [42]. The solution with the lowest
value of these statistics is deemed superior, or if no minimum is found then the ‘diminishing
gains in model fit’ for additional classes can be examined [43]. Simulation studies suggest that
the BIC is optimal for identifying the correct number of classes [44]. Additionally, the Lo-
Mendell-Rubin adjusted likelihood ratio test (LMR-A) [45] was used to compare models with
increasing numbers of latent classes. When a non-significant value occurs, the model with one
fewer class should be accepted. Model convergence, replication of the log-likelihood, entropy
values, the plausibility of the model estimates, and the interpretability of the model solutions
were also used to determine the optimal solution.
The third objective was assessed by adding the demographic and psychological predictor
variables to the best fitting LCA models in the Irish and UK samples, respectively. A 3-step
approach was used so that the inclusion of the predictor variables did not influence the forma-
tion of the classes [46].
PLOS ONE COVID-19 vaccine receptibility in the UK and Ireland
PLOS ONE | https://doi.org/10.1371/journal.pone.0258871 November 3, 2021 8 / 22

Results
Objective 1: Vaccine acceptance, hesitance, and resistance
From March/April 2020 (Wave 1) to December 2020 (Wave 4) in Ireland, there was evidence
of significant change in rates of vaccine acceptance (χ2 (3, 1030) = 40.12, p< .001) and resis-
tance (χ2 (3, 1030) = 45.34, p< .001), but not vaccine hesitance (χ2 (3, 1030) = 4.41, p = .220).
From March 2020 (Wave 1) to November/December 2020 in the UK, there was evidence
of significant change in rates of vaccine acceptance (χ2 (3, 2020) = 26.82, p< .001), hesitance
(χ2 (3, 2020) = 39.96, p< .001), and resistance (χ2 (3, 2020) = 110.78, p< .001). The nature of
these changes in both samples are presented in Fig 1, and the pairwise comparisons are pre-
sented in Table 2.
In the Irish sample, there were no significant changes in vaccine acceptance (χ2 (1, 1030) =
0.07, p = .793), hesitance (χ2 (1, 1030) = 0.12, p = .726), or resistance (χ2 (1, 1030) = 0.29,
p = .589) between Wave 3 and Wave 4. In the UK sample, there was a significant decrease in
vaccine acceptance (χ2 (1, 2020) = 20.06, p< .001), no significant change in vaccine hesitance
Fig 1. COVID-19 vaccine acceptance, hesitance, and resistance in the Irish and UK samples. Data are presented as the proportion of the Irish (n = 1030) and
United Kingdom (n = 2000) samples indicating COVID-19 acceptance (blue line), hesitance (orange line), and resistance (red line) across four waves of data
collection (Wave 1, March-April 2020, Wave 2 is April-May 2020, Wave 3 is July-August 2020, and Wave 4 is November-December 2020).
https://doi.org/10.1371/journal.pone.0258871.g001
PLOS ONE COVID-19 vaccine receptibility in the UK and Ireland
PLOS ONE | https://doi.org/10.1371/journal.pone.0258871 November 3, 2021 9 / 22

(χ2 (1, 2020) = 0.41, p = .520), and a significant increase in vaccine resistance (χ2 (1, 2020) =
25.28, p< .001) between Wave 3 and Wave 4.
Objective 2: Changing probabilities of vaccine acceptance over time
The full set of latent class analysis (LCA) results for the Irish and UK samples are presented in
Table 3. In both samples, iterative models with one to four classes terminated normally, and
the loglikelihood values were replicated. Models with more than four classes failed to converge
or terminate normally in both samples suggesting that models with more than four classes
were not viable representations of the sample data. Overall, the results were similar in the two
samples in that the Bayesian Information Criteria (BIC) and sample size adjusted BIC (ssaBIC)
values were lowest for the three-class models. The Lo-Mendell-Rubin adjusted likelihood-ratio
test (LMR-A) values become non-significant at five classes, which suggests that a four-class
model may be optimal; however, the p-values for the four-class model were also elevated (Ire-
land: p = .022; UK: p = .027), suggesting a better fit for the three-class model. Comparing the
profiles of the three- and four-class models, a relatively large group of people with high proba-
bilities of accepting a COVID-19 vaccine in the three-class model was differentiated in the
four-class model to represent groups with high and moderate-to-high probabilities of vaccine
acceptance. Thus, the addition of another class in the four-class model was not qualitatively
different from the classes identified in the more parsimonious three-class model. Conse-
quently, based on parsimony, model interpretability, and recognition that BIC is an optimal
Table 2. Pairwise comparisons for the Irish (N = 1,030) and UK (N = 2,020) samples.
Ireland UK
Wald χ2 p Wald χ2 pCOVID-19 Vaccine Acceptance
Wave 1 vs. Wave 2 0.07 .786 3.40 .065
Wave 1 vs. Wave 3 25.23 <.001 3.14 .077
Wave 1 vs. Wave 4 15.82 <.001 5.67 .017
Wave 2 vs. Wave 3 22.74 <.001 14.66 <.001
Wave 2 vs. Wave 4 12.40 <.001 0.59 .444
Wave 3 vs. Wave 4 0.07 .793 20.06 <.001
COVID-19 Vaccine Hesitance
Wave 1 vs. Wave 2 1.99 .158 0.95 .330
Wave 1 vs. Wave 3 0.28 .595 29.52 <.001
Wave 1 vs. Wave 4 0.68 .411 21.41 <.001
Wave 2 vs. Wave 3 3.24 .072 22.65 <.001
Wave 2 vs. Wave 4 3.30 .069 13.50 <.001
Wave 3 vs. Wave 4 0.12 .726 0.41 .520
COVID-19 Vaccine Resistance
Wave 1 vs. Wave 2 6.04 .014 18.91 <.001
Wave 1 vs. Wave 3 30.63 <.001 26.53 <.001
Wave 1 vs. Wave 4 20.01 <.001 92.23 <.001
Wave 2 vs. Wave 3 11.50 <.001 1.51 .220
Wave 2 vs. Wave 4 5.61 .018 35.32 <.001
Wave 3 vs. Wave 4 0.29 .589 25.28 <.001
Note: χ2 = chi-square; all Wald χ2 tests have one degree of freedom.
https://doi.org/10.1371/journal.pone.0258871.t002
PLOS ONE COVID-19 vaccine receptibility in the UK and Ireland
PLOS ONE | https://doi.org/10.1371/journal.pone.0258871 November 3, 2021 10 / 22

index for model selection, the three-class model was selected as the best fitting model of the
Irish and UK sample data.
The probabilities of accepting a COVID-19 vaccine over time in the Irish and UK samples
are represented in Figs 2 and 3, respectively. In the Irish sample, class 1 included 16% of people
and was characterised by extremely low probabilities of accepting a COVID-19 vaccine over
time. Notably, there was a drop-off from an already low probability at Wave 1 (.15) to near
zero probabilities of accepting a vaccine through Waves 2–4. This class was labelled ‘Deniers’.
Class 2 included 61% of the sample and was characterised by high probabilities of accepting a
COVID-19 vaccine over time. Yet, it is noteworthy that the probability of acceptance steadily
declined from Wave 2 (.93) to Wave 4 (.82), despite remaining high. This class was labelled
‘Accepters’. Finally, class 3 included 23% of the sample and was characterised by fluctuating
probabilities of accepting a COVID-19 vaccine. This class had a low-to-moderate probability
of vaccine acceptance at Wave 1 (.34) that declined markedly by Wave 3 (.05) before increasing
again at Wave 4 (.26). This class was labelled ‘Movable Middle’.
In the UK sample, class 1 included 12% of people and was characterised by declining proba-
bilities of accepting a COVID-19 vaccine over time. This class had a low-to-moderate proba-
bility of vaccine acceptance at Wave 1 (.32) that declined through Wave 2 (.17) and Wave 3
(.09) and remained low at Wave 4 (.10), even after the introduction of an approved vaccine.
This class was labelled ‘Deniers’. Class 2 included 68% of the sample and was characterised by
consistently high probabilities of vaccine acceptance. Notably, the probability of vaccine accep-
tance rose steadily from Wave 1 (.86) to Wave 3 (.97) before decreasing at Wave 4 (.88). This
class was labelled ‘Accepters’. Finally, class 3 included 20% of the sample and, like class 1, dem-
onstrated declining probabilities of vaccine acceptance from Wave 1 (.33) to Wave 2 (.12) but
then diverged from class 1 as the probability of vaccine acceptance increased steadily through
Wave 3 (.19) and Wave 4 (.24). This class was labelled ‘Movable Middle’.
Table 3. Fit indices for latent class models in the Irish and UK samples.
Log likelihood AIC BIC ssaBIC LMR-A (p) Entropy
Ireland
1 -2250.26 4516 4556 4530 - - - -
2 -1959.16 3952 4036 3982 573.02 (< .001) .67
3 -1889.46 3830 3959 3876 137.22 (< .001) .67
4 -1880.67 3831 4004 3892 17.30 (.022) .64
5 -1873.07� 3834 4051 3911 15.08 (.883) .56
6 -1867.68 3841 4103 3934 14.72 (.522) .60
UK
1 -4690.03 9396 9440 9415 - - - -
2 -4098.31 8230 8325 8271 1166.41 (< .001) .72
3 -3978.96 8009 8155 8073 234.84 (< .001) .74
4 -3963.45 7996 8193 8082 30.57 (.027) .63
5 -3959.39� 8006 8253 8113 8.01 (1.00) .66
6^ - - - - - - - - - - - -
Note:
� models were not identified; AIC = Akaike Information Criterion; BIC = Bayesian Information Criterion; ssaBIC = sample size adjusted Bayesian Information
Criterion; LMR-A = Lo-Mendell-Rubin adjusted likelihood ratio test.
https://doi.org/10.1371/journal.pone.0258871.t003
PLOS ONE COVID-19 vaccine receptibility in the UK and Ireland
PLOS ONE | https://doi.org/10.1371/journal.pone.0258871 November 3, 2021 11 / 22

Fig 2. Latent class probabilities of COVID-19 vaccine acceptance in the Irish sample. Data are presented as the latent class probabilities of COVID-19
acceptance in the Irish sample (n = 1030) across four waves of data collection.
https://doi.org/10.1371/journal.pone.0258871.g002
Fig 3. Latent class probabilities of COVID-19 vaccine acceptance in the UK sample. Data are presented as the latent class probabilities of COVID-19
acceptance in the UK sample (N = 2000) across four waves of data collection.
https://doi.org/10.1371/journal.pone.0258871.g003
PLOS ONE COVID-19 vaccine receptibility in the UK and Ireland
PLOS ONE | https://doi.org/10.1371/journal.pone.0258871 November 3, 2021 12 / 22

Objective 3: Correlates of class membership
Based on our desire to understand why individuals were not consistent in their willingness to
accept a COVID-19 vaccine, the class of ‘Accepters’ in the Irish and UK samples were set as
the reference categories for analyses to determine the correlates of membership in the ‘Deniers’
and ‘Movable Middle’ classes. These findings for the Irish and UK samples are presented in
Tables 4 and 5, respectively.
In the Irish sample, membership of the ‘Deniers’ class was significantly associated with not
living with any other adults (OR = 0.40), earning less than €20,000 per year (OR = 3.96), higher
levels of conspiracy mindedness (OR = 1.04), lower levels of trust in scientists and doctors
(OR = 0.57), and stronger negative attitudes towards migrants in Irish society (OR = 0.87).
Membership of the ‘Movable Middle’ class was significantly associated with being female
(OR = 2.15), lower levels of locus of control regarding the role of powerful others (OR = 0.90),
higher levels of conspiracy mindedness (OR = 1.04), and lower levels of trust in scientists and
doctors (OR = 0.77).
In the UK sample, membership of the ‘Deniers’ class was significantly associated with youn-
ger respondents (aged 18–24: OR = 16.29; 25–34: OR = 19.57; 35–44: OR = 16.16), not living
with another adult (OR = 0.53), living with children under the age of 18 (OR = 1.69), abstain-
ing from voting in the previous UK general election (OR = 2.01), lower levels of trait agreeable-
ness (OR = 0.82), lower levels of trait neuroticism (OR = 0.82), higher levels of conspiracy
mindedness (OR = 1.04), and lower levels of trust in scientists and doctors (OR = 0.72).
Membership of the ‘Movable Middle’ class was significantly associated with being female
(OR = 1.64), being younger than 65 (aged 18–24: OR = 3.90; 25–34: OR = 3.84; 35–44:
OR = 4.35; 45–54: OR = 3.08; 55–64, OR = 3.69), being of Chinese or Asian ethnicity
(OR = 3.33), low weekly incomes (earning less than £300 per week: OR = 2.28; earning
between £301 and £490 per week: OR = 2.08), having voted for an ‘Other’ party in the previous
UK general election (OR = 3.25), lower levels of trait extraversion (OR = 0.90), higher levels of
trait openness (OR = 1.16), and lower levels of trust in scientists and doctors (OR = 0.78).
Discussion
Three important findings emerged from the analyses. First, the arrival of vaccines against
COVID-19 coincided with a significant change in vaccine receptibility, but in only one of the
two countries sampled. Second, within both samples, vaccine receptibility over time was most
parsimoniously represented by three distinct groups. In Ireland and the UK, the majority of
respondents belonged to a group characterised by stable acceptance that accounted for 61%
and 68% of each sample, respectively. Conversely, the fewest respondents in both samples
belonged to a group characterised by stable non-acceptance (Ireland: 16%) or decreasing
acceptance (UK: 12%). A final group characterised by fluctuating probabilities of accepting a
COVID-19 vaccine over time was also identified within each sample (Ireland: 23%; UK: 20%).
Third, compared to those characterised by stable acceptance over time, individuals character-
ised by changing or decreasing acceptance of a COVID-19 vaccine were distinguishable, and
also comparable, in relation to several individual, socio-economic, and psychological variables.
The significance of these findings is described in turn below.
Compared to data that had been collected at a time when vaccine receptibility could only be
considered in relation to a hypothetical vaccine (i.e., July/August 2020), data from a period
when approved vaccines for COVID-19 had been introduced in both countries (December
2020) showed a significant increase in vaccine resistance in the UK, and a significant decrease
in vaccine acceptance. No change in vaccine acceptance, resistance, or hesitance was identified
in the Irish sample between these timepoints. The proportion of UK respondents in
PLOS ONE COVID-19 vaccine receptibility in the UK and Ireland
PLOS ONE | https://doi.org/10.1371/journal.pone.0258871 November 3, 2021 13 / 22
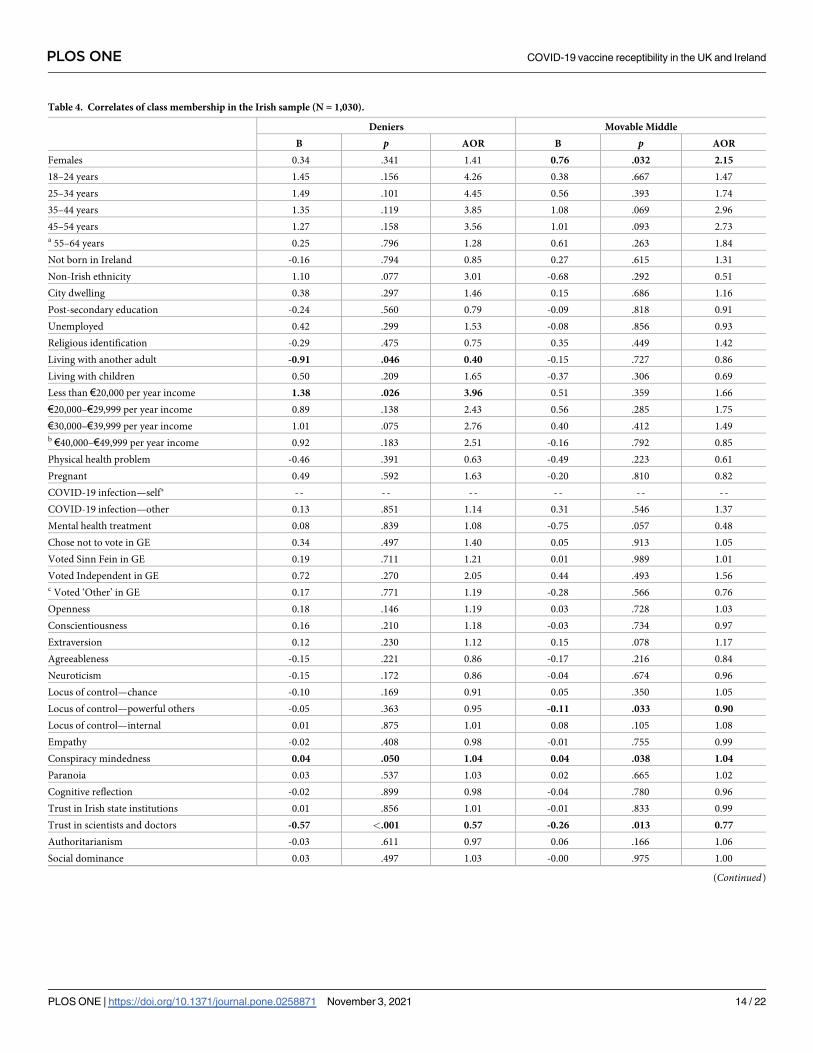
Table 4. Correlates of class membership in the Irish sample (N = 1,030).
Deniers Movable Middle
B p AOR B p AOR
Females 0.34 .341 1.41 0.76 .032 2.15
18–24 years 1.45 .156 4.26 0.38 .667 1.47
25–34 years 1.49 .101 4.45 0.56 .393 1.74
35–44 years 1.35 .119 3.85 1.08 .069 2.96
45–54 years 1.27 .158 3.56 1.01 .093 2.73a 55–64 years 0.25 .796 1.28 0.61 .263 1.84
Not born in Ireland -0.16 .794 0.85 0.27 .615 1.31
Non-Irish ethnicity 1.10 .077 3.01 -0.68 .292 0.51
City dwelling 0.38 .297 1.46 0.15 .686 1.16
Post-secondary education -0.24 .560 0.79 -0.09 .818 0.91
Unemployed 0.42 .299 1.53 -0.08 .856 0.93
Religious identification -0.29 .475 0.75 0.35 .449 1.42
Living with another adult -0.91 .046 0.40 -0.15 .727 0.86
Living with children 0.50 .209 1.65 -0.37 .306 0.69
Less than €20,000 per year income 1.38 .026 3.96 0.51 .359 1.66
€20,000–€29,999 per year income 0.89 .138 2.43 0.56 .285 1.75
€30,000–€39,999 per year income 1.01 .075 2.76 0.40 .412 1.49b €40,000–€49,999 per year income 0.92 .183 2.51 -0.16 .792 0.85
Physical health problem -0.46 .391 0.63 -0.49 .223 0.61
Pregnant 0.49 .592 1.63 -0.20 .810 0.82
COVID-19 infection—self� - - - - - - - - - - - -
COVID-19 infection—other 0.13 .851 1.14 0.31 .546 1.37
Mental health treatment 0.08 .839 1.08 -0.75 .057 0.48
Chose not to vote in GE 0.34 .497 1.40 0.05 .913 1.05
Voted Sinn Fein in GE 0.19 .711 1.21 0.01 .989 1.01
Voted Independent in GE 0.72 .270 2.05 0.44 .493 1.56c Voted ‘Other’ in GE 0.17 .771 1.19 -0.28 .566 0.76
Openness 0.18 .146 1.19 0.03 .728 1.03
Conscientiousness 0.16 .210 1.18 -0.03 .734 0.97
Extraversion 0.12 .230 1.12 0.15 .078 1.17
Agreeableness -0.15 .221 0.86 -0.17 .216 0.84
Neuroticism -0.15 .172 0.86 -0.04 .674 0.96
Locus of control—chance -0.10 .169 0.91 0.05 .350 1.05
Locus of control—powerful others -0.05 .363 0.95 -0.11 .033 0.90
Locus of control—internal 0.01 .875 1.01 0.08 .105 1.08
Empathy -0.02 .408 0.98 -0.01 .755 0.99
Conspiracy mindedness 0.04 .050 1.04 0.04 .038 1.04
Paranoia 0.03 .537 1.03 0.02 .665 1.02
Cognitive reflection -0.02 .899 0.98 -0.04 .780 0.96
Trust in Irish state institutions 0.01 .856 1.01 -0.01 .833 0.99
Trust in scientists and doctors -0.57 <.001 0.57 -0.26 .013 0.77
Authoritarianism -0.03 .611 0.97 0.06 .166 1.06
Social dominance 0.03 .497 1.03 -0.00 .975 1.00
(Continued)
PLOS ONE COVID-19 vaccine receptibility in the UK and Ireland
PLOS ONE | https://doi.org/10.1371/journal.pone.0258871 November 3, 2021 14 / 22

November/December 2020 who indicated that they would be receptive to one of the approved
vaccines for COVID-19 when it became available to them (65.5%) was slightly lower than the
proportion of the sample who indicated acceptance of a hypothetical vaccine in July of the
same year (71.1%). Moreover, the proportion of the sample in November/December 2020 who
indicated that they would be resistant to accepting one of the approved vaccines when made
available to them (15.6%) was markedly higher than the proportion who indicated resistance
to a hypothetical vaccine in July 2020 (10.6%). While this trend may have been attributable to
factors other than the arrival of approved vaccines (i.e., our analyses clearly indicated that fluc-
tuation in vaccine receptibility has been at play in both countries for some time), recency of
vaccine development and distribution has been identified as one of many factors that can
influence vaccine hesitancy [13]. In relation to the COVID-19 pandemic specifically, a study of
1,941 Israeli healthcare workers and members of the general Israeli population has shown that
the vast majority of responders’ concerns were due to the assumed speed of vaccine develop-
ment and related concerns surrounding quality controls [10]. It is notable that while the extant
literature covers vaccine efficacy and safety extensively, and the rigorous quality controls that
precede, dictate, and follow approvals [47, 48], members of the general population still identify
speed, safety, efficacy, and quality control as key reasons for hesitation/concern about receiv-
ing a vaccine. It is imperative therefore that public health authorities do more to educate,
inform, and intervene to challenge vaccine hesitancy on these grounds.
The current study revealed important vaccine receptibility subgroups and trends in both
countries. Mixture modelling of our longitudinal data afforded a valuable opportunity to
investigate (i) the proportion of each population that displayed a sustained high probability of
vaccine acceptance throughout the pandemic, (ii) the proportion that displayed a sustained
low probability of vaccine acceptance, and importantly, (iii) whether a ‘moveable middle’
group—or groups—existed, and what their receptibility profiles looked like. Overall, 61% and
68% of the Irish and UK samples, respectively, exhibited stable vaccine acceptance with accep-
tance probabilities in both samples above 80% across all four timepoints. However, somewhat
concerningly, the trajectories for both groups ended in a downward trend. It will be important,
therefore, to monitor these stable acceptance groups at later survey waves to determine what
effect, if any, national vaccination programmes and communication strategies are having on
acceptance levels for those who seem committed to vaccination. Notably, however, the size of
these groups also reveals significant differences between countries regarding rates of accep-
tance and highlights the importance of country-specific approaches to understanding and
tackling vaccine hesitancy and promoting vaccine receptibility.
While we expected to identify distinct subgroups in both populations characterised by low
probabilities of vaccine acceptance over time, the profiles for these groups differed in
Table 4. (Continued)
Deniers Movable Middle
B p AOR B p AOR
Attitudes toward migrants -0.14 .004 0.87 -0.04 .360 0.96
Multinomial logistic regression analyses were performed to identify the key variables associated with belonging to the ‘Deniers’ and ‘Movable Middle’ classes. All
predictors are adjusted for all other covariates in the model. Note: B = unstandardized beta value; p = statistical significance value; AOR = adjusted odds ratio;a = reference category is 65 year and older;b reference category is €50,000 or more income;c = reference category is voted for the incumbent government parties of Fine Gael or Fianna Fail;
� variable was not included in the model due to insufficient cases in each class; statistically significant associations (p <.05) are highlighted in bold.
https://doi.org/10.1371/journal.pone.0258871.t004
PLOS ONE COVID-19 vaccine receptibility in the UK and Ireland
PLOS ONE | https://doi.org/10.1371/journal.pone.0258871 November 3, 2021 15 / 22

Table 5. Correlates of class membership in the UK sample (N = 2,000).
Deniers Movable Middle
B p AOR B p AOR
Females 0.32 .209 1.38 0.49 .011 1.64
18–24 years 2.79 .017 16.29 1.36 .003 3.90
25–34 years 2.97 .008 19.57 1.35 .002 3.84
35–44 years 2.78 .012 16.16 1.47 .000 4.35
45–54 years 2.09 .065 8.08 1.12 .004 3.08a55–64 years 1.75 .129 5.78 1.30 .000 3.69
Not born in the UK -0.72 .270 0.49 0.23 .643 1.25
Ethnicity—White Non-UK/Irish 0.88 .188 2.40 0.32 .579 1.38
Ethnicity—Afro-Caribbean 0.72 .321 2.05 0.03 .977 1.03
Ethnicity—Chinese/Asian -0.31 .838 0.73 1.20 .031 3.33bEthnicity—Indian/Pakistani/Bangladeshi 0.76 .090 2.13 0.54 .279 1.72
City dwelling 0.29 .290 1.33 0.09 .681 1.09
Post-secondary education 0.25 .334 1.29 -0.09 .652 0.92
Unemployed -0.61 .167 0.54 0.34 .164 1.41
Religious identification 0.30 .303 1.35 -0.02 .907 0.98
Living with another adult -0.63 .041 0.53 -0.24 .306 0.79
Living with children 0.52 .028 1.69 0.06 .791 1.06
Less than £300 per week income 1.11 .023 3.03 0.82 .026 2.28
£301–£490 per week income 0.71 .104 2.03 0.73 .035 2.08
£491–£740 per week income 0.75 .077 2.12 0.56 .108 1.75c£741–£1,111 per week income 0.22 .579 1.24 0.32 .312 1.37
Physical health problem -0.29 .379 0.75 -0.33 .186 0.72
Pregnant 0.46 .309 1.58 -0.43 .488 0.65
COVID-19 infection—self 1.14 .078 3.11 0.03 .953 1.03
COVID-19 infection—other -1.15 .138 0.32 -0.06 .875 0.95
Mental health treatment 0.23 .378 1.25 0.09 .660 1.09
Chose not to vote in GE 0.70 .040 2.01 -0.08 .812 0.93
Voted Labour in GE 0.19 .530 1.21 -0.19 .459 0.83
Voted Liberal Democrats in GE -0.07 .914 0.93 -0.14 .705 0.87
Voted Greens in GE -0.54 .497 0.58 -0.06 .884 0.94
Voted ‘Nationalist’ in GE -0.13 .867 0.88 -0.24 .638 0.79
Voted ‘Unionist’ in GE 0.52 .290 1.68 -0.09 .842 0.91dVoted ‘Other’ in GE 0.77 .220 2.16 1.18 .010 3.25
Openness 0.04 .611 1.04 0.15 .006 1.16
Conscientiousness -0.11 .151 0.90 -0.08 .128 0.92
Extraversion 0.01 .847 1.01 -0.11 .036 0.90
Agreeableness -0.20 .012 0.82 -0.10 .103 0.91
Neuroticism -0.19 .029 0.82 -0.06 .289 0.94
Locus of control—chance 0.02 .636 1.02 0.00 .959 1.00
Locus of control—powerful others -0.02 .763 0.99 -0.01 .869 1.00
Locus of control—internal -0.03 .524 0.97 -0.01 .752 0.99
Empathy -0.02 .463 0.98 0.00 .922 1.00
Conspiracy mindedness 0.04 .028 1.04 0.01 .349 1.01
Paranoia 0.00 .983 1.00 -0.02 .373 0.98
Cognitive reflection -0.12 .408 0.89 -0.08 .404 0.92
Trust in UK state institutions 0.00 .909 1.00 -0.01 .811 0.99
(Continued)
PLOS ONE COVID-19 vaccine receptibility in the UK and Ireland
PLOS ONE | https://doi.org/10.1371/journal.pone.0258871 November 3, 2021 16 / 22

important ways. While the Irish sample included a group characterised by sustained low-to-
near zero probabilities of acceptance at each survey wave (16%), the UK’s most resistant group
(12%) began with a 32% probability of acceptance that steadily declined to 10% by Wave 4.
The Irish non-acceptance group, therefore, reflected more extreme and stable resistance com-
pared to those who were most resistant in the UK. Several studies have shown that upwards of
approximately 10% of study populations appear to be opposed to vaccinations in whatever
form they take [49, 50]; therefore, these findings were not entirely surprising. It was notable,
however, that resistance was lowest in both countries at the beginning of the pandemic (~6–
10% in March/April 2020), and that this resistance steadily rose (significantly between some
survey waves) to ~16–18% by Waves 3 (July/August 2020) and 4 (November/December 2020).
Resistance to actual approved vaccines in December 2020, therefore, was concerningly high. If
resistance remains at this level or continues to rise, public health officials will likely need to
consider how to reach and persuade a now substantial subpopulation that has traditionally
been shown to be extremely resistant to vaccine promotional campaigns and public health
messaging regarding inoculation generally [51, 52].
A third group was also identified in both countries. This group was considered to represent
a ‘moveable middle’ or ‘changing’ group that may hold important significance for future public
health initiatives that seek to achieve herd-protection against SARS-CoV-2. In the Irish sam-
ple, this group was characterised by a 26% probability of accepting a vaccine in December
2020 when approved vaccines had been developed. However, in the months preceding vaccine
development (July/August 2020), this same group of respondents exhibited only a 5% proba-
bility of acceptance, while at the beginning of the pandemic, acceptance probability was at its
highest (34%). Comparatively, the ‘moveable middle’ group in the UK sample exhibited a simi-
lar probability of acceptance in November/December 2020 (24%), and at the beginning of the
pandemic (33%) but had its lowest level of acceptance in April/May 2020 (12%). These groups
have fluctuated in their positions over the duration of the pandemic, and while there may be
cause for optimism in the upward trends identified at the most recent data collection time-
points, it must be noted that neither of these groups displayed a probability of acceptance
above 34% at any time since the beginning of the pandemic.
While the extant research literature details many distinct socio-demographic and psycho-
logical indicators of vaccine hesitancy generally [6, 53, 54], and a burgeoning literature has
begun to list those common to COVID-19 vaccines specifically [10, 16, 55], studies describing
characteristics associated with stability or change in vaccine receptibility over time are lacking.
Table 5. (Continued)
Deniers Movable Middle
B p AOR B p AOR
Trust in scientists and doctors -0.33 .001 0.72 -0.26 <.001 0.78
Authoritarianism 0.05 .265 1.05 0.01 .682 1.01
Social dominance 0.04 .150 1.04 0.01 .440 1.01
Attitudes toward migrants -0.05 .220 0.96 -0.04 .127 0.96
Multinomial logistic regression analyses were performed to identify the key variables associated with belonging to the ‘Deniers’ and ‘Movable Middle’ classes. All
predictors are adjusted for all other covariates in the model. Note: B = unstandardized beta value; p = statistical significance value; AOR = adjusted odds ratio;a = reference category is 65 year and older;b = reference category is ‘White British or Irish’;c = reference category is £1,112 per week or more;d = reference category is voted for the incumbent Conservative government party; statistically significant associations (p < .05) are highlighted in bold.
https://doi.org/10.1371/journal.pone.0258871.t005
PLOS ONE COVID-19 vaccine receptibility in the UK and Ireland
PLOS ONE | https://doi.org/10.1371/journal.pone.0258871 November 3, 2021 17 / 22

Our findings revealed important similarities and distinctions in vaccine receptibility between
those in the ‘movable middle’ and those characterised by stable resistance in both countries.
First, those who fluctuated in their receptiveness to a COVID-19 vaccine in Ireland and the
UK were more likely to be female and to lack trust in scientists and health care professionals.
Evidence suggests that, in relation to COVID-19 vaccination specifically, females may have
concerns surrounding issues such as fertility and pregnancy [56, 57]. As has been highlighted
earlier, trust in scientists and health care professionals (particularly regarding the speed of vac-
cine development and distribution) seems also to be of particular concern for many who are
hesitant about a COVID-19 vaccine specifically [10]. Public health messaging, therefore, tai-
lored specifically to allay concerns and/or fears that may be specific to women, and/or to edu-
cate and reassure the public about quality controls and standards relating to the development,
distribution, administration, and review of COVID-19 vaccines may prove useful. Notable dis-
tinctions were also evident for the moveable middle groups across samples. In Ireland, those
who fluctuated over time were more likely than accepters to believe that powerful others were
responsible for their experiences and to hold conspiratorial beliefs, while those in the UK were
more likely than accepters to be younger, of Chinese/Asian ethnicity, have a lower level of
income, have voted ‘other’ in the last general election, be lower in extraversion, and higher in
openness. These distinct country specific characteristics may help to further inform and refine
public health messaging in ways that are contextually sensitive to each population.
Second, those who remained resistant over time in Ireland and the UK tended not to live
with any other adults, to hold conspiratorial beliefs, and to lack trust in scientists and health
care professionals. While those who remained resistant over time may be more challenging to
reach or persuade than those who fluctuate in their receptibility, these common indicators of
resistance may prove useful in informing our understanding of who these people are and why
they are susceptible and committed to the beliefs they hold. Individuals living alone have been
shown to lack important opportunities to explore/discuss their concerns or to reality test their
assumptions about the world in which they live [58, 59], while those who are open/receptive to
conspiratorial interpretations of world events often dismiss information sourced from or dis-
seminated by traditional, scientific and/or authoritative sources [60, 61]. Notably, as was also
evident for the change groups, stable resisters in both countries also differed in specific ways.
In Ireland, these individuals were uniquely characterised by low income and negative views
towards migrants, while in the UK, those most resistant to a COVID-19 vaccine were more
likely to have children, not to have voted in the last general election, and to be lower in the per-
sonality traits of agreeableness and neuroticism. Each of these indicators has previously been
shown to be associated with vaccine hesitancy/resistance [6, 62]. That they do not predict resis-
tance in the same way within different populations and in relation to common vaccines likely
reflects the context specific complexity of vaccine hesitancy as a phenomenon and the chal-
lenging terrain that must be navigated by those seeking to tackle it.
These findings should be interpreted considering several limitations. First, non-probability
quota-based sampling methods were used to recruit samples via the Internet. This opt-in
mode of recruitment employed by the survey company who facilitated the data collection
(Qualtrics), albeit being a cost-effective method for gaining fast access to a large and diverse
sample (and the most feasible method of recruitment during the pandemic), inevitably meant
that it was not possible to know if participants in these panels differed in important ways from
members of the public that do not belong to the panels. Second, the current study was also lim-
ited to two western, European countries whose populations had many social, cultural, eco-
nomic, and political similarities. However, while these populations may have been similar in
many respects, our findings highlight notable differences between countries in relation to (i)
the proportions of each population that were receptive, hesitant, and resistant over time, (ii)
PLOS ONE COVID-19 vaccine receptibility in the UK and Ireland
PLOS ONE | https://doi.org/10.1371/journal.pone.0258871 November 3, 2021 18 / 22

the profiles and trajectories of these groups, and (iii) the specific indicators that predicted fluc-
tuation and stable resistance over time. Now that vaccination programmes are underway in
many countries, our findings highlight the importance of population-specific analyses of vac-
cine hesitancy and the continued monitoring of this phenomenon as vaccination programmes
advance. Relatedly, the extent to which these results will generalise to other nations is
unknown. It is essential that other (low, middle, and high income) countries obtain estimates
of change in hesitancy/resistance to COVID-19 vaccination in their general populations, given
that vaccination efforts will only succeed if sufficiently undertaken globally. Third, while the
use of nationally representative samples from two countries is a key strength, these samples are
representative of general adult populations and do not include members of the public that are
institutionalised (e.g., hospital care, prisons, refugee centres) or difficult to reach (e.g., those
not online, the homeless, etc.). The inability to survey these members of society also limits the
generalisability of our results.
Conclusion
Our findings suggest that approximately two-thirds of adults in the general populations of the
UK and Ireland had consistently high probabilities of accepting a COVID-19 vaccine during
the first nine months of the global pandemic. To achieve wider vaccine coverage, it will be
important to reach the 20–25% of people in society who belong to the so-called ‘moveable
middle’. In both samples, these individuals were more likely to be women, and to have lower
levels of trust in scientists, doctors, and other healthcare professionals. Furthermore, context-
specific identifiers were also evident such as younger age, Asian ethnicity, and lower income in
the UK, and conspiracy mindedness and external locus of control in Ireland. These findings
can be used to aid public health efforts in both countries to reach those in society whose minds
can be changed with regards to COVID-19 vaccination.
Author Contributions
Conceptualization: Philip Hyland, Frederique Vallières, Jamie Murphy.
Formal analysis: Philip Hyland, Frederique Vallières, Jamie Murphy.
Writing – original draft: Philip Hyland, Frederique Vallières, Todd K. Hartman, Ryan
McKay, Sarah Butter, Jamie Murphy.
Writing – review & editing: Philip Hyland, Frederique Vallières, Todd K. Hartman, Ryan
McKay, Sarah Butter, Richard P. Bentall, Orla McBride, Mark Shevlin, Kate Bennett, Liam
Mason, Jilly Gibson-Miller, Liat Levita, Anton P. Martinez, Thomas V. A. Stocks, Thanos
Karatzias, Jamie Murphy.
References1. Zimmer C, Corum J, Wee S-L. Coronavirus vaccine tracker. https://www.nytimes.com/interactive/2020/
science/coronavirus-vaccine-tracker.html (2021).
2. Randall T, Sam C, Tartar A, Murray P, Cannon C. More than 4.74 billion shots given: Covid-19 tracker.
https://www.bloomberg.com/graphics/covid-vaccine-tracker-global-distribution/ (2021).
3. Lazarus JV, Ratzan SC, Palayew A, Gostin LO, Larson HJ, Rabin K, et al. A global survey of potential
acceptance of a COVID-19 vaccine. Nat Med. 2021 Feb; 27(2):225–228. https://doi.org/10.1038/
s41591-020-1124-9 Epub 2020 Oct 20. Erratum in: Nat Med. 2021 Jan 11;: PMID: 33082575.
4. Sallam M. COVID-19 Vaccine Hesitancy Worldwide: A Concise Systematic Review of Vaccine Accep-
tance Rates. Vaccines (Basel). 2021 Feb 16; 9(2):160. https://doi.org/10.3390/vaccines9020160 PMID:
33669441.
PLOS ONE COVID-19 vaccine receptibility in the UK and Ireland
PLOS ONE | https://doi.org/10.1371/journal.pone.0258871 November 3, 2021 19 / 22

5. Wouters OJ, Shadlen KC, Salcher-Konrad M, Pollard AJ, Larson HJ, Teerawattananon Y, et al. Chal-
lenges in ensuring global access to COVID-19 vaccines: production, affordability, allocation, and
deployment. Lancet. 2021 Mar 13; 397(10278):1023–1034. https://doi.org/10.1016/S0140-6736(21)
00306-8 Epub 2021 Feb 12. PMID: 33587887.
6. MacDonald NE; SAGE Working Group on Vaccine Hesitancy. Vaccine hesitancy: Definition, scope and
determinants. Vaccine. 2015 Aug 14; 33(34):4161–4. https://doi.org/10.1016/j.vaccine.2015.04.036
Epub 2015 Apr 17. PMID: 25896383.
7. World Health Organization. Ten threats to global health in 2019. https://www.who.int/news-room/
spotlight/ten-threats-to-global-health-in-2019 (2019).
8. Henrikson NB, Anderson ML, Opel DJ, Dunn J, Marcuse EK, Grossman DC. Longitudinal Trends in
Vaccine Hesitancy in a Cohort of Mothers Surveyed in Washington State, 2013–2015. Public Health
Rep. 2017 Jul/Aug; 132(4):451–454. https://doi.org/10.1177/0033354917711175 Epub 2017 Jun 6.
PMID: 28586623.
9. Lee CHJ, Sibley CG. Attitudes toward vaccinations are becoming more polarized in New Zealand: Find-
ings from a longitudinal survey. EClinicalMedicine. 2020 Jun 6; 23:100387. https://doi.org/10.1016/j.
eclinm.2020.100387 PMID: 32529178.
10. Dror AA, Eisenbach N, Taiber S, Morozov NG, Mizrachi M, Zigron A, et al. Vaccine hesitancy: the next
challenge in the fight against COVID-19. Eur J Epidemiol. 2020 Aug; 35(8):775–779. https://doi.org/10.
1007/s10654-020-00671-y Epub 2020 Aug 12. PMID: 32785815.
11. Smith TC. Vaccine Rejection and Hesitancy: A Review and Call to Action. Open Forum Infect Dis. 2017
Jul 18; 4(3):ofx146. https://doi.org/10.1093/ofid/ofx146 PMID: 28948177.
12. Kata A. Anti-vaccine activists, Web 2.0, and the postmodern paradigm—an overview of tactics and
tropes used online by the anti-vaccination movement. Vaccine. 2012 May 28; 30(25):3778–89. https://
doi.org/10.1016/j.vaccine.2011.11.112 Epub 2011 Dec 13. PMID: 22172504.
13. Dube E, Bettinger JA, Fisher WA, Naus M, Mahmud SM, Hilderman T. Vaccine acceptance, hesitancy
and refusal in Canada: Challenges and potential approaches. Can Commun Dis Rep. 2016 Dec 1; 42
(12):246–251. https://doi.org/10.14745/ccdr.v42i12a02 PMID: 29769995.
14. World Health Organisation, & Strategic Advisory Group of Experts (SAGE) Working Group on Vaccine
Hesitancy. Report of the SAGE working group on vaccine hesitancy. Geneva https://www.who.int/
immunization/sage/meetings/2014/october/SAGE_working_group_revised_report_vaccine_hesitancy.
pdf (2014).
15. Johns Hopkins Centre for Communication Programs. The global survey of knowledge, attitudes and
practices around COVID-19. https://ccp.jhu.edu/kap-covid/ (2021).
16. Murphy J, Vallières F, Bentall RP, Shevlin M, McBride O, Hartman TK, et al. Psychological characteris-
tics associated with COVID-19 vaccine hesitancy and resistance in Ireland and the United Kingdom.
Nat Commun. 2021 Jan 4; 12(1):29. https://doi.org/10.1038/s41467-020-20226-9 PMID: 33397962
17. Brehm S., & Brehm J. Psychological reactance: A theory of freedom and control. New York: Academic
Press (1981).
18. Clay R. The Behavioral Immune System and Attitudes About Vaccines: Contamination Aversion Pre-
dicts More Negative Vaccine Attitudes. Social Psychological and Personality Science. 2017, 8(2):162–
172. https://doi.org/10.1177/1948550616664957
19. Hornsey MJ, Fielding KS. Attitude roots and Jiu Jitsu persuasion: Understanding and overcoming the
motivated rejection of science. Am Psychol. 2017 Jul-Aug; 72(5):459–473. https://doi.org/10.1037/
a0040437 PMID: 28726454.
20. Lewandowsky S, Gignac GE, Oberauer K. The role of conspiracist ideation and worldviews in predicting
rejection of science. PLoS One. 2013 Oct 2; 8(10):e75637. https://doi.org/10.1371/journal.pone.
0075637 Erratum in: PLoS One. 2015;10(8):e0134773. PMID: 24098391
21. Soveri A., Karlsson L. C., Maki O., et al. Trait reactance and trust in doctors as predictors of vaccination
behavior, vaccine attitudes, and use of complementary and alternative medicine in parents of young
children. PLoS One 15, e0236527 (2020). https://doi.org/10.1371/journal.pone.0236527 PMID:
32716918
22. Hyland P, Vallières F, Shevlin M, Bentall RP, McKay R, Hartman TK, et al. Resistance to COVID-19
vaccination has increased in Ireland and the United Kingdom during the pandemic. Public Health. 2021
Jun; 195:54–56. https://doi.org/10.1016/j.puhe.2021.04.009 Epub 2021 Apr 27. PMID: 34052508.
23. McBride O, Murphy J, Shevlin M, Gibson-Miller J, Hartman TK, Hyland P, et al. Monitoring the psycho-
logical, social, and economic impact of the COVID-19 pandemic in the population: Context, design and
conduct of the longitudinal COVID-19 psychological research consortium (C19PRC) study. Int J Meth-
ods Psychiatr Res. 2021 Mar; 30(1):e1861. https://doi.org/10.1002/mpr.1861 Epub 2020 Nov 9. PMID:
33166018.
PLOS ONE COVID-19 vaccine receptibility in the UK and Ireland
PLOS ONE | https://doi.org/10.1371/journal.pone.0258871 November 3, 2021 20 / 22

24. McBride O, Butter S, Murphy J, Shevlin M, Hartman TK, Hyland P, et al. Context, design and conduct of
the longitudinal COVID-19 psychological research consortium study-wave 3. Int J Methods Psychiatr
Res. 2021 May 22:e1880. https://doi.org/10.1002/mpr.1880 Epub ahead of print. PMID: 34021946.
25. Spikol E, McBride O, Daly M, Vallieres F, Butter S, Bentall R, et al. Assessing and protecting the mental
health of the nation: A methodological protocol detailing Irish data from the COVID-19 Psychological
Research Consortium (C19PRC) study. Acta Psychol. 2021; 220:103416. https://doi.org/10.1016/j.
actpsy.2021.103416
26. Rammstedt B, John OP. Measuring personality in one minute or less: a 10-item short version of the Big
Five Inventory in English and German. J. Res. Personal. 2007; 41:203–212.
27. Eisinga R, Grotenhuis Mt, Pelzer B. The reliability of a two-item scale: Pearson, Cronbach, or Spear-
man-Brown? Int J Public Health. 2013 Aug; 58(4):637–42. https://doi.org/10.1007/s00038-012-0416-3
Epub 2012 Oct 23. PMID: 23089674.
28. Sapp SG, Harrod WJ. Reliability and validity of a brief version of Levenson’s locus of control scale. Psy-
chol. Rep. 1993; 72(2):539–550.
29. Frederick S. Cognitive reflection and decision making. J Econ Perspect. 2005; 19(4):25–42.
30. Sirota M, Juanchich M. Effect of response format on cognitive reflection: Validating a two- and four-
option multiple choice question version of the Cognitive Reflection Test. Behav Res Methods. 2018
Dec; 50(6):2511–2522. https://doi.org/10.3758/s13428-018-1029-4 PMID: 29589333.
31. McFarland S, Webb M, Brown D. All humanity is my ingroup: a measure and studies of identification
with all humanity. J Pers Soc Psychol. 2012 Nov; 103(5):830–53. https://doi.org/10.1037/a0028724
Epub 2012 Jun 18. PMID: 22708625.
32. Imhoff R, Bruder M. Speaking (un) truth to power: Conspiracy mentality as a—generalised political atti-
tude. Eur J Pers. 2014; 28:25–43. https://doi.org/10.1002/per.1930
33. Melo S, Corcoran R, Shryane N, Bentall RP. The persecution and deservedness scale. Psychol Psy-
chother. 2009 Sep; 82(Pt 3):247–60. https://doi.org/10.1348/147608308X398337 Epub 2009 May 7.
PMID: 19426584.
34. McIntyre JC, Wickham S, Barr B, Bentall RP. Social Identity and Psychosis: Associations and Psycho-
logical Mechanisms. Schizophr Bull. 2018 Apr 6; 44(3):681–690. https://doi.org/10.1093/schbul/sbx110
PMID: 28981888.
35. Bizumic B, Duckitt J. Investigating Right Wing Authoritarianism with a Very Short Authoritarianism
scale. J Pers Soc Psychol. 2018; 6:129–150. https://doi.org/10.5964/jspp.v6i1.835
36. Ho AK, Sidanius J, Kteily N, Sheehy-Skeffington J, Pratto F, Henkel KE, et al. The nature of social domi-
nance orientation: Theorizing and measuring preferences for intergroup inequality using the new SDO₇scale. J Pers Soc Psychol. 2015 Dec; 109(6):1003–28. https://doi.org/10.1037/pspi0000033 Epub 2015
Oct 19. PMID: 26479362.
37. British Social Attitudes Survey 2015. Questionnaire. http://doc.ukdataservice.ac.uk/doc/8116/mrdoc/
pdf/8116_bsa2015_documentation.pdf (2015).
38. Schafer JL, Graham JW. Missing data: our view of the state of the art. Psychol Methods. 2002 Jun; 7
(2):147–77. PMID: 12090408.
39. Enders CK, Bandalos DL. The Relative Performance of Full Information Maximum Likelihood Estima-
tion for Missing Data in Structural Equation Models. Struct. Equ. Model. 2001; 8:430–457.
40. Akaike H. Factor analysis and AIC. Psychometrika. 1987; 52:317–332. https://doi.org/10.1007/
BF02294359
41. Schwarz G. Estimating the dimension of a model. Ann. Stat. 1978; 6:461–464.
42. Sclove S. L. Application of model-selection criteria to some problems in multivariate analysis. Psycho-
metrika. 1987; 52:333–343. https://doi.org/10.1007/BF02294360
43. Masyn K. E. Latent class analysis and finite mixture modeling. In Little T. D. (Ed.), The Oxford handbook
of quantitative methods ( Vol. 2, pp. 551–611). Oxford University Press. (2013).
44. Nylund KL, Asparouhov T, Muthen BO. Deciding on the Number of Classesin Latent Class Analysis and
Growth Mixture Modeling: A Monte Carlo Simulation Study. Struct. Equ. Model. 2014; 14:535–569.
https://doi.org/10.1080/10705510701575396
45. Lo Y, Mendell NR, Rubin DB. Testing the number of components in a normal mixture. Biometrika. 2001;
88:767–778. https://doi.org/10.1093/biomet/88.3.767
46. Nylund-Gibson K, Masyn KE. Covariates and mixture modeling: Results of a simulation study exploring
the impact of misspecified effects on class enumeration. Struct. Equ. Model. 2016; 23:782–797. https://
doi.org/10.1080/10705511.2016.1221313
PLOS ONE COVID-19 vaccine receptibility in the UK and Ireland
PLOS ONE | https://doi.org/10.1371/journal.pone.0258871 November 3, 2021 21 / 22

47. Corey L, Mascola JR, Fauci AS, Collins FS. A strategic approach to COVID-19 vaccine R&D. Science.
2020 May 29; 368(6494):948–950. https://doi.org/10.1126/science.abc5312 Epub 2020 May 11. PMID:
32393526.
48. Dean NE, Gsell PS, Brookmeyer R, De Gruttola V, Donnelly CA, Halloran ME, et al. Design of vaccine
efficacy trials during public health emergencies. Sci Transl Med. 2019 Jul 3; 11(499):eaat0360. https://
doi.org/10.1126/scitranslmed.aat0360 PMID: 31270270
49. Pew Research Center. 83% Say Measles Vaccine is Safe for Healthy Children. Pew Research Center,
Washington, D.C. https://www.people-press.org/2015/02/09/83-percent-say-measles-vaccine-is-safe-
for-healthy-children/ (2015).
50. Our world in data. Vaccination. How many people support vaccination across the world? https://
ourworldindata.org/vaccination#how-many-people-support-vaccination-across-the-world (2020).
51. Browne M, Thomson P, Rockloff MJ, Pennycook G. Going against the Herd: Psychological and Cultural
Factors Underlying the ’Vaccination Confidence Gap’. PLoS One. 2015 Sep 1; 10(9):e0132562. https://
doi.org/10.1371/journal.pone.0132562 PMID: 26325522.
52. Hornsey MJ, Harris EA, Fielding KS. The psychological roots of anti-vaccination attitudes: A 24-nation
investigation. Health Psychol. 2018 Apr; 37(4):307–315. https://doi.org/10.1037/hea0000586 Epub
2018 Feb 1. PMID: 29389158.
53. Leask J, Willaby HW, Kaufman J. The big picture in addressing vaccine hesitancy. Hum Vaccin Immun-
other. 2014; 10(9):2600–2. https://doi.org/10.4161/hv.29725 PMID: 25483479
54. Peretti-Watel P, Larson HJ, Ward JK, Schulz WS, Verger P. Vaccine hesitancy: clarifying a theoretical
framework for an ambiguous notion. PLoS Curr. 2015 Feb 25; 7:ecurrents.
outbreaks.6844c80ff9f5b273f34c91f71b7fc289. PMID: 25789201
55. Chou WS, Budenz A. Considering Emotion in COVID-19 Vaccine Communication: Addressing Vaccine
Hesitancy and Fostering Vaccine Confidence. Health Commun. 2020 Dec; 35(14):1718–1722. https://
doi.org/10.1080/10410236.2020.1838096 Epub 2020 Oct 30. PMID: 33124475.
56. Iacobucci G. Covid-19: No evidence that vaccines can affect fertility, says new guidance. BMJ. 2021
Feb 19; 372:n509. https://doi.org/10.1136/bmj.n509 PMID: 33608302.
57. Male V. Are COVID-19 vaccines safe in pregnancy? Nat Rev Immunol. 2021 Apr; 21(4):200–201.
https://doi.org/10.1038/s41577-021-00525-y Erratum in: Nat Rev Immunol. 2021 Mar 12;: PMID:
33658707.
58. Cacioppo JT, Hawkley LC, Norman GJ, Berntson GG. Social isolation. Ann N Y Acad Sci. 2011 Aug;
1231(1):17–22. https://doi.org/10.1111/j.1749-6632.2011.06028.x PMID: 21651565
59. Cacioppo JT, Hawkley LC. Perceived social isolation and cognition. Trends Cogn Sci. 2009 Oct; 13
(10):447–54. https://doi.org/10.1016/j.tics.2009.06.005 Epub 2009 Aug 31. PMID: 19726219.
60. Bartlett J, Miller C. The power of unreason: Conspiracy theories, extremism and counter-terrorism. Lon-
don: Demos. (2010).
61. Sunstein CR, Vermeule A. Conspiracy theories: Causes and cures. J Polit Philos. 2009; 17:202–227.
62. Larson HJ, Jarrett C, Eckersberger E, Smith DM, Paterson P. Understanding vaccine hesitancy around
vaccines and vaccination from a global perspective: a systematic review of published literature, 2007–
2012. Vaccine. 2014 Apr 17; 32(19):2150–9. https://doi.org/10.1016/j.vaccine.2014.01.081 Epub 2014
Mar 2. PMID: 24598724.
PLOS ONE COVID-19 vaccine receptibility in the UK and Ireland
PLOS ONE | https://doi.org/10.1371/journal.pone.0258871 November 3, 2021 22 / 22
https://www.people-press.org/2015/02/09/83-percent-say-measles-vaccine-is-safe-for-healthy-children/