Detecting and Building Habits: A Data-Driven Approach - Robert Moore, CEO, RJ Metrics - 2016 Habit...
62
Detecting and Building Habits: A Data-Driven Approach Habit Summit 2016 | Stanford University | March 22 nd , 2016 Robert Moore CEO, RJMetrics
-
Upload
habit-summit -
Category
Business
-
view
790 -
download
2
Transcript of Detecting and Building Habits: A Data-Driven Approach - Robert Moore, CEO, RJ Metrics - 2016 Habit...

Detecting and Building Habits: A Data-Driven Approach
Habit Summit 2016 | Stanford University | March 22nd, 2016
Robert Moore CEO, RJMetrics

rjmetrics.com
Before we begin…
Disclaimer

rjmetrics.com
“During digestion, your body breaks down the nutrients in food. This causes a rise in blood sugar that triggers your pancreas to release insulin into the bloodstream. Insulin increases the amount of serotonin and melatonin that flood the brain, two chemicals associated with drowsiness.” -Science
Hope You Enjoyed Lunch

rjmetrics.com
Willpower Depletion “The longer we work on mentally strenuous tasks, the more mental energy we expend, and eventually we’ll run out and start falling back to these easy — and often wrong — default decisions.” -Also Science

rjmetrics.com
Willpower Depletion “The longer we work on mentally strenuous tasks, the more mental energy we expend, and eventually we’ll run out and start falling back to these easy — and often wrong — default decisions.” -Also Science

rjmetrics.com
If you feel yourself getting sleepy during this talk…
Disclaimer

rjmetrics.com
If you feel yourself getting sleepy during this talk…
If you feel, with each minute that goes by, you are somehow dumber than before I started talking…
Disclaimer

rjmetrics.com
If you feel yourself getting sleepy during this talk…
If you feel, with each minute that goes by, you are somehow dumber than before I started talking…
blame science!
Disclaimer

Detecting and Building Habits: A Data-Driven Approach
Habit Summit 2016 | Stanford University | March 22nd, 2016
Robert Moore CEO, RJMetrics

Why We’re Here

rjmetrics.com
Storage in the Early 1980s

rjmetrics.com
Practical Implications
Data StorageType SpaceRequiredDateandTime TIMESTAMP 4bytesTransac7onAmount DECIMAL(10,2) 4bytesItemID SMALLINT 2bytesCustomerID INTEGER 4bytesLoca7on SMALLINT 2bytesTotal 16bytes=32¢

rjmetrics.com
Practical Implications
Data StorageType SpaceRequiredDateandTime TIMESTAMP 4bytesTransac7onAmount DECIMAL(10,2) 4bytesItemID SMALLINT 2bytesCustomerID INTEGER 4bytesLoca7on SMALLINT 2bytesTotal 16bytes=32¢
50¢

rjmetrics.com
Data Analysis Was Irresponsible For Most Companies
Not long ago: • 1 byte: $0.02 • 1 kb: $20 • 1 mb: $20,000 • 1 gb: $20,000,000

rjmetrics.com
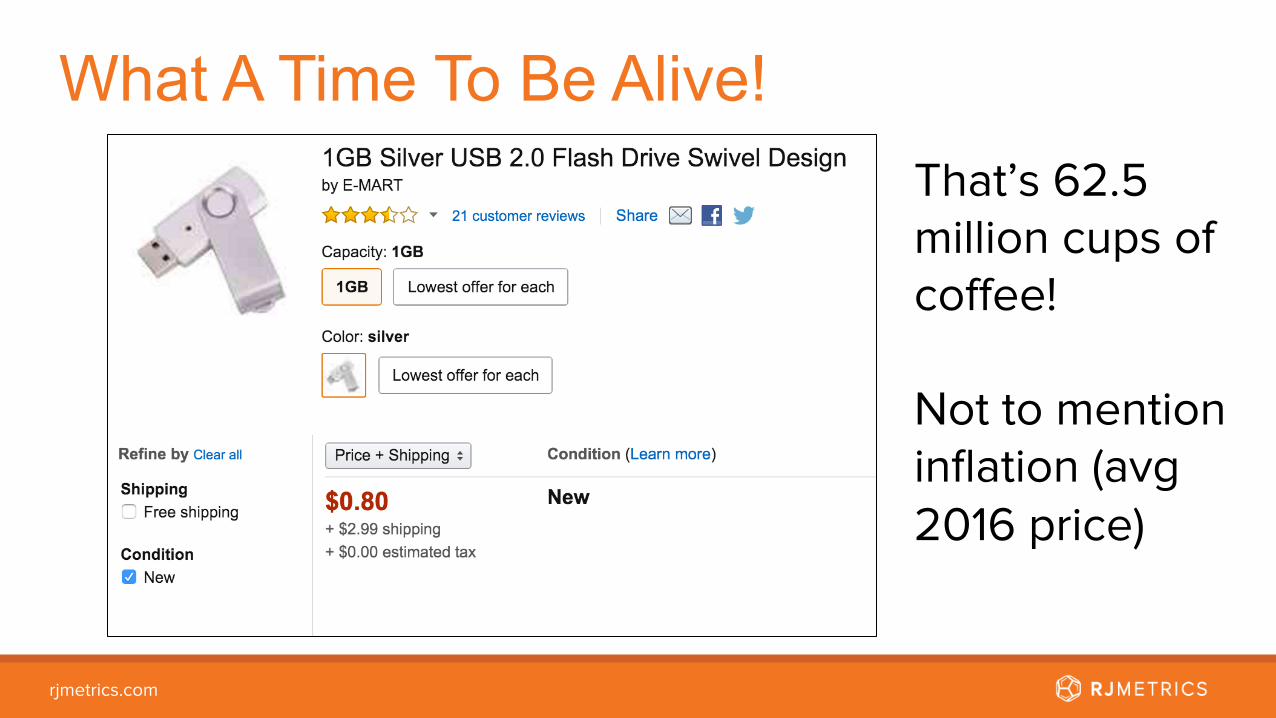
Things Have Changed
rjmetrics.com
What A Time To Be Alive! That’s 62.5 million cups of coffee! Not to mention inflation (avg 2016 price)

rjmetrics.com
Changing Times: It’s Not Just Storage

rjmetrics.com

rjmetrics.com

rjmetrics.com

rjmetrics.com

rjmetrics.com

rjmetrics.com
What This Means for Business
Behavioral Data
Attribution Data
Transaction Data
Customer Data
Why?
Where?
What/When?
Who?
Time

rjmetrics.com
What This Means for You
It is easier than ever to use data to understand the behavior and habits of your customers.
Here’s how.

Statistical Groundwork Part I: Correlation and Causation

rjmetrics.com
Correlation and Causation Just because two things consistently move in the same direction, that doesn’t mean that one causes the other.

rjmetrics.com
Correlation and Causation
A B Nick Cage Films Drowning Deaths
rjmetrics.com
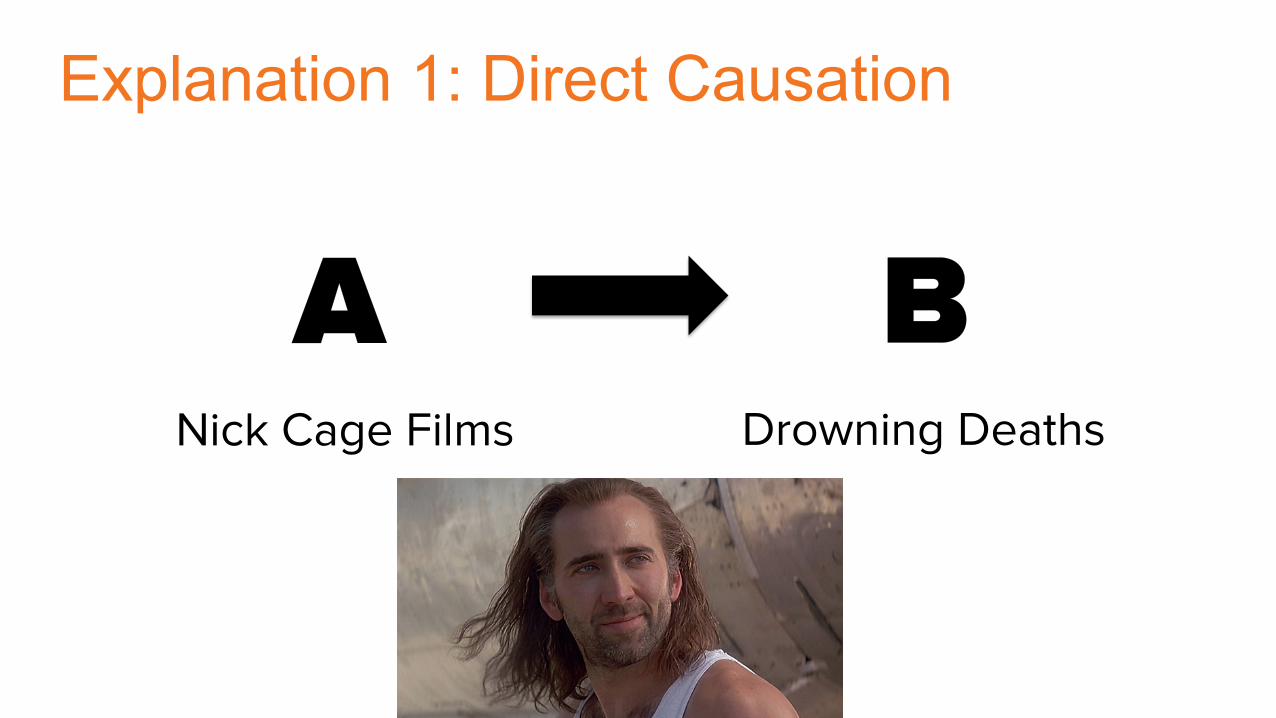
Explanation 1: Direct Causation
A B Nick Cage Films Drowning Deaths

rjmetrics.com
Explanation 2: Indirect Causation
A B Nick Cage Films Drowning Deaths

rjmetrics.com
Explanation 3: Lurking Variable
A B Nick Cage Films Drowning Deaths
C

rjmetrics.com
Explanation 4: Cyclical
A B Nick Cage Films Drowning Deaths

rjmetrics.com
Explanation 5: Unrelated
A B Nick Cage Films Drowning Deaths
X
rjmetrics.com
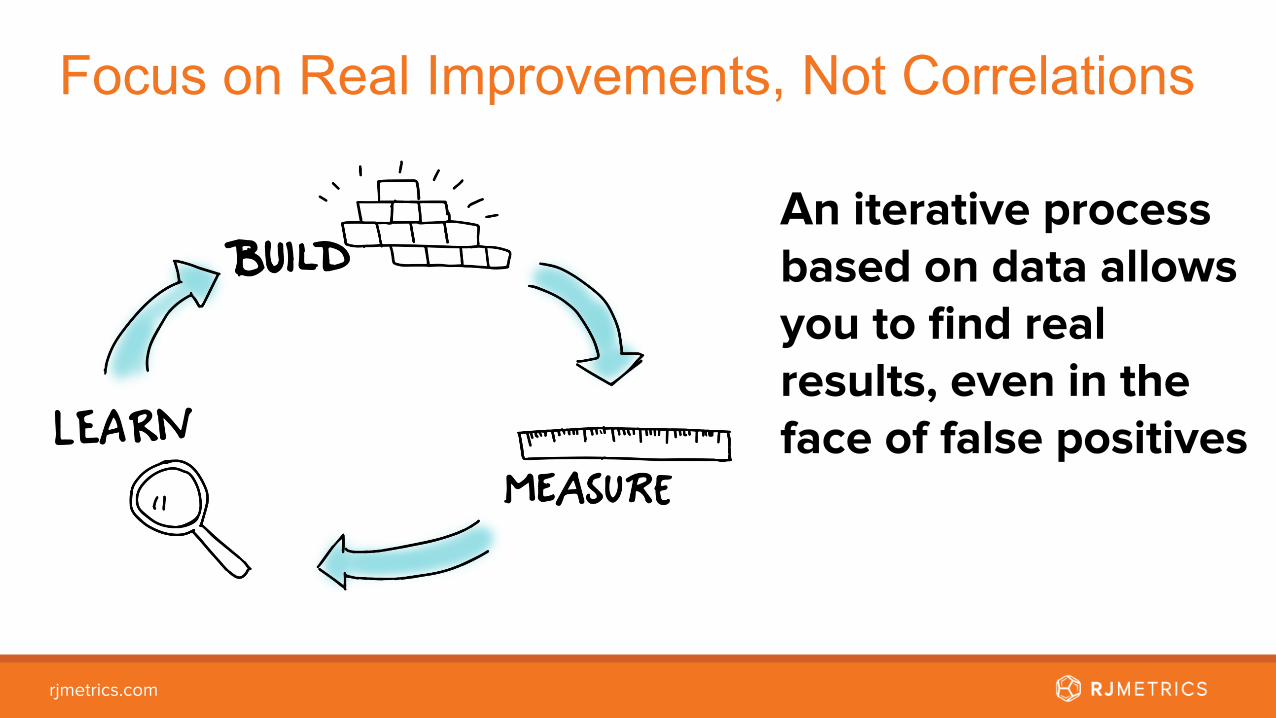
Focus on Real Improvements, Not Correlations
An iterative process based on data allows you to find real results, even in the face of false positives

Statistical Groundwork Part II: Statistical Significance

rjmetrics.com
Statistical Significance: Go Big
Experiment A Old Conversion Rate: 1.0% New Conversion Rate: 1.1% Trials Required: ?

rjmetrics.com
Statistical Significance: Go Big
Experiment A Old Conversion Rate: 1.0% New Conversion Rate: 1.1% Trials Required: 159,650

rjmetrics.com
Statistical Significance: Go Big
Experiment A Old Conversion Rate: 1.0% New Conversion Rate: 1.1% Trials Required: 159,650
Experiment B Old Conversion Rate: 1.0% New Conversion Rate: 2.0% Trials Required: ?

rjmetrics.com
Statistical Significance: Go Big
Experiment A Old Conversion Rate: 1.0% New Conversion Rate: 1.1% Trials Required: 159,650
Experiment B Old Conversion Rate: 1.0% New Conversion Rate: 2.0% Trials Required: 2,226
Lesson: If you’re small, go big or die waiting Get the numbers at www.testsignificance.com

rjmetrics.com
Side Benefit of Going Big

Techniques Part I: Golden Motion Analysis

rjmetrics.com
Our Golden Motion Experiment What am I trying to learn? RJMetrics has a free trial. What behaviors (“golden motions”) increase the likelihood of user conversion? How will this change my behavior? If we identify actions that are linked to strong increases in conversion, we can change our onboarding process to that more users will take those actions. How will we measure success? Increase in free trial conversion rate.

rjmetrics.com
Step One: Instrumentation
Just a few years ago, this was extremely hard. Today, it is trivially easy!
What might we want to track: • Logins • Chart Creation • Chart Editing • Adding Users
• Sharing Dashboards • Using APIs • Connecting Multiple Data Sources • Time Spent In Tool

rjmetrics.com
Step Two: Consolidation Get that event data right alongside everything else you know about your customer or prospect. Again, third party tools have made this very easy!
(my only plug, I swear!)

rjmetrics.com
Step Two: Consolidation

rjmetrics.com
Step Two: Consolidation UserID Didtheyconvert? ChartsCreated UsersCreated DataConnected …
1 No 0 1 1 …
2 Yes 10 3 1 …
3 No 4 5 1 …
4 No 2 4 2 …
5 No 0 3 3 …
6 No 0 4 2 …
7 Yes 14 7 1 …
8 No 0 5 1 …
… … … … … …

rjmetrics.com
Step Three: Run Tests Example: Does connecting more data sources increase conversion rate? Data: Result: No statistically significant difference. (two-tailed p = 0.71)
Data Sources Conversion Rate Sample Size
1 30% 90
More than 1 34% 110

rjmetrics.com
Step Three: Run Tests Example: Does creating more charts increase conversion rate? (this was WAY down on my list of guesses)

rjmetrics.com
Step Three: Run Tests Example: Does creating more charts increase conversion rate? Data: Result: YES! Statistically significant difference. (two-tailed p < 0.01)
Charts Conversion Rate Sample Size
0 30% 70
1 or More 62% 130

rjmetrics.com
Step Three: Run Tests Example: Does creating more charts increase conversion rate? Data:
Charts Conversion Rate Sample Size Significant?
0 30% 70 Yes
1 48% 55 Yes
2 66% 35 Yes
3 70% 20 No
4 or more 71% 20 No

rjmetrics.com
Step Four: Change Behavior Objective: Make sure every client creates at least two charts on their own. Changes: • Introduce self-guided tour of report builder • Give new clients “homework” after launch calls • Beef up documentation on report builder • Give our Account Management team tools to track this metric

rjmetrics.com
Step Four: Measure Again Nothing is promised! Your work isn’t done.
Don’t get Nicholas Cage’d.

rjmetrics.com
Step Four: Measure Again
0%
10%
20%
30%
40%
50%
60%
70%
1/1/13 2/1/13 3/1/13 4/1/13 5/1/13 6/1/13 7/1/13 8/1/13 9/1/13 10/1/1311/1/1312/1/13
ConversionRate
Change implemented here
BOOM!

Techniques Part II: Cluster Analysis

rjmetrics.com
Cluster Analyis We can start with that same event data from the last example

rjmetrics.com
Cluster Analysis Decide on attributes to cluster on: Maybe user profiling is more complex than just “viewers” and “creators.” And where do you draw the line?

rjmetrics.com
Cluster Analysis Algorithms (in this case the k-means algorithm) group our users into groups that are most statistically similar to one another based on the behaviors we’ve observed


We found the TVs!

We found the Execs!
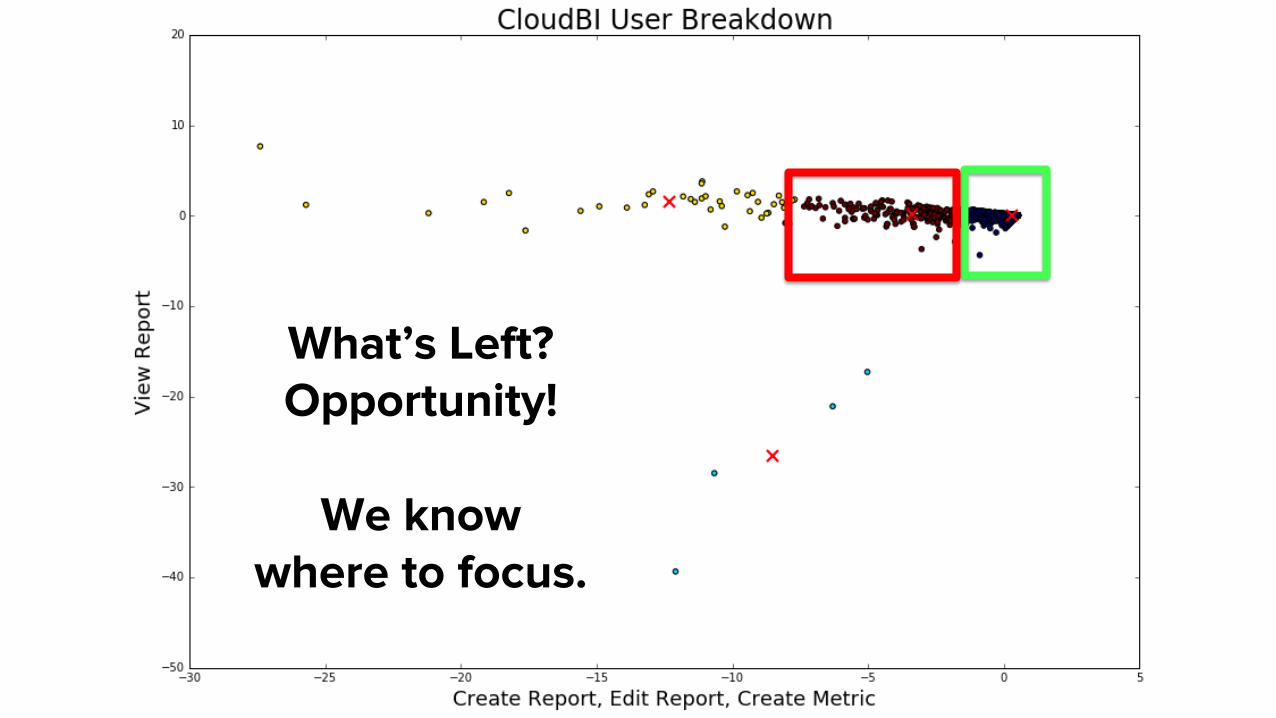
What’s Left? Opportunity!
We know
where to focus.

rjmetrics.com
The Opportunities Are Enormous
Give data a seat at the table!
It won’t answer everything, but it’s an important voice when you’re studying
user habits.