DETAILED PROJECT REPORT ON STENTER MACHINE · PDF fileSTENTER MACHINE (6 CHAMBER) (SURAT...
45
DETAILED PROJECT REPORT ON STENTER MACHINE (6 CHAMBER) (SURAT TEXTILE CLUSTER) Bureau of Energy Efficiency Prepared By Reviewed By
Transcript of DETAILED PROJECT REPORT ON STENTER MACHINE · PDF fileSTENTER MACHINE (6 CHAMBER) (SURAT...

DETAILED PROJECT REPORT
ON STENTER MACHINE (6 CHAMBER)
(SURAT TEXTILE CLUSTER)
Bureau of Energy Efficiency
Prepared By Reviewed By

STENTER MACHINE
(6 CHAMBER)
SURAT TEXTILE CLUSTER

BEE, 2010
Detailed Project Report on Stenter Machine (6 Chamber)
Textile SME Cluster, Surat, Gujarat (India)
New Delhi: Bureau of Energy Efficiency;
Detail Project Report No.: SRT/TXT/STT/10
For more information
Bureau of Energy Efficiency
Ministry of Power, Government of India
4th Floor, Sewa Bhawan, Sector – 1
R. K. Puram, New Delhi -110066
Ph: +91 11 26179699 Fax: 11 26178352
Email: [email protected]
WEB: www.bee-india.nic.in

Acknowledgement
We are sincerely thankful to the Bureau of Energy Efficiency, Ministry of Power, for giving us the
opportunity to implement the ‘BEE SME project in “Surat Textile Cluster, Surat”. We express our
sincere gratitude to all concerned officials for their support and guidance during the conduct of
this exercise.
Dr. Ajay Mathur, Director General, BEE
Smt. Abha Shukla, Secretary, BEE
Shri Jitendra Sood, Energy Economist, BEE
Shri Pawan Kumar Tiwari, Advisor (SME), BEE
Shri Rajeev Yadav, Project Economist, BEE
Zenith Energy Services Pvt. Ltd. is also thankful to “Shri Mahesh Malpani, Chairman, PEPL and
Surat Textile Manufacturers Association” for their valuable inputs, co-operation, support and
identification of the units for energy use and technology audit studies and facilitating the
implementation of BEE SME program in Surat Textile Cluster.
We take this opportunity to express our appreciation for the excellent support provided by
Textile Unit Owners, Local Service Providers, and Equipment Suppliers for their active
involvement and their valuable inputs in making the program successful and in completion of the
Detailed Project Report (DPR).
ZESPL is also thankful to all the SME owners, plant in charges and all workers of the SME units
for their support during the energy use and technology audit studies and in implementation of
the project objectives.
Zenith Energy Services Pvt. Ltd.
Hyderabad

Content
List of Annexure .................................................................................................................. vii
List of Tables ...................................................................................................................... vii
List of Figures ..................................................................................................................... viii
List of Abbreviations ............................................................................................................ viii
EXECUTIVE SUMMARY ..................................................................................................... ix
ABOUT BEE’S SME PROGRAM ......................................................................................... xi
1 INTRODUCTION .......................................................................................................... 1
1.1 Brief about the SME cluster .......................................................................................... 1
1.2 Energy performance in existing situation ...................................................................... 4
1.2.1 Fuel and electricity consumption of a typical unit .......................................................... 4
1.2.2 Average production by a typical unit in the cluster ........................................................ 4
1.3 Identification of technology/equipment to be upgraded / changed ................................ 4
1.3.1 Description of current technologies ............................................................................... 4
1.3.2 Its role in the whole process ......................................................................................... 4
1.4 Establishing the baseline .............................................................................................. 5
1.4.1 Design and operating parameters/fuel consumption ..................................................... 5
1.4.2 Electricity Consumption ................................................................................................ 5
1.5 Barriers for adoption of new and energy efficient technology/equipment ...................... 5
1.5.1 Technological Barriers .................................................................................................. 5
1.5.2 Financial Barrier ........................................................................................................... 5
1.5.3 Skilled manpower ......................................................................................................... 6
1.5.4 Other barrier(s) ............................................................................................................. 6
2. Technology/equipment for energy efficiency improvements .................................. 7
2.1 Detailed description of equipment selected ................................................................. 7
2.1.1 Description of equipment .............................................................................................. 7
2.1.2 Technology/equipment specifications ........................................................................... 7

2.1.3 Justification of the equipment selected & Suitability/integration with existing process... 8
2.1.4 Superiority over existing technology/equipment ........................................................... 8
2.1.5 Availability of the proposed equipment ...................................................................... 10
2.1.6 Source of technology/equipment ............................................................................... 10
2.1.7 Service/technology providers .................................................................................... 10
2.1.8 Terms and condition in sales ...................................................................................... 10
2.1.9 Process down time during implementation ................................................................. 11
2.2 Life cycle assessment and risks analysis ................................................................... 11
2.3 Suitable unit/plant size in terms of capacity/production ............................................... 11
3. ECONOMIC BENEFITS OF NEW ENERGY EFFICIENT STENTER.......................... 12
3.1 Technical benefits ..................................................................................................... 12
3.1.1 Fuel savings per year ................................................................................................ 12
3.1.2 Electricity saving ......................................................................................................... 12
3.1.3 Improvement in product quality ................................................................................. 12
3.1.3 Increase in production ............................................................................................... 12
3.1.4 Reduction in raw material consumption ..................................................................... 12
3.15 Reduction in other losses ........................................................................................... 12
3.2 Monetary benefits ....................................................................................................... 12
3.3 Social benefits ........................................................................................................... 13
3.3.1 Improvement in working environment in the plant ...................................................... 13
3.3.2 Improvement in skill set of workers ............................................................................ 13
3.4 Environmental benefits .............................................................................................. 13
3.4.1 Reduction in effluent generation ................................................................................ 13
3.4.2 Reduction in GHG emission such as CO2, NOx, etc................................................... 13
3.4.3 Reduction in other emissions like SOx ........................................................................ 13
4 FINANSIAL ANALYSIS OF NEW ENERGY EFFICIENT EQUIPMENT ..................... 14
4.1 Cost of equipment implementation ............................................................................. 14
4.1.1 Cost of equipments .................................................................................................... 14

4.1.2 Other costs ................................................................................................................. 14
4.2 Arrangement of funds ................................................................................................ 14
4.2.1 Entrepreneur’s contribution ....................................................................................... 14
4.2.2 Loan amount ............................................................................................................. 14
4.2.3 Terms & conditions of loan ........................................................................................ 14
4.3 Financial indicators.................................................................................................... 14
4.3.1 Cash flow analysis .................................................................................................... 14
4.3.2 Simple payback period .............................................................................................. 15
4.3.3 Net Present Value (NPV) .......................................................................................... 15
4.3.4 Internal rate of return (IRR) ....................................................................................... 15
4.3.5 Return on investment (ROI) ....................................................................................... 15
4.4 Sensitivity analysis in realistic, pessimistic and optimistic scenarios .......................... 15

vii
List of Annexure
Annexure 1: Process flow diagram ...................................................................................... 16
Annexure 2: Detailed technology assessment report .......................................................... 17
Annexure 3: Drawings for proposed civil works ................................................................... 18
Annexure 4: Detailed financial calculations & analysis for financial indicators ..................... 19
Annexure 5: Details of procurement and implementation plan with schedule/timelines ....... 20
Annexure 6: Details of technology/equipment and service providers ................................... 24
Annexure 7: Quotations or Techno-commercial bids for new technology/equipment ........... 25
List of Table
Table 1.1 Energy consumption in typical units (Vimlon Dyeing Printing Mills Pvt. Ltd.) .......... 4
Table 1.2 Electricity consumption in different unit .................................................................. 5
Table 1.3 Technical specifications of the new energy efficient stenter ................................... 8
Table 4.1 Details of project cost .......................................................................................... 14
Table 4.2 Sensitivity analysis at different scenarios ............................................................ 15
List of Figure
Figure 1: General process flowchart of a typical textile unit .................................................. 3

viii
LIST OF ABBREVATIONS
� BEE - Bureau of Energy Efficiency
� DPR - Detailed Project Report
� DSCR - Debt Service Coverage Ratio
� FD - Forced Draft
� GHG - Green House Gases
� HP - Horse Power
� IRR - Internal Rate of Return
� ID - Induced Draft
� MoP - Ministry of Power
� NPV - Net Present Value
� ROI - Return On Investment
� SME - Small and Medium Enterprises
� TFH - Thermic Fluid Heater
� MoMSME - Ministry of Micro Small and Medium Enterprises

ix
EXECUTIVE SUMMARY Zenith Energy Services Pvt. Ltd is executing BEE - SME program in Surat textile cluster, supported
by Bureau of Energy Efficiency with an overall objective of improving the energy efficiency in
cluster units.
Surat is renowned for the synthetic Sarees and dress materials and there are about 450 above
industries in the cluster. The major fuels used in the cluster units are Imported Coal, Lignite,
Natural gas and Biomass (Groundnut husk briquettes and Wood). Lignite and imported coal are
used in boilers for steam generation. Natural gas is used in Stenter (for heat setting) and
Natural gas based generators. The cost of energy as a percentage of manufacturing cost varies
anywhere between 12 to 15%, which includes electrical as well as thermal energy cost.
Stenter machine is mainly used for colour setting of fabrics and major electricity consuming
equipments in Surat textile industries. Majority of the stenter are gas based and very few are
working on thermic fluid heaters. Electricity and gas are two energy forms used in stenter.
Electricity is used for driving fans/blowers, main drive, overfeed drive, plaited and mangle
motors etc and natural gas is for hot air requirement. Generally, stenter installed are of locally
fabricated by the local service providers. As per the detailed energy audits conducted, about
90% of the stenter installed in the cluster are of local make and the fans/blowers & motors
installed are of local make and are less efficient.
This DPR is prepared for installation of new efficient stenter “Hot Air Stenter Machine” of 6
chambers suitable for processing of synthetic sarees and dress materials. Project activity i.e.,
installation of new stenter reduces electricity consumption by 4,03,200 kWh per annum.
This bankable DPR also found eligible for subsidy scheme of MoMSME for “Technology and
Quality Upgradation Support to Micro, Small and Medium Enterprises” under “National
Manufacturing and Competitiveness Programme”. The key indicators of the DPR including the
Project cost, debt equity ratio, monetary benefit and other necessary parameters are given in
table:

x
The projected profitability and financial indicators shows that the installation of energy
efficient stenter will be able to earn profit and make the project financially viable and
technically feasible.
S.No Parameter Unit Value
1 Project cost ` in lakh 56.56
2 Electricity saving kWh/annum 4,03,200
3 Debit equity ratio ratio 3:1
4 Monetary benefit ` in lakh 22.58
5 Simple payback period years 2.50
6 NPV ` in lakh 24.84
7 IRR % age 22.48
8 ROI % age 24.82
9 DSCR ratio 1.67
10 Process down time during implementation week 2

xi
ABOUT BEE SME PROGRAMME
Bureau of Energy Efficiency (BEE) is implementing a BEE-SME Programme to improve the
energy performance in 25 selected SMEs clusters. Surat Textile Cluster is one of them. The
BEE’s SME Programme intends to enhance the energy efficiency awareness by
funding/subsidizing need based studies in SME clusters and giving energy conservation
recommendations. For addressing the specific problems of these SMEs and enhancing energy
efficiency in the clusters, BEE will be focusing on energy efficiency, energy conservation and
technology up gradation through studies and pilot projects in these SMEs clusters.
Major activities in the BEE -SME program are furnished below:
Energy use and technology studies
The energy use technology studies would provide information on technology status, best
operating practices, gaps in skills and knowledge on energy conservation opportunities, energy
saving potential and new energy efficient technologies, etc for each of the sub sector in SMEs.
Capacity building of stake holders in cluster on energy efficiency
In most of the cases SME entrepreneurs are dependent on the locally available technologies,
service providers for various reasons. To address this issue BEE has also undertaken capacity
building of local service providers and entrepreneurs/ managers of SMEs on energy efficiency
improvement in their units as well as clusters. The local service providers will be trained in order
to be able to provide the local services in setting of energy efficiency projects in the clusters
Implementation of energy efficiency measures
To implement the technology up gradation projects in clusters, BEE has proposed to prepare
the technology based detailed project reports (DPRs) for a minimum of five technologies in
three capacities for each technology.
Facilitation of innovative financing mechanisms for implementation of energy efficiency
projects
The objective of this activity is to facilitate the uptake of energy efficiency measures through
innovative financing mechanisms without creating market distortion.

Stenter Machine (6 Chamber)
1
1 INTRODUCTION
1.1 Brief about the SME cluster
The products manufactured in Surat Textile Cluster are synthetic sarees and dress materials
which are renowned in the country as well as abroad and have good domestic market. The main
raw material used for the cluster units is grey cloth which is procured by local weaving units and
agents. The cost of energy (electrical and thermal energy) varies between 12 and 15% of total
manufacturing cost.
Majority of the cluster units are of integrated type, where the raw material “grey cloth” is
processed in-house to the final product like sarees and dress materials. Most of the units of the
cluster are working on Job basis, where the textile agents will provide design and grey cloth and
the grey cloth is processed as per design provided by the clients. The energy cost is next to the
raw materials cost.
Production process
The main process operation for dyeing and printing process of synthetic sarees and dress
materials adopted in cluster units are as follows:
Fabric pre-treatment
The main purpose of the fabric pre-treatment process is to remove oil, grease and other materials
and to whiten the grey cloth though bleaching. The various process adopted in pre-treatment are
scouring, bleaching and shrinking process.
Dyeing
Dyeing is the process of imparting colors to the material through a dye (color). In which a dye is
applied to the substrate in a uniform manner to obtain an even shade with a performance and
fastness appropriate to its final use. This process is mainly performed in Jet Dyeing Machines
and Jigger machines.
Dyeing of fabric is carried out in jet dyeing machines. The temperature of the solution is raised to
50°C. Concentrated dyestuff solution is prepared separately and is added to the liquor. After the
addition of dyes, the temperature is raised to 130°C and maintained for about 60 minutes.
After whitening/dyeing, the fabric is unloaded from the machine and taken to the folding and
rolling machines for improving the width of cloth, which gets shrunk during the washing and
dyeing process.

Stenter Machine (6 Chamber)
2
Printing
In Surat cluster three types printing methods are used. Most of the units are following the flat bed
printing, rotary printing and some units follows hand printing. Hand printing is the old method to
print the fabric. The flat bed printing has provision for printing 10 to 14 colors simultaneously. The
color print paste prepared is fed onto the screens from which it is transferred to the fabric fed in.
The fabric after print paste transfer is passed through a drying chamber at 145°C. The dried and
printed fabric is taken for further processing.
Drying and Error! Hyperlink reference not valid.Finishing
After printing, the drying process is performed in loop machine, where the temperature is
maintained between 130°C to 170°C for better color setting. After passing through the loop
machines, the printed fabric is washed in a series of normal water and hot water washing in the
presence of chemicals for color setting. After completion of the washing process, the printed and
washed fabric is subjected to heat setting process in Stenter and then pressing and finishing
treatments.

Stenter Machine (6 Chamber)
3
General Printing
Figure 1: General process flowchart of a typical textile unit
Gray (Raw Material)
Scouring (Soflina)
Shrinking & Bleaching
(Drum Washer)
Dyeing & Washing (Jet
Dyeing)
Heat Setting (Stenter)
Printing
Colour Setting (Loop
Machine)
Hydro Extraction
Heat Setting (Stenter)
Pressing
Packing/Dispatch
Grey
(Raw Material)
Scouring (Soflina)
Shrinking & Bleaching
(Drum Washer)
Dyeing & Washing
(Jet Dyeing)
Heat Setting
(Stenter)
Printing
Colour Setting
(Loop Machine)
Hydro Extraction
Heat Setting (Stenter)
Pressing
Packing/Dispatch

Stenter Machine (6 Chamber)
4
1.2 Energy performance in existing situation
1.2.1 Fuel and electricity consumption of a typical unit
The main energy forms used in a typical unit in the cluster are electricity, coal/lignite and natural
gas. Electricity is used for driving the prime movers of pumps, fans, stenter fans, ID and FD fans,
conveyers, loop machines drives, lighting etc. Imported coal and lignite are used as fuel in boilers
for steam generation whereas natural gas is used as fuel in electricity generation for stenter,
printing and loop machines. The energy consumption of a typical unit in the cluster using local
make pumps and having conventional stenter is furnished in Table 1.1 below:
Table 1.1 Energy consumption in typical units (Vimlon Dyeing Printing Mills Pvt. Ltd.)
S.No Details Unit Value
1 Coal/lignite consumption tonne/year 3802
2 Grid electricity consumption MWh/annum 1296
3 Natural gas consumption Million SCM/annum 0.834
4 Production (quantity processed) mts(In lakh)/year 264
1.2.2 Average production by a typical unit in the cluster
The average production in a typical unit is 264 lakh meter of final product per year.
1.3 Identification of technology/equipment to be upgraded / changed
1.3.1 Description of current technologies
There are about 500 stenter in the entire cluster units and all the stenter are of local fabricated.
As per the detailed studies undertaken in various units of the cluster, the stenter are less efficient
and consuming more power than the efficient stenter available in the market. Power consumption
is more due to inefficient blowers, less efficient motors, damper control of the air flow, in efficient
main drive systems, and also due to poor insulation etc.
1.3.2 Its role in the whole process
Stenter is used in a typical textile unit for drying & heat setting before and after printing process of
the synthetic cloth. In this process hot air is supplied through the blowers in different chambers of
machine.

Stenter Machine (6 Chamber)
5
1.4 Establishing the baseline
1.4.1 Design and operating parameters/fuel consumption
The present connected load for 6 chamber stenter is 156 kW and actual power consumption
varies as per the production required on daily basis. If the required production is low, some of the
chambers are not operated and when full production is required all chambers are operated. The
baseline power consumption of the stenter machine having 6 chambers is 130 kWh for 80,000
meters/day. The stenter machines are operated for 24 hours in a day.
1.4.2 Electricity Consumption
Electricity consumption of various stenter machines of three cluster units is furnished in Table 1.2
below:
Table 1.2 Electricity consumption in different unit
S. No Name of the unit Stenter Machine
Capacity (meters/day)
Power consumption (kWh/day)
specific power consumption/
meters
1 Vimlon Dye & Ptg. Mills Pvt. Ltd 80,000 3120 0.039
2 Vitrag Silk Mills Pvt. Ltd 80,000 2304 0.038
3 Pushpanjali Dye & Ptg. Mills Pvt. Ltd.
70,000 2760 0.039
1.5 Barriers for adoption of new and energy efficient technology/equipment
1.5.1 Technological Barriers
The major technical barriers that prevented the implementation of the energy efficient stenter in
the cluster are:
• Lack of awareness about new energy efficient stenter and its benefit
• Lack of awareness of the losses and monetary benefit of energy efficient stenter
• Dependence on local equipment suppliers, who doesn’t have technical knowledge about
energy efficient equipment.
1.5.2 Financial Barrier
• High initial investment and lack of financial strength to the SME owners
• Unit owner are not willing to invest money for energy efficiency project.

Stenter Machine (6 Chamber)
6
1.5.3 Skilled manpower
Not applicable
1.5.4 Other barrier(s)
Information on the energy efficient technologies not available among cluster unit owners, though
the suppliers are available locally, the information was not disseminated among cluster units.

Stenter Machine (6 Chamber)
7
2. TECHNOLOGY/EQUIPMENT FOR ENERGY EFFICIENCY IMPROVEMENTS
2.1 Detailed description of equipment selected
2.1.1 Description of equipment
The project activity is replacement of the stenter with new energy efficient stenter. The new
stenter will reduce 37% power consumption than the existing stenter due to efficient blowers,
efficient motors, efficient drive system, auto control of the flow etc.
In Surat Textile Cluster units, the stenter are consuming about 130 kW per hour to 140 kW per
hour of the similar production capacity of 80,000 meters/day and whereas the new efficient
stenter consume 82 kW per hour reducing 48 kW per hour of operation for full load.
Considering the above facts and for reducing electricity consumption in stenter, it is suggested to
install energy efficient stenter.
2.1.2 Technology/equipment specifications
Technical specifications of the new energy efficient stenter are furnished in Table 1.3 below:
Figure 2.1 Variable Frequency Drives

Stenter Machine (6 Chamber)
8
Table 1.3 Technical specifications of the new energy efficient stenter
S.No. Particular Details
1 Model LUCY
2 Type Close circuit heat setting pin type stenter machine
3 No. of chamber Six
4 Working width 1600mm working width & 1800mm roller face
5 Mechanical machine speed 0 to 100 mtrs / min
6 Driving method A.C. Inverter drives
7 Heating media Gas
8 Power requirement 380-V/440-V/500-V 3 phase, 50 Hz.
9 Interiors High temperature heat resistant silver chamber
10 Type of blower High efficiency radial fans 2 Nos. per chamber
11 Insulation Rockwool
12 Mangle 3-bowl inclined (10 ton capacity)
13 Outlet arrangement Painter big matching
14 Inlet arrangement High entrance
Further details are provided in the Annexure 8.
2.1.3 Justification of the equipment selected & Suitability/integration with existing
process
The present power consumption for the same production capacity stenters is high and new
stenter will consume 36% less power than the existing stenter hence, new stenter selected will
give same or more output with low input.
2.1.4 Superiority over existing technology/equipment
The new energy efficiency stenter has superior features than the existing stenter as follow:
Overfeed Pinning Device
This effective uncurling device used in textile machines ensures that their reliability on woven or
knitting fabrics with the curl either face upwards or downwards full opened edges give high

Stenter Machine (6 Chamber)
9
pinning accuracy to textile machine at optimum processing speed misprinting is avoided and
machine down time reduced.
High Efficiency Blower Device of Drying
Special designed textile machine heat exchanger most effective hot air circulation system and
unique nozzle make high efficiency of drying. Circulation fan if of well balanced radial propeller
and volume of hot air with quit rotation. Repairs checking & cleaning are easy thanks to big
opening doors on both side of chamber and able to be moved up and down nozzle for easy
maintenance.
Stenter Chain Mechanism
The stenter chain glides through the cast iron rails which provide long service life, Low co-efficient
of friction between sintered bronze chain bottoms and special grade cast machined and ground
rails reduces lode on the main drive motor and gears. The choice of chain type depends on the
process and fabrics. The chain is available in alternative types of pin only, clip only and pin clip
combination
Gas Burner
The system of heating by direct gas works with two Burners in each field. The temperature
regulators are chosen to a maximum Precision and readability. They are complemented by an
analogue thermometer in each field.
Structure of Nozzle
For drying, setting of thin thick and delicate woven fabrics or knit fabric a special designed nozzle
makes fabric even touches by adjustable pressure & volume of hot air circulation.
Outlet Arrangement
Cloth Cooling Unit, cloth take off device, small Batch winder 600 mm, Big Batching 1500 mm for
Big Batching trolley, plaiter arrangement for cloth outer Trolley & Declutching arrangement for
sudden stoppage of outlet Roller.
In-feed Arrangement With Cockpit
Inlet Desk & Cockpit with machine control Switches Board over-feed under-feed variable speed
with PIV drive & A.C. Inverter drive, clutch de-clutch arrangement, selvedge tension control,
Selvedge three fingers uncurled, pinning device with rubber brush assembly, post pin brushes &
platform.
Mangle

Stenter Machine (6 Chamber)
10
Bharat make 2/3 bowls padres are manufacture in horizontal, vertical, inclined or semi-inclined
versions. High fabric entrance with smooth running roller in the entry section ensures that low
tension fabric in feed and crease free cloth runs.
2.1.5 Availability of the proposed equipment
The suppliers for energy efficient stenter are available in Surat and the details of the suppliers are
provided in Annexure 7.
2.1.6 Source of technology/equipment
The technology is locally available.
2.1.7 Service/technology providers
Details of service providers are in Annexure 7.
2.1.8 Terms and condition in sales
Stenter Machine (6 Chamber)
11
2.1.9 Process down time during implementation
Two week process down time required in implementation of proposed project and detail breakup
are given in Annexure 5.
2.2 Life cycle assessment and risks analysis
The operational life of the stenter machine is considered to be 15 years.
2.3 Suitable unit/plant size in terms of capacity/production
Unit having production capacity is about 80000 lakh meters per day is suitable for implementation
of this proposed machine.

Stenter Machine (6 Chamber)
12
3. ECONOMIC BENEFITS OF NEW ENERGY EFFICIENT STENTER
3.1 Technical benefits
3.1.1 Fuel savings per year
Though, there is possibility of fuel savings due to improved design, the equipment supplier is not
giving guarantee due to implementation of the project activity.
3.1.2 Electricity saving
Based on the detailed studies carried out in various units of the cluster, the average electricity
consumption in conventional 6 chamber stenter machine is 130 kWh per day for 24 hour of
operation and 10,92,000 kWh per annum for 350 days of operation while for the same production
capacity, electricity consumption for new stenter machine would be only 6,88,800 kWh per year
thereby, electricity savings is estimated as 4,03,200 kWh per year.
3.1.3 Improvement in product quality
The product quality may improve, as the stenter has special features.
3.1.3 Increase in production
Production may improve as the proposed new stenter will have less break downs due to easy
cleaning mechanism and improved design.
3.1.4 Reduction in raw material consumption
No significant impact on the reduction of raw materials consumption directly or indirectly.
3.15 Reduction in other losses
There is no reduction in other losses directly or indirectly.
3.2 Monetary benefits
Monetary benefit due to installation of new energy efficient stenter is estimated ` 22.58 lakh per
annum due to reduction in electricity consumption.

Stenter Machine (6 Chamber)
13
3.3 Social benefits
3.3.1 Improvement in working environment in the plant
As installation of new efficient stenter will have less radiation losses due to improved insulation
and hence working environment may improve.
3.3.2 Improvement in skill set of workers
The technology selected for the implementation is new and energy efficient. The training provided
by equipment suppliers will improve the technical skills of manpower for better operation and
maintenance; hence the technology implemented will create awareness among the workforce and
improves the skill.
3.4 Environmental benefits
3.4.1 Reduction in effluent generation
There is no significant impact in effluent generation due to implementation of the project.
3.4.2 Reduction in GHG emission such as CO2, NOx, etc
The major GHG emission reduction source is CO2. The technology will reduce grid electricity
consumption and emission reductions are estimated at 342 tonne of CO2 per annum due to
implementation of the project activity.
3.4.3 Reduction in other emissions like SOx
No significant impact on SOx emissions.

Stenter Machine (6 Chamber)
14
4 FINANSIAL ANALYSIS OF NEW ENERGY EFFICIENT EQUIPMENT
4.1 Cost of equipment implementation
4.1.1 Cost of equipments
Total cost for installation of the stenter machine is estimated at ` 56.00 lakh (Including taxes and
considering suitable discount) for the entire system.
4.1.2 Other costs
Erection and commissioning charges is considered at 1% of the equipment cost and is estimated
at `0.56 lakh.
Table 4.1 Details of project cost
4.2 Arrangement of funds
4.2.1 Entrepreneur’s contribution
The entrepreneur’s contribution is 25% of total project cost, which works out at ` 14.14 lakh.
4.2.2 Loan amount
The term loan is 75% of the total project, which is `42.42 lakh.
4.2.3 Terms & conditions of loan
The interest rate is considered at 10% which is SIDBI’s rate of interest for energy efficient
projects. The loan tenure is 5 years excluding initial moratorium period is 6 months from the date
of first disbursement of loan.
4.3 Financial indicators
4.3.1 Cash flow analysis
Considering the above discussed assumptions, the net cash accruals starting with ` 12.60 lakh in
the first year operation and increases to ` 62.64 lakh at the end of eighth year.
S. No. Details Cost (`̀̀̀ in lakh)
1 Plant equipment and machinery and electrical works 56.00
2 Erection & Commissioning 0.56
3 Interest during implementation (preliminary & pre- operative expenses) 0.00
Total 56.56

Stenter Machine (6 Chamber)
15
4.3.2 Simple payback period
The total project cost of the proposed technology is ` 56.56 lakh and monetary savings due to
reduction in fuel consumption is ` 22.58 lakh and the simple payback period works out to be 2.50
years.
4.3.3 Net Present Value (NPV)
The Net present value of the investment at 10.00% interest rate works out to be ` 24.84 lakh.
4.3.4 Internal rate of return (IRR)
The after tax Internal Rate of Return of the project works out to be 22.48%. Thus the project is
financially viable.
4.3.5 Return on investment (ROI)
The average return on investment of the project activity works out at 24.82%. The average DSCR
is 1.67.
4.4 Sensitivity analysis in realistic, pessimistic and optimistic scenarios
A sensitivity analysis has been worked out to ascertain how the project financials would behave in
different situations like there is an increase in power savings or decrease. For the purpose of
sensitive analysis, two scenarios are considered are.
• Increase in power savings by 5%
• Decrease in power savings by 5%
In each scenario, other inputs are assumed as constant. The financial indicators in each of the
above situation are indicated along with standard indicators are shown in Table 4.2 below:
Table 4.2 Sensitivity analysis at different scenarios
Particulars IRR % NPV ROI DSCR
Normal 22.48 24.84 24.82 1.67
5% decrease in electricity savings 20.41 20.52 24.48 1.58
5% increase in electricity savings 24.52 29.17 25.13 1.75
4.5 Procurement and implementation schedule
The project is expected to be completed in 8 week from the date of financial closure. The detailed
schedule of project implementation is furnished in Annexure 5.
Stenter Machine (6 Chamber)
16
Annexure
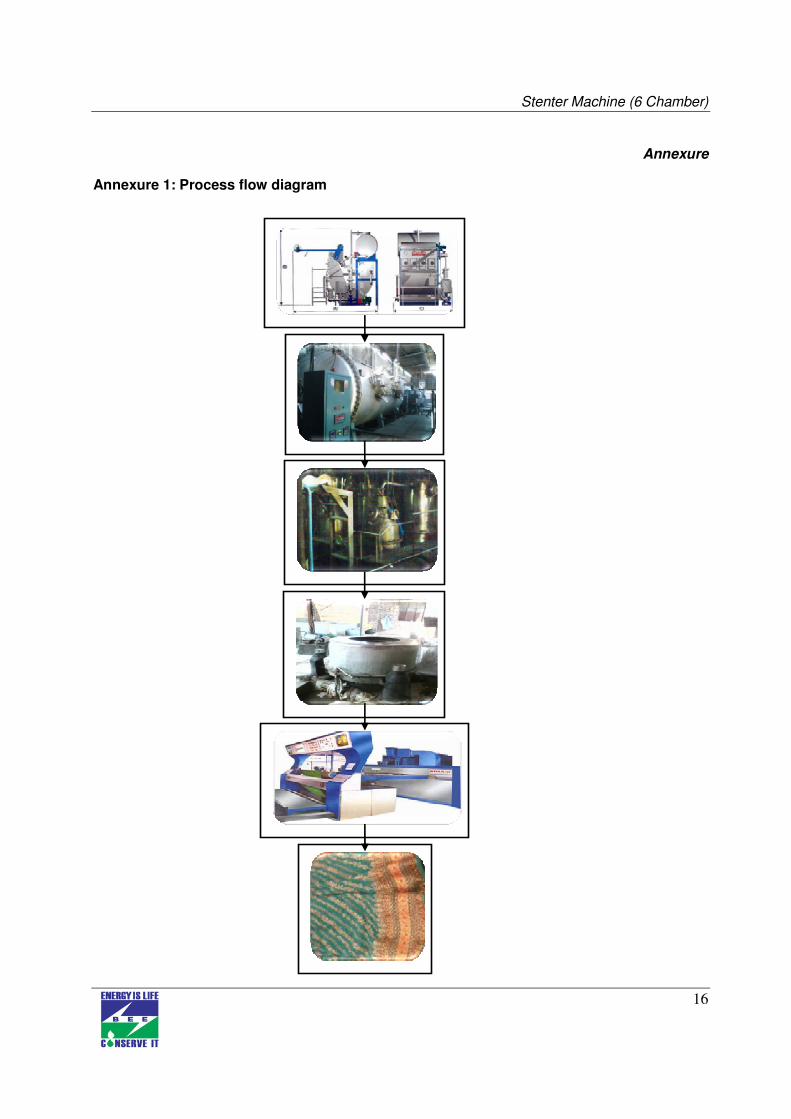
Annexure 1: Process flow diagram
Stenter Machine (6 Chamber)
17
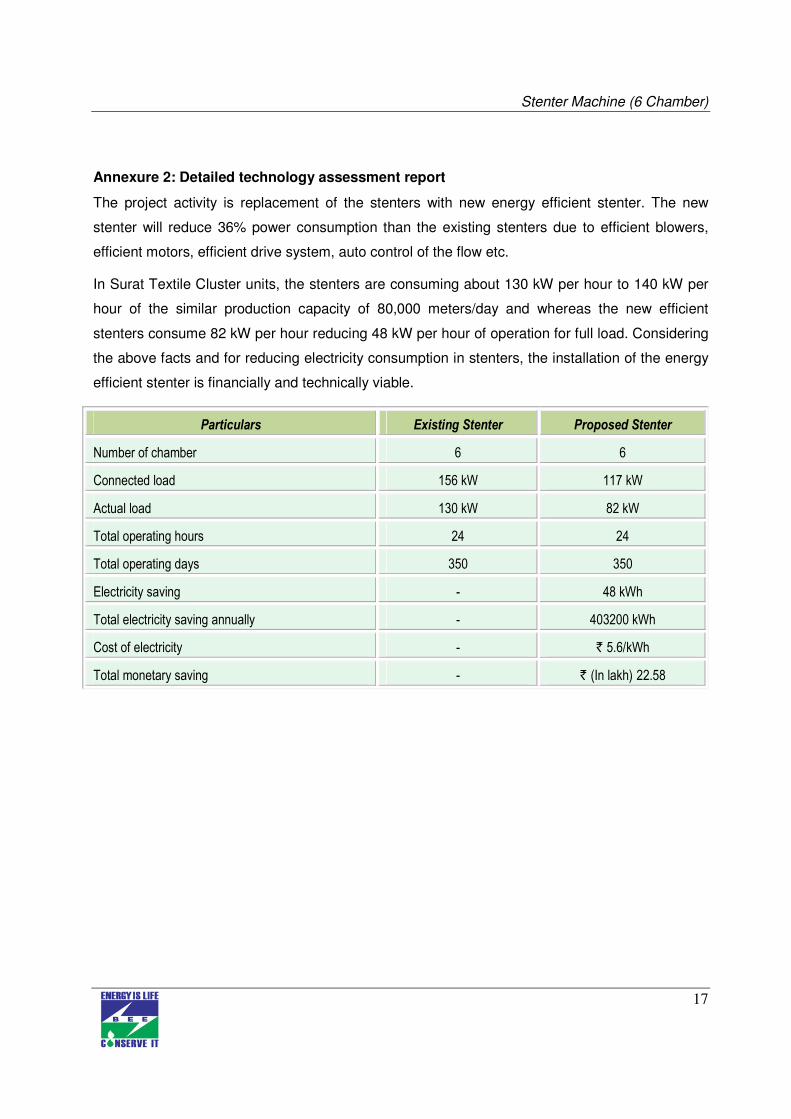
Annexure 2: Detailed technology assessment report
The project activity is replacement of the stenters with new energy efficient stenter. The new
stenter will reduce 36% power consumption than the existing stenters due to efficient blowers,
efficient motors, efficient drive system, auto control of the flow etc.
In Surat Textile Cluster units, the stenters are consuming about 130 kW per hour to 140 kW per
hour of the similar production capacity of 80,000 meters/day and whereas the new efficient
stenters consume 82 kW per hour reducing 48 kW per hour of operation for full load. Considering
the above facts and for reducing electricity consumption in stenters, the installation of the energy
efficient stenter is financially and technically viable.
Particulars Existing Stenter Proposed Stenter
Number of chamber 6 6
Connected load 156 kW 117 kW
Actual load 130 kW 82 kW
Total operating hours 24 24
Total operating days 350 350
Electricity saving - 48 kWh
Total electricity saving annually - 403200 kWh
Cost of electricity - ` 5.6/kWh
Total monetary saving - ` (In lakh) 22.58

Stenter Machine (6 Chamber)
18
Annexure 3: Drawings for proposed civil works
No civil works are envisaged

Stenter Machine (6 Chamber)
19
Annexure 4: Detailed financial calculations & analysis for financial indicators
Assumption
Name of the Technology Stenter Machine (6 Chambers)
Rated Capacity 6 Chambers
Details Unit Value Basis
Installed Capacity Meters per day 50000
Proposed Investment
Plant & Machinery ` (in lakh) 56.00
Erection & Commissioning ` (in lakh) 0.56
Total Investment ` (in lakh) 56.56
Financing pattern
Own Funds (Equity) ` (in lakh) 14.14 Feasibility Study
Loan Funds (Term Loan) ` (in lakh) 42.42 Feasibility Study
Loan Tenure years 5 Assumed
Moratorium Period Months 6 Assumed
Repayment Period Months 66 Assumed
Interest Rate % 10.00 SIDBI Lending rate
Estimation of Costs
O & M Cost % on Plant & Equip 4 Feasibility Study
Annual Escalation % 5 Feasibility Study
Estimation of Revenue
Power Saving KWh 403200
Cost `/KWh 5.6
St. line Depn. %age 5.28 Indian Companies Act
IT Depreciation %age 80.00 Income Tax Rules
Income Tax %age 33.99 Income Tax
Estimation of Interest on Term Loan (`̀̀̀ in lakh)
Years Opening Balance Repayment Closing Balance Interest
1 42.42 3.90 38.52 3.81 2 38.52 7.80 30.72 3.50
3 30.72 8.30 22.42 2.74
4 22.42 8.80 13.62 1.88
5 13.62 9.10 4.52 0.97
6 4.52 4.52 0.00 0.13
42.42
WDV Depreciation
Particulars / years 1 2
Plant and Machinery
Cost 56.56 11.31
Depreciation 45.25 9.05
WDV 11.31 2.26

Stenter Machine (6 Chamber)
20
Projected Profitability
Particulars / Years 1 2 3 4 5 6 7 8
Revenue through Savings
Power savings 22.58 22.58 22.58 22.58 22.58 22.58 22.58 22.58
Total Revenue (A) 22.58 22.58 22.58 22.58 22.58 22.58 22.58 22.58
Expenses
O & M Expenses 2.26 2.38 2.49 2.62 2.75 2.89 3.03 3.18
Total Expenses (B) 2.26 2.38 2.49 2.62 2.75 2.89 3.03 3.18
PBDIT (A)-(B) 20.32 20.20 20.08 19.96 19.83 19.69 19.55 19.40
Interest 3.81 3.50 2.74 1.88 0.97 0.13 - -
PBDT 16.50 16.71 17.35 18.08 18.86 19.56 19.55 19.40
Depreciation 2.99 2.99 2.99 2.99 2.99 2.99 2.99 2.99
PBT 13.52 13.72 14.36 15.09 15.88 16.57 16.56 16.41
Income tax - 2.60 5.90 6.15 6.41 6.65 6.64 6.59
Profit after tax (PAT) 13.52 11.12 8.46 8.95 9.46 9.92 9.92 9.82
Computation of Tax `̀̀̀ (in lakh)
Particulars / Years 1 2 3 4 5 6 7 8
Profit before tax 13.52 13.72 14.36 15.09 15.88 16.57 16.56 16.41
Add: Book depreciation 2.99 2.99 2.99 2.99 2.99 2.99 2.99 2.99
Less: WDV depreciation 45.25 9.05 - - - - - -
Taxable profit (28.74) 7.66 17.35 18.08 18.86 19.56 19.55 19.40
Income Tax - 2.60 5.90 6.15 6.41 6.65 6.64 6.59
Projected Balance Sheet
`̀̀̀ (in lakh)
Particulars / Years 1 2 3 4 5 6 7 8
Liabilities
Share Capital (D) 14.14 14.14 14.14 14.14 14.14 14.14 14.14 14.14
Reserves & Surplus (E) 13.52 24.64 33.10 42.05 51.51 61.43 71.35 81.17
Term Loans (F) 38.52 30.72 22.42 13.62 4.52 0.00 0.00 0.00
Total Liabilities D)+(E)+(F) 66.18 69.50 69.66 69.81 70.17 75.57 85.49 95.17
Assets
Gross Fixed Assets 56.56 56.56 56.56 56.56 56.56 56.56 56.56 56.56
Less: Accm. Depreciation 2.99 5.97 8.96 11.95 14.93 17.92 20.90 23.89
Net Fixed Assets 53.57 50.59 47.60 44.61 41.63 38.64 35.66 32.67
Cash & Bank Balance 12.60 18.91 22.06 25.19 28.54 36.93 49.84 62.50
Total Assets 66.18 69.50 69.66 69.81 70.17 75.57 85.49 95.17
Net Worth 27.66 38.78 47.24 56.19 65.65 75.57 85.49 95.31
Dept equity ratio 2.72 2.17 1.59 0.96 0.32 0.00 0.00 0.00

Stenter Machine (6 Chamber)
21
Projected Cash Flow: ` ` ` ` (in lakh)
Particulars / Years 0 1 2 3 4 5 6 7 8
Sources
Share Capital 14.14 - - - - - - - -
Term Loan 42.42
Profit After tax 13.52 11.12 8.46 8.95 9.46 9.92 9.92 9.82
Depreciation 2.99 2.99 2.99 2.99 2.99 2.99 2.99 2.99
Total Sources 56.56 16.50 14.10 11.45 11.93 12.45 12.91 12.90 12.80
Application
Capital Expenditure 56.56
Repayment of Loan - 3.90 7.80 8.30 8.80 9.10 4.52 0.00 0.00
Total Application 56.56 3.90 7.80 8.30 8.80 9.10 4.52 0.00 0.00
Net Surplus - 12.60 6.30 3.15 3.13 3.35 8.39 12.90 12.80
Add: Opening Balance - - 12.60 18.91 22.06 25.19 28.54 36.93 49.84
Closing Balance - 12.60 18.91 22.06 25.19 28.54 36.93 49.84 62.64
Calculation of Internal Rate of Return
` ` ` ` (in lakh) Particulars / months 0 1 2 3 4 5 6 7 8
Profit after Tax 13.52 11.12 8.46 8.95 9.46 9.92 9.92 9.82
Depreciation 2.99 2.99 2.99 2.99 2.99 2.99 2.99 2.99
Interest on Term Loan 3.81 3.50 2.74 1.88 0.97 0.13 - -
Cash outflow (56.56) - - - - - - - -
Net Cash flow (56.56) 20.32 17.60 14.19 13.81 13.42 13.04 12.90 12.80
IRR 22.48%
NPV 24.48
Break Even Point ` ` ` ` (in lakh)
Particulars / Years 1 2 3 4 5 6 7 8
Variable Expenses
Oper. & Maintenance Exp (75%) 1.70 1.78 1.87 1.96 2.06 2.17 2.27 2.39
Sub Total (G) 1.70 1.78 1.87 1.96 2.06 2.17 2.27 2.39
Fixed Expenses
Oper. & Maintenance Exp (25%) 0.57 0.59 0.62 0.65 0.69 0.72 0.76 0.80 Interest on Term Loan 3.81 3.50 2.74 1.88 0.97 0.13 0.00 0.00
Depreciation (H) 2.99 2.99 2.99 2.99 2.99 2.99 2.99 2.99 Sub Total (I) 7.36 7.08 6.35 5.52 4.64 3.84 3.74 3.78
Sales (J) 22.58 22.58 22.58 22.58 22.58 22.58 22.58 22.58
Contribution (K) 20.88 20.80 20.71 20.61 20.52 20.41 20.31 20.19
Break Even Point (L= G/I) 35.27% 34.03% 30.66% 26.79% 22.62% 18.83% 18.44% 18.73%
Cash Break Even {(I)-(H)} 20.97% 19.67% 16.24% 12.30% 8.07% 4.20% 3.73% 3.94%
Break Even Sales (J)*(L) 7.96 7.68 6.92 6.05 5.11 4.25 4.16 4.23
Return on Investment ` ` ` ` (in lakh)

Stenter Machine (6 Chamber)
22
Particulars / Years 1 2 3 4 5 6 7 8 Total
Net Profit Before Taxes 13.52 13.72 14.36 15.09 15.88 16.57 16.56 16.41 122.11
Net Worth 27.66 38.78 47.24 56.19 65.65 75.57 85.49 95.31 491.89
24.82%
Debt Service Coverage Ratio `̀̀̀ (in lakh)
Particulars / Years 1 2 3 4 5 6 7 8 Total
Cash Inflow
Profit after Tax 13.52 11.12 8.46 8.95 9.46 9.92 9.92 9.82 61.43
Depreciation 2.99 2.99 2.99 2.99 2.99 2.99 2.99 2.99 17.92
Interest on Term Loan 3.81 3.50 2.74 1.88 0.97 0.13 0.00 0.00 13.03
Total (M) 20.32 17.60 14.19 13.81 13.42 13.04 12.90 12.80 92.38
Debt
Interest on Term Loan 3.81 3.50 2.74 1.88 0.97 0.13 0.00 0.00 13.03
Repayment of Term Loan 3.90 7.80 8.30 8.80 9.10 4.52 0.00 0.00 42.42
Total (N) 7.71 11.30 11.04 10.68 10.07 4.65 0.00 0.00 55.45
2.63 1.56 1.29 1.29 1.33 2.80 0.00 0.00 1.67
Average DSCR (M/N) 1.67

Stenter Machine (6 Chamber)
23
Annexure 5: Details of procurement and implementation plan with schedule/timelines
Project Implementation Schedule – Stenter Machines
S. No. Activities
weeks
1 2 3 4 5 6 7 8
1 Placement of order and design
finalization
2 Fabrication works
3 Erection and Commissioning
4 trial runs
Process down Time
S. No.
Activities
Weeks
1 2 3 4 5 6 7 9
1 Dismantling of the Existing stenter
2 Commissioning
3 Trial runs
Note : However, the process down time is considered for two weeks

Stenter Machine (6 Chamber)
24
Annexure 6: Details of technology/equipment and service providers
Equipment details Source of
technology Service/technology providers
Energy Efficient Stenter Indigenous
Lucy Engineering Works Pvt Ltd
Plot No.5915, Road No.59, GIDC Estate, Sachin
District : Surat 394 230
Phone No.0261 2398850, 2398851
Fax No.0261 2398852
email::[email protected]
Web::www.lucyengineering.com

Stenter Machine (6 Chamber)
25
Annexure 7: Quotations or Techno-commercial bids for new technology/equipment

Stenter Machine (6 Chamber)
26

Stenter Machine (6 Chamber)
27

Stenter Machine (6 Chamber)
28

Stenter Machine (6 Chamber)
29

Stenter Machine (6 Chamber)
30

Stenter Machine (6 Chamber)
31

Stenter Machine (6 Chamber)
32

Bureau of Energy Efficiency (BEE) (Ministry of Power, Government of India) 4th Floor, Sewa Bhawan, R. K. Puram, New Delhi – 110066 Ph.: +91 – 11 – 26179699 (5 Lines), Fax: +91 – 11 – 26178352
Websites: www.bee-india.nic.in, www.energymanagertraining.com
Zenith Energy Services Pvt. Ltd 10-5-6/B, My Home Plaza, Masab Tank HYDERABAD, AP 500 028 Phone: 040 23376630, 31, Fax No.040 23322517
Website: www.zenithenergy.com
India SME Technology Services Ltd DFC Building, Plot No.37-38, D-Block, Pankha Road, Institutional Area, Janakpuri, New Delhi-110058 Tel: +91-11-28525534, Fax: +91-11-28525535 Website: www.techsmall.com


![TEXTILE MACHINE RY - · PDF filetextile machine ry. textile machine ry [1] [2] [3] textile machine ry. textile machinery. quattro . ran tee . vib0. system . created date: 8/30/2011](https://static.fdocuments.net/doc/165x107/5a6ffc397f8b9a98538b8d88/textile-machine-ry-biancalaniwwwbiancalanicomairoengpdfpdf.jpg)