Tara’s Project: Short Shelter Home for Women Bhilwara, Rajasthan.

RAJASTHAN AGRICULTURAL
COMPETITIVENESS PROJECT
Detailed Project Report on Cold
Store
Prepared by:
AGRI BUSINESS PROMOTION FACILITY

Rajasthan Agricultural Competitiveness Project 1
Chapter 1- Introduction to Cold Chain in India 4
Chapter 2-Rajasthan Scenario 16
Chapter 3-Proposed Technology 18
Chapter 4- Business Model 19
Contents

Rajasthan Agricultural Competitiveness Project 2
Figure 1: Post harvest Supply Chain ........................................................................................................ 4 Figure 2: Fruits and Vegetable Production in India .................................................................................. 7 Figure 3: Commodity wise distribution of cold storage ............................................................................. 9 Figure 4: Growth of the Indian Cold Chain Industry ................................................................................10 Figure 5: Drivers of Food Processing Industry ........................................................................................13 Figure 6: Challenges for Cold Chain .......................................................................................................13

Rajasthan Agricultural Competitiveness Project 3
Table 1: Trends for losses ........................................................................................................................ 5 Table 2: Categorizing the Product Temperature, Product Mix and Temperature Change ........................ 6 Table 3: State wise & Agency wise distribution of Cold Storage as on 2017 ............................................ 8 Table 4: Gap Analysis of Cold-chain Infrastructure in India .....................................................................11 Table 5: State-wise breakup of cold-chain infrastructure requirement.....................................................11 Table 6: Vegetable Production Analysis ..................................................................................................16 Table 7: Fruit Production Analysis ...........................................................................................................16 Table 8: Assumptions for Operating Capacity .........................................................................................19 Table 9: Project Cost Summary ..............................................................................................................19 Table 10: Means of Finance Summary....................................................................................................20 Table 11: Civil Cost Summary .................................................................................................................20 Table 12: Utilities and Mis Fixed Assets Summary..................................................................................21 Table 13: Plant and Machinery ................................................................................................................21 Table 14: Income Statement ...................................................................................................................22 Table 15: Balance Sheet .........................................................................................................................23

Rajasthan Agricultural Competitiveness Project 4
India ranks as the second largest producer, after China, of horticulture crops and fruits
in the world. The country produces over 285 million metric ton of horticulture crops on
around 2.5 crore hectare land. One the back of diverse agro-climatic zones in India,
the production of many crops not only extends in quantity, but also to a wide variety of
them.
Despite one of the largest producer, the country is also amongst the leading nations in
terms of food loss, even though a sizeable share of the population is suffering from
hunger and malnutrition. The economic situation of farmers is not really good in terms
of the realisation of the output produced by them which is very different to farmers in
the developed countries. The key reasons driving the huge volume of wastages are
poor post-harvest system, inefficient supply chains, lack of proper storage and
processing infrastructure.
The typical value chain from farm to end consumer involves the practices of
Aggregation to concentrate the produce at one location, maintenance of temperature
by bringing in the process of pre-cooling, preservation of shelf life through apt storing
practices followed by distribution and reaching the consumer.
Figure 1: Post harvest Supply Chain
Source: GT analysis
Cold chain is a logistic system that provides a series of facilities for ensuring ideal
storage conditions for perishable products from the point of production to the point of
consumption in the food supply chain. The cycle originates from the farm level where
the production takes place and goes till the consumer level. A well-organized cold
chain reduces spoilage, retains the quality of the harvested products and guarantees
Aggregation and Pre Cooling
Reefer Transport
Cold Storage DistributionMerchandising
with End Consumer
Chapter 1- Introduction to Cold
Chain in India

Rajasthan Agricultural Competitiveness Project 5
a cost efficient delivery to the consumer. Perishable and edible products deteriorate
on parameters of quality upon improper storage facilities.
The trends given below highlight the prevailing losses in various categories of
products:
Table 1: Trends for losses
Type of crops % of Losses
Fruits and Vegetables 5.8 to 18.0%
Cereals 3.9 to 6.0%
Milk 0.5 to 1.0%
Pulses 4.3 to 6.1%
Oilseeds 2.8 to 10.1%
Mean & Poultry 2.3 to 4.0%
Inland & Marine Fisheries 2.9 to 6.9%
Source; GT analysis
The Key benefits of a proper cold store infrastructure
Quality: Maintaining the refrigerated conditions after processing or freezing
slowing down the respiration rate, reducing transpiration, lowering microbial
activity etc. and thus reduces the rate of deterioration.
Availability: The application of the appropriate cold chain components
provides flexibility by making it possible to market products at the optimum time
by increasing the product life of fresh foods for days, weeks or even months
Affordability: The cold chain beings’ affordability by normalising the price of
crops throughout the year through the holistic development of integrated cold-
chain. It holds the key to reducing post-harvest losses, ensuring uninterrupted
supply and thereby minimizing food inflation.
Accessibility: The cold-chain helps crop growers to reach beyond their
production market. It empowers them with the ability to capture a larger buyer
base and helps to bring their harvest to more valuable end use. Increasing the
cold chain network is a key solution to fulfil the existing gap and strengthen
these supply chains.
Temperatures maintained in cold chain storage facilities may be divided into two
categories:
Refrigerated Temperature: Refrigerated temperatures are typically those
above 0- degree C (32oF).
Frozen Temperature: Frozen temperatures those lower than 0-degree C.
Rajasthan Agricultural Competitiveness Project 6
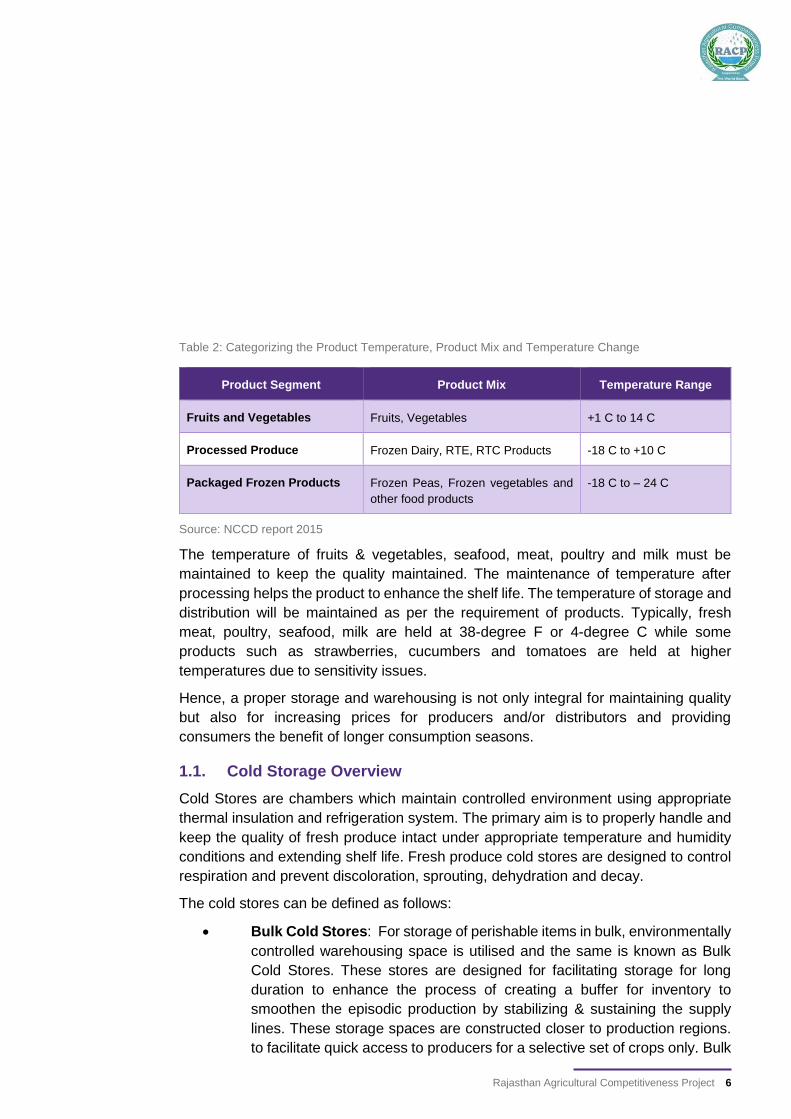
Table 2: Categorizing the Product Temperature, Product Mix and Temperature Change
Product Segment Product Mix Temperature Range
Fruits and Vegetables Fruits, Vegetables +1 C to 14 C
Processed Produce Frozen Dairy, RTE, RTC Products -18 C to +10 C
Packaged Frozen Products Frozen Peas, Frozen vegetables and
other food products
-18 C to – 24 C
Source: NCCD report 2015
The temperature of fruits & vegetables, seafood, meat, poultry and milk must be
maintained to keep the quality maintained. The maintenance of temperature after
processing helps the product to enhance the shelf life. The temperature of storage and
distribution will be maintained as per the requirement of products. Typically, fresh
meat, poultry, seafood, milk are held at 38-degree F or 4-degree C while some
products such as strawberries, cucumbers and tomatoes are held at higher
temperatures due to sensitivity issues.
Hence, a proper storage and warehousing is not only integral for maintaining quality
but also for increasing prices for producers and/or distributors and providing
consumers the benefit of longer consumption seasons.
1.1. Cold Storage Overview
Cold Stores are chambers which maintain controlled environment using appropriate
thermal insulation and refrigeration system. The primary aim is to properly handle and
keep the quality of fresh produce intact under appropriate temperature and humidity
conditions and extending shelf life. Fresh produce cold stores are designed to control
respiration and prevent discoloration, sprouting, dehydration and decay.
The cold stores can be defined as follows:
Bulk Cold Stores: For storage of perishable items in bulk, environmentally
controlled warehousing space is utilised and the same is known as Bulk
Cold Stores. These stores are designed for facilitating storage for long
duration to enhance the process of creating a buffer for inventory to
smoothen the episodic production by stabilizing & sustaining the supply
lines. These storage spaces are constructed closer to production regions.
to facilitate quick access to producers for a selective set of crops only. Bulk

Rajasthan Agricultural Competitiveness Project 7
Cold Stores are generally used for storage of a single commodity, which
mostly operates on a seasonal basis e.g. stores for Potato, Chilies, and
Apples etc.
Multi-purpose Cold Stores: This infrastructure comprises of warehousing
space to function as a distribution hub with multiple temperature zones.
This structure is designed for short term handling of products as to serve
as a distribution logistics platform for market ready packaged produce and
ready to retail products. These spaces are utilised for things that are
produced round the year. The products stored in these types of cold stores
are seasonal fruits, vegetables, dry fruits, spices, pulses, milk products etc.
Small Cold Stores: These spaces have pre- cooling facility for fresh and
export oriented items with major concentration of units in Maharashtra and
a trend picking up in Karnataka, Andhra Pradesh and Gujarat.
Fresh food stores: These units facilitate both growth of frozen food sector
as well as promotion of the same in domestic and export market. This
comprise of items with or without processing and freezing facility for fish,
meat, poultry, dairy products and processed fruits and vegetables.
1.2. National Scenario of Cold Chain Infrastructure
The demand for the cold chain infrastructure can be derived from the factors
mentioned in the section.
Figure 2: Fruits and Vegetable Production in India
Source- GT Analysis and NHB
The estimated positive trajectory of fruits and vegetable production highlights
increased production and currently, India is the 2nd largest producers of horticulture
crops globally. The increased production faces the impediment of wastage and the
271,090,000
275,568,000
276,417,000
2016-2017 2017-2018 2017-2018
Pro
du
ctio
n in
M.T
Year
Fruits and Vegetable Production

Rajasthan Agricultural Competitiveness Project 8
population encounters limited availability of the production. Not only does it contribute
to losses for almost one third of the total production but also it affects the quality of
final product that reaches the final consumer. Hence, this establishes the demand for
investment in the infrastructure of Cold Chain.
There are nearly 7645 cold storages of approximate size of over 34.95 million MT in
2017. Cold storage capacity in India has grown 1.2x times during 2012 to 2017. It has
been noted that over one third of these cold storages in India have capacity below
1,000 MT. Nearly 60% of the total cold storage capacity is concentrated in the states
of Uttar Pradesh and West Bengal, wherein a majority of the cold storages are for a
single commodity - Potato.
The region and commodity wise distribution of cold storages across India is depicted
in the chart mentioned below:
Table 3: State wise & Agency wise distribution of Cold Storage as on 2017
Sr. No. Name of the State Total Number
of Storage
Capacity (MT)
1 Andaman & Nicobar Islands (UT) 3 810
2 Andhra Pradesh & Telangana 442 1,782,561
3 Arunachal Pradesh 2 6,000
4 Assam 36 157,906
5 Bihar 306 1,415,595
6 Chandigarh (UT) 7 12,462
7 Chhattisgarh 98 484,087
8 Delhi 97 129,857
9 Goa 29 7,705
10 Gujarat 764 2,901,807
11 Haryana 338 749,830
12 Himachal Pradesh 66 131,017
13 Jammu & Kashmir 38 112,516
14 Jharkhand 58 236,680
15 Karnataka 198 560,178
16 Kerala 198 80,405
17 Lakshadweep (UT) 1 15
18 Madhya Pradesh 300 1,263,665
19 Maharashtra 604 978,392
20 Manipur 2 5,500

Rajasthan Agricultural Competitiveness Project 9
21 Meghalaya 4 8,200
22 Mizoram 3 4,001
23 Nagaland 4 7,350
24 Orissa 171 540,141
25 Pondicherry (UT) 3 85
26 Punjab 660 2,155,704
27 Rajasthan 166 555,278
28 Sikkim 2 2,100
29 Tamil Nadu 174 337,625
30 Tripura 14 45,477
31 Uttar Pradesh 2299 14,176,062
32 Uttarakhand 46 160,419
33 West Bengal 512 5,947,561
Total 7645 34,956,991
Source: National Horticulture Board (NHB)
However, further capacity is required to be built in these states as well as other parts
of the country. 80% of the total cold storages in India are single commodity based
(mainly potatoes), 5% are processed food, 5% are Horticulture crops, 3% are Marine
and Meat product’s, commodity wise distribution of cold storage uses in India given in
below figure:
Figure 3: Commodity wise distribution of cold storage
Source: Secondary sources, GT analysis
India's integrated cold chain industry - a combination of surface storage and
refrigerated transport - has been growing at a CAGR of 27% for the last three years.
The cold chain market in India was valued at around INR 624 Billion 2017. The growth
Potato 80%
Pharma Products7%
Processed foods5%
Horticulture crops5%
Marine and Meat products
3%

Rajasthan Agricultural Competitiveness Project 10
in cold chain in India has been largely driven by the growth in organized retail, the fast
food market, food processing industry and e-commerce industry.
Figure 4: Growth of the Indian Cold Chain Industry
Source: Secondary sources, GT analysis
The cold storage market in India is highly fragmented with over 3500 players, 95% of
which are private operators, in the unorganized sector and around 30 players in the
organized sector. More than 7,500 cold storages are operating in India, out of which
50% are located in Uttar Pradesh, Gujarat and West Bengal. A large number of cold
chains are of small sizes and offer standalone storage solutions. It is estimated that
~5,000 cold storages which existed before 2004 offers standalone cold storage
services without pack houses or any other ancillary units. In addition, over one third of
the total existing cold storages in the country have less than 1,000 metric tonnes of
capacity.
Cold chain infrastructure comprises of cold storage infrastructure, transport
infrastructure and point of production infrastructure. Majority revenue contributors in
cold chain industry are storage infrastructure. Refrigerated transport or cold chain
distribution is still in its nascent stage in India and is way behind if compared to world
standards for cargo movement. More than 100 MMT of perishable produce is
transported across India annually, only 4 MMT is transported via reefers.
1.3. The Need of an Hour
98 115 134175
228
298
389
497624
1720
2326
2933
37
42
47
0
5
10
15
20
25
30
35
40
45
50
0
100
200
300
400
500
600
700
2009 2010 2011 2012 2013 2014 2015 2016 2017
Growth of Indian Cold Chain Industry
INR billion Million Tonne

Rajasthan Agricultural Competitiveness Project 11
The table below highlights the gaps in the Indian cold chain infrastructure scenario
considering the existing infrastructure already created in the country the estimated
requirement.
Table 4: Gap Analysis of Cold-chain Infrastructure in India
Sources: Compilation of data from APEDA, DMI, MFPI, NCCD, MIDH
Developing appropriate business models with suitable infrastructure should revolve
around flow of goods on the basis of per capita consumption at population centres,
linked to distance from identified producing districts, categorized by temperature
ranges (under frozen, chill, mild-chill), segmented by bulk long term storage or short
transitory supply chain and scope of reverse logistics.
Although there has been a consistent growth in the development of cold store
infrastructure in the country, there is still a huge gap still for efficient preservation of
produce. The state wise break up of cold store infrastructure requirement in the country
can be seen in the table below:
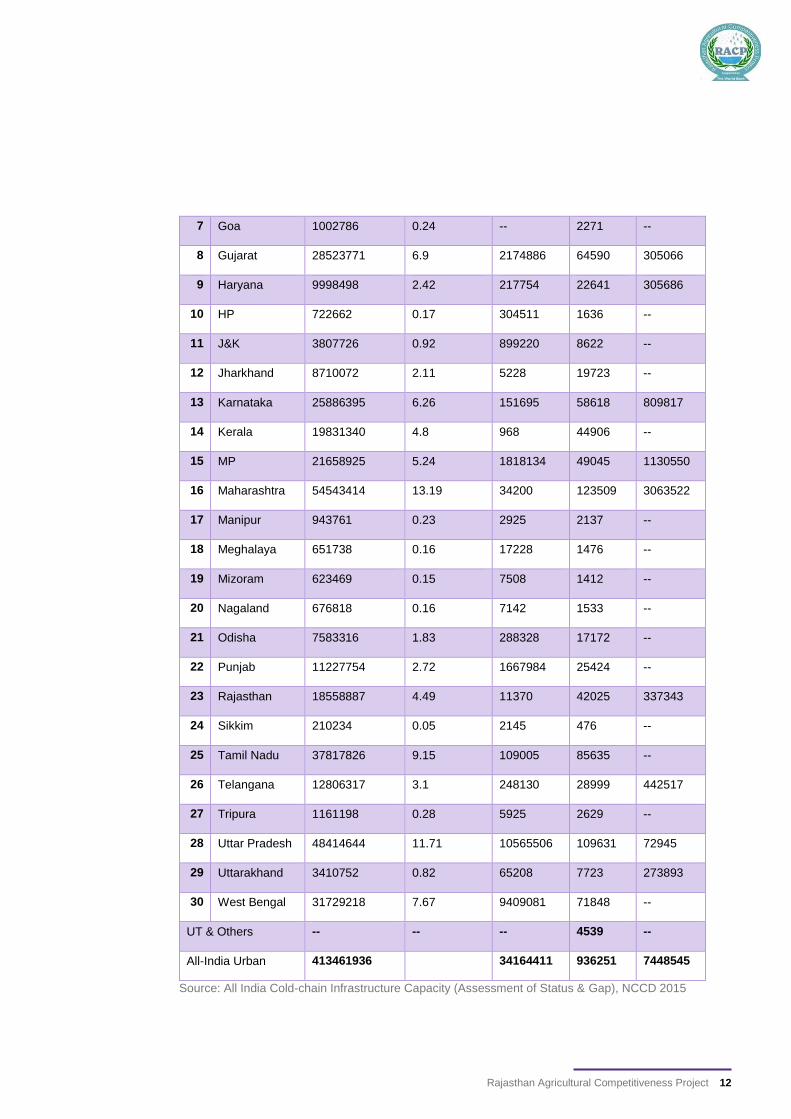
Table 5: State-wise breakup of cold-chain infrastructure requirement
# State/UTs Urban
Population
2014-15
% Share
Population
CS Bulk
(MT)
CS Hub
(MT)
Onion
Storage
(MT)
1 Andhra
Pradesh
18428602 4.46 489195 41730 551273
2 Arunachal 354419 0.09 6705 803 --
3 Assam 4774459 1.15 61185 10811 --
4 Bihar 13008947 3.15 5094524 29458 155936
5 Chhattisgarh 6670958 1.61 498724 15106 --
6 Delhi 17718674 4.29 -- 40122 --
Type of Infrastructure Pack-house
(No.)
Cold Storage
(Bulk – MT)
Cold Storage
(Hub - MT)
Reefer
Vehicles (No.)
Ripening
Chamber (No.)
All India Requirement
(A)
70,080 341,64,411 9,36,251 61,826 9,131
All India Created (B) 249 3,18,23,700 9,000 812
All India Gap (A-B) 69,831 32,76,962 52,826 8,319
Rajasthan Agricultural Competitiveness Project 12
7 Goa 1002786 0.24 -- 2271 --
8 Gujarat 28523771 6.9 2174886 64590 305066
9 Haryana 9998498 2.42 217754 22641 305686
10 HP 722662 0.17 304511 1636 --
11 J&K 3807726 0.92 899220 8622 --
12 Jharkhand 8710072 2.11 5228 19723 --
13 Karnataka 25886395 6.26 151695 58618 809817
14 Kerala 19831340 4.8 968 44906 --
15 MP 21658925 5.24 1818134 49045 1130550
16 Maharashtra 54543414 13.19 34200 123509 3063522
17 Manipur 943761 0.23 2925 2137 --
18 Meghalaya 651738 0.16 17228 1476 --
19 Mizoram 623469 0.15 7508 1412 --
20 Nagaland 676818 0.16 7142 1533 --
21 Odisha 7583316 1.83 288328 17172 --
22 Punjab 11227754 2.72 1667984 25424 --
23 Rajasthan 18558887 4.49 11370 42025 337343
24 Sikkim 210234 0.05 2145 476 --
25 Tamil Nadu 37817826 9.15 109005 85635 --
26 Telangana 12806317 3.1 248130 28999 442517
27 Tripura 1161198 0.28 5925 2629 --
28 Uttar Pradesh 48414644 11.71 10565506 109631 72945
29 Uttarakhand 3410752 0.82 65208 7723 273893
30 West Bengal 31729218 7.67 9409081 71848 --
UT & Others -- -- -- 4539 --
All-India Urban 413461936 34164411 936251 7448545
Source: All India Cold-chain Infrastructure Capacity (Assessment of Status & Gap), NCCD 2015

Rajasthan Agricultural Competitiveness Project 13
1.4. Growth Drivers
The key drivers for growth of the cold chain sector in India are mentioned in the
diagram below:
Figure 5: Drivers of Food Processing Industry
Source- GT Analysis
1.5. Major Challenges for the development of Cold Chain Industry
In India, the agri-supply chain is poorly integrated, posing challenges at each step.
There are huge gaps in the system, both in terms of capacity and integration. Critical
linkages like reefer transport are almost non-existent. Despite the obvious need for
improvement and new government initiatives to stimulate growth, private investment
is in short supply for some of the following reasons:
Figure 6: Challenges for Cold Chain
Government
Support
Growth in the sector of food
processing
Growth of organised
retail
Support from government for
grants and schemes that bring
in fiscal and subsidy incentives
aid growth for the sector.
Fast paced westernised culture
with urbanisation and rise in
disposable incomes aid this
sector bringing in cold chain for
ensuring longer shelf life for
Acceptance of frozen food
products and increase in
income levels facilitate the
organized sector and brings in
acceptance for frozen food
products.

Rajasthan Agricultural Competitiveness Project 14
Source- GT Analysis
Lack of knowhow and trained manpower: Despite the increasing number of
infrastructure projects, there is a severe lack of manpower with appropriate and
upgraded skills to handle modern technology;
Lack of backward & forward linkages to supplement cold chain – Cold chain
in itself is not a complete solution to address quality and marketability issues
concerning perishable products. The commodities which are transported and
stored in the cold chain should have enough market value to absorb the added
cost to make the endeavour worth the cost incurred.
Lack of trust concerning viability of cold chain projects: Cold chain projects
are still seen by investors as high on capital, low on volume and requiring a long
payback period for the investment. Cold chain projects also involve aggressive
marketing and investment on backward and forward linkages. This, coupled with a
dearth of successful demonstration projects in the sector is keeping potential
investors away
High capital investment – As noted above, a high level of capital is required at
the initial stage of building a high-end cold chain facility, thus reducing the
attractiveness of this type of investment. The lack of institutional investors has not
helped to improve the sector. The result, to date, has been a disorganized
approach to establishment of a truly efficient cold chain network of facilities and
transportation companies;
High operational costs due to high cost of power – Unlike the agricultural sector
which is offered highly subsidized power tariffs by the Government of India, the
cold chain industry does not enjoy this status and is instead subjected to industrial
power tariffs. This significantly increases the operational cost for cold chain
operators and act as a major deterrent for growth;
Lack of knowhow and trained manpower
Lack of backward & forward linkages to
supplement cold chain
Lack of trust concerning viability
of cold chain projects
High capital investment
High operational costs due to high
cost of
Problems of optimization in reefer transport

Rajasthan Agricultural Competitiveness Project 15
Problems of optimization in reefer transport – Lack of two-way cargo
movement/ back haulage, interstate barriers, intercity/state taxes, and bad roads
are some of the issues which increase operating costs, delay timely deliveries and
reduce the efficient utilization of fleets.

Rajasthan Agricultural Competitiveness Project 16
The total production of horticulture crops in Rajasthan is 43,24,249 M. T by utilising the area of 12,14,812 hectares.The analysis of the production profile for vegetables is given below concluding with key crops being highlighted as Onion, Potato and Tomato comprising of 63.4%, 12.9% and 5% of share in total vegetable production.
Table 6: Vegetable Production Analysis
Crop Production
(MT) % Share in Total Veg.
Yield (Prod MT/ Area Ha)
AREA (Ha)
% Share in Total Veg.
Rajasthan as % of India (%)
Onion 1,149,291 63.4% 18.4 62,499 36.7% 6.9%
Potato 234,552 12.9% 16.1 20,366 12.0% 0.5%
Tomato 90,224 5.0% 4.4 14,552 8.6% 0.4%
Cauli flower 58,404 3.2% 5.3 13,831 8.1% 0.6%
Pea 36,375 2.0% 2.6 10,964 6.4% 0.7%
Brinjal 31,715 1.7% 5.4 5,881 3.5% 0.2%
Spinach 20,808 1.1% 4.9 5,514 3.2% 0.2%
Carrot 19,771 1.1% 5.3 4,673 2.7% 0.7%
Green Chilli 16,154 0.9% 2.9 4,274 2.5% 0.3%
Okra 15,379 0.8% 4.2 3,865 2.3% 0.2%
Total 92.3% 86.1%
Source: NHB 2016-17
After a glimpse of the vegetable profile, we further analyse the production of fruits in
the state of Rajasthan. Orange, Kinnow and Mango comprise the three key crops of
the state with 55.5%, 22.8%, 9.9% of the total vegetation respectively.
Table 7: Fruit Production Analysis
Crop Production
(MT) % Share in Total Veg.
Yield (Prod MT/ Area Ha)
AREA (Ha)
% Share in Total Veg.
Rajasthan as % of India (%)
Orange 496,950 55.5% 21.3 23,349 44.0% 4.1% (Citrus)
Kinnow 204,260 22.8% 21.4 9,547 18.0% 0.5%
Mango 88,837 9.9% 17.2 5,164 9.7% 0.4%
Guava 27,176 3.0% 6.5 4,171 7.9% 1.0%
Lime 16,659 1.9% 5.7 2,947 5.6% Citrus
Aonla 13,747 1.5% 8.6 2,857 5.4% 1.5%
Malta 12,816 1.4% 128.2 1,603 3.0% Citrus
Pomegranate 10,379 1.2% 3.6 743 1.4% 0.4%
Papaya 8,708 1.0% 11.7 695 1.3% 0.2%
Ber 4,697 0.5% 6.8 546 1.0% 1.6%
Total 98.7% 97.2%
Source: NHB 2016-17
The analyses of horticulture production of Rajasthan and the optimistic trajectory of
horticulture in India, we estimate the same growth for state of Rajasthan and the
increasing crop with lack of storage will be the obstacle the government will face. While
Chapter 2-Rajasthan Scenario
Rajasthan Agricultural Competitiveness Project 17
a segment of population starves, the wastage of food due to lack of proper
infrastructure is unaffordable for the country. For a better shelf life and preserved and
intact quality, the activity of bringing in the infrastructure of Cold Chain will curb the
losses and enhance the food availability and food security.
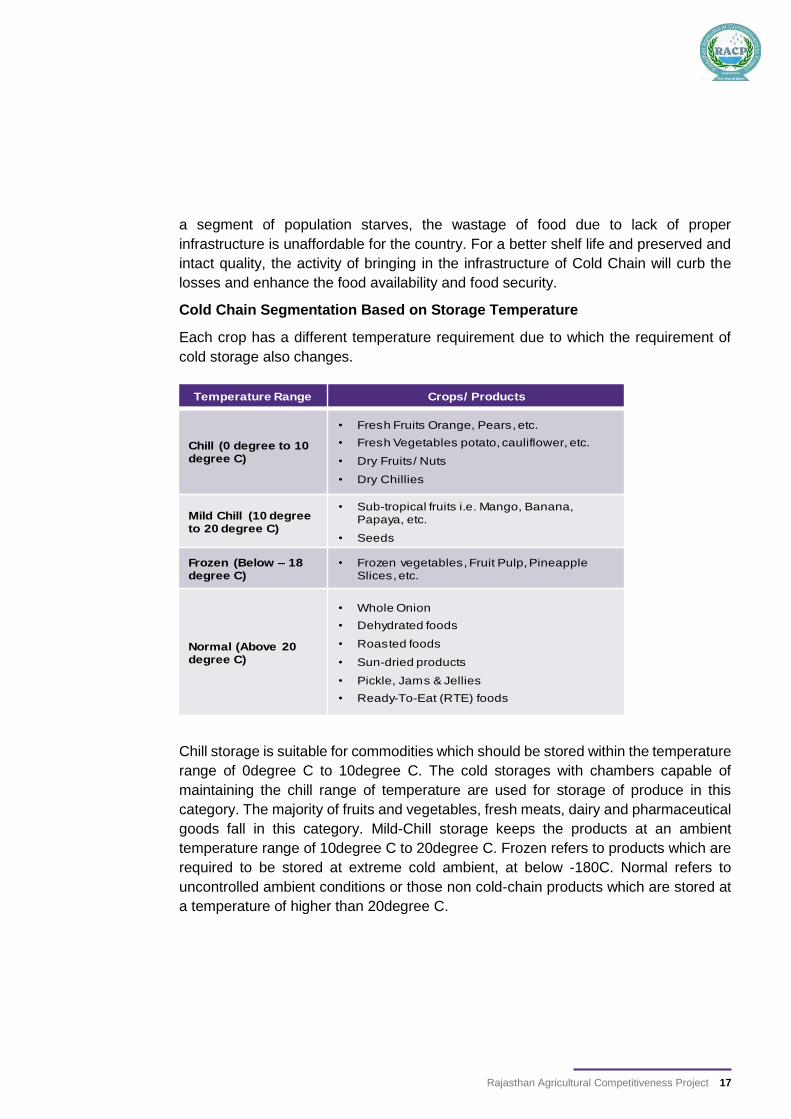
Cold Chain Segmentation Based on Storage Temperature
Each crop has a different temperature requirement due to which the requirement of
cold storage also changes.
Chill storage is suitable for commodities which should be stored within the temperature
range of 0degree C to 10degree C. The cold storages with chambers capable of
maintaining the chill range of temperature are used for storage of produce in this
category. The majority of fruits and vegetables, fresh meats, dairy and pharmaceutical
goods fall in this category. Mild-Chill storage keeps the products at an ambient
temperature range of 10degree C to 20degree C. Frozen refers to products which are
required to be stored at extreme cold ambient, at below -180C. Normal refers to
uncontrolled ambient conditions or those non cold-chain products which are stored at
a temperature of higher than 20degree C.
Temperature Range Crops/ Products
Chill (0 degree to 10 degree C)
• Fresh Fruits Orange, Pears, etc.
• Fresh Vegetables potato, cauliflower, etc.
• Dry Fruits/ Nuts
• Dry Chillies
Mild Chill (10 degree to 20 degree C)
• Sub-tropical fruits i.e. Mango, Banana, Papaya, etc.
• Seeds
Frozen (Below – 18 degree C)
• Frozen vegetables, Fruit Pulp, Pineapple Slices, etc.
Normal (Above 20 degree C)
• Whole Onion
• Dehydrated foods
• Roasted foods
• Sun-dried products
• Pickle, Jams & Jellies
• Ready-To-Eat (RTE) foods

Rajasthan Agricultural Competitiveness Project 18
We propose to install a cold storage infrastructure of around 500 MT which will be
utilized by the sorted and graded fruits and vegetables produced in the region.
Advantage of the facility: In context of agriculture, cold storages are large warehouse
buildings. In addition, the producer can store the bulk quantity of raw materials in a
reserve. Raw materials include all the agricultural produce. It works on the principle of
refrigeration. We use refrigerants in order to cool the warehouse. Mostly, it will in use
to store fruits and vegetables. The storehouse keeps them fresh for a period of time. It
will use them in order to decrease the post-harvest losses of economic produce.
Technology Description: A cold storage unit incorporates a refrigeration system to
maintain the desired environment for the commodities to be stored. A refrigeration
system works on two principles;
1. Vapour Absorption System (VAS).
2. Vapour Compression System (VCS).
The technology used in this project is the VCS with Fin coil type systems. This system
although slightly costlier is energy efficient with low operational cost and higher space
availability for storage of produce.
In a refrigeration system, refrigerants are used to absorb the heat from the stored
produce by evaporation at a lower temperature and pressure and release the heat by
condensation at a higher temperature and pressure in a condenser. The cooling
system in this project uses Ammonia as the refrigerant. The essential components of
refrigeration plant are the compressor, condenser, expansion valves, cooling tower
and cooling coils. The selection of plant and machinery i.e., compressor, condenser
and evaporator is based on the maximum cooling load during peak summer.
Following factors are considered while selecting the cooling equipment:
Heat transmission (conduction and radiation) through the structure.
Infiltration of air into the space during frequent opening of doors and fresh air
charge.
Heat emission from occupants.
Heat from fans, motors, lights etc.
Product load i.e., heat to be extracted from the stored produce.
The pull down time is considered as 24 Hrs. for freezer and 72hrs for chillers. Hot air
defrosting for freezer and hot water for chillers is proposed for the refrigeration system.
Chapter 3-Proposed Technology
Rajasthan Agricultural Competitiveness Project 19
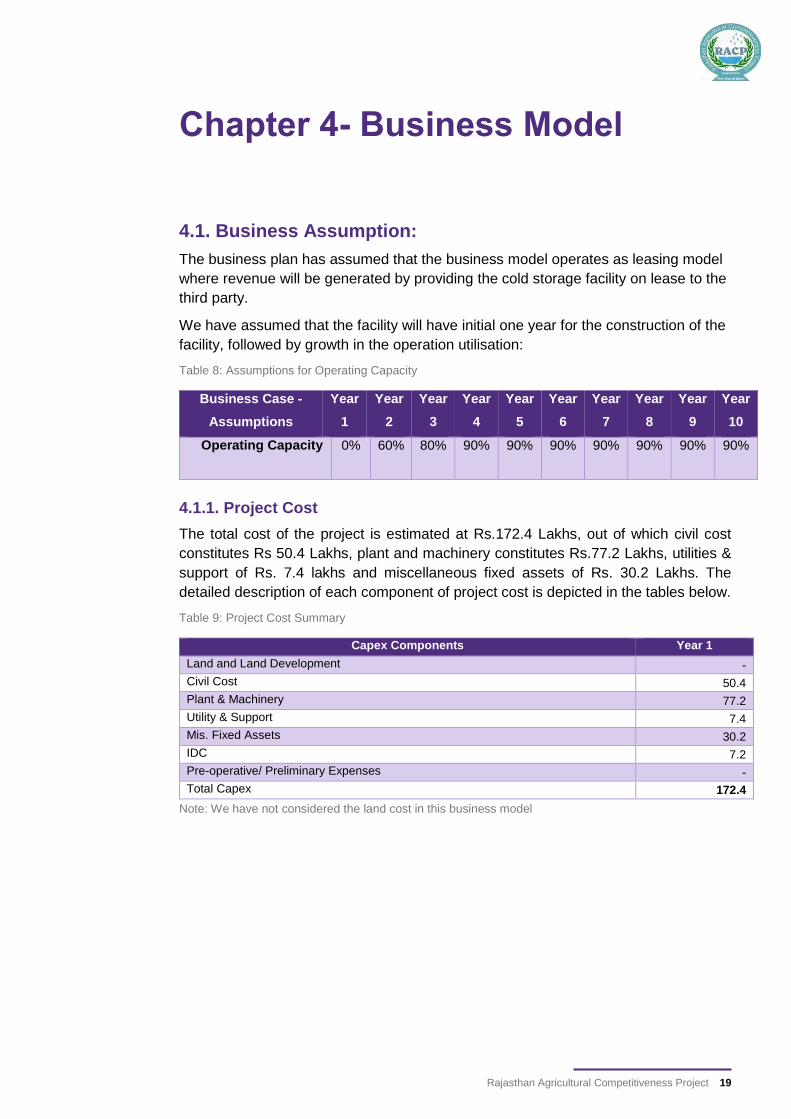
4.1. Business Assumption:
The business plan has assumed that the business model operates as leasing model
where revenue will be generated by providing the cold storage facility on lease to the
third party.
We have assumed that the facility will have initial one year for the construction of the
facility, followed by growth in the operation utilisation:
Table 8: Assumptions for Operating Capacity
Business Case -
Assumptions
Year
1
Year
2
Year
3
Year
4
Year
5
Year
6
Year
7
Year
8
Year
9
Year
10
Operating Capacity 0% 60% 80% 90% 90% 90% 90% 90% 90% 90%
4.1.1. Project Cost
The total cost of the project is estimated at Rs.172.4 Lakhs, out of which civil cost
constitutes Rs 50.4 Lakhs, plant and machinery constitutes Rs.77.2 Lakhs, utilities &
support of Rs. 7.4 lakhs and miscellaneous fixed assets of Rs. 30.2 Lakhs. The
detailed description of each component of project cost is depicted in the tables below.
Table 9: Project Cost Summary
Capex Components Year 1
Land and Land Development -
Civil Cost 50.4
Plant & Machinery 77.2
Utility & Support 7.4
Mis. Fixed Assets 30.2
IDC 7.2
Pre-operative/ Preliminary Expenses -
Total Capex 172.4
Note: We have not considered the land cost in this business model
Chapter 4- Business Model

Rajasthan Agricultural Competitiveness Project 20
4.1.2. Proposed Means of Finance
The promoter’s equity in the project is Rs. 86.2 Lakhs which is 50% per cent of the
total project cost. The term loan considered for the project is estimated at Rs. 86.2
Lakhs which is 50% of the total project cost.
Table 10: Means of Finance Summary
Means of Finance (INR Lacs) Year 1
Total Project Cost 172.4
Funding
Equity (Promoters Cost) 86.2
Debt 86.2
Total Funding Required 172.4
Note: We have not considered grant in aid being offered by National Horticulture Board or any other government entity/
institutions. Which may have an impact on the overall profitability of the project in a positive way.
4.1.3 Civil Work
The total cost of civil work has been estimated to be Rs 50.4 lakhs, which includes
technical civil work and non-technical civil work. Cost of civil work comprises of the
cost of process building, Raw material warehouse, Finished goods warehouse,
transformer house & Utility building. The total cost of technical civil works has been
arrived at on the basis of the estimates provided by the Chartered Engineer (Civil) and
are substantiated with the requisite certificate.
Table 11: Civil Cost Summary
Civil Cost Total Area Req (SQM)
Civil Cost (Per SQM)
GST Rate (%)
Total Civil Cost
(Lacs)
Cold Store 600 8,000 5.0% 50.4
Non-Core Area
Utilities and Support Infrastructure - 8,000 5.0% -
Other (Mis Area) - 8,000 5.0% -
Total Civil Cost 600 50.4
4.1.4 Utilities and Mis. Fixed Assets
The total cost of Utilities has been estimated to be Rs 7.4 lakhs, which includes water
storage of 20,000 LT, generator set of 80 KW and Weighing Scale of 500 KG. The total
expenditure towards miscellaneous fixed asset in estimated at Rs. 30.2 Lakhs which

Rajasthan Agricultural Competitiveness Project 21
comprises of 3,000 crates, 4 SS tables, 300 pallets to keep crates and 4 hand pallets
trucks.
Table 12: Utilities and Mis Fixed Assets Summary
Utility & Support Infrastructure Capacity (No. of Units)
Per Unit Cost (INR
Lacs)
Freight/ Other
Cost (%)
Taxes/ Duties
(%)
Overall Cost (INR
Lacs)
Transformer, Electrical Panels, Cable wire etc.
63 kva 3.0 1% 18% 3.6
Water Storage 20000Lit 0.2 1% 18% 0.2
Generator 80 KW 2 1% 18% 2.4
Weighing Scale 500 KG 1.0 1% 18% 1.2
Total Utility & Support 7.4
Mis Fixed Assets Quantity Per Unit Cost (INR
Lacs)
Freight/ Other
Cost (%)
Taxes/ Duties
(%)
Total Cost (INR
Lacs)
Crates (Rs. 275 per unit) 3000 0.0 1.0% 18.0% 9.8
SS TABLE (8*4*3 ss304) 4 0.3 1.0% 18.0% 1.2
Pallets (Rs. 2,100 per unit) 300 0.0 1.0% 18.0% 7.5
Racking System (Rs. 3,000 per unit) 300 0.0 1.0% 18.0% 10.7
Hand Pallets Trucks 4 0.2 1.0% 18.0% 1.0
Total Mis Fixed Assets 30.2
4.1.5. Plant and Machinery
The total cost of plant and machinery has been arrived on the basis of quotation
received from various suppliers of equipment and machinery. The total cost of P&M is
considered as Rs. 77.2 Lakhs (including IGST). The following table captures the
distribution of P&M and utilities.
Table 13: Plant and Machinery
Plant & Machinery Capacity Total Cost (Lacs)
Cold Store 500 MT 77.2
Total Cost 77.2

Rajasthan Agricultural Competitiveness Project 22
4.1.6 Income Statement
The below mentioned is the income statement for the cold storage infrastructure:
Table 14: Income Statement
INR Lacs Year 1 Year 2 Year 3 Year 4 Year 5 Year 6 Year 7 Year 8 Year 9 Year 10
Financial Snapshot - Income Statement
Revenue - 43.1 78.4 101.8 104.3 106.9 109.6 112.3 115.1 118.0
EBITDA - 14.7 40.9 58.7 59.4 60.3 60.9 61.8 62.4 63.2
Depreciation - 10.9 10.9 10.9 10.9 10.9 10.9 10.9 10.9 10.9
EBIT - 3.8 30.0 47.8 48.5 49.4 50.0 50.9 51.5 52.3
Interest Cost - 8.4 6.8 5.3 3.8 2.3 0.8 0.0 - -
EBT - (4.6) 23.2 42.5 44.7 47.0 49.2 50.9 51.5 52.3
Tax - - 6.8 12.4 13.0 13.7 14.3 14.8 15.0 15.2
PAT - (4.6) 16.4 30.1 31.7 33.3 34.9 36.0 36.5 37.1
Profitability Ratio (%)
Revenue Growth N/A 82.2% 29.7% 2.5% 2.5% 2.5% 2.5% 2.5% 2.5%
EBITDA Margin - 34.2% 52.2% 57.7% 57.0% 56.4% 55.6% 55.0% 54.2% 53.5%
EBIT Margin - 8.8% 38.3% 47.0% 46.5% 46.2% 45.6% 45.3% 44.7% 44.3%
EBT Margin - (10.6%) 29.6% 41.7% 42.8% 44.0% 44.9% 45.3% 44.7% 44.3%
PAT Margin - (10.6%) 20.9% 29.6% 30.4% 31.2% 31.8% 32.1% 31.7% 31.4%

Rajasthan Agricultural Competitiveness Project 23
4.1.7. Balance Sheet
The below mentioned is the balance sheet statement for the Low end waxing line:
Table 15: Balance Sheet
INR Lacs Year 1 Year 2 Year 3 Year 4 Year 5 Year 6 Year 7 Year 8 Year 9 Year 10
Shareholders’ Equity
Equity Share Capital 86.2 114.6 128.3 128.3 128.3 128.3 128.3 128.3 128.3 128.3
Reserves & Surplus - (4.6) 11.9 42.0 73.6 107.0 141.8 177.9 214.4 251.4
Quasi Receipt (Grants) - - - - - - - - - -
Total Shareholders’ Funds 86.2 110.0 140.2 170.3 202.0 235.3 270.2 306.2 342.7 379.8
Liabilities
Trade Payables - 22.7 31.4 36.6 37.9 39.4 40.9 42.4 44.0 45.7
Total Current Liabilities - 22.7 31.4 36.6 37.9 39.4 40.9 42.4 44.0 45.7
Long Term Borrowings 86.2 71.8 57.5 43.1 28.7 14.4 - - - -
Total Non-Current Liabilities 86.2 71.8 57.5 43.1 28.7 14.4 - - - -
Total Equity and Liabilities 172.4 204.5 229.0 250.0 268.6 289.0 311.0 348.6 386.7 425.4
Assets
Cash and Cash Eq. - - - 8.6 35.6 64.3 94.5 140.3 186.5 233.2
Total Inventories - - - - - - - - - -
Trade Receivables - 43.1 78.4 101.8 104.3 106.9 109.6 112.3 115.1 118.0
Total Current Assets - 43.1 78.4 110.3 139.9 171.2 204.1 252.6 301.6 351.3
Net Block 172.4 161.5 150.5 139.6 128.7 117.8 106.9 96.0 85.1 74.2
Total Non-Current Assets 172.4 161.5 150.5 139.6 128.7 117.8 106.9 96.0 85.1 74.2
Total Assets 172.4 204.5 229.0 250.0 268.6 289.0 311.0 348.6 386.7 425.4

Rajasthan Agricultural Competitiveness Project 24

© 2018 Grant Thornton India LLP. All rights reserved.
“Grant Thornton in India” means Grant Thornton India LLP, a member firm within Grant Thornton International Ltd, and those legal entities which are its related parties as defined by the Companies Act, 2013.
Grant Thornton India LLP is registered with limited liability with identity number AAA-7677 and has its registered office at L-41 Connaught Circus, New Delhi, 110001.
References to Grant Thornton are to Grant Thornton International Ltd (Grant Thornton International) or its member firms. Grant Thornton International and the member firms are not a worldwide partnership. Services are delivered independently by the member firms.
www.grantthornton.in