DETAILED PROJECT REPORT ON AUTO LOOM / RAPIER LOOM ...
40
DETAILED PROJECT REPORT ON AUTO LOOM / RAPIER LOOM (8 Nos.) (SOLAPUR TEXTILE CLUSTER) Bureau of Energy Efficiency Prepared By Reviewed By
Transcript of DETAILED PROJECT REPORT ON AUTO LOOM / RAPIER LOOM ...
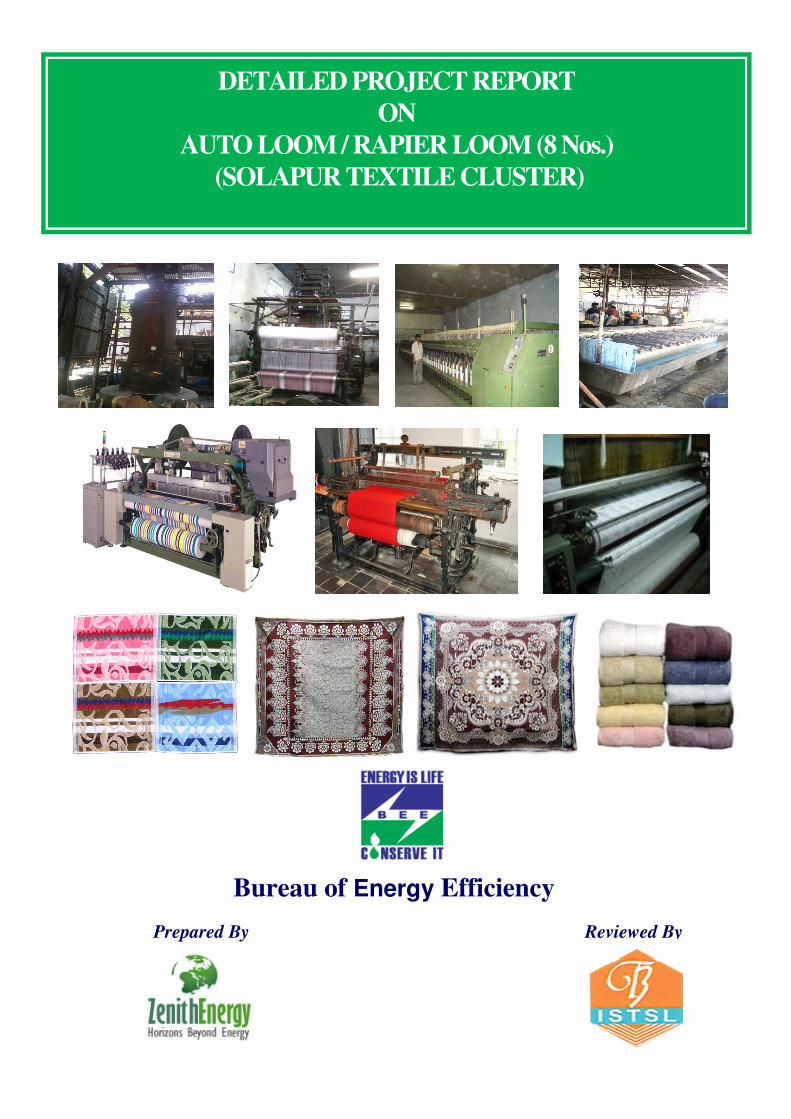
DETAILED PROJECT REPORT
ON
AUTO LOOM / RAPIER LOOM (8 Nos.)
(SOLAPUR TEXTILE CLUSTER)
Bureau of Energy Efficiency
Prepared By Reviewed By
AUTO LOOM/RAPIER LOOM (8 Nos.)
SOLAPUR TEXTILE CLUSTER
BEE, 2010
Detailed Project Report on Auto Loom/Rapier Loom (8 Nos.)
Textile SME Cluster, Solapur, Maharashtra (India)
New Delhi: Bureau of Energy Efficiency;
Detail Project Report No. SLP/TXT/AL8/13
For more information
Bureau of Energy Efficiency (BEE)
(Ministry of Power, Government of India)
4th Floor, Sewa Bhawan
R. K. Puram, New Delhi – 110066
Telephone +91-11-26179699
Fax +91-11-26178352
Websites: www.bee-india.nic.in
Email: [email protected], [email protected]
Acknowledgement
We are sincerely thankful to the Bureau of Energy Efficiency, Ministry of Power, for giving us
the opportunity to implement the ‘BEE SME project in “Solapur Textile Cluster, Solapur”. We
express our sincere gratitude to all concerned officials for their support and guidance during the
conduct of this exercise.
Dr. Ajay Mathur, Director General, BEE
Smt. Abha Shukla, Secretary, BEE
Shri Jitendra Sood, Energy Economist, BEE
Shri Pawan Kumar Tiwari, Advisor (SME), BEE
Shri Rajeev Yadav, Project Economist, BEE
Zenith Energy Services Pvt. Ltd.(ZESPL) is also thankful to “Shri Murlidhar Arkal, Chairman,
Shri Srinivas Bura, Vice President, Shri Jayanth Aken, Secretary, Textile Development
Foundation, Solapur” for their valuable inputs, co-operation, support and identification of the
units for energy use and technology audit studies and facilitating the implementation of BEE
SME program in Solapur Textile Cluster.
We take this opportunity to express our appreciation for the excellent support provided by
Textile Unit Owners, Local Service Providers, and Equipment Suppliers for their active
involvement and their valuable inputs in making the program successful and in completion of
the Detailed Project Report (DPR).
ZESPL is also thankful to all the SME owners, plant in charges and all workers of the SME
units for their support during the energy use and technology audit studies and in
implementation of the project objectives.
Zenith Energy Services Pvt. Ltd.
Hyderabad
Contents
List of Annexure vii
List of Tables vii
List of Figures viii
List of Abbreviation viii
Executive summary ix
About BEE’S SME program x
1 INTRODUCTION ........................................................................................................ 1
1.1 About the solapur textile cluster .................................................................................. 1
1.1.1 Production process ..................................................................................................... 1
1.2 Energy performance in solapur textile cluster .............................................................. 4
1.2.1 Specific energy consumption of final product .............................................................. 4
1.3 Proposed equipment to be upgrade ............................................................................ 4
1.3.1 Description of existing equipment ............................................................................... 4
1.3.2 Role in process ........................................................................................................... 5
1.4 Baseline for existing equipment ................................................................................... 5
1.4.1 Design and operating parameter ................................................................................. 5
1.4.2 Production cost per kg of final product ........................................................................ 5
1.5.1 Technological Barriers ................................................................................................ 6
1.5.2 Financial Barrier .......................................................................................................... 6
1.5.3 Skilled manpower ....................................................................................................... 6
2 PROPOSED ENERGY EFFICIENT EQUIPMENT ...................................................... 7
2.1 Detail description of technology ................................................................................... 7
2.1.1 Description of equipment ............................................................................................ 7
2.1.2 Availability of equipment ............................................................................................. 9
2.1.3 Service/equipment providers ....................................................................................... 9
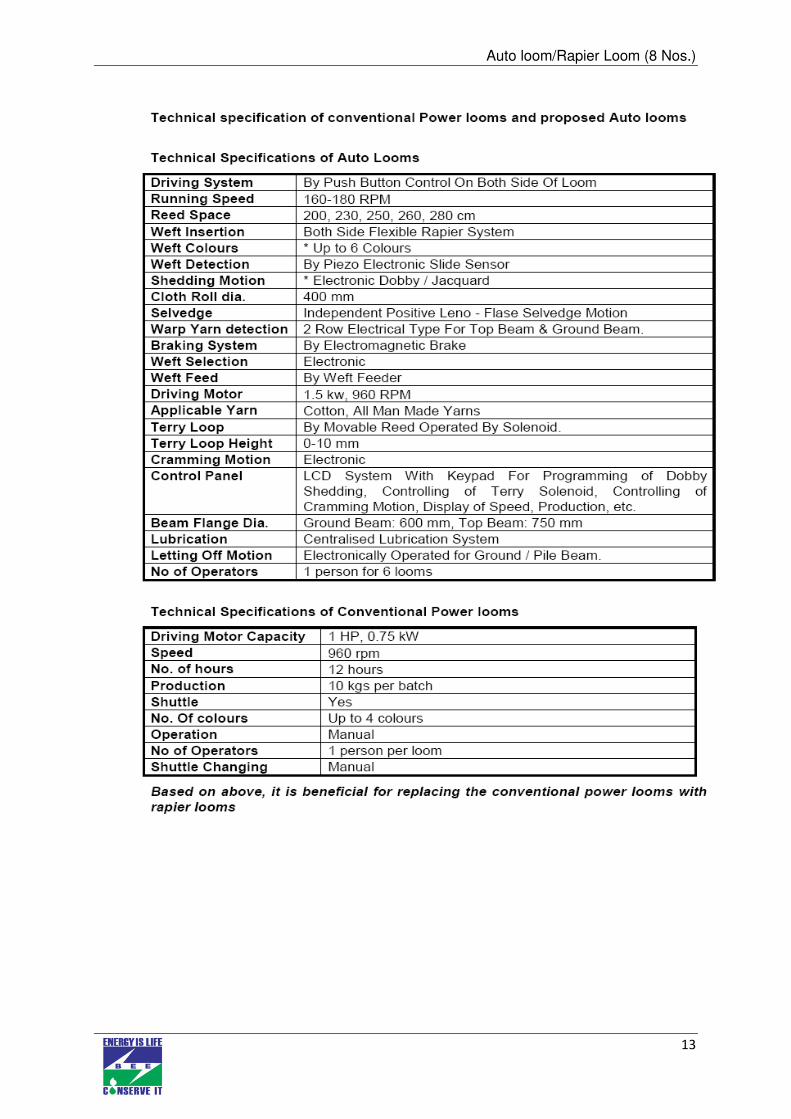
2.1.4 Technology/equipment specification ......................................................................... 10
2.1.5 Justification of technology selected and suitability .................................................... 10
2.1.6 Superiority over existing system ............................................................................... 11
2.1.7 Terms and conditions in sales & service of Rapier loom ........................................... 12
2.1.8 Process down time during Implementation ................................................................ 12
2.2 Life cycle assesment and risk analysis ...................................................................... 12
2.3 Suitable unit for implementation of proposed technology........................................... 12
3 ECONOMIC BENEFITS OF PROPOSED EUIPMENT ............................................. 13
3.1 Technical benefits ..................................................................................................... 14
3.1.1 Fuel saving ............................................................................................................... 14
3.1.2 Electricity saving ....................................................................................................... 14
3.3 Social benefits .......................................................................................................... 14
3.3.1 Improvement in working environment ....................................................................... 15
3.3.2 Improvement in skill set of workers ........................................................................... 15
3.3.3 Impact on wages/emoluments .................................................................................. 15
3.4 Envirinmental benefit ................................................................................................. 15
3.4.1 Reduction in effluent generation ............................................................................... 15
3.4.2 Reduction in GHG emission such as CO2, NOx, etc ................................................. 15
3.4.3 Reduction in other emissions like Sox ....................................................................... 15
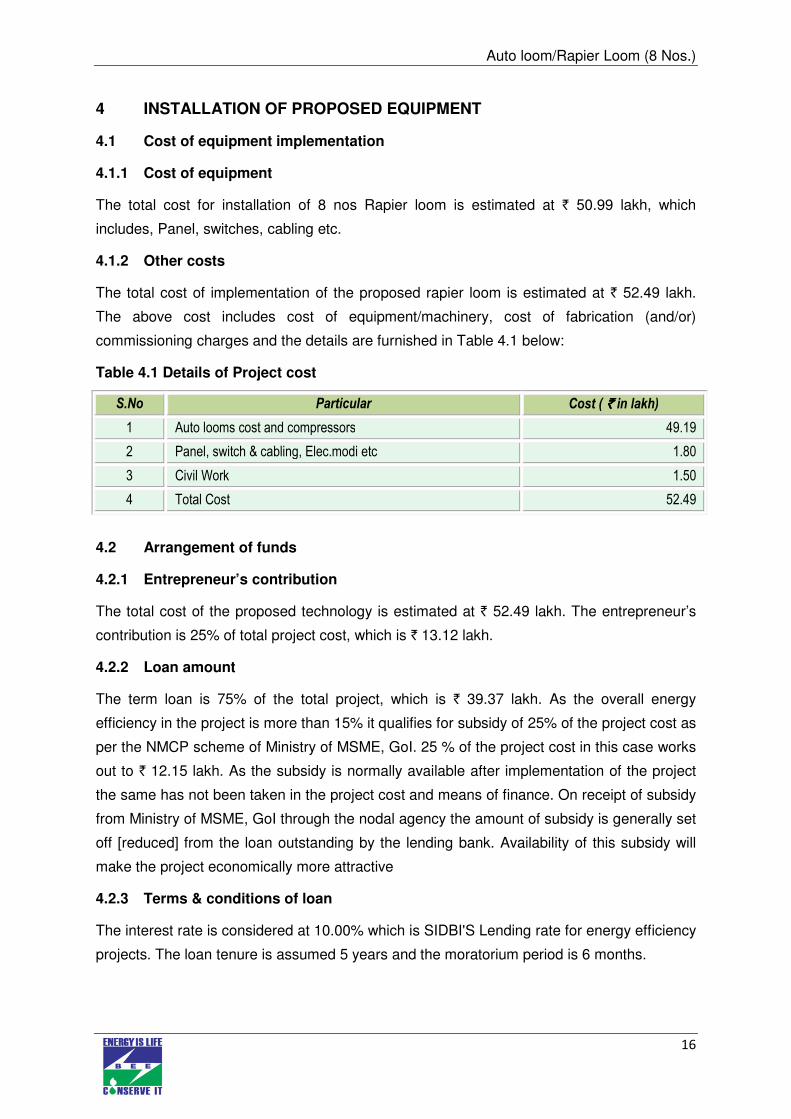
4 INSTALLATION OF PROPOSED EQUIPMENT ....................................................... 16
4.1 Cost of equipment implementation ............................................................................ 16
4.1.1 Cost of equipment ..................................................................................................... 16
4.1.2 Other costs ............................................................................................................... 16
4.2 Arrangement of funds ................................................................................................ 16
4.2.1 Entrepreneur’s contribution ....................................................................................... 16
4.2.2 Loan amount ............................................................................................................. 16
4.2.3 Terms & conditions of loan........................................................................................ 16
4.3 Financial indicators ................................................................................................... 17
4.3.1 Cash flow analysis .................................................................................................... 17
4.3.2 Simple payback period .............................................................................................. 17
4.3.3 Net Present Value (NPV) .......................................................................................... 17
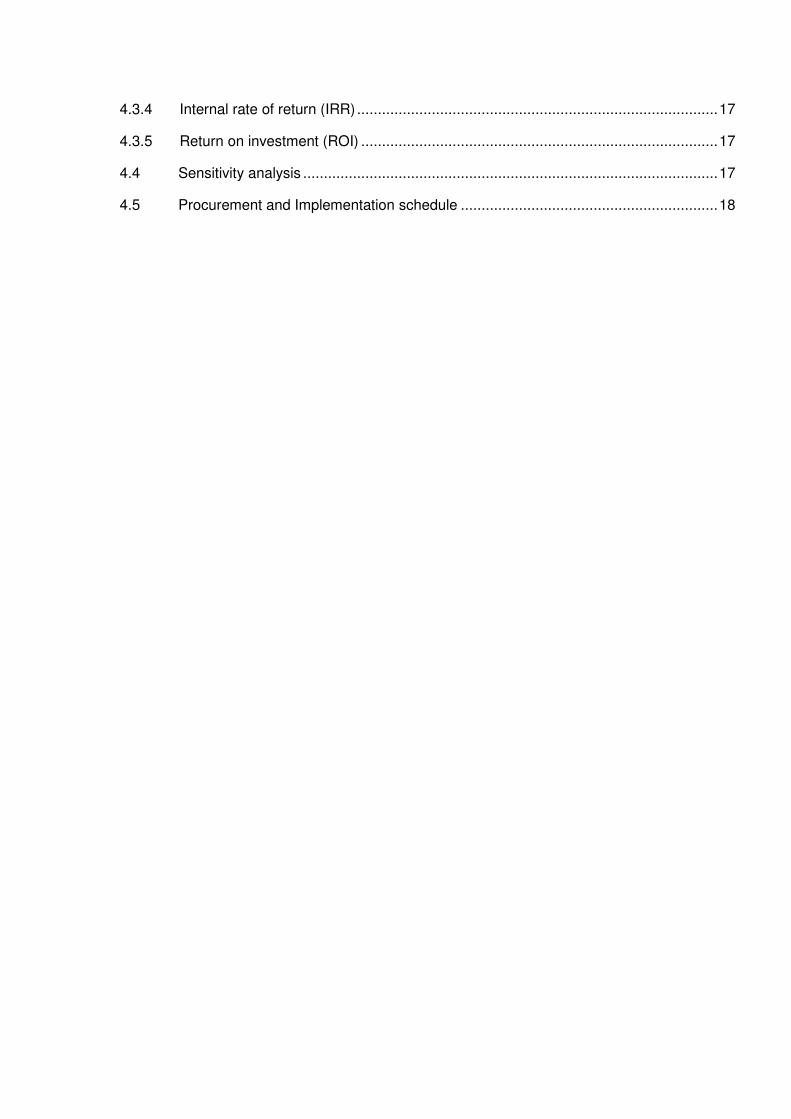
4.3.4 Internal rate of return (IRR) ....................................................................................... 17
4.3.5 Return on investment (ROI) ...................................................................................... 17
4.4 Sensitivity analysis .................................................................................................... 17
4.5 Procurement and Implementation schedule .............................................................. 18
vii
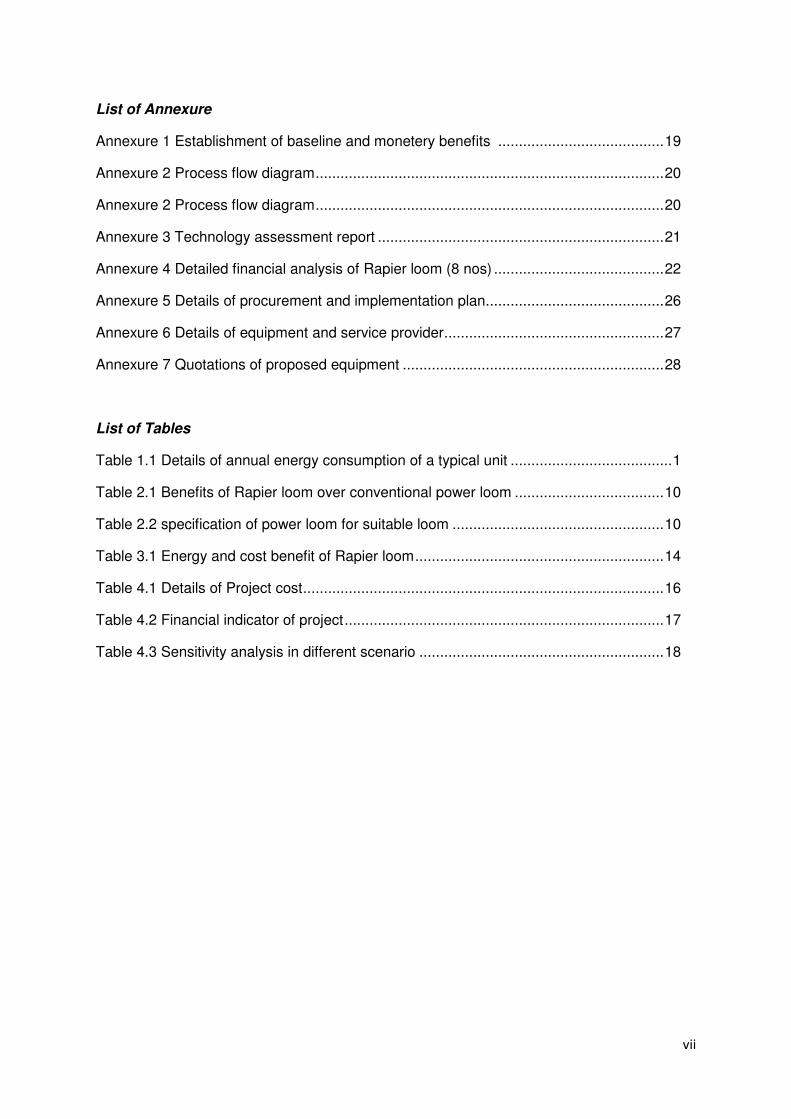
List of Annexure
Annexure 1 Establishment of baseline and monetery benefits ........................................ 19
Annexure 2 Process flow diagram .................................................................................... 20
Annexure 2 Process flow diagram .................................................................................... 20
Annexure 3 Technology assessment report ..................................................................... 21
Annexure 4 Detailed financial analysis of Rapier loom (8 nos) ......................................... 22
Annexure 5 Details of procurement and implementation plan ........................................... 26
Annexure 6 Details of equipment and service provider ..................................................... 27
Annexure 7 Quotations of proposed equipment ............................................................... 28
List of Tables
Table 1.1 Details of annual energy consumption of a typical unit ....................................... 1
Table 2.1 Benefits of Rapier loom over conventional power loom .................................... 10
Table 2.2 specification of power loom for suitable loom ................................................... 10
Table 3.1 Energy and cost benefit of Rapier loom ............................................................ 14
Table 4.1 Details of Project cost ....................................................................................... 16
Table 4.2 Financial indicator of project ............................................................................. 17
Table 4.3 Sensitivity analysis in different scenario ........................................................... 18
viii
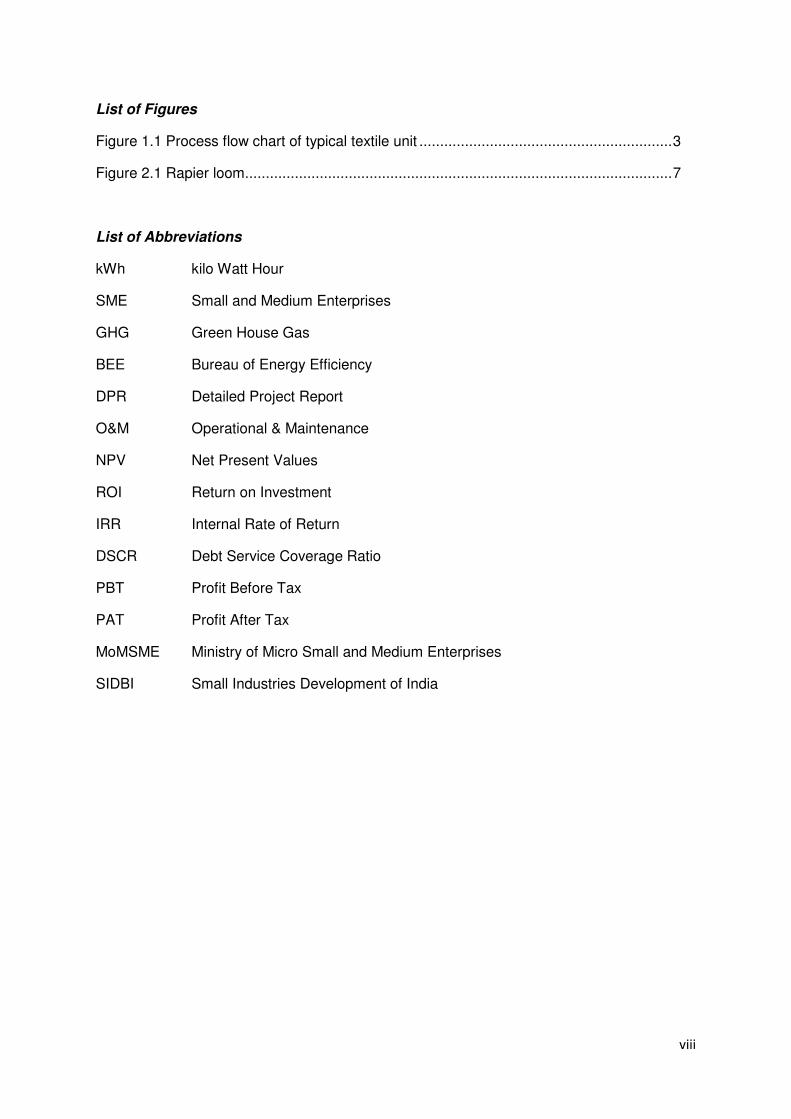
List of Figures
Figure 1.1 Process flow chart of typical textile unit ............................................................. 3
Figure 2.1 Rapier loom ....................................................................................................... 7
List of Abbreviations
kWh kilo Watt Hour
SME Small and Medium Enterprises
GHG Green House Gas
BEE Bureau of Energy Efficiency
DPR Detailed Project Report
O&M Operational & Maintenance
NPV Net Present Values
ROI Return on Investment
IRR Internal Rate of Return
DSCR Debt Service Coverage Ratio
PBT Profit Before Tax
PAT Profit After Tax
MoMSME Ministry of Micro Small and Medium Enterprises
SIDBI Small Industries Development of India
ix
EXECUTIVE SUMMARY
Zenith Energy Services Pvt. Ltd is executing BEE-SME program in Solapur textile cluster,
supported by Bureau of Energy Efficiency (BEE) with an overall objective of improving the
energy efficiency in cluster units.
Solapur textile cluster is one of the largest textile clusters in India; accordingly this cluster
was chosen for energy efficiency improvements by implementing energy efficient
measures/technologies, so as to facilitate maximum replication in other textile clusters in
India.
The main energy forms used in the cluster units are electricity and fuel such as wood and
other biomass product. Electricity is mostly used in power looms, winding machines,
doubling machines, warping machines, hang dyeing machine, blowers, hydro extractor,
small pumps and lighting.
Retrofitting of power looms with rapier/auto looms will reduces the power consumption &
production cost and also increases the rate of production.
Project implementation i.e. installation of eight rapier/auto loom in place of thirty two power
loom will lead to reduction in electricity consumption by 38400 kWh per annum however; this
intervention will not have any effect on the existing consumption pattern of fuel.
This bankable DPR also found eligible for subsidy scheme of MoMSME for “Technology and
Quality Upgradation Support to Micro, Small and Medium Enterprises” under “National
Manufacturing and Competitiveness Programme”. The key indicators of the DPR including the
Project cost, debt equity ratio, monetary benefit and other necessary parameters are given in
table:
S.No Particular Unit Value
1 Project cost `(in lakh) 52.49
2 Electricity saving kWh / year 38400
3 Monetary benefit (Due to increase in productivity, electrical saving, improvement in product quality and reduction in man power cost)
`(in lakh) 25.66
4 Debit equity ratio ratio 3:1
5 Simple payback period years 2.04
6 NPV `(in lakh) 41.15
7 IRR %age 31.48
8 ROI %age 25.97
9 DSCR ratio 2.05
10 Process down time day 10
The projected profitability and cash flow statements indicate that the project
implementation will be financially viable and technically feasible
x
ABOUT BEE’S SME PROGRAM
Bureau of Energy Efficiency (BEE) is implementing a BEE-SME Programme to improve the
energy performance in 25 selected SMEs clusters. Solapur Textile Cluster is one of them.
The BEE’s SME Programme intends to enhance the energy efficiency awareness by funding
/ subsidizing need based studies in SME clusters and giving energy conservation
recommendations. For addressing the specific problems of these SMEs and enhancing
energy efficiency in the clusters, BEE will be focusing on energy efficiency, energy
conservation and technology up-gradation through studies and pilot projects in these SMEs
clusters.
Major activities in the BEE -SME program are furnished below:
Energy use and technology audit
The energy use technology studies would provide information on technology status, best
operating practices, gaps in skills and knowledge on energy conservation opportunities,
energy saving potential and new energy efficient technologies, etc for each of the sub sector
in SMEs.
Capacity building of stake holders in cluster on energy efficiency
In most of the cases SME entrepreneurs are dependent on the locally available
technologies, service providers for various reasons. To address this issue BEE has also
undertaken capacity building of local service providers and entrepreneurs/ Managers of
SMEs on energy efficiency improvement in their units as well as clusters. The local service
providers will be trained in order to be able to provide the local services in setting up energy
efficiency projects in the clusters
Implementation of energy efficiency measures
To implement the technology up-gradation projects in clusters, BEE have proposed to
prepare the technology based detailed project reports (DPRs) for a minimum of five
technologies in three capacities for each technology.
Facilitation of innovative financing mechanisms for implementation of energy
efficiency projects
The objective of this activity is to facilitate the uptake of energy efficiency measures through
innovative financing mechanisms without creating market distortion
Auto loom/Rapier Loom (8 Nos.)
1
1 INTRODUCTION
1.1 About the solapur textile cluster
The products manufactured in Solapur Textile Cluster are cotton terry towels and bed
sheets. The towels and bed sheets are renowned in the country and have good market in
India. The main raw material for the units is cotton yarn, which is procured from local
spinning mills and agents. The cost of energy (electrical and thermal energy) as percentage
of manufacturing cost varies between 8 and 10%.
Majority of the cluster units are of integrated type, where the raw material yarn is processed
in-house to the final product. The energy cost is second to the raw materials cost. Majority of
the units in the cluster are dependent on local/ run of the mill technologies of low end and
with little investment initiatives and technology up-gradation.
The main energy forms used in the cluster units are grid electricity, wood, and small quantity
of coal. The electricity is used for power looms, doubling machines, winding machines, hydro
extractors, warping machines and lighting. Wood is used as fuel for boilers, thermic fluid
heaters, and chulhas for hot water generation. The details of annual energy consumption of
a typical unit having a production capacity of 1, 20,000 kg of final product of the cluster are
furnished in the Table 1.1 below:
Table 1.1 Details of annual energy consumption of a typical unit
Production process
The main operational process for production of towels and bed sheets in cluster units are:
Doubling
In the Doubling process, thin single yarn is converted to double yarn for strengthening the
yarn by using doubling machine.
Yarn dyeing
Initially, the yarn is soaked in soap water for 24 hours to remove the dirt and other foreign
materials and after soaking, the yarn is taken for bleaching. Bleaching is carried out by
S.No. Parameter Unit Value
1 Electricity consumption kWh/annum 1,97,784
2 Wood consumption tonne/annum 144
3 Production kg/annum 1,20,000
Auto loom/Rapier Loom (8 Nos.)
2
soaking the yarn in tanks mixed with bleaching agents and after completion of the process;
the yarn is washed with normal water.
The hang dyeing machine tanks are filled with required quantity of normal water and
required chemicals and dyeing agents are added. The temperature of the water is raised by
oil circulation or direct steam injection. Fire wood is used as fuel. The required colors are
added to the yarn and the dyeing process takes about 90 to 120 minutes per batch. After
dyeing, the yarn is washed with normal water, and the yarn is taken for soaping for colour
fixation in hot water for about 20 minutes in hang dyeing machines. The water is drained to
the waste drainage lines. The wet yarn is taken to hydro extractors for removing the water in
the yarn and taken for drying in the natural sunlight.
Winding
The yarn after drying is taken for winding in which the yarn is wounded to bobbins and
cones. The winded yarn is taken for further process.
Warping
In warping, the winded yarn is wound to beams according to designed pattern (customized
designs). Then the beams are taken for Weaving.
Weaving
The beams, which are wound with yarn are taken and placed in power looms where the
designed pattern is already set. In power looms, the yarn is converted to final product (Towel
or bed sheets) by weaving. The product obtained from weaving is taken for stitching and
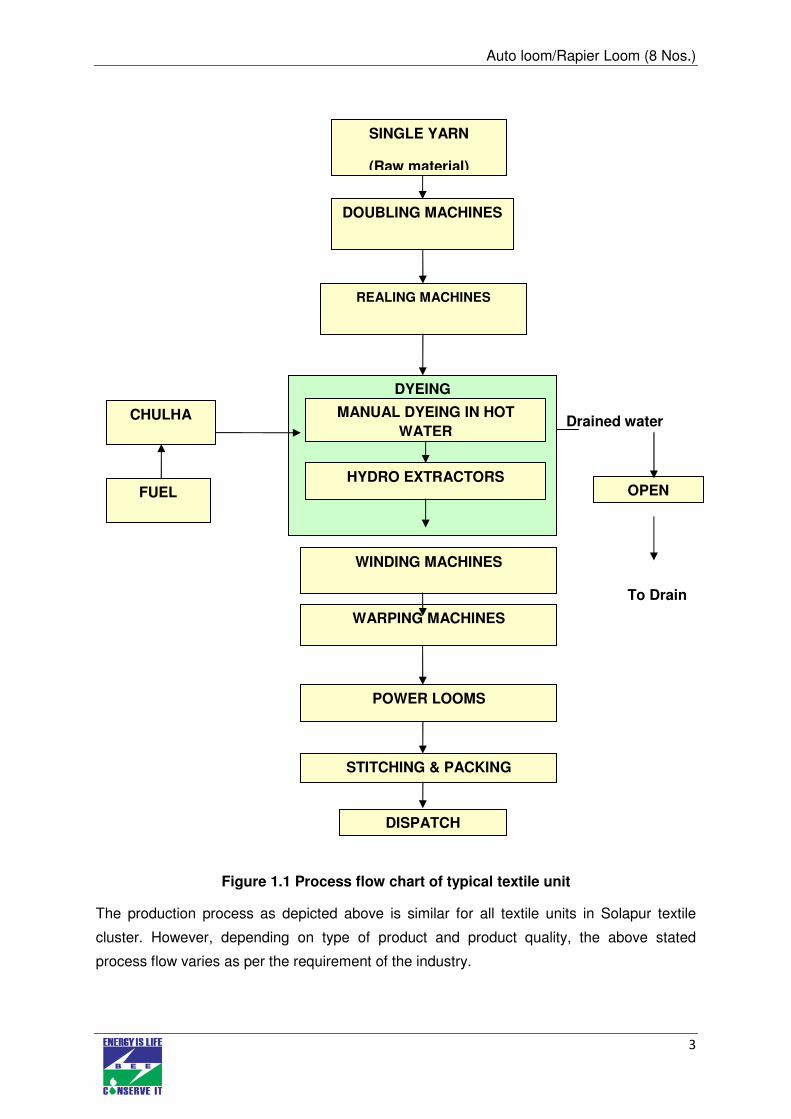
packing. The general process flow diagram of a typical unit for production of towels and bed
sheets is furnished in Figure 1.1.
Auto loom/Rapier Loom (8 Nos.)
3
OPEN
SINGLE YARN
(Raw material)
DOUBLING MACHINES
REALING MACHINES
DYEING
CHULHA
FUEL
(Wood)
WINDING MACHINES
WARPING MACHINES
POWER LOOMS
STITCHING & PACKING
DISPATCH
Drained water
To Drain
MANUAL DYEING IN HOT
WATER
HYDRO EXTRACTORS
Figure 1.1 Process flow chart of typical textile unit
The production process as depicted above is similar for all textile units in Solapur textile
cluster. However, depending on type of product and product quality, the above stated
process flow varies as per the requirement of the industry.
Auto loom/Rapier Loom (8 Nos.)
4
1.2 Energy performance in cluster
Majority of the industries located in solapur are engaged in manufacturing of towels and bed
sheets. The main energy sources for Solapur cluster units are electricity and fuels such as
Wood & briquettes. The wood and GN husk briquettes are used as fuel for boilers, thermic
fluid heaters and chulhas for hot water generation and electricity is used for operation of
prime movers of doubling machine motors, ID & FD fans, pumps, hank dyeing machine
drives, power loom drives, winding machine motors, etc. Majority of the units in the Solapur
textile cluster are using wood for thermal energy generation due to easy availability and
economical point of view.
Energy cost is around 8 to 10 percent of manufacturing cost in typical manufacturing unit,
out of which the cost of electrical energy works out to 58 percent of the total energy cost and
remaining accounts for thermal energy.
In a typical textile manufacturing unit annual consumption of electrical energy and wood is
1,97,784 kWh and 144 tonnes respectively for average production capacity of 1,20,000 kg of
final product.
1.2.1 Specific energy consumption of final product
Specific electrical and thermal energy consumption in textile unit depends upon the final
product manufactured in that unit. The electrical and thermal energy consumption of typical
textile unit is 1.65 kWh per kg of final product and 1.20 kg of wood per kg of final product
respectively (includes all colours dyeing in cold water, medium temperature water and high
temperature water)
1.3 Proposed equipment to be upgrade
1.3.1 Description of existing equipment
During energy audit studies in various textile industries in Solapur textile cluster, it was
observed that about 1200 power loom in Solapur Textile cluster. All power looms are of
shuttle type and are too old. These power looms are used for weaving terry towels and bed
sheets.
In the present conventional shuttle looms, it is necessary to pass a shuttle weighing around
half a kilogram through the warp shed to insert a length of weft yarn which weighs only few
grams. The shuttle has to be accelerated rapidly at the starting of picking cycle and also to
be decelerated, stopped abruptly at the opposite end. This process creates heavy noise and
shock and consumes considerable energy. Beat-up is done by slay motion which again
weighs a few hundred kilograms. The wear life of the picker and checking mechanism is also
limited due to heavy shock. Due to the above reasons smooth sequence of weaving is
disturbed which affects the maximum running speed and hence machine production. In multi
Auto loom/Rapier Loom (8 Nos.)
5
colour weft insertion, Drop box motion is attached which is also further limits the speed of the
machine. The small weft package in the shuttle requires frequent replenishments and for
each loom stoppage there is a possibility of one defect. The probability of weft way fabric
defects are high to the tune of 70% in shuttle looms. Even in automatic shuttle looms there is
a chance of transfer failures and weft lashing in defects.
1.3.2 Role in process
The power looms are one of the most important equipment in producing of cotton terry
towels and bed sheets. The power looms are used for weaving the dyed yarn to towels and
bed sheets.
1.4 Baseline for existing equipment
Energy consumption for Power loom would depend on following:
• Load on Power loom
• Operational & maintenance practices
1.4.1 Design and operating parameter
Present conventional loom is operated for 12 hours in a day and average electricity
consumption is 34 kWh per day (8.5 kWh per loom for four conventional looms) connected
with 1 HP motor. The average production is 48 kg per day per machine. The power loom
machines are operated in two shifts in a day.
1.4.2 Production cost per kg of final product
Production cost for various power loom machine of three typical units in the cluster are
separately furnished in Table 1.2 below:
Table 1.2 production cost by power loom machine
S.No. Name of unit
Production
Cost (Including
wages, O&M,
power cost
etc)(`̀̀̀./day)
Production
cost for 4
looms
(`/`/`/`/day)
Production
per day
(kg/loom)
Production
cost
`/kg
1
Rajashree
Industries
190 760 12.5 15.2
2 Balla Textile
Mills Pvt Ltd
182 728 11.9 15.3
3 Devsani
Textiles 187 748 14.5 12.9
Auto loom/Rapier Loom (8 Nos.)
6
1.5 Barriers for adoption of proposed equipment
The technology and innovations in SMEs are generally different from that of large firms.
Technology in the SME sector has an increasingly complex or combinative character, most
of the SMEs units in Solapur cluster are labour intensive and utilize local resources. The
SME entrepreneurs are generally not willing to invest in state-or-art technology. Major
barriers in the up-gradation of technology in the cluster are non availability of technology;
distrust on technology supplier, lack of awareness about energy efficiency among small and
medium enterprises, prevents them from adoption of energy efficient technologies.
1.5.1 Technological Barriers
The major technical barriers that prevented the implementation of Rapier loom are
• Lack of awareness and information about the rapier loom and its benefit
• Absence of local Rapier loom supplier
• Dependence on local equipment suppliers, whom doesn’t have technical knowledge
about rapier loom and its proper installation
1.5.2 Financial Barrier
Implementation of the proposed project activity requires investment of ` 49.81 lakh per unit.
Such investment is not commonly seen in the cluster units for energy efficiency
improvement. Further, from the business perspective of SMEs, it is more viable, assured,
and convenient to invest on project expansion for improving the production capacity or
quality, rather than make piecemeal investment in retrofit and replace options for energy
savings. In view of this and given the limited financial strength of the textile mills, it is evident
that the owners would not like to take the risk and invest in energy efficiency measures.
However, the financial attractiveness of the project activity may motivate the owners to move
forward in taking up initiatives in energy conservation and efficiency.
1.5.3 Skilled manpower
The non-availability of skilled manpower having awareness about energy efficiency and
related issues in the cluster is one of the major barriers. Lack of skilled manpower for
operation and maintenance of the rapier looms is also one of the major barriers that
prevented the implementation.
1.5.4 Other barrier (If any)
The recent recession in European and other Asian countries and reduction in market trend
for the products in national and international markets was also one of the major barriers for
the proposed technology.
Auto loom/Rapier Loom (8 Nos.)
7
2 PROPOSED ENERGY EFFICIENT EQUIPMENT
2.1 Detail description of technology
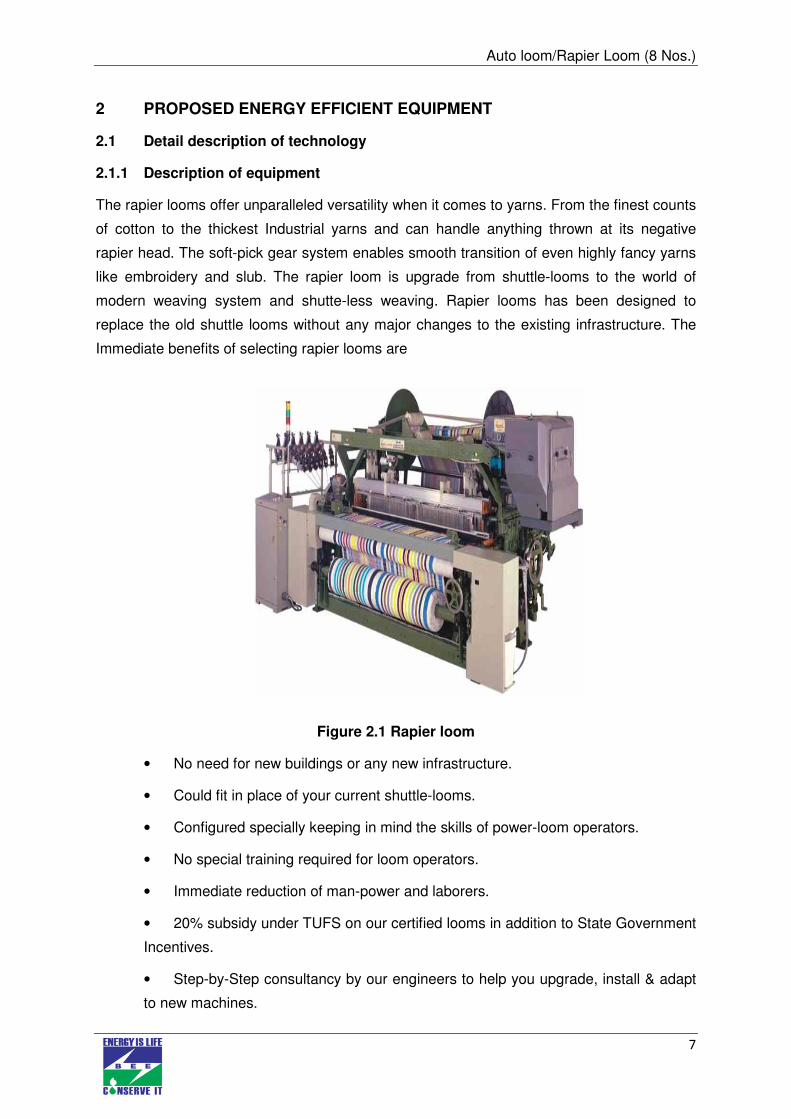
2.1.1 Description of equipment
The rapier looms offer unparalleled versatility when it comes to yarns. From the finest counts
of cotton to the thickest Industrial yarns and can handle anything thrown at its negative
rapier head. The soft-pick gear system enables smooth transition of even highly fancy yarns
like embroidery and slub. The rapier loom is upgrade from shuttle-looms to the world of
modern weaving system and shutte-less weaving. Rapier looms has been designed to
replace the old shuttle looms without any major changes to the existing infrastructure. The
Immediate benefits of selecting rapier looms are
Figure 2.1 Rapier loom
• No need for new buildings or any new infrastructure.
• Could fit in place of your current shuttle-looms.
• Configured specially keeping in mind the skills of power-loom operators.
• No special training required for loom operators.
• Immediate reduction of man-power and laborers.
• 20% subsidy under TUFS on our certified looms in addition to State Government
Incentives.
• Step-by-Step consultancy by our engineers to help you upgrade, install & adapt
to new machines.
Auto loom/Rapier Loom (8 Nos.)
8
Speed
The normal speed of the conventional power looms is around 120 RPM, where as in rapier
looms, the speeds upto 220 RPM (actual) can be attained and coupled with high efficiencies
of upto 95%, this machine gives upto 3 times more productivity than the conventional power
looms.
Color Weft Insertion
Rapier looms offers up to 8 Color Pick-at-Will weft insertions, so that weave the fanciest of
fabrics can be attained. The pick-at-will system is computerised and microprocessor
controlled, hence letting the programme sequences of more than 1, 00,000 picks. Such
technological edge will definitely give you an edge in the market.
Start-Mark Prevention System
Rapier looms realises the most delicate need of rapier users to prevent start-marks in
weaving. The custom designed ‘HT-Drive’ motor of the machine supplies more than 150%
torque for the first-pick to successfully prevent the start marks.
Lower per meter Costs
Considering 3 times more productivity with same space and even lesser amount of man
power along with lower power consumption, it is quite obvious that rapier looms can offer
lower production costs compared to conventional power-looms or even rapier-shuttle change
machines. Moreover continuous weft-insertion eliminates the need for investing in pirn-
winding machines or even extra operators.
Lower Maintenance
Due to lower vibrations, there’s less wear-n-tear of rotating components and bearings
resulting in lower maintenance costs. Also, centralised lubrication offered on the looms gives
single-point lubrication for the complete machine, thus further reducing the headaches of
maintenance
Shedding
The rapier loom has the flexibility and can easily add and attach any of the shedding motions
available in the market including:
• Dobby
• Jacquard
• Cam Shedding
• Positive Cam: for Heavy plain fabrics (bolting cloth, tirecord cloth etc.)
• Negative Cam: for light sensitive fabrics
Auto loom/Rapier Loom (8 Nos.)
9
Take-Up
Universal 7-wheel Wretchet-n-Pawl semi-positive take-up is the most widely used and well
established Take-Up system offered in rapiers around the world. The well designed take-up
is capable of handling a weft-density of 4-120 picks per Inch.
Let-Off
The capability of rapier looms to weave any and all kinds of fabrics has been created due to
3 different let-off options available with the machine depending on your fabric.
Ruti-Type
For weavers of regular cotton-fabrics who’ve been used to highly versatile Ruti-Type let-off.
Microprocessor Controller
The heart of the complete control system, this microprocessor is one of the most powerful
control systems offered today for crank-type rapier looms. The system can be programmed
to output any kinds of pick programs. The standard functions include:
• Constant monitoring of weft and warp yarn for breakages Cloth Length Counter
• Pick-programming
• Weft-Controller
Exclusive Feature
For all power loom users, investing in Rapier looms normally require them to erect a
completely new building infrastructure. But, with AWT-250EX, we’re proud to say that we are
the only rapier-loom manufacturer in the world whose machines can fit in the regular ’16-feet
sheds’, thus eliminating the need for any additional investment and hence brings down the
up-gradation costs considerably. In Solapur Textile Cluster units, majority of the units has
power looms, Considering the above facts and benefits of the rapier loom and for reducing
the overall production cost, it is suggested to replace power looms with rapier looms. The
details of production cost per kg in power looms is provided in Annexure 1
2.1.2 Availability of equipment
The Rapier loom suppliers are available in Pune, which is 200 km from Solapur city and M/s
Laxmi Shuttleless loom is also planning to appoint a dealer at Solapur.
2.1.3 Service/equipment providers
The service providers are available in Pune. Details of service providers are given in
Annexure 6.
Auto loom/Rapier Loom (8 Nos.)
10
2.1.4 Technology/equipment specification
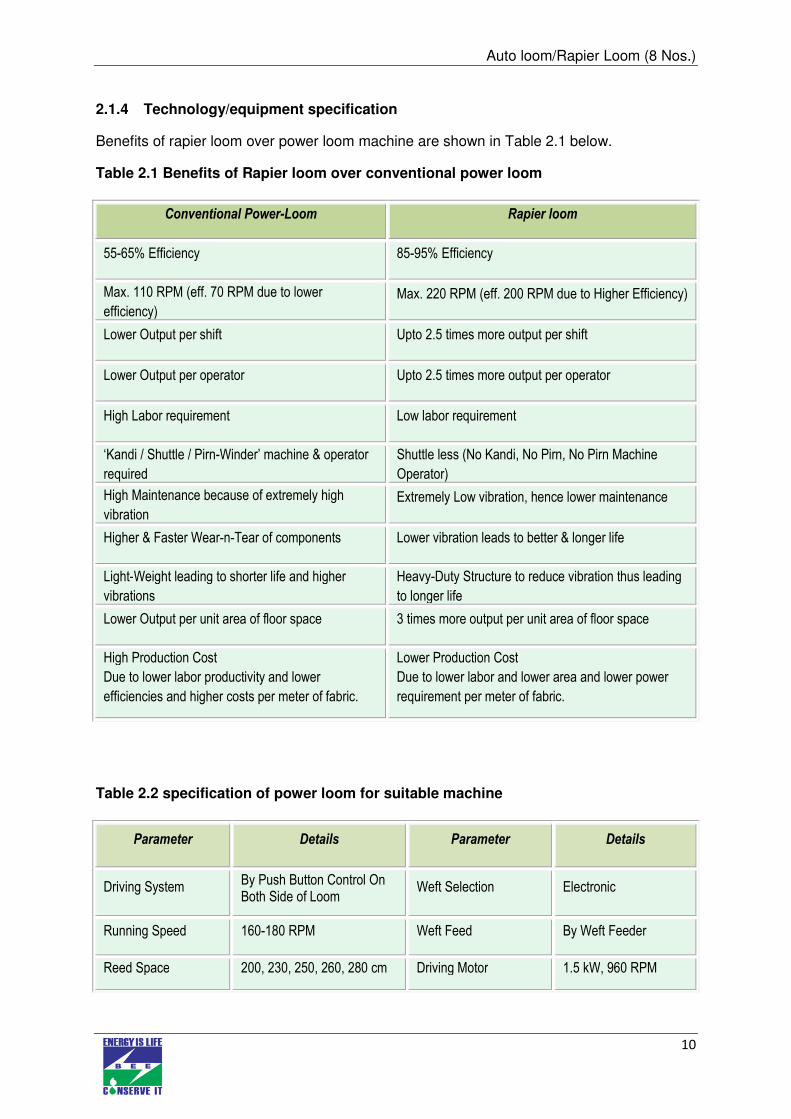
Benefits of rapier loom over power loom machine are shown in Table 2.1 below.
Table 2.1 Benefits of Rapier loom over conventional power loom
Table 2.2 specification of power loom for suitable machine
Conventional Power-Loom Rapier loom
55-65% Efficiency 85-95% Efficiency
Max. 110 RPM (eff. 70 RPM due to lower
efficiency)
Max. 220 RPM (eff. 200 RPM due to Higher Efficiency)
Lower Output per shift Upto 2.5 times more output per shift
Lower Output per operator Upto 2.5 times more output per operator
High Labor requirement Low labor requirement
‘Kandi / Shuttle / Pirn-Winder’ machine & operator
required
Shuttle less (No Kandi, No Pirn, No Pirn Machine
Operator)
High Maintenance because of extremely high
vibration
Extremely Low vibration, hence lower maintenance
Higher & Faster Wear-n-Tear of components Lower vibration leads to better & longer life
Light-Weight leading to shorter life and higher
vibrations
Heavy-Duty Structure to reduce vibration thus leading
to longer life
Lower Output per unit area of floor space 3 times more output per unit area of floor space
High Production Cost
Due to lower labor productivity and lower
efficiencies and higher costs per meter of fabric.
Lower Production Cost
Due to lower labor and lower area and lower power
requirement per meter of fabric.
Parameter Details Parameter Details
Driving System By Push Button Control On Both Side of Loom
Weft Selection Electronic
Running Speed 160-180 RPM Weft Feed By Weft Feeder
Reed Space 200, 230, 250, 260, 280 cm Driving Motor 1.5 kW, 960 RPM
Auto loom/Rapier Loom (8 Nos.)
11
2.1.5 Justification of technology selected and suitability
As discussed above, the production cost per kg of final product i.e., towels or bed sheets is
high due to low production per loom, more breakdowns, more power consumption, more
manpower cost and also the quality is poor compared with the product produced in rapier
looms.
2.1.6 Superiority over existing system
The benefits of the rapier looms over conventional power looms are furnished in Table 2.1
below:
• High productivity due to high speed and wider width of looms.
• Reduced labour cost due to higher allocation of looms and productivity.
• Defect free cloth for longer length.
• Better environment due to low noise level.
• Pirn winding process is eliminated
• Less value loss of fabrics.
• Low consumption of stores and spares.
• Less space requirement per meter of cloth.
• More colours in weft direction (upto 12) by Pick and Pick method.
• Wider width fabrics and multi width fabrics can be woven,
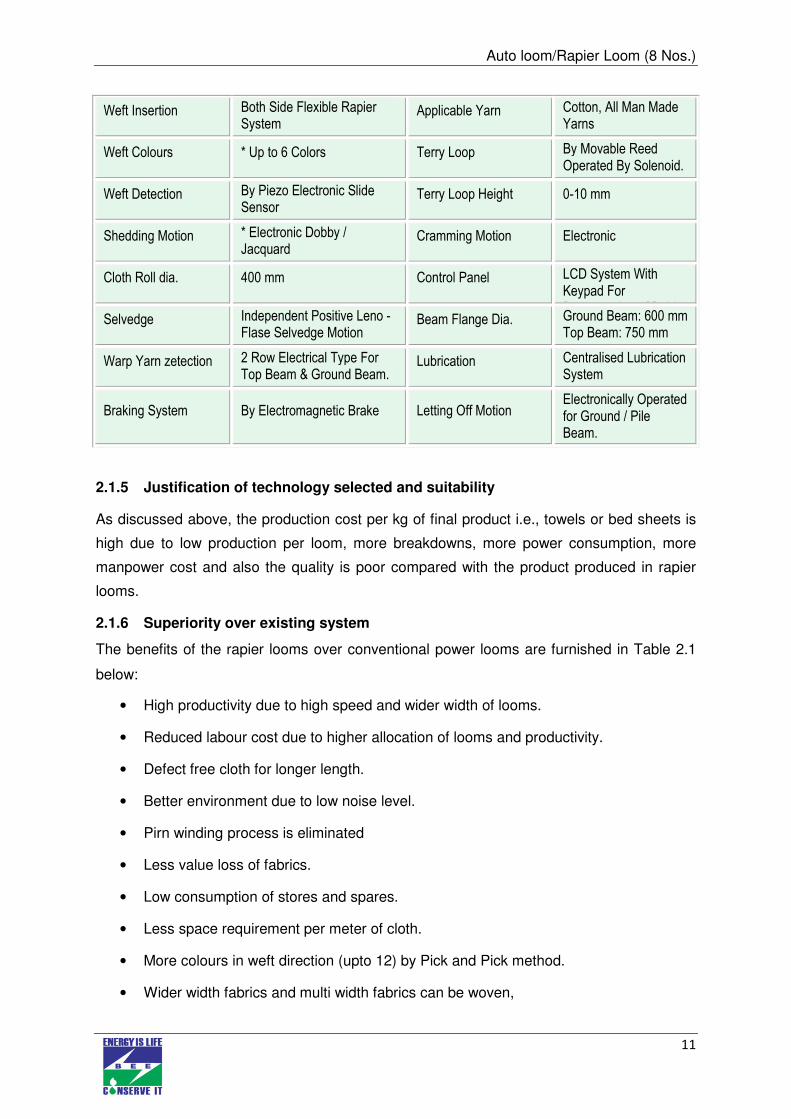
Weft Insertion Both Side Flexible Rapier System
Applicable Yarn Cotton, All Man Made Yarns
Weft Colours * Up to 6 Colors Terry Loop By Movable Reed Operated By Solenoid.
Weft Detection By Piezo Electronic Slide Sensor
Terry Loop Height 0-10 mm
Shedding Motion * Electronic Dobby / Jacquard
Cramming Motion Electronic
Cloth Roll dia. 400 mm Control Panel LCD System With Keypad For Programming of Dobby
Selvedge Independent Positive Leno - Flase Selvedge Motion
Beam Flange Dia. Ground Beam: 600 mm Top Beam: 750 mm
Warp Yarn zetection 2 Row Electrical Type For Top Beam & Ground Beam.
Lubrication Centralised Lubrication System
Braking System By Electromagnetic Brake Letting Off Motion Electronically Operated for Ground / Pile Beam.
Auto loom/Rapier Loom (8 Nos.)
12
• High degree of flexibility to suit a wide range of fibers and counts
• Easily adaptable for market trends
• Bigger flanges can accommodate 3 times more yarn
• Due to less beam changes lower down-time and lesser wastages
• Less dependency on labour skills
• Higher design capabilities due to microprocessor and electronic controls
• Easy maintenance and less work load for Jobbers
2.1.7 Terms and conditions in sales & service of Rapier loom
Terms of payment
50% advance with purchase order, and remaining 50% along with taxes and duties against
Performa invoice before dispatch.
Excise duty, sales tax & other levies
The quoted prices are exclusive of all taxes, duties, levies such as excise duty, central/local
sales tax, octroi, etc. as are applicable at the time of dispatch or imposed by any statutory
authorities subsequently or paid by us, shall be paid by you extra at actual. However CVD is
charged at 8% plus 4% on the unit price plus 3% education cess and VAT is charged at 5%.
Warranty
The supplier shall repair or replace at free of cost, on ex – works basis the whole or any
portion of material which under normal and proper use and maintenance proves defective in
material and/or workmanship within 12 months from the date of commissioning or 18 months
from the date of shipment of equipment whichever is earlier, provided prompt notice is given
of such defects.
2.1.8 Process down time during Implementation
The process down time is envisaged as installation of Rapier loom will take 10 days for
installation.
2.2 Life cycle assesment and risk analysis
Life cycle of Rapier loom is considered as 15 years.
2.3 Suitable unit for implementation of proposed technology
Four conventional power looms can be replaced with a single rapier loom. Proposed system
is suitable for replacing 32 conventional power looms.
Auto loom/Rapier Loom (8 Nos.)
13
Auto loom/Rapier Loom (8 Nos.)
14
3 ECONOMIC BENEFITS OF PROPOSED EUIPMENT
3.1 Technical benefits
3.1.1 Fuel saving
No fuel saving is possible by the implementation of the project activity.
3.1.2 Electricity saving
Total electricity saving would be about 38400 kWh (4800 kWh per loom for eight looms) per
year by the installation of proposed equipment.
3.1.3 Improvement in product quality
Proposed equipment has significant impact in improving the quality of the product.
3.1.4 Increase in production
The proposed equipment increased in production is almost 2.5 to 3 times per loom.
3.1.5 Reduction in raw material consumption
Raw material consumption is reduces due to reduction in breakages of the yarn in shuttle
power loom.
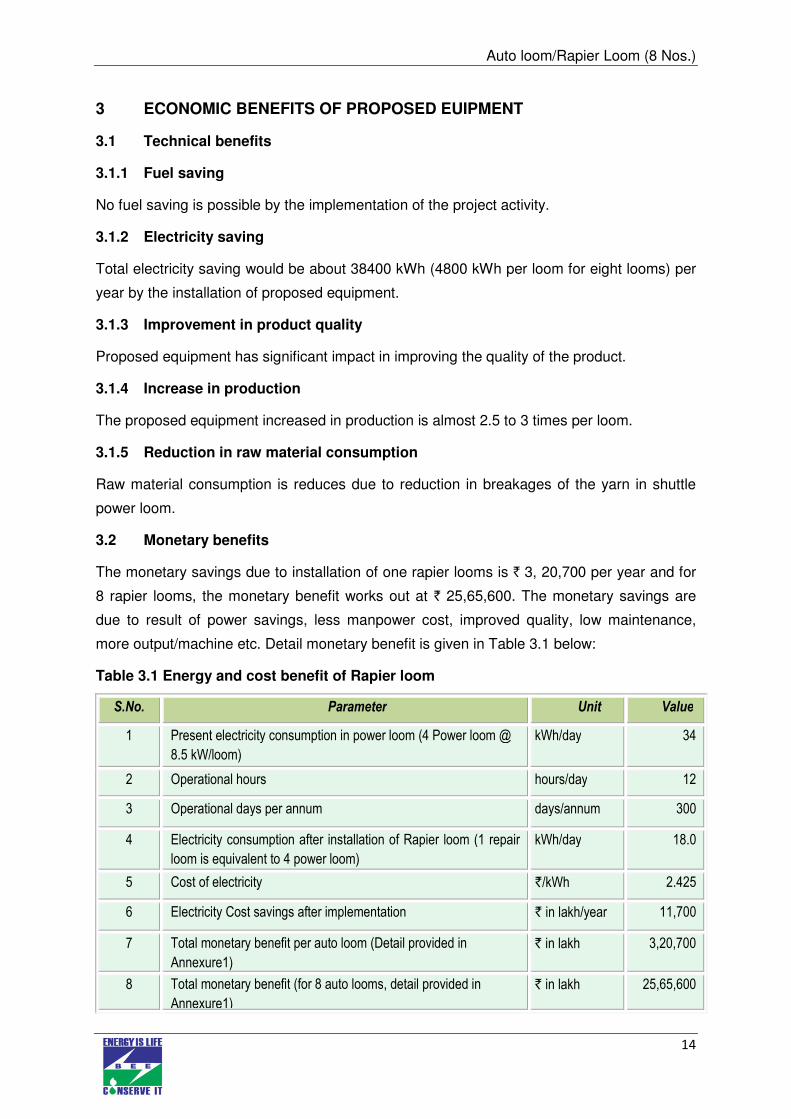
3.2 Monetary benefits
The monetary savings due to installation of one rapier looms is ` 3, 20,700 per year and for
8 rapier looms, the monetary benefit works out at ` 25,65,600. The monetary savings are
due to result of power savings, less manpower cost, improved quality, low maintenance,
more output/machine etc. Detail monetary benefit is given in Table 3.1 below:
Table 3.1 Energy and cost benefit of Rapier loom
S.No. Parameter Unit Value
1 Present electricity consumption in power loom (4 Power loom @
8.5 kW/loom)
)
kWh/day 34
2 Operational hours hours/day 12
3 Operational days per annum days/annum 300
4 Electricity consumption after installation of Rapier loom (1 repair
loom is equivalent to 4 power loom)
kWh/day 18.0
5 Cost of electricity `/kWh 2.425
6 Electricity Cost savings after implementation ` in lakh/year 11,700
7 Total monetary benefit per auto loom (Detail provided in
Annexure1)
` in lakh 3,20,700
8 Total monetary benefit (for 8 auto looms, detail provided in
Annexure1)
` in lakh 25,65,600
Auto loom/Rapier Loom (8 Nos.)
15
3.3 Social benefits
3.3.1 Improvement in working environment
As installation of Rapier loom eliminates Mechanical shock, Vibration and sound etc., this
may less the breakdowns and working environment may improved.
3.3.2 Improvement in skill set of workers
The technology selected for the implementation is new and energy efficient. The technology
implemented will create awareness among the workforce about energy saving.
3.3.3 Impact on wages/emoluments
No impact on wages or emolument of workers.
3.4 Envirinmental benefit
3.4.1 Reduction in effluent generation
The effluent generation due to implementation of the project activity is insignificant.
3.4.2 Reduction in GHG emission such as CO2, NOx, etc
The major GHG emission reduction source is CO2 and this equipment will reduce electricity
consumption. The total emission reductions are estimated as 32 tonne of CO2 per annum
due to implementation of the project activity.
3.4.3 Reduction in other emissions like Sox
No significant impact on SOx emissions.
Auto loom/Rapier Loom (8 Nos.)
16
4 INSTALLATION OF PROPOSED EQUIPMENT
4.1 Cost of equipment implementation
4.1.1 Cost of equipment
The total cost for installation of 8 nos Rapier loom is estimated at ` 50.99 lakh, which
includes, Panel, switches, cabling etc.
4.1.2 Other costs
The total cost of implementation of the proposed rapier loom is estimated at ` 52.49 lakh.
The above cost includes cost of equipment/machinery, cost of fabrication (and/or)
commissioning charges and the details are furnished in Table 4.1 below:
Table 4.1 Details of Project cost
S.No Particular Cost ( `̀̀̀ in lakh)
1 Auto looms cost and compressors 49.19
2 Panel, switch & cabling, Elec.modi etc 1.80
3 Civil Work 1.50
4 Total Cost 52.49
4.2 Arrangement of funds
4.2.1 Entrepreneur’s contribution
The total cost of the proposed technology is estimated at ` 52.49 lakh. The entrepreneur’s
contribution is 25% of total project cost, which is ` 13.12 lakh.
4.2.2 Loan amount
The term loan is 75% of the total project, which is ` 39.37 lakh. As the overall energy
efficiency in the project is more than 15% it qualifies for subsidy of 25% of the project cost as
per the NMCP scheme of Ministry of MSME, GoI. 25 % of the project cost in this case works
out to ` 12.15 lakh. As the subsidy is normally available after implementation of the project
the same has not been taken in the project cost and means of finance. On receipt of subsidy
from Ministry of MSME, GoI through the nodal agency the amount of subsidy is generally set
off [reduced] from the loan outstanding by the lending bank. Availability of this subsidy will
make the project economically more attractive
4.2.3 Terms & conditions of loan
The interest rate is considered at 10.00% which is SIDBI'S Lending rate for energy efficiency
projects. The loan tenure is assumed 5 years and the moratorium period is 6 months.
Auto loom/Rapier Loom (8 Nos.)
17
4.3 Financial indicators
4.3.1 Cash flow analysis
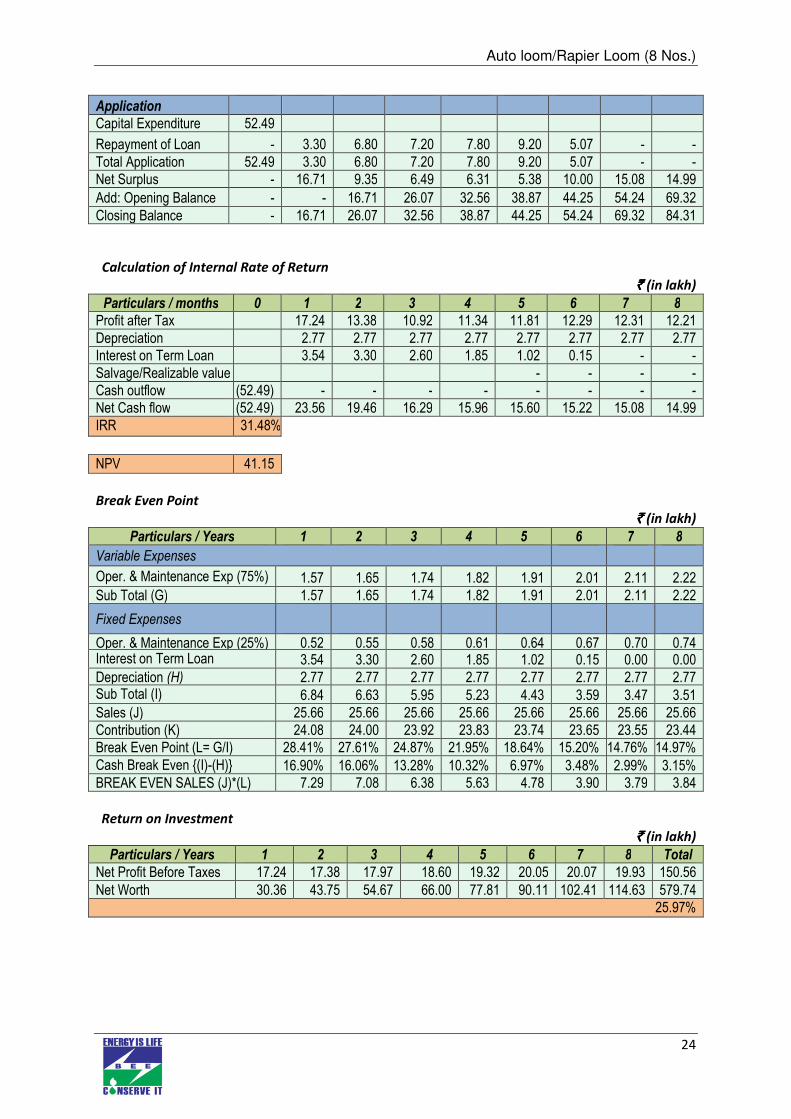
Considering the above mentioned assumptions, the net cash accruals starting with ` 16.71
lakh in the first year operation and gradually increases to ` 84.31 lakh at the end of eighth
year.
4.3.2 Simple payback period
The total project cost of the proposed equipment is ` 52.49 lakh and monetary savings due
to reduction in electricity consumption is ` 25.66 lakh and the simple payback period works
out to be 2.04 years (25 months).
4.3.3 Net Present Value (NPV)
The Net present value of the investment at 10.00% works out to be ` 41.15 lakh.
4.3.4 Internal rate of return (IRR)
The after tax Internal Rate of Return of the project works out to be 31.48% thus the project is
financially viable.
4.3.5 Return on investment (ROI)
The average return on investment of the project activity works out at 25.97% for an
investment of ` 52.49 lakh.
Table 4.2 Financial indicator of project
S. No Particulars Unit Value
1 Simple Pay Back period months 25
2 IRR %age 31.48
3 NPV lakh 41.15
4 ROI %age 25.97
5 DSCR ratio 2.05
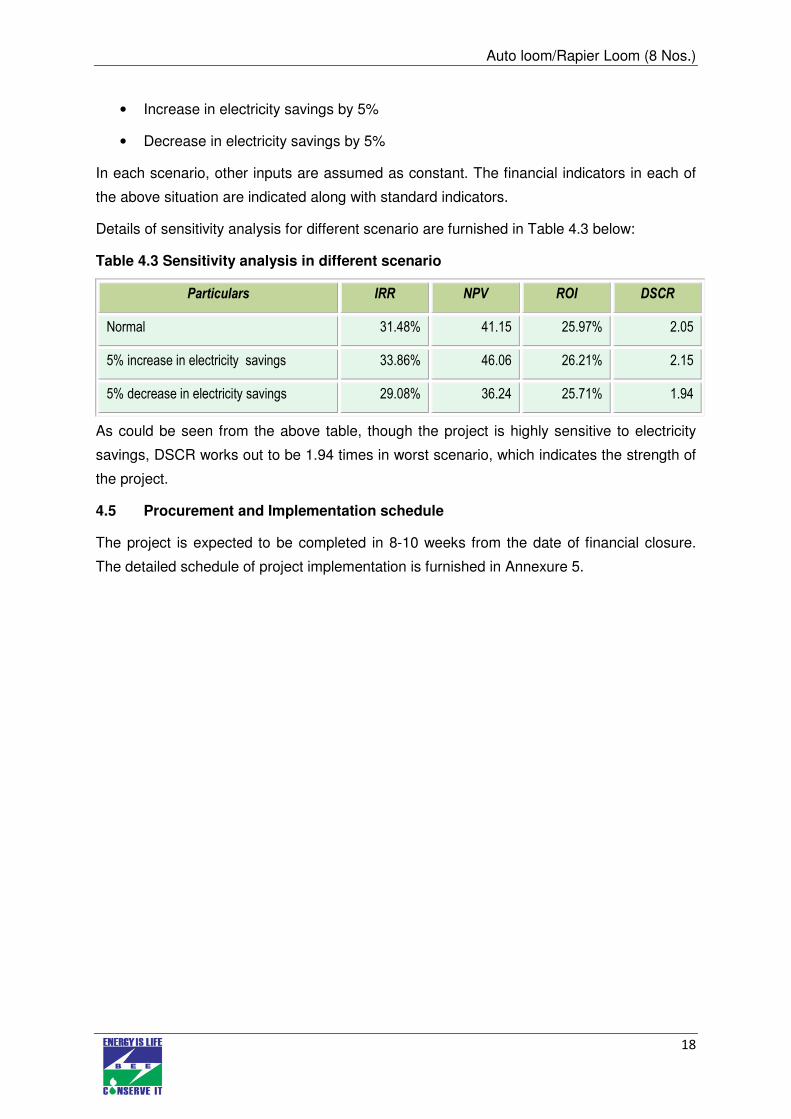
4.4 Sensitivity analysis
A sensitivity analysis has been carried out to ascertain how the project financials would
behave in different situations like there is an increase in electricity savings or decrease in
electricity savings. For the purpose of sensitive analysis, two scenarios are considered are.
Auto loom/Rapier Loom (8 Nos.)
18
• Increase in electricity savings by 5%
• Decrease in electricity savings by 5%
In each scenario, other inputs are assumed as constant. The financial indicators in each of
the above situation are indicated along with standard indicators.
Details of sensitivity analysis for different scenario are furnished in Table 4.3 below:
Table 4.3 Sensitivity analysis in different scenario
Particulars IRR NPV ROI DSCR
Normal 31.48% 41.15 25.97% 2.05
5% increase in electricity savings 33.86% 46.06 26.21% 2.15
5% decrease in electricity savings 29.08% 36.24 25.71% 1.94
As could be seen from the above table, though the project is highly sensitive to electricity
savings, DSCR works out to be 1.94 times in worst scenario, which indicates the strength of
the project.
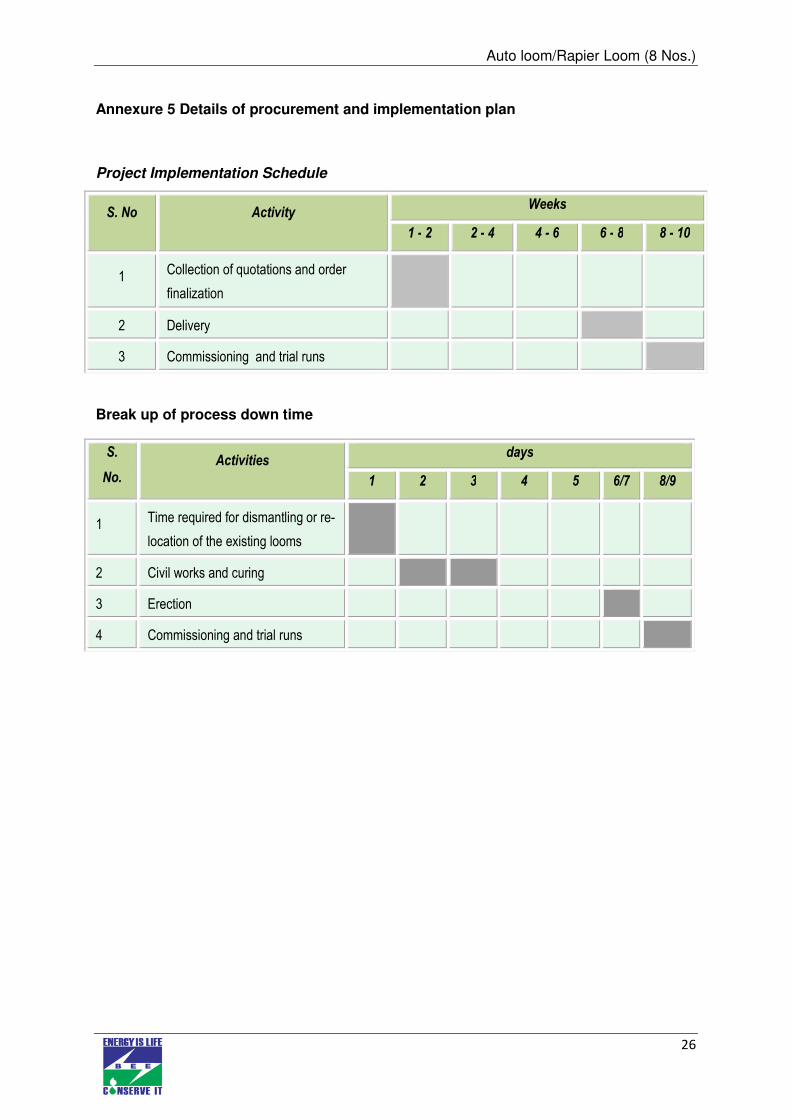
4.5 Procurement and Implementation schedule
The project is expected to be completed in 8-10 weeks from the date of financial closure.
The detailed schedule of project implementation is furnished in Annexure 5.
Auto loom/Rapier Loom (8 Nos.)
19
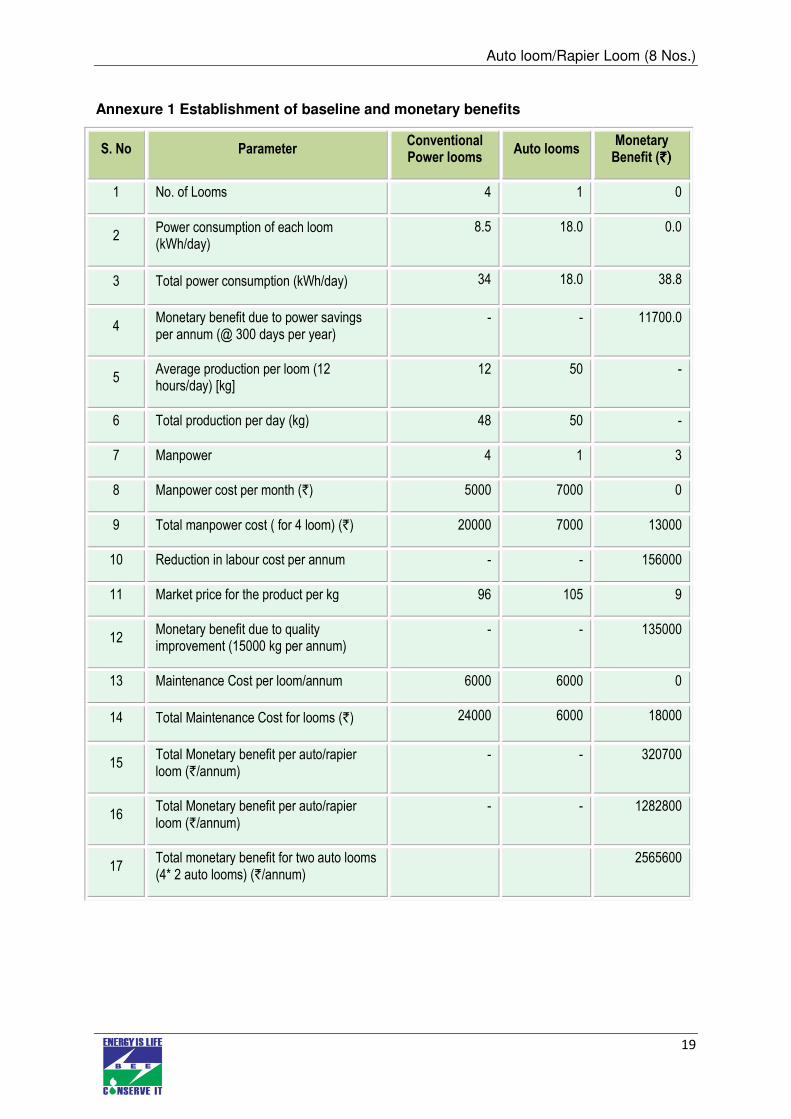
Annexure 1 Establishment of baseline and monetary benefits
S. No Parameter Conventional Power looms
Auto looms Monetary
Benefit (`)`)`)`)
1 No. of Looms 4 1 0
2 Power consumption of each loom (kWh/day)
8.5 18.0 0.0
3 Total power consumption (kWh/day) 34 18.0 38.8
4 Monetary benefit due to power savings per annum (@ 300 days per year)
- - 11700.0
5 Average production per loom (12 hours/day) [kg]
12 50 -
6 Total production per day (kg) 48 50 -
7 Manpower 4 1 3
8 Manpower cost per month (`) 5000 7000 0
9 Total manpower cost ( for 4 loom) (`) 20000 7000 13000
10 Reduction in labour cost per annum - - 156000
11 Market price for the product per kg 96 105 9
12 Monetary benefit due to quality improvement (15000 kg per annum)
- - 135000
13 Maintenance Cost per loom/annum 6000 6000 0
14 Total Maintenance Cost for looms (`) 24000 6000 18000
15 Total Monetary benefit per auto/rapier loom (`/annum)
- - 320700
16 Total Monetary benefit per auto/rapier loom (`/annum)
- - 1282800
17 Total monetary benefit for two auto looms (4* 2 auto looms) (`/annum)
2565600
Auto loom/Rapier Loom (8 Nos.)
20
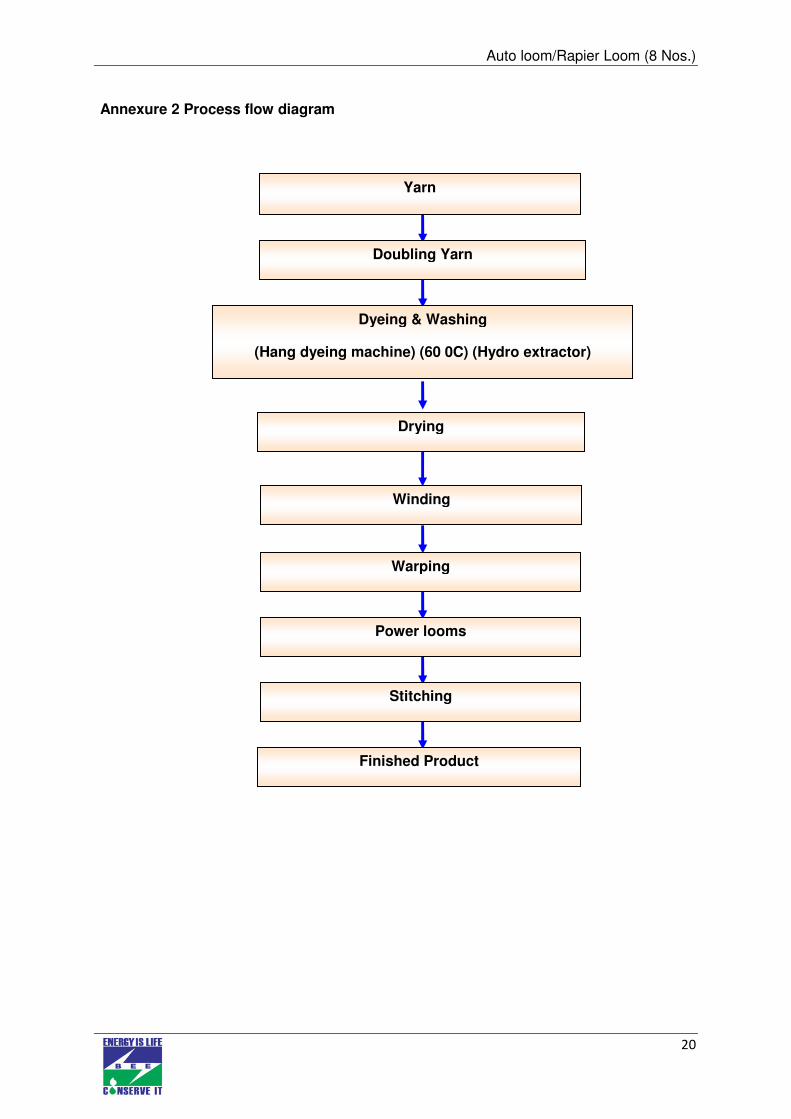
Doubling Yarn
Dyeing & Washing
(Hang dyeing machine) (60 0C) (Hydro extractor)
Drying
Winding
Warping
Power looms
Stitching
Finished Product
Yarn
Annexure 2 Process flow diagram
Auto loom/Rapier Loom (8 Nos.)
21
Annexure 3 Technology assessment report
In the conventional shuttle looms, it is necessary to pass a shuttle weighing around half a
kilogram through the warp shed to insert a length of weft yarn which weighs only few grams.
The shuttle has to be accelerated rapidly at the starting of picking cycle and also to be
decelerated, stopped abruptly at the opposite end. This process creates heavy noise and
shock and consumes considerable energy. Beat-up is done by slay motion which again
weighs a few hundred kilograms. The wear life of the picker and checking mechanism is also
limited due to heavy shock. Due to the above reasons smooth sequence of weaving is
disturbed which affects the maximum running speed and hence machine production. In multi
colour weft insertion, Drop box motion is attached which is also further limits the speed of the
machine. The small weft package in the shuttle requires frequent replenishments and for
each loom stoppage there is a possibility of one defect. The probability of weft way fabric
defects are high to the tune of 70% in shuttle looms. Even in automatic shuttle looms there is
chance of transfer failures and weft lashing in defects.
Auto loom/Rapier Loom (8 Nos.)
22
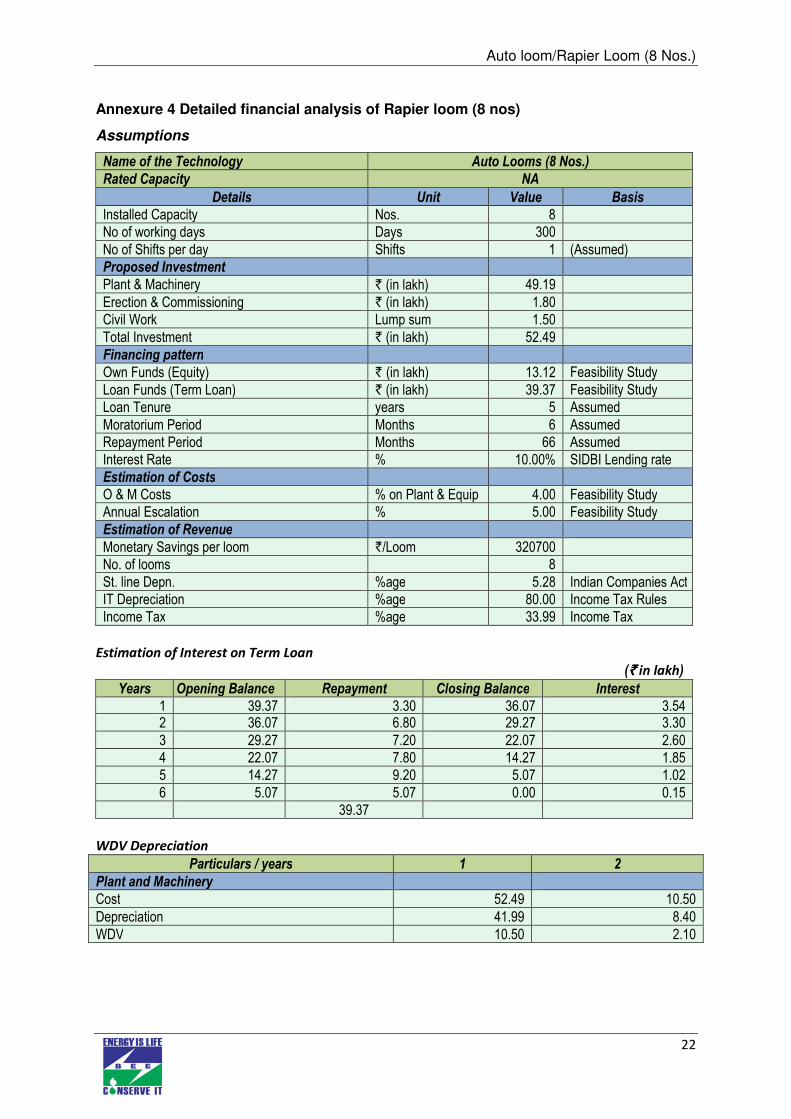
Annexure 4 Detailed financial analysis of Rapier loom (8 nos)
Assumptions
Name of the Technology Auto Looms (8 Nos.)
Rated Capacity NA
Details Unit Value Basis
Installed Capacity Nos. 8
No of working days Days 300
No of Shifts per day Shifts 1 (Assumed)
Proposed Investment
Plant & Machinery ` (in lakh) 49.19
Erection & Commissioning ` (in lakh) 1.80
Civil Work Lump sum 1.50
Total Investment ` (in lakh) 52.49
Financing pattern
Own Funds (Equity) ` (in lakh) 13.12 Feasibility Study
Loan Funds (Term Loan) ` (in lakh) 39.37 Feasibility Study
Loan Tenure years 5 Assumed
Moratorium Period Months 6 Assumed
Repayment Period Months 66 Assumed
Interest Rate % 10.00% SIDBI Lending rate
Estimation of Costs
O & M Costs % on Plant & Equip 4.00 Feasibility Study
Annual Escalation % 5.00 Feasibility Study
Estimation of Revenue
Monetary Savings per loom `/Loom 320700
No. of looms 8
St. line Depn. %age 5.28 Indian Companies Act
IT Depreciation %age 80.00 Income Tax Rules
Income Tax %age 33.99 Income Tax
Estimation of Interest on Term Loan
(`̀̀̀ in lakh)
Years Opening Balance Repayment Closing Balance Interest
1 39.37 3.30 36.07 3.54 2 36.07 6.80 29.27 3.30
3 29.27 7.20 22.07 2.60
4 22.07 7.80 14.27 1.85
5 14.27 9.20 5.07 1.02
6 5.07 5.07 0.00 0.15
39.37
WDV Depreciation
Particulars / years 1 2
Plant and Machinery
Cost 52.49 10.50
Depreciation 41.99 8.40
WDV 10.50 2.10
Auto loom/Rapier Loom (8 Nos.)
23
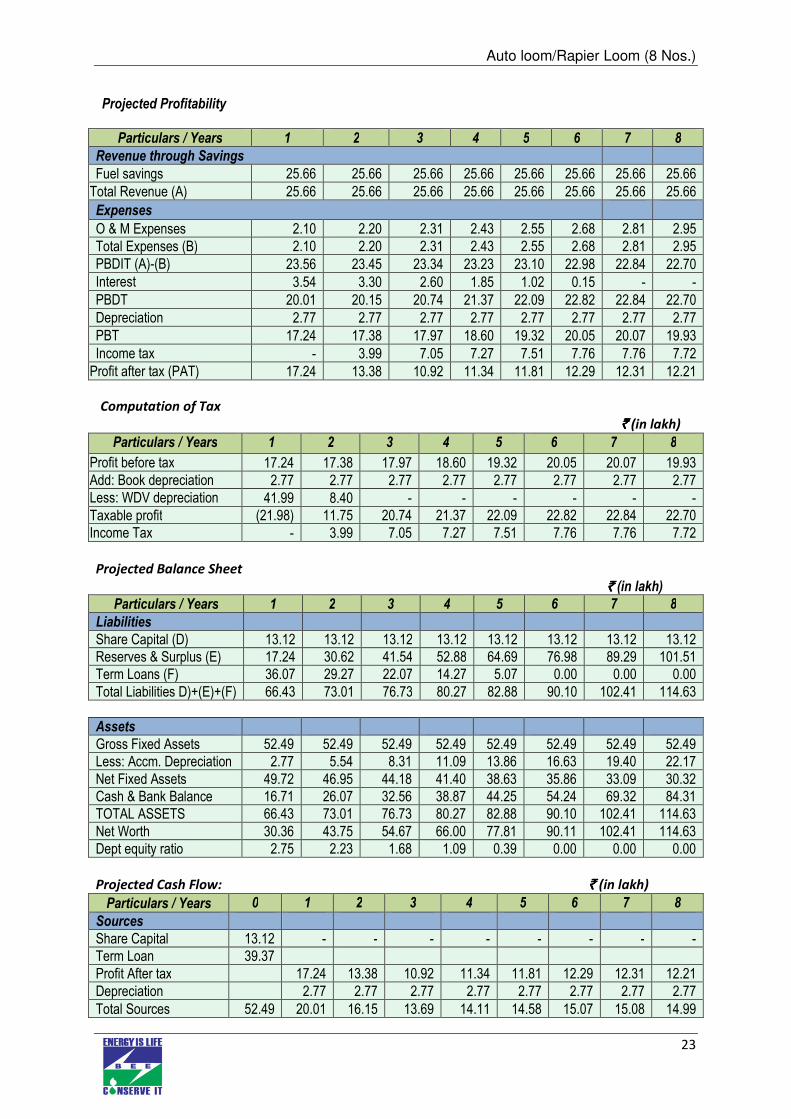
Projected Profitability
Particulars / Years 1 2 3 4 5 6 7 8
Revenue through Savings
Fuel savings 25.66 25.66 25.66 25.66 25.66 25.66 25.66 25.66
Total Revenue (A) 25.66 25.66 25.66 25.66 25.66 25.66 25.66 25.66
Expenses
O & M Expenses 2.10 2.20 2.31 2.43 2.55 2.68 2.81 2.95
Total Expenses (B) 2.10 2.20 2.31 2.43 2.55 2.68 2.81 2.95
PBDIT (A)-(B) 23.56 23.45 23.34 23.23 23.10 22.98 22.84 22.70
Interest 3.54 3.30 2.60 1.85 1.02 0.15 - -
PBDT 20.01 20.15 20.74 21.37 22.09 22.82 22.84 22.70
Depreciation 2.77 2.77 2.77 2.77 2.77 2.77 2.77 2.77
PBT 17.24 17.38 17.97 18.60 19.32 20.05 20.07 19.93
Income tax - 3.99 7.05 7.27 7.51 7.76 7.76 7.72
Profit after tax (PAT) 17.24 13.38 10.92 11.34 11.81 12.29 12.31 12.21
Computation of Tax
`̀̀̀ (in lakh)
Particulars / Years 1 2 3 4 5 6 7 8
Profit before tax 17.24 17.38 17.97 18.60 19.32 20.05 20.07 19.93
Add: Book depreciation 2.77 2.77 2.77 2.77 2.77 2.77 2.77 2.77
Less: WDV depreciation 41.99 8.40 - - - - - -
Taxable profit (21.98) 11.75 20.74 21.37 22.09 22.82 22.84 22.70
Income Tax - 3.99 7.05 7.27 7.51 7.76 7.76 7.72
Projected Balance Sheet
`̀̀̀ (in lakh)
Particulars / Years 1 2 3 4 5 6 7 8
Liabilities
Share Capital (D) 13.12 13.12 13.12 13.12 13.12 13.12 13.12 13.12
Reserves & Surplus (E) 17.24 30.62 41.54 52.88 64.69 76.98 89.29 101.51
Term Loans (F) 36.07 29.27 22.07 14.27 5.07 0.00 0.00 0.00
Total Liabilities D)+(E)+(F) 66.43 73.01 76.73 80.27 82.88 90.10 102.41 114.63
Assets
Gross Fixed Assets 52.49 52.49 52.49 52.49 52.49 52.49 52.49 52.49
Less: Accm. Depreciation 2.77 5.54 8.31 11.09 13.86 16.63 19.40 22.17
Net Fixed Assets 49.72 46.95 44.18 41.40 38.63 35.86 33.09 30.32
Cash & Bank Balance 16.71 26.07 32.56 38.87 44.25 54.24 69.32 84.31
TOTAL ASSETS 66.43 73.01 76.73 80.27 82.88 90.10 102.41 114.63
Net Worth 30.36 43.75 54.67 66.00 77.81 90.11 102.41 114.63
Dept equity ratio 2.75 2.23 1.68 1.09 0.39 0.00 0.00 0.00
Projected Cash Flow: ` ` ` ` (in lakh)
Particulars / Years 0 1 2 3 4 5 6 7 8
Sources
Share Capital 13.12 - - - - - - - -
Term Loan 39.37
Profit After tax 17.24 13.38 10.92 11.34 11.81 12.29 12.31 12.21
Depreciation 2.77 2.77 2.77 2.77 2.77 2.77 2.77 2.77
Total Sources 52.49 20.01 16.15 13.69 14.11 14.58 15.07 15.08 14.99
Auto loom/Rapier Loom (8 Nos.)
24
Application
Capital Expenditure 52.49
Repayment of Loan - 3.30 6.80 7.20 7.80 9.20 5.07 - -
Total Application 52.49 3.30 6.80 7.20 7.80 9.20 5.07 - -
Net Surplus - 16.71 9.35 6.49 6.31 5.38 10.00 15.08 14.99
Add: Opening Balance - - 16.71 26.07 32.56 38.87 44.25 54.24 69.32
Closing Balance - 16.71 26.07 32.56 38.87 44.25 54.24 69.32 84.31
Calculation of Internal Rate of Return
` ` ` ` (in lakh)
Particulars / months 0 1 2 3 4 5 6 7 8
Profit after Tax 17.24 13.38 10.92 11.34 11.81 12.29 12.31 12.21
Depreciation 2.77 2.77 2.77 2.77 2.77 2.77 2.77 2.77
Interest on Term Loan 3.54 3.30 2.60 1.85 1.02 0.15 - -
Salvage/Realizable value - - - -
Cash outflow (52.49) - - - - - - - -
Net Cash flow (52.49) 23.56 19.46 16.29 15.96 15.60 15.22 15.08 14.99
IRR 31.48%%
NPV 41.15
Break Even Point
` ` ` ` (in lakh)
Particulars / Years 1 2 3 4 5 6 7 8
Variable Expenses
Oper. & Maintenance Exp (75%) 1.57 1.65 1.74 1.82 1.91 2.01 2.11 2.22
Sub Total (G) 1.57 1.65 1.74 1.82 1.91 2.01 2.11 2.22
Fixed Expenses
Oper. & Maintenance Exp (25%) 0.52 0.55 0.58 0.61 0.64 0.67 0.70 0.74 Interest on Term Loan 3.54 3.30 2.60 1.85 1.02 0.15 0.00 0.00
Depreciation (H) 2.77 2.77 2.77 2.77 2.77 2.77 2.77 2.77 Sub Total (I) 6.84 6.63 5.95 5.23 4.43 3.59 3.47 3.51
Sales (J) 25.66 25.66 25.66 25.66 25.66 25.66 25.66 25.66
Contribution (K) 24.08 24.00 23.92 23.83 23.74 23.65 23.55 23.44
Break Even Point (L= G/I) 28.41% 27.61% 24.87% 21.95% 18.64% 15.20% 14.76% 14.97%
Cash Break Even {(I)-(H)} 16.90% 16.06% 13.28% 10.32% 6.97% 3.48% 2.99% 3.15%
BREAK EVEN SALES (J)*(L) 7.29 7.08 6.38 5.63 4.78 3.90 3.79 3.84
Return on Investment
` ` ` ` (in lakh)
Particulars / Years 1 2 3 4 5 6 7 8 Total
Net Profit Before Taxes 17.24 17.38 17.97 18.60 19.32 20.05 20.07 19.93 150.56
Net Worth 30.36 43.75 54.67 66.00 77.81 90.11 102.41 114.63 579.74
25.97%
Auto loom/Rapier Loom (8 Nos.)
25
Debt Service Coverage Ratio
`̀̀̀ (in lakh)
Particulars / Years 1 2 3 4 5 6 7 8 Total
Cash Inflow
Profit after Tax 17.24 13.38 10.92 11.34 11.81 12.29 12.31 12.21 76.98
Depreciation 2.77 2.77 2.77 2.77 2.77 2.77 2.77 2.77 16.63
Interest on Term Loan 3.54 3.30 2.60 1.85 1.02 0.15 0.00 0.00 12.47
Total (M) 23.56 19.46 16.29 15.96 15.60 15.22 15.08 14.99 106.08
Debt
Interest on Term Loan 3.54 3.30 2.60 1.85 1.02 0.15 0.00 0.00 12.47
Repayment of Term Loan 3.30 6.80 7.20 7.80 9.20 5.07 0.00 0.00 39.37
Total (N) 6.84 10.10 9.80 9.65 10.22 5.22 0.00 0.00 51.84
Average DSCR (M/N) 2.05
Auto loom/Rapier Loom (8 Nos.)
26
Annexure 5 Details of procurement and implementation plan
Project Implementation Schedule
S. No Activity Weeks
1 - 2 2 - 4 4 - 6 6 - 8 8 - 10
1 Collection of quotations and order
finalization
2 Delivery
3 Commissioning and trial runs
Break up of process down time
S.
No. Activities
days
1 2 3 4 5 6/7 8/9
1 Time required for dismantling or re-
location of the existing looms
2 Civil works and curing
3 Erection
4 Commissioning and trial runs
Auto loom/Rapier Loom (8 Nos.)
27
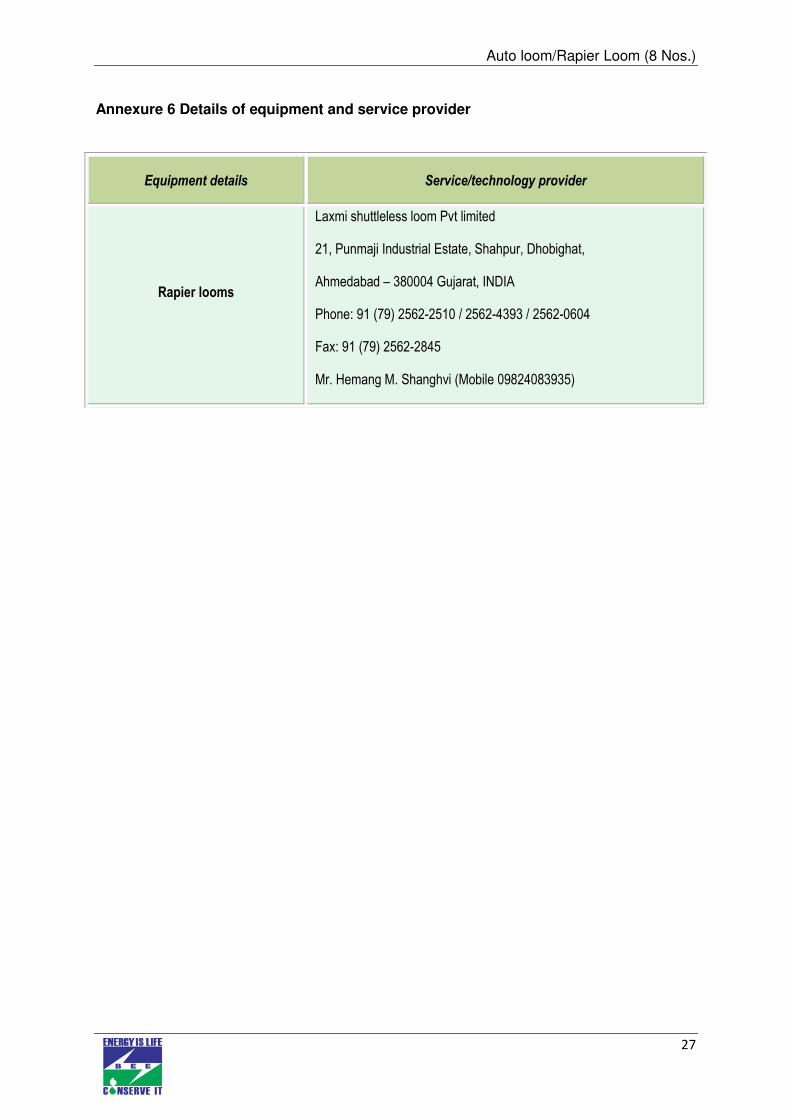
Annexure 6 Details of equipment and service provider
Equipment details Service/technology provider
Rapier looms
Laxmi shuttleless loom Pvt limited
21, Punmaji Industrial Estate, Shahpur, Dhobighat,
Ahmedabad – 380004 Gujarat, INDIA
Phone: 91 (79) 2562-2510 / 2562-4393 / 2562-0604
Fax: 91 (79) 2562-2845
Mr. Hemang M. Shanghvi (Mobile 09824083935)
Auto loom/Rapier Loom (8 Nos.)
28
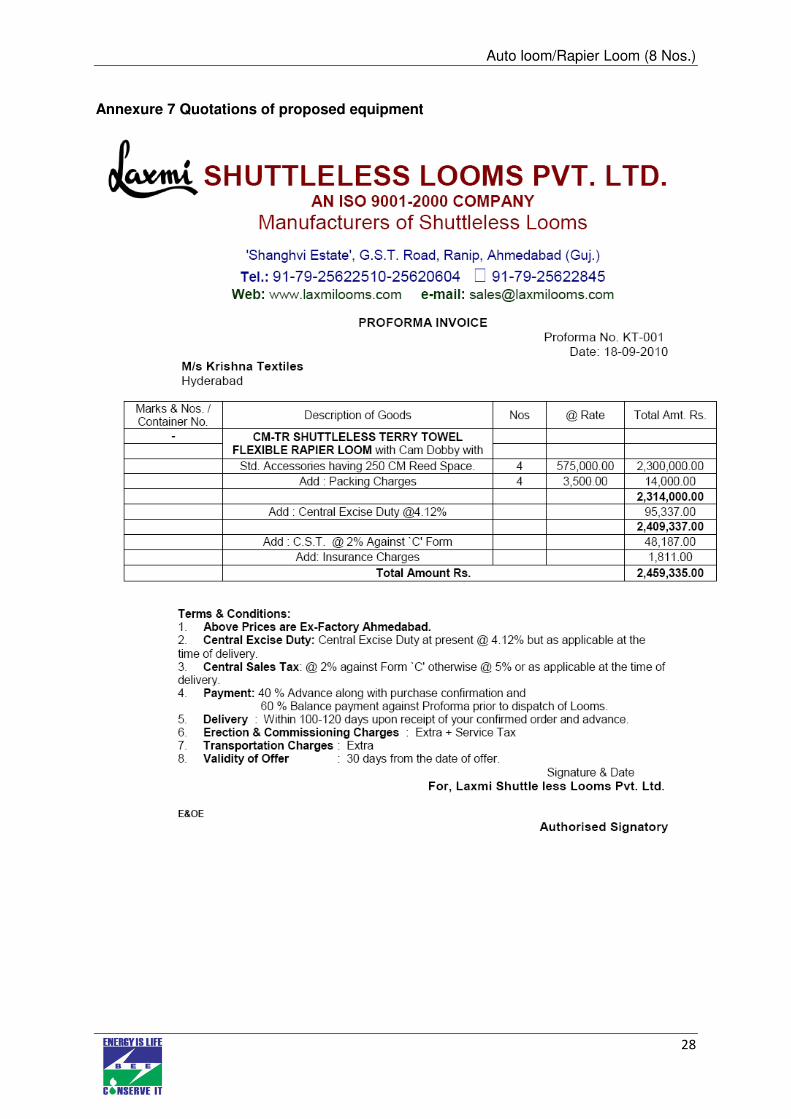
Annexure 7 Quotations of proposed equipment

Bureau of Energy Efficiency (BEE) (Ministry of Power, Government of India) 4th Floor, Sewa Bhawan, R. K. Puram, New Delhi – 110066 Ph.: +91 – 11 – 26179699 (5 Lines), Fax: +91 – 11 – 26178352
Websites: www.bee-india.nic.in, www.energymanagertraining.com
Zenith Energy Services Pvt. Ltd 10-5-6/B, My Home Plaza, Masab Tank HYDERABAD, AP 500 028 Phone: 040 23376630, 31, Fax No.040 23322517
Website: www.zenithenergy.com
India SME Technology Services Ltd DFC Building, Plot No.37-38, D-Block, Pankha Road, Institutional Area, Janakpuri, New Delhi-110058 Tel: +91-11-28525534, Fax: +91-11-28525535 Website: www.techsmall.com